Chemosphere ( IF 8.8 ) Pub Date : 2021-07-30 , DOI: 10.1016/j.chemosphere.2021.131736 Cheng Fang 1 , Yunlong Luo 1 , Xian Zhang 2 , Hongping Zhang 3 , Annette Nolan 4 , Ravi Naidu 1
|
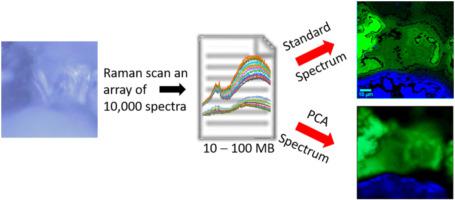
To visualise microplastics and nanoplastics via Raman imaging, we need to scan the sample surface over a pixel array to collect Raman spectra as a matrix. The challenge is how to decode this spectrum matrix to map accurate and meaningful Raman images. This study compares two decoding approaches. The first approach is used when the sample contains several known types of microplastics whose standard spectra are available. We can map the Raman intensity at selected characteristic peaks as images. In order to increase the image certainty, we employ a logic-based algorithm to merge several images that are simultaneously mapped at several characteristic peaks to one image. However, the rest of the signals other than the selected peaks are ignored, meaning a low signal-noise ratio. The second approach for decoding is used when samples are complicated and standard spectra are not available. We employ principal component analysis (PCA) to decode the spectrum matrix. By selecting principal components (PC) and generating PC score curves to mimic the Raman spectrum, we can justify and assign the suspected items to microplastics and other materials. By mapping the PC loadings as images, microplastics and other materials can be simultaneously visualised. We analyse a sample containing two known microplastics to validate the effectiveness of the PCA-based algorithm. We then apply this method to analyse “unknown” microplastics printed on paper to extract Raman spectra from the complicated background and individually assign the images to paper fabric/additive, black carbon and microplastics, etc. Overall, the PCA-based algorithm shows some advantages and suggests a further step to decode Raman spectrum matrices towards machine learning.
中文翻译:
通过 PCA 识别和可视化微塑料以解码拉曼光谱矩阵以进行成像
为了通过拉曼成像可视化微塑料和纳米塑料,我们需要在像素阵列上扫描样品表面以收集拉曼光谱作为矩阵。挑战在于如何解码此光谱矩阵以映射准确且有意义的拉曼图像。本研究比较了两种解码方法。当样品包含几种已知类型的微塑料,其标准光谱可用时,使用第一种方法。我们可以将选定特征峰的拉曼强度映射为图像。为了增加图像的确定性,我们采用基于逻辑的算法将同时映射在几个特征峰上的多幅图像合并为一幅图像。但是,除了所选峰值之外的其余信号都将被忽略,这意味着低信噪比。当样本复杂且标准光谱不可用时,使用第二种解码方法。我们采用主成分分析 (PCA) 来解码频谱矩阵。通过选择主成分 (PC) 并生成 PC 分数曲线来模拟拉曼光谱,我们可以证明可疑物品的合理性并将其分配给微塑料和其他材料。通过将 PC 负载映射为图像,可以同时可视化微塑料和其他材料。我们分析了一个包含两种已知微塑料的样本,以验证基于 PCA 的算法的有效性。然后我们应用这种方法来分析打印在纸上的“未知”微塑料,从复杂的背景中提取拉曼光谱,并将图像单独分配给纸织物/添加剂、黑碳和微塑料等。总的来说,


 京公网安备 11010802027423号