Journal of Geographical Systems ( IF 2.417 ) Pub Date : 2023-02-24 , DOI: 10.1007/s10109-023-00405-0 Jed A. Long , Jinhyung Lee , Darja Reuschke
|
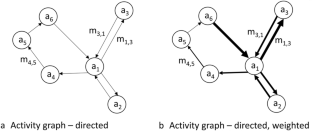
Human mobility is poorly captured by existing methods which employ simple measures to quantify human mobility patterns. This paper develops spatial graph-based methods to quantify patterns of human mobility—termed activity graphs. Activity graphs are constructed with anchors representing activity locations and edges connecting anchors representing movement between anchors. We first perform a factor analysis to identify four primary dimensions of mobility that can be derived from activity graphs: quantity, extent, connectedness, and clustering. A case study with GPS tracking data from a sample of UK-based workers is then used to demonstrate how activity graphs can be applied in practice and how new dimensions of mobility captured by activity graphs may lead to new insights about mobility behaviour. We provide several promising new areas for future work where activity graphs can be further extended to address increasingly sophisticated spatial questions around individual mobility. Our analysis fits within the time-geographic framework presented by Hägerstrand, and our results highlight opportunities for continued research motivated by issues emphasized by Hägerstrand in his seminal work.
中文翻译:
活动图:空间图作为量化个人流动性的框架
现有的方法很难捕捉到人类的流动性,这些方法采用简单的措施来量化人类的流动模式。本文开发了基于空间图的方法来量化人类流动的模式——称为活动图. 活动图由表示活动位置的锚点和连接表示锚点之间移动的锚点的边构成。我们首先执行因子分析,以确定可从活动图中得出的流动性的四个主要维度:数量、范围、连通性和聚类。然后使用来自英国工人样本的 GPS 跟踪数据的案例研究来演示如何在实践中应用活动图,以及活动图捕获的移动性的新维度如何可能导致对移动行为的新见解。我们为未来的工作提供了几个有前途的新领域,在这些领域中,活动图可以进一步扩展,以解决围绕个人移动性的日益复杂的空间问题。我们的分析符合 Hägerstrand 提出的时间-地理框架,


 京公网安备 11010802027423号