Paddy and Water Environment ( IF 2.2 ) Pub Date : 2023-03-07 , DOI: 10.1007/s10333-023-00928-8 Dnyaneshwar Arjun Madane , Mahesh Chand Singh , Sanjay Satpute
|
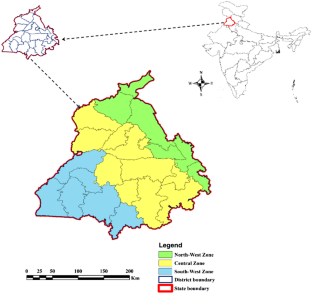
The increasing area under paddy crop, excessive groundwater pumping, over-use of agrochemicals (fertilizers and pesticides) and increasing area under paddy residue burning have become the key contributors of increased carbon emission (CE) and carbon footprint (CF) in Punjab state. After agrochemicals (71.7% CE), residue burning (16.4% CE) was recorded to be the largest contributor of CE in the state, followed by irrigation (6.9% CE). Among the three major zones, CE was recorded to be 13.4%, 58.5% and 28.1% in the North-West, Central and South-West zone, respectively, with being highest and lowest in Central and North-West zone, respectively. The average annual CF (t CO2 eq/t) was recorded to be 1.11 ± 0.23, 0.94 ± 0.05 and 0.99 ± 0.06 t CO2 eq/t for North-West, Central and South-West zones, respectively, with a total value of 3.04 ± 0.34 t CO2 eq/t at state level. On average, CF of the state indicated an increasing trend from 0.96 t CO2 eq/t in 2017–2018 to 1.09 t CO2 eq/t in 2019–2020. The higher CF values indicated higher GHGS emission in relation to groundwater pumping, fertilizer and pesticide applications, mechanical operations and post-harvest residue burning. Although rice production is very much needed for food security of the region, however, the quantitative and qualitative depletions of available resources (water, soil fertility, air quality, etc.) have started imposing negative impacts on agricultural production and environment. Thus, there is a need to take immediate remedial measures and reduce the over-exploitation of groundwater, over-use of fertilizers and pesticides, and burning of post-harvest paddy residue in the state.
中文翻译:
印度旁遮普邦碳足迹状况与水稻种植收获前后不同活动的关系
水稻种植面积的增加、地下水过度抽取、农用化学品(化肥和农药)的过度使用以及水稻残渣焚烧面积的增加已成为旁遮普邦碳排放(CE)和碳足迹(CF)增加的主要原因。在农用化学品 (71.7% CE) 之后,残留物燃烧 (16.4% CE) 被记录为该州 CE 的最大贡献者,其次是灌溉 (6.9% CE)。三大区域中,西北、中部和西南区域的CE分别为13.4%、58.5%和28.1%,其中中部和西北区域最高和最低。年平均 CF(t CO 2当量/吨)记录为 1.11 ± 0.23、0.94 ± 0.05 和 0.99 ± 0.06 t CO 2西北、中部和西南地区的当量/吨,州一级的总值为 3.04 ± 0.34 吨 CO 2 当量/吨。平均而言,该州的 CF 呈上升趋势,从 2017-2018 年的 0.96 吨 CO 2当量/吨增加到 2019-2020 年的 1.09 吨 CO 2当量/吨。较高的 CF 值表明较高的 GHG S与地下水抽取、化肥和杀虫剂施用、机械操作和收获后残渣燃烧有关的排放。尽管该地区的粮食安全非常需要水稻生产,但可用资源(水、土壤肥力、空气质量等)在数量和质量上的枯竭已开始对农业生产和环境产生负面影响。因此,需要立即采取补救措施,减少该州过度开采地下水、过度使用化肥和农药以及焚烧稻谷残渣的现象。


 京公网安备 11010802027423号