Izvestiya, Atmospheric and Oceanic Physics ( IF 0.7 ) Pub Date : 2023-12-08 , DOI: 10.1134/s0001433823140098 L. K. Kleshchenko , E. Ya. Rankova
|
Abstract
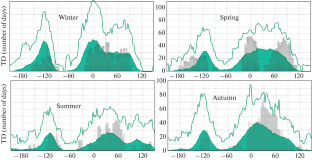
In this article, episodes of potential blocking in the Northern Hemisphere (40°–75° N) are determined based on the analysis of deviations of the H500 geopotential at the nodes of a regular geographic grid from their midlatitude values. The cumulative calendar season/year duration of blocking episodes is considered as the TD blocking index. The spatial distribution of seasonal/annual TD indices and their anomalies in 2020 are analyzed (up to 160 days). The highest values of the annual TD index in 2020 were observed on the European continent in the zone 50°–57.5° N (up to 160 days). Anomalies of the TD index in European Russia (ER) and in Western Siberia amounted to +30 days; in the northern regions of Eastern Siberia they lasted more than +40 days. In the Western Hemisphere, positive anomalies in the annual TD index were observed in the East Pacific Ocean south of 50° N (for more than +50 days). Negative anomalies covered the central regions of North America (up –80 days). According to estimates in active blocking sectors, in the first half of 2020, blocking in the European sector (10° W–60° E; 50°–65° N) was weakened relative to the multiyear average. In the summer and autumn seasons, positive anomalies of blocking indices were noted in this region. In the North American sector (100°–160° W; 50°–65° N), negative anomalies were observed in all seasons except for spring. Estimates of the linear trend of blocking indices at the nodes of the regular grid and in general in the latitudinal belt and its sectors were analyzed for 1949–2020 and 1976–2020. On average, negative trends prevailed in all seasons, but the spatial distribution of the trend coefficients varied from season to season. The trend of the annual duration of blocking episodes in the latitude zone 50°–65° N is 1.0 days/10 years and is statistically significant at a 1% level.
中文翻译:
北半球阻塞指数:2020年评估及长期变化趋势
摘要
本文通过分析规则地理网格节点上的 H500 位势与其中纬度值的偏差,确定了北半球(40°–75° N)的潜在阻塞事件。阻塞事件的累积日历季节/年份持续时间被视为TD阻塞指数。分析2020年季节/年度TD指数的空间分布及其异常情况(最多160天)。2020年年度TD指数最高值出现在欧洲大陆北纬50°–57.5°区域(长达160天)。俄罗斯欧洲部分(ER)和西西伯利亚的TD指数异常达+30天;在东西伯利亚北部地区,它们持续了超过 40 天。在西半球,北纬50°以南的东太平洋年度TD指数出现正异常(超过50天)。负异常覆盖北美中部地区(长达 –80 天)。根据对活跃阻塞区域的估计,2020年上半年,欧洲区域(10°W–60°E;50°–65°N)的阻塞相对多年平均水平有所减弱。夏秋季节,该地区阻塞指数呈正异常。在北美地区(西经100°–160°;北纬50°–65°),除春季外,所有季节均观测到负异常。对 1949-2020 年和 1976-2020 年常规网格节点以及纬度带及其扇区的阻塞指数线性趋势的估计进行了分析。平均而言,各季节均呈现负趋势,但趋势系数的空间分布随季节变化。北纬50°~65°纬度地区每年阻塞事件持续时间的趋势为1.0天/10年,并且在1%的水平上具有统计显着性。


 京公网安备 11010802027423号