Russian Agricultural Sciences Pub Date : 2023-12-26 , DOI: 10.3103/s106836742305004x N. N. Dubenok , A. V. Lebedev
|
Abstract
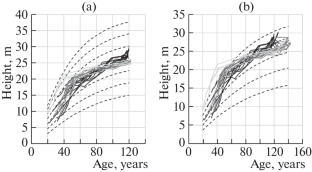
The purpose of the study is to gain insight into the dynamics of the mensuration indicators, such as average height and diameter and the stand basal areas and standing timber stock, of planted pine forest of various initial densities over a 120-year period based on long-term observations on permanent sample plots. The study targets pine plantations on permanent trial plots of the Forest Experimental Station (Moscow). The growth and yield of forest stands planted on permanent plots was compared against tables of the growth course (yield) tables) of fully stocked pine stands in European Russia and yield tables of modal pine stands of European Russia (the southern boreal ecological region as well as zones of mixed and deciduous forests and forest-steppe). The real curves of the dynamics of the stand indicators are located across the entire range of the presented tabular values. The yield tables, however, offer an oversimplified representation of change in the mensuration indicators, which have a nonsteady dynamics in the actual stands over time. The time series (of dynamics) of average heights and diameters, basal areas, and stocks on sample plots are noted to deviate significantly from the yield tables’ data on fully stocked and modal pine forest stands. An alternative to traditional tables can be prognostic models of the dynamics of mensuration indicators with a different starting state of forest stands without strict alignment with the quality (bonitet) basis.
中文翻译:
基于长期观测数据的松林测定指标动态
摘要
本研究的目的是通过长期的研究,了解不同初始密度人工松林的平均高度、直径、林分断面积、立木蓄积等测定指标在120年的动态变化。对永久样地的长期观察。该研究的目标是森林实验站(莫斯科)永久试验地的松树种植园。将永久地块上种植的林分的生长和产量与俄罗斯欧洲部分完全放养的松林生长过程(产量)表和俄罗斯欧洲部分(以及南部北方生态区)莫代尔松林的产量表进行了比较如混交林、落叶林和森林草原区)。立场指标动态的真实曲线位于所呈现的表格值的整个范围内。然而,产量表过于简单地表示了测量指标的变化,随着时间的推移,实际情况具有不稳定的动态。值得注意的是,样本地块上的平均高度和直径、断面积和蓄积量的时间序列(动态)与完全蓄积和模式松林的产量表数据存在显着偏差。传统表格的替代方案可以是具有不同林分起始状态的测量指标动态的预测模型,而不与质量(bonitet)基础严格一致。


 京公网安备 11010802027423号