Izvestiya, Atmospheric and Oceanic Physics ( IF 0.7 ) Pub Date : 2023-12-25 , DOI: 10.1134/s0001433823060129 S. S. Vlasenko , O. A. Ivanova , T. I. Ryshkevich , E. F. Mikhailov
|
Abstract
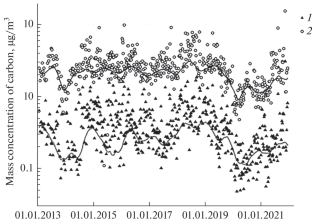
The results of a back-trajectory analysis of 9-year (2013–2021) measurements of organic (OC) and elemental (EC) aerosol carbon concentrations made at the atmospheric monitoring station near St. Petersburg (Peterhof, 59.88° N, 29.83° E) are presented. The spatial location of sources was estimated by the concentration weighted trajectory (CWT) method in the geographic area 16°–44° E × 48°–68° N. The data allow us to identify the territories with the strongest OC and EC emissions and estimate the seasonal variability of these emissions. In particular, the estimates show that the most intense sources of OC and elemental aerosol carbon in the studied region are located in the Volga-Oka interfluve and on the adjacent territories. It is demonstrated that linear regression coefficients between CWT function values for OC and EC differ for different regions and seasons and may indicate the prevailing type of sources of carbon-containing aerosol particles.
中文翻译:
根据圣彼得堡附近的当地测量估计碳质气溶胶潜在来源的空间分布
摘要
圣彼得堡附近大气监测站(彼得霍夫,北纬 59.88°,29.83°)进行的 9 年(2013-2021 年)有机 (OC) 和元素 (EC) 气溶胶碳浓度测量的回溯分析结果E)提出。源的空间位置是通过浓度加权轨迹 (CWT) 方法在 16°–44° E × 48°–68° N 地理区域中估计的。这些数据使我们能够识别 OC 和 EC 排放最强的地区,估计这些排放的季节性变化。特别是,估计表明,研究区域中 OC 和元素气溶胶碳最强烈的来源位于伏尔加河-奥卡河交界处和邻近地区。结果表明,OC 和 EC 的 CWT 函数值之间的线性回归系数在不同地区和季节有所不同,并且可以指示含碳气溶胶颗粒的主要来源类型。


 京公网安备 11010802027423号