当前位置:
X-MOL 学术
›
Earth Surf.Process. Land.
›
论文详情
Our official English website, www.x-mol.net, welcomes your feedback! (Note: you will need to create a separate account there.)
Comparison of different open-source Digital Elevation Models for landslide susceptibility mapping
Earth Surface Processes and Landforms ( IF 3.3 ) Pub Date : 2024-02-08 , DOI: 10.1002/esp.5777 Dingyang Lu 1, 2, 3 , Guoan Tang 1, 2, 3 , Ge Yan 1, 2, 3 , Fengyize Yu 1, 2, 3 , Xiaofen Lin 1, 2, 3
Earth Surface Processes and Landforms ( IF 3.3 ) Pub Date : 2024-02-08 , DOI: 10.1002/esp.5777 Dingyang Lu 1, 2, 3 , Guoan Tang 1, 2, 3 , Ge Yan 1, 2, 3 , Fengyize Yu 1, 2, 3 , Xiaofen Lin 1, 2, 3
Affiliation
|
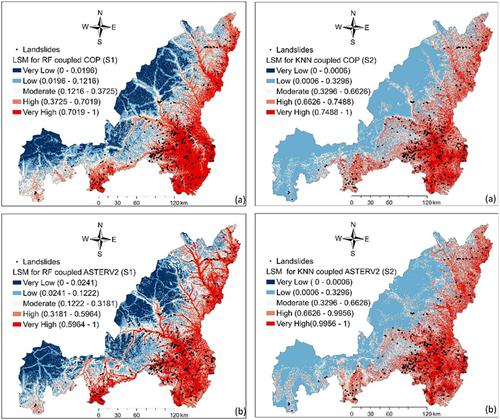
In this study, the application of open-source digital elevation model (DEM) is explored for regional landslide susceptibility mapping (LSM), and the potential impact of different DEM choices on the mapping accuracy is also examined. With the advancements in remote sensing technology, an increasing number of global open-source DEMs have been available, with improvement in the accuracy. However, the latest released data are rarely evaluated in LSM research. In this paper, DEM-based factors, including elevation, aspect, slope, plan curvature and profile curvature, were generated from seven open-source DEMs, including Advanced Spaceborne Thermal Emission and Reflection (ASTER) V2, ASTERV3, ALOS World 3D-30 m (AW3D30), Copernicus DEM 30 m (COP) Forest and Buildings removed Copernicus DEM (FABDEM), NASADEM, and Shuttle Radar Topography Mission (SRTM). DEM-based factors were coupled with the distance to road, distance to river, land use, lithology, rain and normalized difference vegetation index (NDVI). The significant difference between DEMs is determined by comparing the area proportion. Slope, plane curvature and profile curvature are found to have a maximum difference of 15%–20%. Then, K-Nearest Neighbours (KNN) and Random Forest (RF) were used to predict landslide susceptibility with two sampling methods, namely, 70% for training and 30% for testing (S1); 67% for training and 33% for testing (S2). For KNN with S1, the prediction rate is range from 0.8299 to 0.8701, with a difference of 0.0402. The difference of prediction rate is decreased to 0.0207 for S2 and 0.0258 for RF. COP has the highest prediction rate of 0.8701, 0.9254 and 0.9461 for KNN with S1 and RF with S1 and S2, respectively. ASTERV2 is the worst with prediction rate of 0.8897 and 0.8996 for KNN with S2 and RF with S1, respectively. The research result provides valuable insights for the selection of open-source DEMs in future LSM.
中文翻译:

用于滑坡敏感性测绘的不同开源数字高程模型的比较
在这项研究中,探索了开源数字高程模型(DEM)在区域滑坡敏感性测绘(LSM)中的应用,并研究了不同DEM选择对测绘精度的潜在影响。随着遥感技术的进步,全球开源DEM的数量不断增加,精度也不断提高。然而,LSM研究很少评估最新发布的数据。本文中,基于 DEM 的因子,包括高程、坡向、坡度、平面曲率和轮廓曲率,是从七个开源 DEM 生成的,包括高级星载热发射和反射 (ASTER) V2、ASTERV3、ALOS World 3D-30 m (AW3D30)、Copernicus DEM 30 m (COP) 森林和建筑物删除了 Copernicus DEM (FABDEM)、NASADEM 和航天飞机雷达地形任务 (SRTM)。基于 DEM 的因素与到道路的距离、到河流的距离、土地利用、岩性、降雨和归一化植被指数 (NDVI) 相结合。DEM 之间的显着差异通过比较面积比例来确定。发现坡度、平面曲率和轮廓曲率的最大差异为 15%–20%。然后,使用K最近邻(KNN)和随机森林(RF)以两种采样方法(即70%用于训练和30%用于测试)来预测滑坡敏感性(S1);67% 用于训练,33% 用于测试 (S2)。对于具有 S1 的 KNN,预测率范围为 0.8299 至 0.8701,差异为 0.0402。S2 的预测率差异降至 0.0207,RF 的预测率差异降至 0.0258。对于具有 S1 的 KNN 和具有 S1 和 S2 的 RF,COP 的预测率最高,分别为 0.8701、0.9254 和 0.9461。ASTERV2 是最差的,对于带有 S2 的 KNN 和带有 S1 的 RF 的预测率分别为 0.8897 和 0.8996。研究结果为未来LSM中开源DEM的选择提供了宝贵的见解。
更新日期:2024-02-08
中文翻译:
用于滑坡敏感性测绘的不同开源数字高程模型的比较
在这项研究中,探索了开源数字高程模型(DEM)在区域滑坡敏感性测绘(LSM)中的应用,并研究了不同DEM选择对测绘精度的潜在影响。随着遥感技术的进步,全球开源DEM的数量不断增加,精度也不断提高。然而,LSM研究很少评估最新发布的数据。本文中,基于 DEM 的因子,包括高程、坡向、坡度、平面曲率和轮廓曲率,是从七个开源 DEM 生成的,包括高级星载热发射和反射 (ASTER) V2、ASTERV3、ALOS World 3D-30 m (AW3D30)、Copernicus DEM 30 m (COP) 森林和建筑物删除了 Copernicus DEM (FABDEM)、NASADEM 和航天飞机雷达地形任务 (SRTM)。基于 DEM 的因素与到道路的距离、到河流的距离、土地利用、岩性、降雨和归一化植被指数 (NDVI) 相结合。DEM 之间的显着差异通过比较面积比例来确定。发现坡度、平面曲率和轮廓曲率的最大差异为 15%–20%。然后,使用K最近邻(KNN)和随机森林(RF)以两种采样方法(即70%用于训练和30%用于测试)来预测滑坡敏感性(S1);67% 用于训练,33% 用于测试 (S2)。对于具有 S1 的 KNN,预测率范围为 0.8299 至 0.8701,差异为 0.0402。S2 的预测率差异降至 0.0207,RF 的预测率差异降至 0.0258。对于具有 S1 的 KNN 和具有 S1 和 S2 的 RF,COP 的预测率最高,分别为 0.8701、0.9254 和 0.9461。ASTERV2 是最差的,对于带有 S2 的 KNN 和带有 S1 的 RF 的预测率分别为 0.8897 和 0.8996。研究结果为未来LSM中开源DEM的选择提供了宝贵的见解。


 京公网安备 11010802027423号