Theoretical and Applied Climatology ( IF 3.4 ) Pub Date : 2024-02-17 , DOI: 10.1007/s00704-024-04879-w Hossein Asakereh , Arman Jahedi , Abdollah Faraji
|
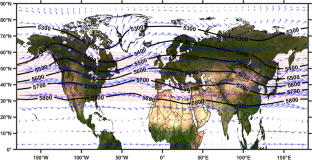
The investigation of the height variations of the westerly in the mid-latitudes of the Northern Hemisphere is crucial for monitoring changes in the intricate atmospheric system. This study examined the hypothesis of changes in the thickness of the westerly domain by analyzing the height of the 500 hPa pressure level. To this end, monthly data from the European Centre for Medium-Range Weather Forecasts (ECMWF) spanning from 1959 to 2021 was utilized to investigate three components: geopotential height (GH), zonal, and meridional wind components. The dataset underwent statistical tests, including trend analysis using Least Squares Error linear regression (LSE-LR) and shift (jump) analysis using the Standard Normal Homogeneity Test (SNHT). The results revealed a significant increasing trend in the height of the troposphere and the westerlies in the mid-latitudes of the Northern Hemisphere, accompanied by significant fluctuations, indicating an increase in the height of the 500 hPa pressure level and a decrease in the thickness of the westerly domain. The extent of these trends was observed to be greater in cold months, particularly in January and February, while the changes were minimal in November. Notably, the spatial distribution of upward jumps, indicative of change, was highest in January, July, and August in the eastern and southeastern regions of Asia. Furthermore, the convergence section of the westerlies trough exhibited a substantial number of jumps, particularly in March, spanning Central America and southern parts of North America. Regarding decadal coincidence onset, the highest number of jumps occurred in February, encompassing the western Pacific Ocean, western Atlantic Ocean, Eastern Europe, and western Asia. The end of these jumps coincided in February, and the spatial proximity of the end times was closer compared to the onset times in February, March, April, July, and August.
中文翻译:
研究每月位势高度变化和北半球中纬度西风带
北半球中纬度地区西风高度变化的研究对于监测复杂的大气系统的变化至关重要。本研究通过分析 500 hPa 气压水平的高度,检验了西风域厚度变化的假设。为此,利用欧洲中期天气预报中心 (ECMWF) 1959 年至 2021 年的月度数据来研究三个组成部分:位势高度 (GH)、纬向风和经向风组成部分。数据集经过统计测试,包括使用最小二乘误差线性回归 (LSE-LR) 的趋势分析和使用标准正态同质性检验 (SNHT) 的移位(跳跃)分析。结果表明,北半球中纬度地区对流层和西风带高度呈显着增加趋势,并伴有明显波动,表明500 hPa气压高度增加,大气层厚度减少。西风域。据观察,这些趋势的程度在寒冷月份尤其是一月和二月更大,而在十一月变化最小。值得注意的是,代表变化的向上跳跃的空间分布在亚洲东部和东南部地区的一月、七月和八月最高。此外,西风槽的辐合部分出现了大量的跳跃,特别是在三月份,横跨中美洲和北美南部地区。就年代际巧合发生而言,2月份发生的跳跃次数最多,涵盖西太平洋、西大西洋、东欧和西亚。这些跳跃的结束时间与二月一致,并且与二月、三月、四月、七月和八月的开始时间相比,结束时间的空间接近性更接近。


 京公网安备 11010802027423号