
Highlights
LexCal2014 is a new quartz material for transfer calibration of radiation sources
The absorbed dose to the quartz is based on Monte Carlo simulations
The quartz exhibits little dependency on preheat conditions and provides good DRT results
SAR, SARA and interpolation procedures provide indistinguishable results
LexCal2014 calibration results agree with LSCE irradiated coarse grain quartz and some RCQ quartz
. Introduction
The calibration of radiation sources used in dosimetric dating is usually accomplished via cross-calibration with quartz which has received a γ-irradiation (e.g. Burbidge et al., 2016; Göksu et al., 1995; Guérin and Valladas 2014; Hansen et al., 2015). The dose-rate is obtained by comparison of the luminescence response to the known γ-dose and the luminescence response to different irradiation times using the radiation source to be calibrated. This comparison can be made using a variety of measurement protocols and procedures (see references above) by thermoluminescence (TL) or optically stimulated luminescence (OSL) measurements.
Quartz for the calibration of β-sources (e.g. Richter et al., 2012) used for dosimetric purposes was developed and is presented here for the results of the extracted coarse-grained (90−160 μm) fraction, unless otherwise stated. Although in this study the quartz is explicitly used for calibration of beta sources only, it should in principle be equally suited for calibration of X-ray sources (e.g. Richter et al., 2016). The aim was to identify quartz with luminescence and dose properties suitable for source calibration purposes via transfer/cross-calibration with γ-irradiated quartz. Such material should be; available in sufficient quantity and from an accessible source; produce very repeatable and bright luminescence signals; exhibit little dependency on the measurement conditions employed during calibration procedures; provide reproducible results and it is desirable to minimize any corrections that might be required. Repeatability is tested by the ratio of the luminescence signal of repeated identical irradiations of single aliquots (recycling ratio), which should provide results close to unity but certainly much better than the generally accepted ±10% in dating application. Of main concern are the required preheating (PH) conditions prior to luminescence measurements, for which the material should exhibit little dependency on temperature, in order to reduce any effects caused by the possible temperature differences between various equipment and sample carrier. Reproducibility is shown by obtaining the same dose-rate (corrected for radioactive decay of the source) for repeated calibrations of the same β-source.
Due to its simplicity and achievable precision, the OSL single aliquot regeneration (SAR) procedure (Murray and Wintle, 2000) is the method of choice for calibration purposes with such material for which the OSL signal is reset before any irradiation. While, in principle, the SAR procedure is sufficient for the application of source calibration, additional single aliquot regeneration plus additive dose (SARA) as well as different interpolation procedures are employed to evaluate the material and procedures. For comparability, the results for these measurements are expressed in seconds of duration of the specific radiation source to be calibrated for β-irradiations as well as equivalent seconds for γ-irradiated quartz.
. Sample preparation and measurement conditions
Following the results by Hilgers (2007), several tens of kilograms of sediment from the extensive Holocene dune at Schletau, Germany (Breest et al., 2001; Tolksdorf et al., 2013; Turner et al., 2013) were obtained for extraction of quartz for calibration purposes. The dune sand from Schletau is primarily fine sand with very little fine silt (see supplement).
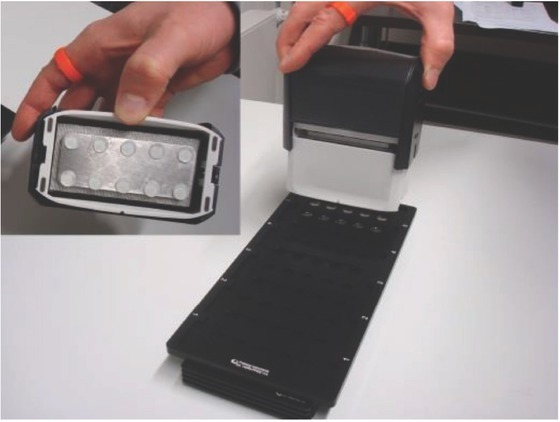
The sampled sediment from Schletau was dry sieved to a grain size of 100−300 μm. Because quartz grains might crack open and expose carbonates, the zeroing of the OSL signal by a single exposure to 500°C for 5 h in air (slow overnight cooling to room temperature) was performed before any chemical procedures. Samples were frequently washed neutral in between the following preparation steps: carbonates were removed by 30 min exposure to 30% HCl at room temperature. Organic material was subsequently destroyed at room temperature with 30% H2O2. The sample was enriched for quartz by heavy liquid mineral separation using sodium polytungstate with densities of 2.62 and 2.67 g cm-3. Etching was performed with 40% HF for 40 min, followed by a 30-min wash in 30% HCl, with both procedures at room temperature, followed by a wash in dispersant to eliminate adhering fine-grained particles. The dried material was then sieved to a grain size fraction of 90−160 μm. Finally, this material was exposed to a daylight lamp (OSRAM Ultra Vitalux 300 W with cooling) for 8 h. In order to achieve a uniform light exposure, the grains were placed in a tray on a shaker during this treatment. Aliquots of 6 mm diameter were prepared, where the sample material was held in place with polydimethyl-siloxane (ELBESIL BPH100), which was administered with a stamp simultaneously providing the silicone oil to ten aliquots (Fig. S1) prior to sprinkling of the grains onto the stainless steel cups.
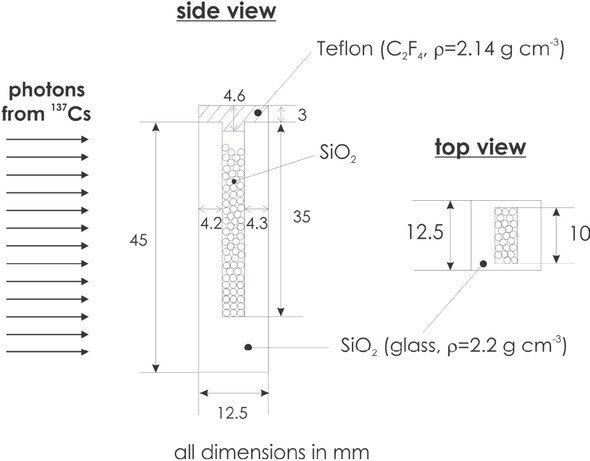
Fig. 2
Ratio of measured to given β-dose (3.7 Gy) for preheat (10 s duration) temperatures between 160 and 300 °C with a fixed test dose preheat (TPH) of 160°C for 0 s, measured with zeroed material. The means with standard deviations for three aliquots for each temperature step are given. The dotted line represents unity, the dark grey area indicates 5% and the light grey area indicates 10% deviation from unity.
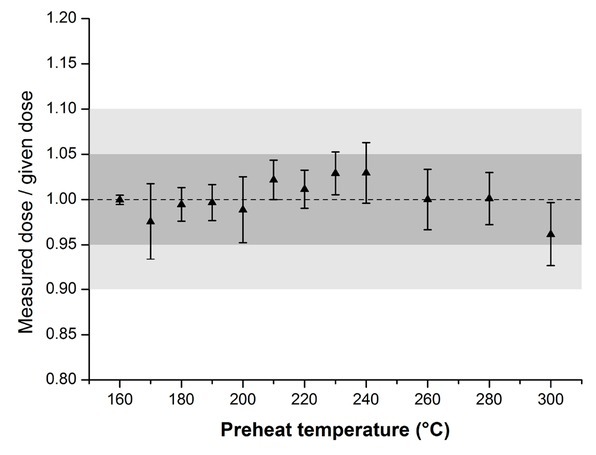
Fig. 3
Interpolation of the average equivalent β-irradiation duration obtained by SAR for the γ-irradiated coarse grain quartz (10 aliquots) on the linear fit of the measured versus given irradiation time for several β-recovery durations obtained by SAR (four aliquots each).
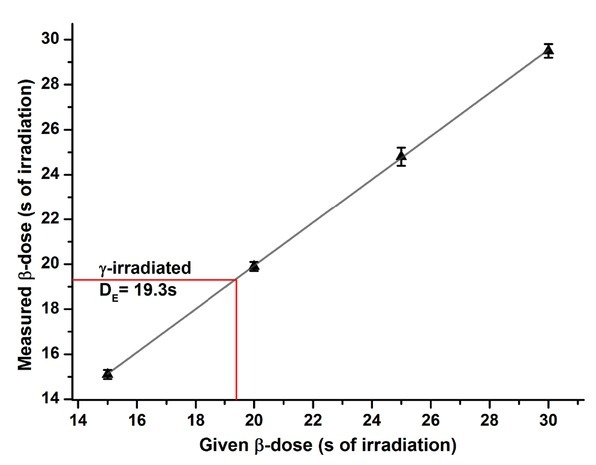
Fig. 4
SARA regression analysis of SAR β-duration results (in seconds of irradiation by the β-source to be calibrated) of γ-irradiated coarse grain quartz which has received additional exposures of 0, 5, 10, 20 and 30 s from β-irradiation (seven aliquots per point).
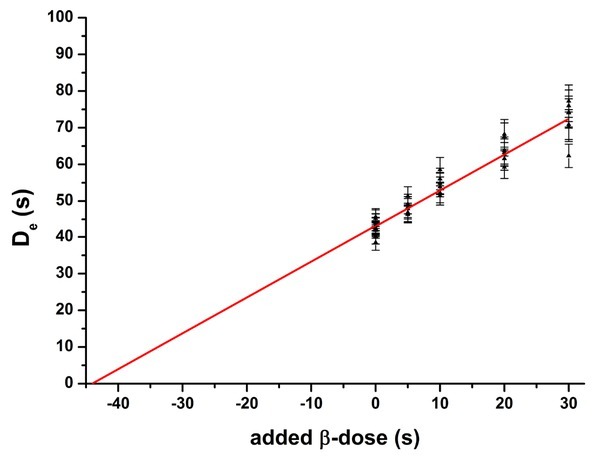
Fig. 5
Interpolation of the normalized (γLn/βTn) OSL-signal from coarse grain γ-irradiated quartz (n=10) onto the normalized OSL (βLn/βTn) signal for various β-irradiations (average of four aliquots each) of LexCal2014 material, which has received identical treatments prior to irradiation.
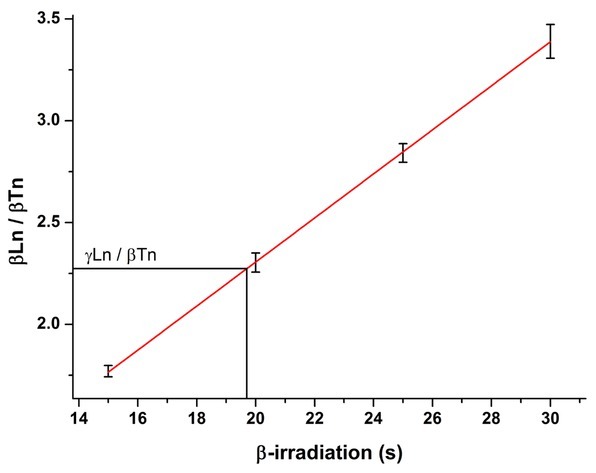
Fig S1
Stamp for simultaneous administration of silicone to ten aliquots for preparation of large (6 mm) aliquots, whereas the stamp for small (e.g. 0.2 mm) aliquots has a different stamp size.
Measurements were made on different lexsyg smart (Richter et al., 2015b) luminescence readers, with OSL stimulation by blue LEDs (458 nm) delivering 90 mW cm-2 and OSL collected in 0.1 s channels. Two detection windows were tested; from ~326−353 nm using the combination of a 2.5-mm-thick Hoya U340 and a 5-mm-thick Brightline HC340/26 interference filter, and from ~340−390 nm using the combination of the same Hoya U340 and a 5-mm-thick Delta BP365/50 interference filter. A systematically higher signal was obtained for the latter detection window (termed 365nm window), which is closer to the quartz OSL emission band at 365 nm (Krbetschek et al., 1997) and was therefore used for all data presented here. The data were analysed for the initial 0.6 s, with the last 10 s subtracted as background (~2% of the initial signal). Shorter integration intervals, as well as early background subtraction (Cunningham and Wallinga 2010) provide identical results within uncertainties (Table S1). For all data presented, linear fitting of the regeneration data is employed.
Table 1
Results (weighted average of measured doses) for coarse-grain SAR β-dose recovery (DRT) experiments, ratios of given/measured β-dose, number of aliquots measured and aliquot size.
| given β-dose (Gy) | ratio given/measured dose | ± | n aliquots | aliquot size |
|---|---|---|---|---|
| 2.28 | 0.993 | 0.013 | 10 | 6 mm |
| 3.04 | 1.005 | 0.010 | 10 | 6 mm |
| 3.80 | 0.992 | 0.020 | 19 | 2 mm |
| 4.56 | 1.017 | 0.010 | 9 | 6 mm |
Table S1
Nominal post-IR blue-OSL depletion ratios for late and early background subtraction.
| Aliquot No | Late background subtracted depletion ratio | Early background subtracted depletion ratio |
|---|---|---|
| 1 | 0,96 | 0,96 |
| 2 | 0,91 | 0,90 |
| 3 | 0,88 | 0,88 |
| 4 | 0,88 | 0,88 |
| 5 | 0,92 | 0,92 |
| 6 | 0,91 | 0,91 |
| 7 | 0,89 | 0,88 |
| 8 | 0,91 | 0,91 |
| average | 0,91 | 0,91 |
| sd | 0,03 | 0,03 |
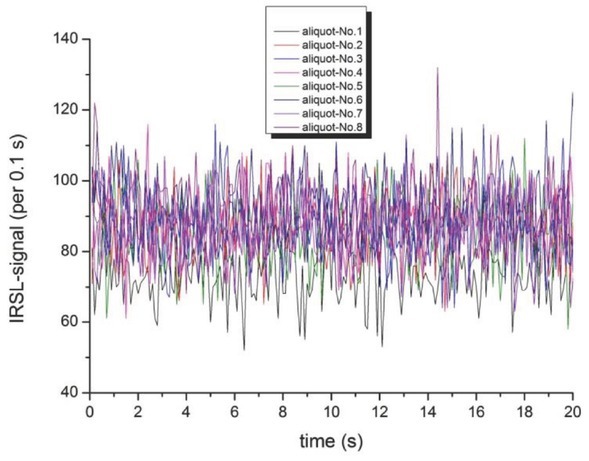
Feldspar contamination can contribute a potentially unstable signal to the measured blue OSL-signal. The presence of an unstable signal would lead to increased dose-rate results of source calibrations with increasing time since the γ-irradiation. Nominal blue-stimulated OSL IR-depletion ratios (following Duller, 2003) average (n=10) at 1.01±0.02 for identical regeneration β-doses, and exhibit negligible IRSL-signals (Fig. S2).
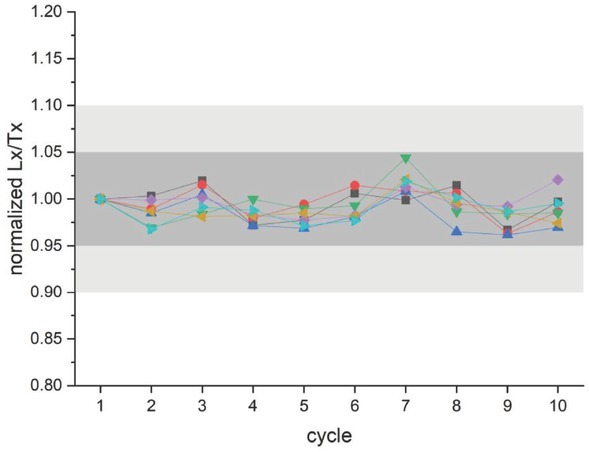
Lx/Tx-ratios of a DRT experiment (see below for more details) with the above material provide an average recycling ratio of 0.998±0.017 (n=30). In an extended recycling experiment, the recycling ratios stay well within the generally accepted 10% deviation from unity throughout 10 cycles of the same 3.7 Gy regeneration β-irradiation (Fig. S3).
Fig S3
Lx/Tx ratios (normalized to the first value) of 7 aliquots for 10 times the same (3.7 Gy) regeneration β-dose are well within the generally accepted 10% deviation (light grey) of recycling ratios to unity (5% in dark grey).
An OSL-SAR-procedure usually includes a regeneration point with zero irradiation, in order to measure recuperation. Recuperation levels were negligible for all experiments (<0.5% after the largest given β-dose of ca. 9 Gy) and thus no high-temperature stimulation (hot bleach) had to be employed between measurement cycles.
. γ-irradiation
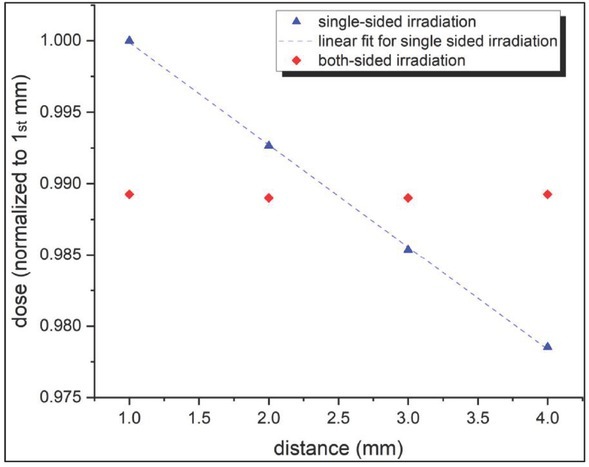
After the described sample preparation, the grains (ca. 2 g material) were packed in a light-protected planar quartz glass (2.2 g cm-3) container with a height of 45 mm and a wall thickness of 4.2 mm, which ensures charged particle equilibrium (CPE), and 4 mm spacing (Fig. 1). The average density of the packed quartz was measured as mass/volume to be 1.43 g cm-3. The remaining space between grains was not filled with fine-grained material because non-systematic previous work provided unusual large dose-rates for fine grains filling the space between coarse-grained quartz, which were therefore suspected of having been bleached by photon interaction. For γ-irradiation, a Cs-137 source (“Buchler Gammakalibrator OB 20”) at the Radiation Facilities of the Helmholtz Zentrum München was employed in a scatter-free geometry (Greiter et al., 2016). This source is calibrated against the primary standard in Germany and has an air kerma rate of approximately 1.8 Gy h-1 at 1 m distance. Half of the total air kerma of 3.06 Gy (± 1 %) was administered to each side in order to achieve more homogeneous irradiation (see Fig. S4 for details on absorbed γ-dose gradient).
Fig S4
Relative dose with distance from the side of irradiation (triangles) and relative dose for two-sided irradiation (diamonds), based on MC simulations. The relative dose for two-sided irradiation is normalized to the dose in the first mm for single sided irradiation.
The absorbed γ-dose in quartz per air kerma was calculated using the Monte Carlo Code MCNP 6.2 (Werner, 2017). The source was realized as a circular source with a radius of 5 cm, producing a parallel, homogeneous field to one side of the sample holder. The quartz grains were replaced by a solid block of SiO2 with the average density as measured (1.43 g cm-3). Calculations were also carried out for average densities varying from 1.04 g cm-3 to 2 g cm-3. This resulted in no difference in the absorbed γ-dose in the target volume (standard deviation <1%). A ratio of absorbed γ-dose in SiO2 to air kerma of 0.98 for 0.66 MeV photons was obtained. Considering an uncertainty of 2.1% (see supplement for details) in the calibration, the absorbed γ-dose is estimated as 3.00±0.06 Gy at 1-σ.
. Tests on the applicability of the SAR procedure and the suitability of the quartz
The β-dose recovery test (DRT) is an important tool in SAR DE-determination of quartz and considered a prerequisite (Bøtter-Jensen et al., 2003) for the acceptance of SAR DE-results, which must be taken as a requirement for quartz material to be used for calibration. All DRTs to recover β-irradiations were performed on material with identical treatment (zeroing by heating/bleaching) as for γ-irradiation.
The calibration quartz was first submitted to the standard procedures to determine the measurement parameters. The preheat (PH; for 10 s) plateau test following Murray and Wintle (2000) shows little variation (for a constant preheat (TPH) of 160°C for 0 s following the test dose) of measured over given β-dose (Fig. 2) for a 3.7 Gy β-irradiation (DRT), which leads to the selection of 200°C as PH temperature.
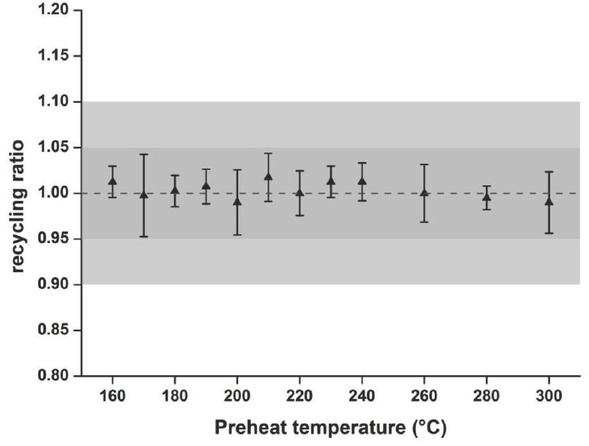
Sensitivity changes are small and appear to increase slightly at PH temperatures at or above 220°C, as indicated by the Tn/Tx ratios (Fig. S5) of the last measurement of the SAR sequence (recycling point). Even though the SAR procedure is empirically very effective to account for sensitivity changes, it appears to be desirable to obtain calibration quartz, which exhibits minimal sensitivity changes in order to minimize any correction necessary. Procedures appear to be appropriate for the sample because recycling ratios do not deviate from unity (Fig. S6).
Fig S5
Average Tn/Tx ratios of the last dose (recycling) point from SAR β-DRT (3.7 Gy) sequences for different preheat temperatures with fixed cutheat at 160°C (4 aliquots for each temperature step).
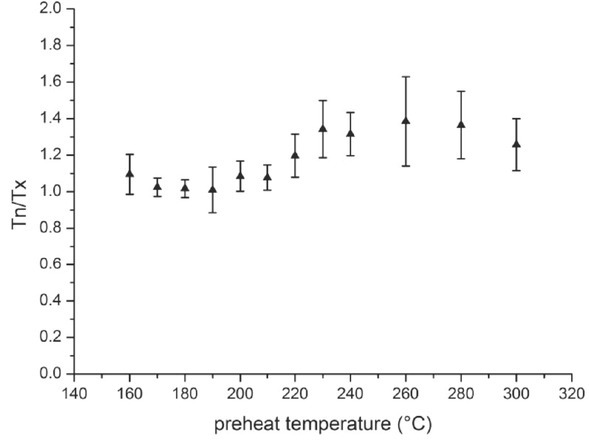
Fig S6
Mean recycling ratios and standard deviations for 4 aliquots for various preheat temperatures with cutheat fixed at 160°C (0 s) for a β-DRT of 3.7 Gy. The dotted line represents unity, the dark grey area indicates 5% and the light grey area indicates 10% deviation from unity.
A constant β-dose recovery ratio consistent with unity was obtained for test dose preheat (TPH; for 0 s) temperatures with the PH temperature fixed at 200°C (Table S3), and the TPH temperature was set equal to the PH temperature (Ankjærgaard et al., 2009; Blair et al., 2006) of 200°C for all results presented. Tn/Tx-ratios are rather similar for the chosen PH and TPH temperatures (Fig. S7). The ratio of the given to the measured β-dose (3.9 Gy) for 30 aliquots is 0.999 with a standard error of 0.003.
Fig S7
Example of Tn/Tx-ratios for a 7 cycle (in this order of: natural, 4 regeneration doses, recuperation and recycling point) SAR DRT of a 3.7 Gy β-dose for a single aliquot, showing the small sensitivity changes. The dotted line represents unity, the dark grey area indicates 5% and the light grey area indicates 10% deviation from unity.
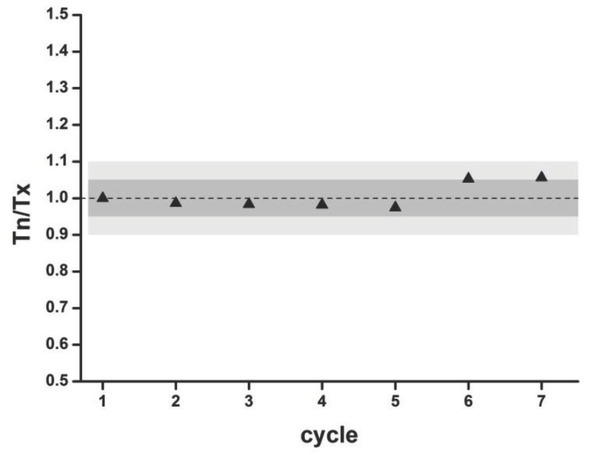
Table S2
Calibration results (weighted mean and sd) over the course of a 20 months period.
| Calibration date | Gy s-1 | ± |
|---|---|---|
| 25.10.2016 | 0.155 | 0.006 |
| 01.11.2016 | 0.156 | 0.008 |
| 16.11.2017 | 0.155 | 0.004 |
| 07.05.2018 | 0.156 | 0.004 |
Table S3
Results of test dose preheat (THP) experiment for 3 aliquots each for a preheat temperature of 200°C. Mean and standard error for SAR results as ratio to the 3.7 Gy β-dose to be recovered.
| Cutheat temperature (°C) | Average ratios measured/given dose | se |
|---|---|---|
| 160 | 1,01 | 0,04 |
| 180 | 0,99 | 0,02 |
| 200 | 0,99 | 0,01 |
| 220 | 1,01 | 0,02 |
Such low preheating temperatures might not entirely remove signal from an ultrafast component, if present. Due to the instability of the ultrafast component, the ‘shine plot’ can detect its presence (Jain et al., 2008). This was checked for a sample of the quartz, which was stored for one year after γ-irradiation, and thus should not have any ultrafast component present, while during a DRT procedure only seconds elapse between β-irradiation and measurement. SAR data analysis of successive 0.02 s signal integration (Fig. S8) do not show an increase in the measured β-dose with stimulation time and thus there is no indication of the presence of the ultrafast component in the sample (see also Fig. S11). This appears to be supported by the agreement of calibration results obtained with LexCal2014 over the course of 20 months (Table S2).
Fig S8
Mean measured dose and standard deviation of LexCal2014 quartz, measured with the SAR protocol more than one year after a γ-irradiation. Data for the average from 5 aliquots was analysed in 0.02s steps of stimulation time.
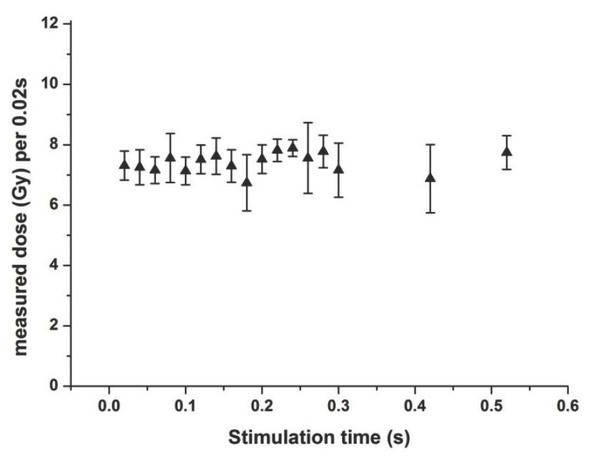
Fig S9
Normalized regeneration (Lx/Tx) for increasing β-doses for a single aliquot measured using SAR and for 2-3 aliquots for increasing additive doses. The inset shows the OSL response for the linear range of the dose-growth-curve. Uncertainties here are smaller than the symbols.
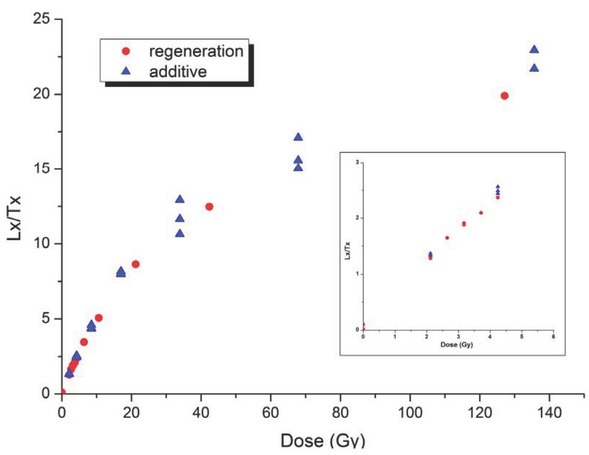
Fig S10
Time resolved OSL (365 nm detection window) after 50 μs blue stimulation of a 3.7 Gy β-irradiation.
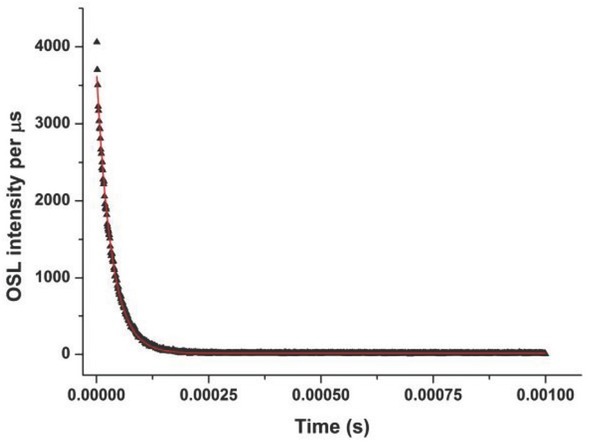
Fig S11
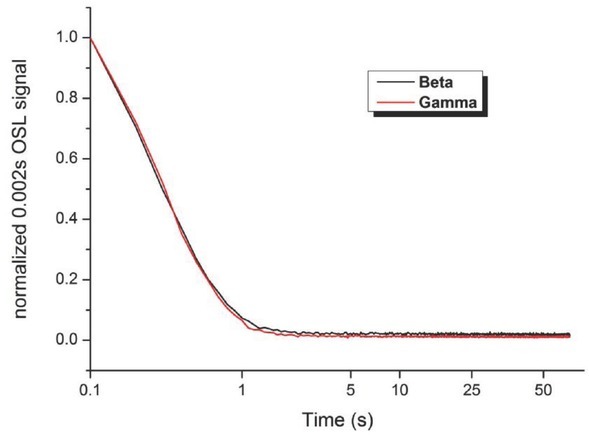
OSL decay curves normalized to the initial datapoint of the raw signal intensity. The measurement of the γ-irradiated sample was performed one year after irradiation, while a prompt (no delay between irradiation and measurement) approach for the β-irradiated sample was used.
The above DRTs are prompt measurements, i.e. the measured β-dose was determined immediately after β-irradiation. While, in contrast to feldspar, signal loss (e.g. anomalous fading) of quartz is generally not an issue, it has been reported especially for some heated quartz of volcanic origin (e.g. Bonde et al., 2001; Tsu-kamoto et al., 2007), and a potential correlation of signal loss with heating temperature has been suggested (Richter et al., 2015a; Schmidt et al., 2017). The DRT of β-dosed aliquots were measured with a delay of 48 days, employing the identical SAR-protocol. The ratio of 0.997 to the prompt measurement suggests no signal loss on this timescale. On a longer timescale, this is indicated as well by the agreement of calibration results with γ-dosed quartz from the same batch over a period of 20 months (Table S2) for the same β-source.
DRT results obtained with SAR for different given β-doses measured with the chosen measurement conditions are listed in Table 1, all providing ratios close to unity. A time-resolved analysis with a lexsyg research (Richter et al., 2013) gives a lifetime of τ = 32.4 ± 0.7 μs (Fig. S10), which is in agreement to the published values for quartz OSL signals. From the results discussed above, it can be concluded that LexCal2014 quartz exhibits excellent OSL dosimetric properties, which are key for source calibration purposes, like good normalized repeatability of dose response with a bright luminescence signal, dose recovery close to unity, OSL signals being reproducible, and exhibiting little dependency on measurement parameters.
. Beyond SAR and dose recovery
While the above appears to be sufficient for standard calibration purposes, three additional ways to achieve dose-rates from calibration quartz are presented, which also provide additional insights into the dosimetric properties of the material and the suitability of procedures. The results of SAR procedures depend on measurement parameters. Therefore, PH (and TPH) tests are performed to identify ranges (plateaus) where little dependency on the chosen parameter is observed. The appropriate parametric choices (e.g. PH temperature) have to be justified and warranted. Unless un-dosed material is available for a DRT, this can be especially important when different equipment is used, where, for example, heater plate temperatures potentially are different (e.g. Kadereit and Kreutzer 2013), which makes the transfer of measurement parameters from one piece of equipment to another problematic. Independence of regeneration issues, however, can be obtained by interpolation of the average SAR result for the γ-irradiated quartz against the results of DRTs for different β-doses on the identically pre-treated material, which has not received any γ-dosing (Guérin and Valladas 2014). Here, the measured β-doses from several DRTs are plotted against the given β-doses. Interpolation of the SAR result for the γ-irradiated quartz onto this quasi ‘SARA curve’ (Fig. 3) provides an independent measure of the dose (Guérin and Valladas 2014), whether natural or γ-dosed. Systematic effects of the SAR procedure cancel out and SAR parameters thus become less important. Guérin and Valladas (2014) state that this provides an estimate of the dose-rate for the source (to be calibrated), which is less dependent on SAR parameters than the single SAR procedure and ’even a totally out-of-tune SAR protocol could be effective’.
The growth of regeneration and additive OSL signal from LexCal2014 is very similar (Fig. S9). The single aliquot regenerative plus added dose (SARA) procedure (Mejdahl and Bøtter-Jensen 1994, 1997; Murray 1996) provides a tool for the qualification of the SAR procedure. Employing this approach for calibration purposes requires aliquots of γ-dosed quartz receiving additional additive β-doses. The β-doses are determined for several such additive β-doses with the identical SAR protocol and parameters. Regression analysis of these measured β-dose determinations, including only γ-dosed quartz (which has received zero additive β-dose), provides a SARA-β-dose for the γ-dosed quartz (Fig. 4). SARA thus allows for a quantification of the potential bias introduced by the SAR procedure (Guérin and Valladas 2014), and the agreement between SAR and SARA provides more confidence in the parameters employed for the SAR determination (Guérin and Valladas 2014). Similar shapes of the dose-response-curves of regeneration and additive OSL signals (Fig. S9) indicate the suitability of both approaches.
According to Guérin and Valladas (2014), the most accurate and simplest calibration using OSL from quartz can be obtained by interpolation (Fig. 5) of the β-normalized OSL-response of the γ-dosed quartz (γLn/βTn) onto a β-dose-growth curve derived from the β-normalized OSL responses of several different β-doses (βLn/βTn). These data are obtained on zeroed (non-γ-dosed) quartz, and β-doses are chosen to induce OSL responses framing the OSL signal of the γ-dosed quartz (Guérin and Valladas 2014). Here, the data from the β−DRT experiments (from Fig. 3 and Table 1) can be used. The sample material before any dosing (either γ or β) has to originate from the same sample batch having received the same pre-treatment and normalization has to be achieved for all data through the OSL response to an identical β-dose from the source to be calibrated.
. Transfer-calibration with the γ-dosed quartz LexCal2014
Various transfer calibrations were performed for β-sources (Beta1 and Beta2) of different activities in different lexsyg smart devices. For a γ-irradiated sample from the same batch of prepared LexCal2014, the SARA result of 43.0±0.5 s (Fig. 4) is indistinguishable from the SAR result of 42.7±0.3 s obtained for source Beta1, supporting the SAR result and confirming that the chosen parameters of 200°C for both heating processes (PH and TPH) appear to be appropriate.
The average of the normalized OSL signal (γLn/βTn) of γ-dosed LexCal2014 interpolates to a β-irradiation duration of 19.4±0.6 s (Fig. 5) for source Beta2, which is indistinguishable from the 19.3±0.3 s (n=10/10) obtained for the γ-irradiated LexCal2014 with a standard SAR procedure for source Beta2. These results are also in agreement with 19.4±0.3 s achieved by interpolation of the γ-dosed LexCal2014 SAR result onto the SAR results for several DRT β-doses (Fig. 3) for source Beta2. Such agreement shows again that parameters chosen for the SAR procedure are appropriate (Guérin and Valladas 2014).
Cross calibrations of the same beta-source with LexCal2014 material from four independent γ-irradiations (from three sample preparations) provide a relative standard deviation of 1.8%, with calibration results differing by 4%. This is comparable to a 3% relative standard deviation around the exponential dose-rate decay for 18 separate batches of Risø calibration quartz (RCQ) measured over >16 years for a single reader, which exhibits a maximum deviation of individual calibrations measurements from the line as large as 10% (Fig. S1b in Hansen et al. 2018). Calibration results for LexCal2014 agree (ratio of 1.03±0.06) within 1σ-uncertainty of calibration with γ-dosed quartz (RCQ batch 60) described in Hansen et al. (2015; 2018), giving 0.153±0.006 and 0.149±0.008 Gy s-1, respectively (n=10 each). However, in an application with no control over storage and other parameters, RCQ#60 is reported to provide calibration results being different by 21% from batch RCQ#17 of the same quartz, and differences up to 30% are reported for batches from this calibration quartz (Hansen et al., 2018). A subsequent comparison of LexCal2014 with more recent batches of RCQ (#110 and #118) revealed nominal differences in calibration results of 19 and 14%, respectively. It has to be noted that MC analysis has subsequently shown that the absorbed γ-dose to RCQ is 4% larger than the specified value, which was based on the exponential law using mass-attenuation coefficients (Autzen et al., 2019), which reduces the differences to 15 and 10%, respectively. β-DRT experiments of zeroed RCQ quartz, however, provided results in agreement with unity for measurements with the identical equipment as used to test LexCal2014 quartz, which suggests differences in γ-irradiation or dose to quartz calculation.
The observed difference is in line with the single grain analysis by Tribolo et al. (2019), who found two groups of apparent calibration values for the same β-source from a variety of quartz samples, which had been γ-irradiated at different facilities and in different containers. The two groups differ by approximately 14%. One group consists of LexCal2014 (γ-dosed at the SSD Munich); an RCQ (without batch number but γ- irradiated at DTU Nutech); previously un-dosed RCQ#90 (γ-irradiated at the Laboratory for Sciences of Climate and Environment (LSCE), CNRS, Gif-sur-Yvette) and six out of eight other quartz samples γ-dosed at LSCE. The other group consists of two low-precision quartz γ-irradiated at LSCE and three RCQ (#40, #106, #113) samples (Tribolo et al., 2019).
. Conclusions
The general suitability for calibration purposes of the quartz sample LexCal2014 has been shown in this study. For the application of source calibration, a simple SAR appears to be sufficient. However, it also appears to be prudent to determine the correctness of SAR parameters when different equipment is used and especially for each new batch of calibration quartz, even though dependence of this quartz on preheat temperatures is shown to be low. Such testing could be achieved by DRTs with SAR, SARA and interpolation analysis (measured β-doses for the γ-irradiated quartz onto β-DRT results for several β-irradiations; normalized γ-irradiation OSL response onto the normalized β-irradiation OSL signal growth curve from a series of different β-irradiations). Application of the above protocols provided indistinguishable results with similar confidence intervals for LexCal2014 quartz. Furthermore, this could be extended to several and differently γ-dosed quartz samples.
Such an approach ensures quality and reproducibility of the transfer-calibration quartz LexCal2014; this material will be available in the long term because several tens of kilograms have been sampled and the locality is accessible. Such quality control allows for calibration of any luminescence equipment based on the standard OSL-SAR-protocol. Additionally, an interpolation of the normalized γ-irradiation OSL response onto the normalized β-irradiation OSL signal growth curve from a series of different β-irradiations (Fig. 5) can be performed. The latter approach requires the provision of un-dosed LexCal2014 from the same batch as the original γ-irradiated material which underwent the identical treatments as used for γ-irradiation.
However, the observed difference in apparent dose-rate between LexCal2014 and the widespread RCQ quartz described by Hansen et al. (2018) are of concern in application. The observations in this study and by Tribolo et al. (2019) do not suggest differences in material properties (e.g. Bell and Mejdahl 1982) as a cause. The value of absorbed γ-dose for the LexCal2014 was obtained by Monte Carlo Calculation (MCC) and not by employing the exponential law using mass-attenuation coefficients, thus also considering Compton Scatter from the container walls. Such considerations might explain some differences in apparent β-dose-rate results and subsequent MCC calculations for the RCQ provide a γ-dose 4% larger than the specified dose (Autzen et al., 2019), which reduces the difference to LexCal2014. The good agreement of LexCal2014 with quartz, which had been irradiated at LSCE (Tribolo et al., 2019) might point to such differences in dose to quartz calculation, or the γ-irradiation as a possible source of some of the deviation observed.
Given the importance of source calibration, it is nevertheless essential to understand the reasons for such variations and the consequences this might have on the achievable accuracy in source calibration, including any systematics potentially caused by absorbed dose calculation. This requires γ-irradiations of different quartz samples using identical setups and further analysis of the issue of determining the absorbed γ-dose in quartz from the air kerma value, as has been performed by Hansen et al. (2018). Such is the focus of an ongoing joint study by Risø and Freiberg Instruments which was triggered by the above results. This will be centred on the LexCal2014 and RCQ calibration quartz and serve, together with other attempts (e.g. Tribolo et al., 2019), as basis for the required international effort to achieve source calibrations with the least systematic uncertainties.