
. Introduction
The final part of the Late Pleniglacial and Late Glacial periods took place when the areas of the Central European Lowlands were subject to fundamental environmental evolution resulting from climate change and the retreat of the Scandinavian Ice Sheet (SIS). Rapid changes to terrestrial sedimentary environments are reflected in sedimentary succession called fluvio-aeolian to aeolian (Kasse, 2002 and Zieliński et al., 2015). This succession was observed throughout the entire European Sand Belt (ESB) (Koster, 1988 and Zeeberg, 1998); however, the time spans are presumably asynchronous throughout the ESB (Kasse et al., 2007; Vandenberghe et al., 2013; and Zieliński et al., 2014). The consequent climate amelioration in the Late Pleniglacial period in Western Europe (in the periglacial zone) caused degradation of the permafrost cover and the release of a considerable amount of (mostly sandy) sediment (Van Huissteden and Kasse, 2001; Kasse et al., 2003; Rinterknecht et al., 2006; and Kolstrup, 2007). The same process in Central Europe took place in the Late Glacial (Kozarski, 1995 and Zieliński et al., 2016).
Cold periods of the Late Glacial (Oldest, Older and Younger Dryas) were separated by periods of climate warming (Bølling-Allerød interstadial). Warm periods were responsible for creating appropriate climatic conditions for soil-formation processes (Manikowska 1991). During cold intervals, intensive sedimentation of aeolian sediments took place in the ESB (Manikowska, 1995; Goździk, 2007; and Zieliński, 2016). Under debate is the question about the significance of particular cold periods in aeolian activity and the formation of dune fields (Nowaczyk, 1986; Kasse, 2002). However, what is also of importance is the fact that the duration of the most well-known cold periods such as the Younger Dryas are comparable with those periods, spanning several centuries, which can be dated precisely using dosimetric (mainly OSL luminescence) techniques. This simple fact significantly contributes to issues pertaining to the interpretation of the results obtained for the sediments from these cold periods.
One of the crucial problems is the accurate dating of particular periods within the Late Pleniglacial and the Late Glacial. Between the optically stimulated luminescence (OSL) and radiocarbon methods, there are frequently significant discrepancies (Kalińska-Nartiša et al., 2015 and Zieliński et al., 2019). Aeolian processes promote the exposure of quartz grains to sunlight during subsequent redeposition. This is vital for luminescence methods, as only should quartz grains fulfil the basic assumptions for the OSL method (resetting luminescence signal during redeposition) is it possible to obtain an unadulterated chronology of the formation of specific geological structures. In fact, it is very common to encounter geological material containing a mixture of grains with varying degrees of bleaching, thus situations in which not all quartz grains were exposed to sunlight long enough. Consequently, we can relatively often consider overestimation with regard to the obtained results. Therefore, there is often a situation that, despite having the results of independent dating methods (radiocarbon and luminescence) available, it is not always possible to achieve adequate convergence between them. This may explain discrepancies in the description of stratigraphic aspects of the studied sediments. Modern methods of radiocarbon dating allow for remarkable measurement precision, right down to decades, to determine the time of death of plants included in the palaeosol. Palaeosols from the Bølling and Allerød periods are correlated with global climate changes and might be treated as chronozones (Konecka-Betley, 1991 and Manikowska, 1995). Because of this, exposures with fluvio-aeolian succession separated by at least one palaeosol have a great potential to solve this problem.
One of the areas with fluvio-aeolian sediments is the Niemodlin Plateau, SW Poland (Fig. 1). Two sites with palaeosols were investigated in this area. A sedimentary succession of sandy deposits provided an opportunity to estimate the time scheme of their deposition as well as forming a comparison with the latest results from other parts of the ESB.
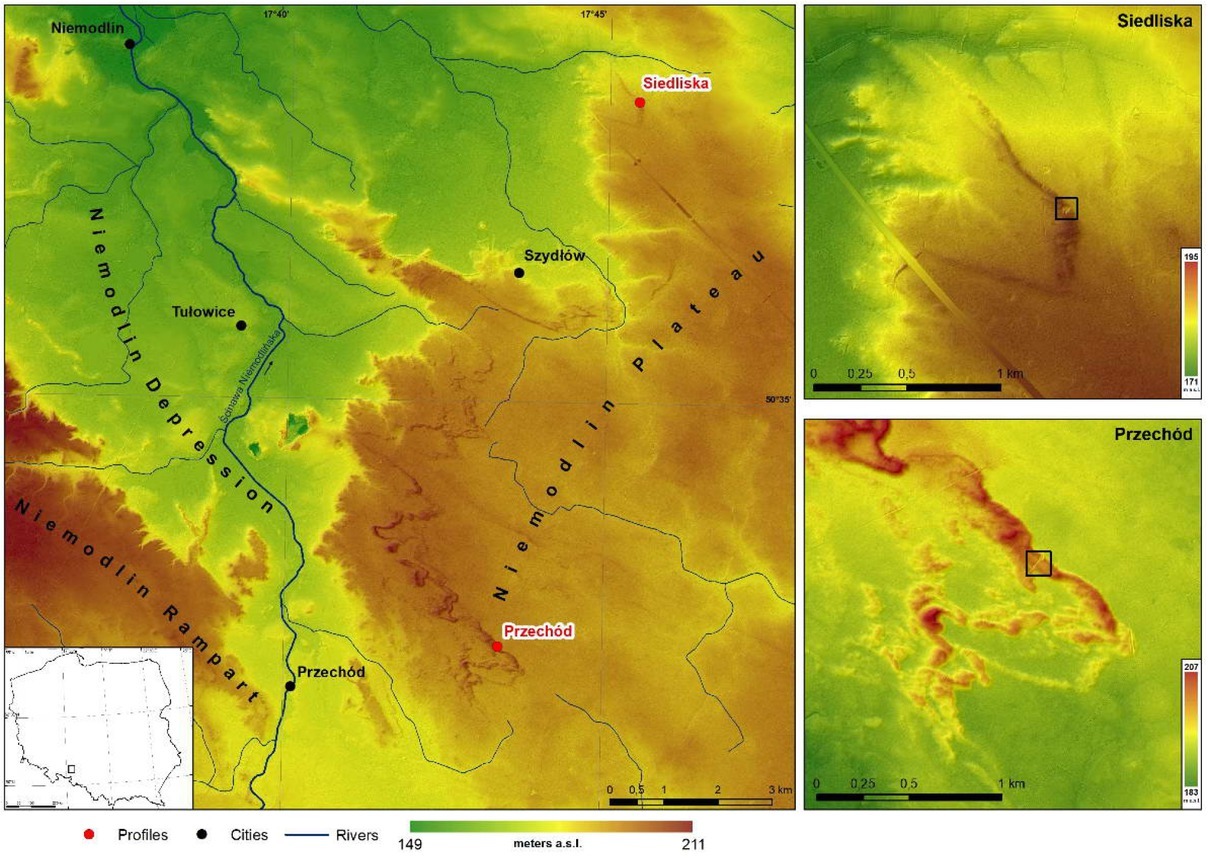
Fig 1
Microregions of the Niemodlin Plain and location of investigated sites, Siedliska and Przechód, with digital elevation model (DEM).
The first researcher to study dune structures in Opole, Silesia, was Pernarowski (1968). He performed extensive field research and basic laboratory tests such as granulometric analysis based on which he concluded that the nature of the dune formation in this area was highly complex. This complexity, according to Pernarowski, resulted from the large changeability of local wind-direction. These winds have repeatedly changed their direction and speed over the last several thousand years. What is interesting, however, is that despite examining 24 dune complexes in the Opole region, Pernarowski found the remains of fossil soils in only two places. It is worth emphasizing that no research was performed in this particular area after Pernarowski, which means that our particular investigation is the first research in this region conducted using modern scientific methods. Our initial research aims at referring to Pernarowski’s theory, thus the main goals of this article are: (i) to reconstruct sedimentary environments during the Late Pleniglacial and the Late Glacial periods; (ii) to determine a stratigraphic chart for sedimentary processes based on OSL and radiocarbon dating; and (iii) to compare the obtained results with research from other parts of the ESB.
. Study area and geological setting
The investigated sites (inland dunes) are located on the Niemodlin Plateau and form part of the Niemodlin Plain (Solon et al. 2018). Two representative outcrops were chosen for the detailed study. Outcrops were selected owing to the completeness of fluvio-aeolian succession, located in the central part of the dunes, the presence of palaeosols and periglacial structures. The investigated profiles are located at an altitude of about 190−200 m above sea level (Fig. 1).
Quaternary units are underlined by the Gozdnica Formation, a Mio-Pliocene piedmont alluvial sedimentary cover (Piwocki and Ziembińska-Tworzydło, 1997). The Niemodlin Plateau is mainly built of glacial sands and gravels deposited during the Odra Glaciation (Przybylski and Badura, 2001). The inland dune areas occur mostly in the western part of the Niemodlin Plateau close to the morphological edge (approx. 20 m high) of the Ścinawa Niemodlińska River valley. The biggest and the best-developed dunes are located in SW part of the Niemodlin Plateau.
The dunes of the Niemodlin Plateau adopt mainly parabolic, longitudinal and irregular hilly forms. The parabolic dunes are mainly U-shaped and V-shaped. These create compound hemicyclic, digitate or nested dunes (according to Pye and Tsoar, 2009). The height of these forms does not usually exceed 10−12 m. Asymmetric development of the dune arms, length and their orientation is common and clearly visible. Northern arms of dunes are longer and orientated NW−SE. There are often longitudinal dunes on the shoulder extension of the arms (up to 3−5 m high). Most longitudinal dunes seem to be transitional forms between parabolic and longitudinal (Vandenberghe 1983). The sites are located in the area of most typical for parabolic dunes.
The Siedliska profile is located in the well-developed northern parabolic dune arm in the immediate neighborhood of the nose. The shoulder height here is 3.5 m, the length is 1200 m and has a NW−SE orientation. The southern arm, like the nose, is highly reduced. The height is about 1 m, with a length of 600 m and a W−E orientation (Fig. 1).
The Przechód profile represents a compound dune, which is a combination of complex forms such as hemicyclic and nested (Pye and Tsoar 2009). The main, outer ridge of the form, over 2.6 km long, has a height of 2 m in the southern part, 10 m in the northern and nose. The dunes ‘inside’ the main form are smaller − 2−7 m high and 200−400 m long along the ridge. The profile is located in the N−E part of the dune, in the area connecting the arms of the basic dunes (Fig. 1).
. Methods
Two excavations were prepared for further investigations in a forested area near the villages Siedliska and Przechód. Twenty-seven samples were taken from the Siedliska and 21 from the Przechód profile for analysis in terms of grain size and other lithological properties. Nine OSL samples were collected and three samples of charcoals (radiocarbon dating) were gathered for further measurements (Fig. 2).
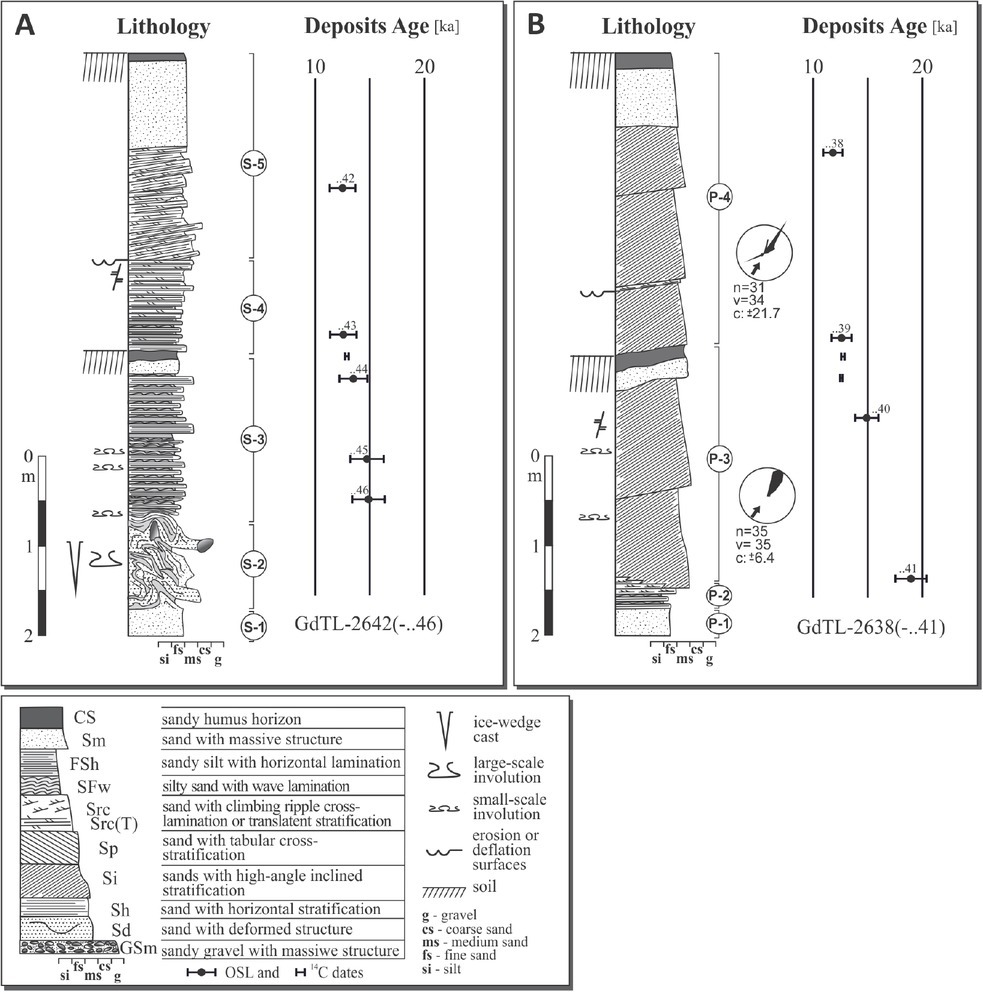
Fig 2
Sedimentary succession, radiocarbon and OSL ages of deposits at Siedliska (A) and Przechód (B) sites.
Lithological analysis
To establish the origin of the sediments, the three-level lithofacies analysis (lithofacies, lithofacial association and lithofacial complex) was used based on the methodology proposed by Miall (1978, 1996) with subsequent modifications (Zieliński, 2014). For aeolian sediments, the methodology proposed by Zieliński (2016) was implemented. Measurements of directional elements, analyses of cryogenic structures and fossil soils were also performed. Soil horizon symbols used for morphological description of palaeosols are in accordance with the international standards (FAO 2006).
Optically stimulated luminescence (OSL)
The procedures included the collection of samples for luminescence dating from a clean vertical section using thin-walled steel pipes from an Eijkelkamp system. At the same time, about 1 kg of sediment was collected into plastic bags from around the tubes, for gamma spectrometry.
For OSL measurements, coarse grains of quartz (125–200 μm) were extracted from the sediment samples by routine treatment with 20% hydrochloric acid (HCl) and 20% hydrogen peroxide (H2O2). The quartz grains were separated using density separation with the application of sodium polytung-state solutions leaving grains of densities between 2.62 g/cm3 and 2.75 g/cm3. The grains were sieved, before etching with concentrated hydrofluoric acid (HF), for 40 min. The grains were then placed on small steel disks (10-mm diameter) using silicon oil and placed into the luminescence reader.
All OSL measurements were performed using an automated Risø TL/OSL DA-20 reader fitted with a calibrated 90Sr/90Y beta source delivering about 7.0 Gy/min to grains at sample position and a 6-mm Hoya U-340 filter was used for OSL detection.
Equivalent doses were determined using the single-aliquot regenerative-dose (SAR) protocol (Murray and Wintle 2000). The OSL SAR protocol which was used in our measurements contained the following steps:
Irradiation with the regenerative beta dose Di
Pre-heat at a temperature of 260°C for 10 s
Blue light stimulation at the temperature of 125°C for 100 s
Irradiation with the test dose Dt (10% of the natural dose, but not less than 2 Gy)
Cut-heat at a temperature of 220°C and
Blue light stimulation at a temperature of 125°C for 100 s.
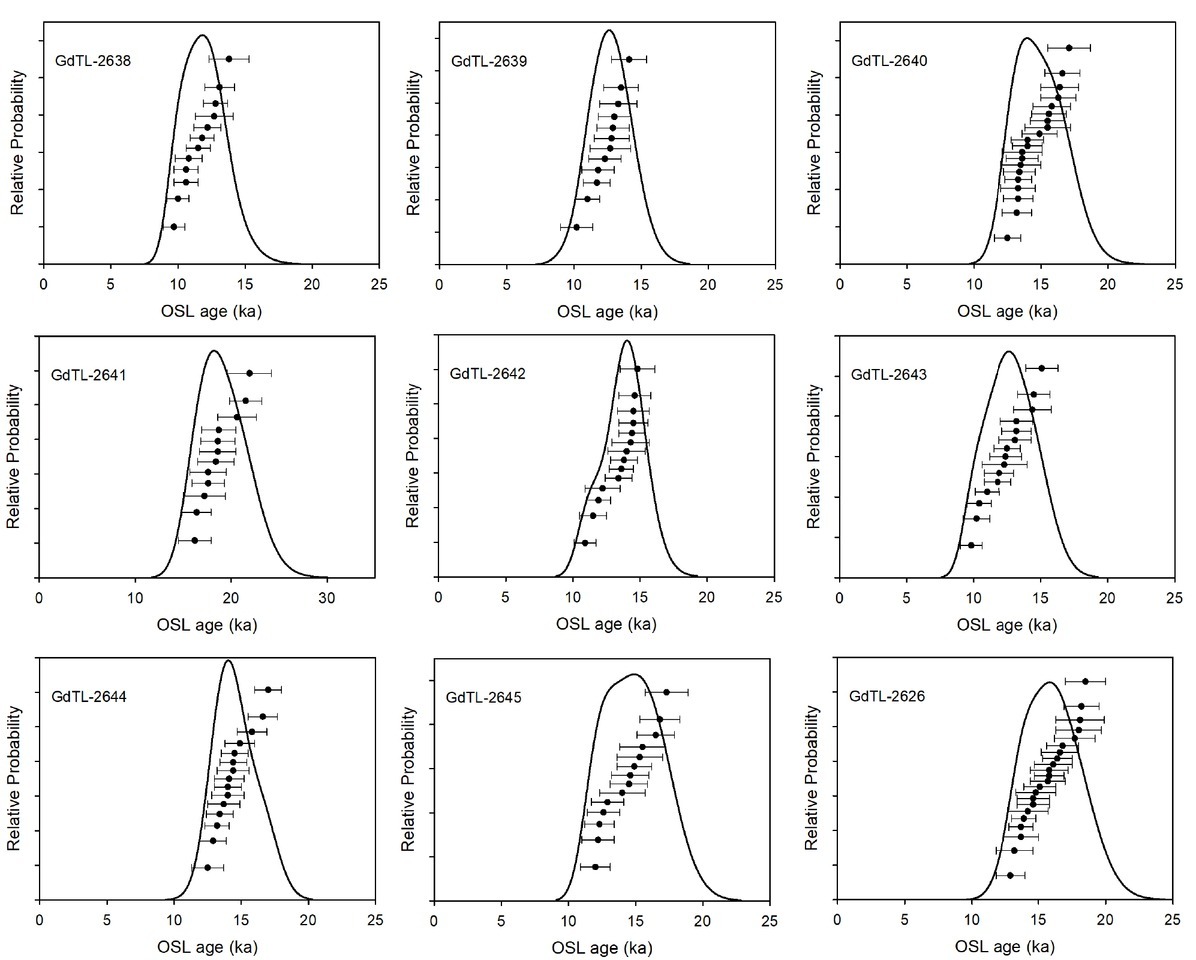
Intensities measured in Steps 3 and 6 were used for equivalent dose determination. For equivalent dose calculation, the first second of the signal was used and the background was estimated from the last 10 s. The SAR dose-response curves were best represented by a single saturating exponential. Final equivalent dose (De) values were calculated using the Central Age Model (CAM) (Galbraith et al., 1999). The overdispersion parameter which refers to the spread in De values remaining after all measurement uncertainties for all samples were very low, less than 10%. The sources of overdispersion are both intrinsic (e.g. counting statistics as described by Adamiec et al., 2012) and extrinsic (e.g. beta microdosimetry or incomplete bleaching; Duller, 2008). The De distribution can be presented in terms of relative probability density functions (Berger, 2010). For our samples, typical unimodal distribution was obtained (Fig. 4), which represents the group of adequately bleached samples (Arnold et al., 2007). All results were also placed on the lithological scheme of the profiles (Fig. 2).
To assess the dose rates that arise from decay chains and potassium we used high-resolution γ spectrometry (HRGS) and the μDose system. Both systems were calibrated with the same reference materials, namely IAEA-RGU-1, IAEARGTh-1 and IAEA-RGK-1 obtained from International Atomic Energy Agency reference materials (IAEA 1987).
The HRGS measurements were performed using a low background, high-resolution HPGe detector with a resolution at full width and half maximum of 1.8 keV and relative efficiency of 40% at the energy of 1332 keV manufactured by Canberra. The lines 234Th, 234mPa, 214Pb, 214Bi and 210Pb were used to measure 238U decay chain, and 228Ac, 212Pb, 212Bi and 208Tl lines were used for 232Th decay chain.
For luminescence dating, coarse grains of quartz were used with standard measurement procedures, however, when determining the annual dose of sediment, we also used, in addition to the standard high resolution γ spectrometry, the new μDose system. Dose rates, from both systems, were calculated using software that is built in the μDose system (Tudyka et al., 2018). This software uses uncertainty correlations and it propagates them using Monte Carlo method. The dose rates were calculated with an assumption that the 238U, 235U and 232Th decay chains are in secular equilibrium and that 238U/235U isotopic ratio is known and equal to 137.88. This is not strictly true in each case, especially secular equilibrium in 238U decay chain due to chemical properties and half-life this can be affected. This assumption, on secular equilibrium and its influence on the dose rate is rarely verified due to technical difficulties. However, in this work, we benefitted from using two independent systems, where μDose measured both α and β particles from all decay chain members (with the exception of stable daughters which obviously do not contribute do the dose rate). On the other hand, HRGS measures specific radioisotopes with high accuracy. With this, it is plausible to assume that the dose rates would only be consistent if there were no major deviations from the secular equilibrium state, and even if there were such deviations, they would not affect the final dose rate. In Table 1, we indeed find that both methods give statistically the same dose rate values. Moreover, it can be noted that the estimated uncertainties obtained with the μDose using multivariate statistics give the same precision as HRGS values. This is possible because the α and β counts in the μDose system give restriction on how 238U, 235U and 232Th decay chains and 40K radioactivity can change relative to each other, thus significantly improving the dose rate precision. Data from both systems were combined using Bayesian statistics (Table 1), which further improved the dose rate precision.
Table 1
Basic information about investigated samples. Dose rate values obtained with different system detectors and final Bayesian estimation. Final obtained age using CAM model.
The dry dose rates (Adamiec and Aitken, 1998 and Guerin et al., 2011) were adjusted for water content, following Aitken (1985). We assumed that the average water content was not higher than 15% and consequently used a value of 7±3% for further calculations. The cosmic ray dose-rate to the site follows the calculations suggested by Prescott and Stephan (1982). The results of the dose rate calculation for both systems are summarized in Table 1.
Radiocarbon dating procedure
Three samples were collected for radiocarbon dating. Two samples from Przechód and one from the Siedliska profile. From Przechód, about 3 kg of sediment with tiny pieces of charcoals were collected for each sample. (We used LSC technique for measurements, so we needed much more organic material in comparison to the AMS dating.) In the laboratory, this material was treated with the standard procedure acid-alkali-acid (AAA) to remove humic acids, chitin, fungal products, etc. and next converted to benzene for liquid scintillation counting (LSC). LSC measurements were performed using a Quantulus 1220 spectrometer. Detailed calibration procedure (Pawlyta et al., 1998) and performance based on samples from VIRI and FIRI intercomparison 14C programs (Tudyka et al., 2010) were reported earlier.
For the sample from Siedliska, it was possible to collect some small pieces of charcoals for AMS dating. The typical chemical pre-treatment based on the AAA method before radiocarbon dating was used. The AAA pretreatment involves rinsing the samples in hot hydrochloric acid (HCl) followed by sodium hydroxide (NaOH). In the radiocarbon accelerator mass spectrometry (AMS) technique, the 14C concentration is measured in graphite prepared from the carbon contained in the sample. For this purpose, a line for preparation of graphite targets in the Gliwice 14C laboratory was used. All 14C results were calibrated using the OxCal program v4.2 (Bronk Ramsey, 2009 and Southon et al., 2013) and the IntCal13 calibration curve (Reimer et al., 2013). The results are presented in Table 2.
Table 2
Calibrated 14C ages of charcoals. The age was calibrated using OxCal program v4.2, (Bronk Ramsey, 2009 and Southon et al., 2013) with calibration curve IntCal13 (Reimer et al., 2013).
. Results
Siedliska site
Lithology. Five units were distinguished based on the litho-facial analysis (Figs. 2 and 3A). The S-1 unit consists of fine-grained sand and silty sand with a massive structure (Fig. 3A and B). Only the uppermost part of the S-1 unit is exposed. The unit is covered by diamictic sand with gravels of the unit S-2. The top parts of the S-1 and S-2 units show large-scale involution structures penetrated by ice-wedge pseudomorphs (Fig. 3B). The next unit is composed of rhythmite: (i) sandy silt with horizontal lamination and (ii) silt with wavy lamination. Several levels of small-scale involution have been documented within this unit, whose amplitude range from a few centimetres in the base part to 1 cm in the upper part (Fig. 3C). In the top part of the unit, a soil is developed with characteristics of podzol with a hummus-eluvial level (Ah), of a thickness of 10−15 cm with some pedogenic bleaching underneath (Fig. 3C). This gradually changes to the level of enrichment in trivalent iron compounds with a thickness of 15−20 cm and gradually changes into bedrock. Above the soil, the S-4 unit is formed as rhythmite (i) sandy with horizontal lamination, translatent and/or massive structure, and (ii) silt with horizontal lamination or/and wavy lamination. Within it, there are faults with replacement of up to 5 cm (Fig. 3D). It has an erosional surface that forms the border with the S-5 unit. The latter unit consists of sand with translatent stratification (Fig. 3D). These sets are inclined at an angle of approximately 5°. The absence of cross-stratified sedimentary structures hindered the possibility of palaeocurrent measurement. The profile is topped by contemporary podzol (Fig. 3A).
Fig 3
Depositional succession at Siedliska (A-D) and Przechód (E-H) sites: A – general view at the Siedliska site; B – S-2 unit with large-scale involutions and ice-wedge cast (arrow); C – fluvio-aeolian deposits (S-3 unit) with the fossil soil (arrow) in top of unit; D – aeolian deposits within coversand (S-4 unit) and stoss slope of dune (S-5 unit); E – top of P-1 unit, and aeolian deposits within coversand and bottom part of moving dune lee slope; F – soil within the lee slope of dune (top of P-3 unit); G – aeolian deposits within arm of dune (P-4 unit); H – climbing ripple lithofacies (arrow), deposited up the lee slope.
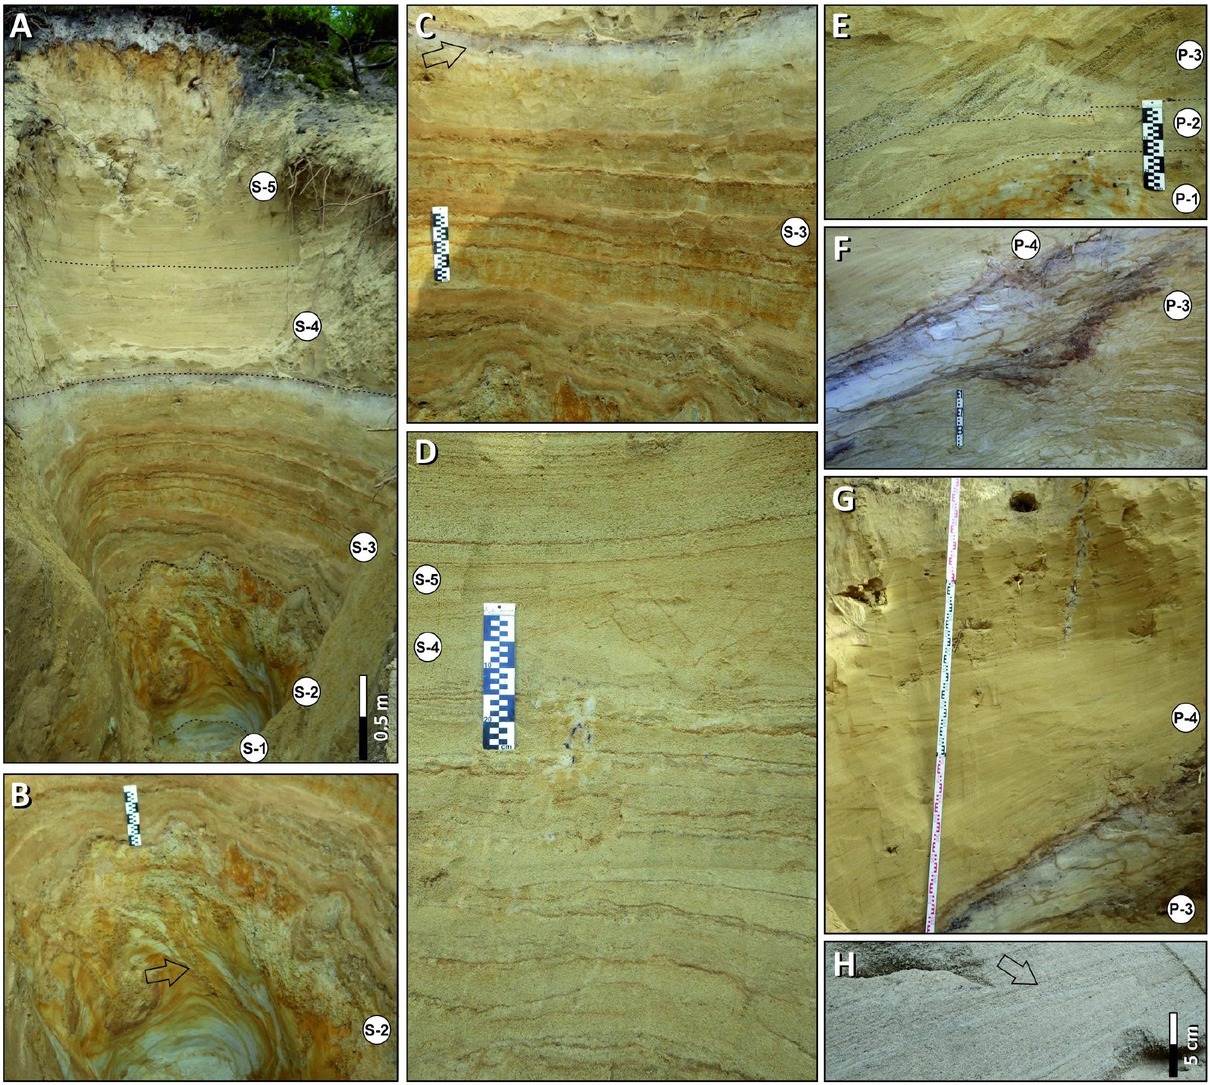
Fig 4
Relative probability density functions (Berger 2010) for all samples are presented on the scale of age.
OSL and14C dating results. Five OSL and one 14C results were obtained for the Siedliska site. The lower part of the S-3 unit was OSL dated at 14.50±1.21 ka (GdTL-2646) and 14.26±1.27 ka (GdTL-2645), whereas the upper part at 13.21±1.04 ka (GdTL-2644) for the sand layer a few centimetres below the palaeosol. A 14C sample from the palaeosol was dated at 12.76±0.03 ka cal BP (Table 2). Similar results were obtained from units S-4 and S-5: 12.39±0.98 ka (GdTL-2642) and 12.47±1.04 ka (GdTL-2643) (Tables 1 and 2; Fig. 2A).
Przechód site
Lithology. The examined profile is composed of four units (Fig. 2B). The P-1 unit is composed of sand and silt with a deformed structure, which gradually turns into P-2 unit, which is characterised by sandy silt with horizontal lamination or sand with climbing cross-lamination (Fig. 3E). This meshes with the higher distant P-3 unit, which is predominantly built of medium sand, coarse sand in the bottom, with high-angle inclined stratification. Inclined lithofacies are interbedded in places with sandy silt with delicate lamination or massive structure (Fig. 3E). The orientation of the structures generally shows a N−E direction, with the azimuth of the resultant vector being 35° (Fig. 2B). At the top of the unit, there is a soil that formed on a surface inclined at an angle of approximately 25°. This is soil with redeposited humus and sand level of approximately 15 cm in thickness. It clearly borders on the lower level of organic enrichment with a thickness of up to 10 cm, which gradually turns into bedrock (Fig. 3F). There are ferruginous pseudofibers throughout the soil profile. The soil is covered by the P-4 unit, which is built of sand with high-angle inclined stratification (Fig. 3G) and sand with climbing ripple-cross lamination (Fig. 3G). Structural directional elements are more scattered, because of the climbing’s ripple lithofacies in W−SW direction. Nevertheless, the resulting vector point is the same as P-3 unit (Fig. 2B).
OSL and14C dating results. Four OSL and two 14C results were obtained for the Przechód site. The oldest result was obtained from the top of unit P-1 (18.96±1.46 ka, GdTL-2641). The upper part of the P-2 unit was OSL dated at 14.88±1.11 (Fig. 4). The charcoals from the palaeosol at the top of P-2 unit gave two 14C dates: 12.68±0.14 ka cal BP and 13.14±0.18 ka cal BP (Table 2). One OSL date from unit P3 provides an age of 12.68±1.00 ka (GdTL-2639) and a second from unit P-4 11.85±0.91 ka (GdTL-2638) (Tables 1 and 2; Fig 2B).
. Interpretation
The correlation of lithofacial units from both key sites and the results of absolute dating allows distinguishing of four phases of the sedimentary development process. Local processes have been compared with the results of earlier research and correlated with global climate changes. The chronology of biostratigraphic horizons is defined following Litt et al. (2001).
Late Pleniglacial (25−17.5 ka)
During the Late Pleniglacial age, the global climate reached a maximum in terms of cooling, which was expressed by a maximum extent of terrestrial ice-sheets in the northern hemisphere (Last Glacial Maximum – LGM; Ehlers and Gibbard, 2004). In the extraglacial areas, a wide zone of permafrost developed, which affected sedimentary processes (Last Permafrost Maximum – LPM; Vandenberghe et al., 2014). Well-developed cryoturbations of type 2 of Vandenberghe (2007) are interpreted as being a result of degradation of the permafrost top. The thickness of that top sediment in the Siedliska site reached at least 0.8 m. Ice-wedges developed in severe climate conditions due to thermal contraction during winter temperature falls (Murton, 2007) in the continuous permafrost zone. The occurrence of continuous permafrost was documented in numerous places in Poland and its neighbouring countries (Goździk, 1995; Ewertowski 2009; and Zieliński et al., 2014). Periglacial structures identified at the Siedliska site can be correlated with LPM and document climate pessimum of the Late Pleniglacial period. The oldest OSL data from the Przechód site (18.96±1.46 ka) presumably document the early phase of fluvio-aeolian deposition; however, the small thickness of the unit P1 excludes the correct interpretation of its origin.
Oldest Dryas (15.6−14.6 ka) – Bølling (14.6−14.1 ka) – Older Dryas (14.1−13.8 ka)
Different types of sedimentation (fluvio-aeolian and aeolian) took place simultaneously at both key sites. At the Siedliska site, sandy-silty rhythmic succession indicates fast and cyclic changes of sedimentary conditions. Horizontally laminated sand layers represent the supercritical flow of sheet floods. Wavy laminated silty lithofacies were deposited as a result of the migration of adhesion ripples along a wet surface (Schwan, 1986 and Kasse, 1997, 2002). This sandy-silty rhytmite is interpreted as a result of fluvioaeolian deposition. At the Przechód site, inclined stratified sands with climbing ripples at the bottom are interpreted as a distal part of migrating aeolian dune (Pye and Tsoar, 2009). Climbing ripples indicate their reverse migration at the foot of the dune slope (Fedorowicz and Zieliński, 2009). The palaeocurrent measurements suggest transport of material towards the NE. This direction indicates that it could be a small moving transversal dune or even a barchan (compare Zieliński, 2016).
There are no dated sediments between 17.5 and 15.5 ka. This may be interpreted as a stratigraphic gap caused by subsequent erosion or non-depositional conditions. This gap can be correlated with the Beuningen Gravel Bed, a marker horizon widely described from the Netherlands and Belgium. This unconformity is overlaid by a deflation pavement and represents a similar time dated at 18−15 ka (Bateman and Van Huissteden, 1999; Kasse et al., 2007; and Vandenberghe et al., 2013). OSL dates from units S-3 and P-3 reveal similar ages 14.88±1.11 ka–13.21±1.04 ka (Table 2). This, in all likelihood, suggests lateral difference and the co-existence of two types of sedimentary environments. What is interesting is that younger dates suggest ongoing sedimentation in generally dry conditions without preserved palaeosol of Bølling age. Remnants of Bølling palaeosol are presumably visible in the upper part of palaeosol of the Przechód site. This may be explained in two ways: (i) erosion of Bølling age palaeosol during the Older Dryas (Przechód site) and (ii) continuation of sedimentary processes through the entire Bølling interstadial up to the Older Dryas due to unfavorable conditions for soil processes at the Siedliska site.
Allerød interstadial (13.8-12.9 ka)
Climate amelioration during Allerød interstadial is expressed by palaeosol horizon in both the key sites. However, palaeosols represent different types of morphology. Palaeosol from the Przechód site is two-fold with sandy layer in-between (Fig. 3F). Soil layers have different thicknesses and reversed 14C dates (Table 2). This is interpreted as being a result of colluvial processes on the distal dune slope and redeposition due to washing out of organic matter. Therefore, it is possible to interpret this as soil of colluvial type, whereas palaeosol in the Siedliska site does not reveal disturbances. The palaeosol from the Siedliska site correlate with Usselo soil type (Kasse 1997 and Vandenberghe et al., 2004). The results of radiocarbon dating allow us to correlate the studied palaeosols with Allerød age. For Allerød interstadial, soil-formation processes are widely described with regard to Central and Western Europe (Manikowska, 1991; Derese et al., 2009; Vandenberghe et al., 2013; and Dzieduszyńska, 2019).
Younger Dryas (12.9−11.6 ka)
During the last climate cooling of the Younger Dryas, aeolian sedimentary processes prevailed in both the key sites. Large-scale inclined stratified sands are interpreted as a deposition on the distal slope of the aeolian dune. Here, the transverse transport of material played a significant role. Such conditions prevail at the distal part of parabolic dune or its branches (Mc Kee, 1966; Borówka, 1990; Pye and Tsoar, 2009; and Zieliński, 2016). Climbing ripples observed on the distal slope (Figs. 2B and 3H), within P-4 unit, confirm our interpretation. Taking this fact into account as well as the location of the outcrop at the branch of a compound dune (Fig. 1C), it is possible to surmise that deposition took place as a result of WNW and NW wind directions.
The OSL ages obtained from S-4, S-5 and P-4 units allowed for dating of investigated sediments within the Younger Dryas (Fig. 5). This was the main phase of aeolian activity and dune formation within the area being studied. The results are in good agreement with the stratigraphic scheme from Central and Western Europe (Bohncke et al., 1993, 1995; Manikowska, 1995; Isarin et al., 1997; and Zieliński, 2016). Aeolian sedimentation finished at the end of the Younger Dryas. There is no proof of the reactivation of aeolian processes in the area under study during the Holocene.
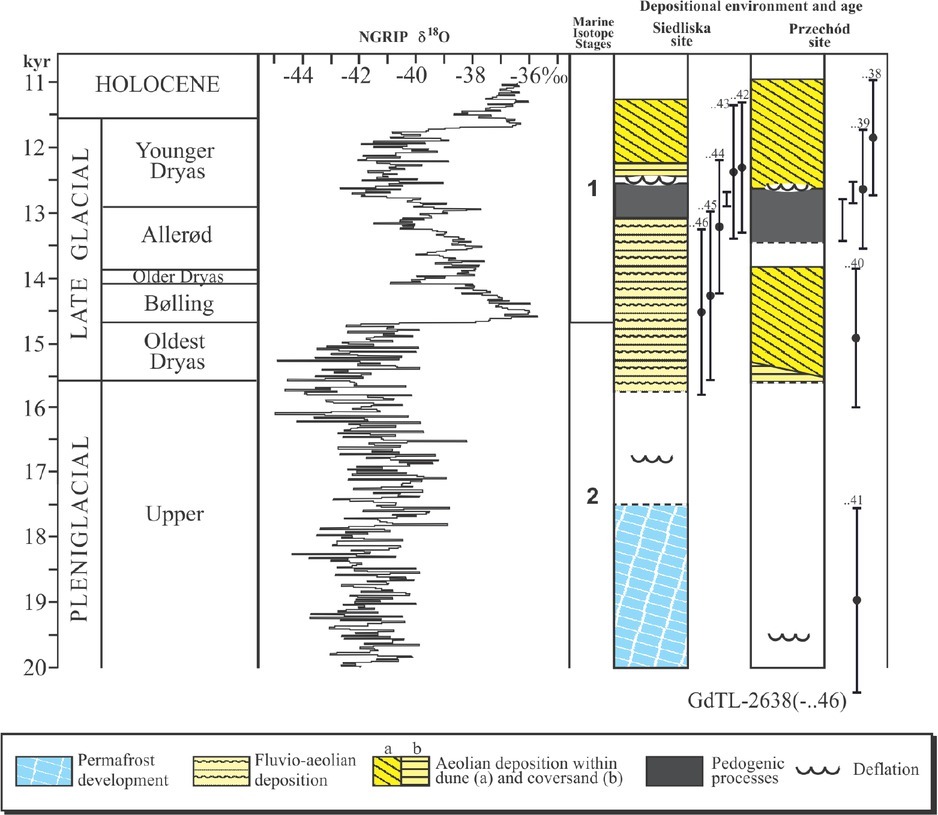
Fig 5
Model of environmental changes at the turn of Weichselian Pleniglacial and Late Glacial; 18O/16O ratio after Rasmussen et al. (2014), chronostratigraphy after Vandenberghe et al. (2013).
. Discussion
The studies performed provided a stratigraphic model for sedimentary succession. The results provide a stratigraphic succession. Sedimentation took place in the final part of Late Pleniglacial and Late Glacial. However, direct absolute data was not obtained from periglacial structures of the Siedliska site, where size and frequency make it possible to be compared and correlated with LPM (Vandenberghe et al., 2014). During LPM, vast areas of Central European Plains were subject to permafrost, mainly of the continuous type. The amelioration of the climate at the very end of the Late Pleniglacial reorganized different types of terrestrial sedimentary environments. This is distinctly expressed in
fluvial succession (Erkens et al., 2011; Starkel et al., 2015; and Zieliński et al., 2019). The ongoing process of permafrost degradation after 17 ka caused the incision of rivers, the over-drying of upper terraces and the release of a large amount of sand. This process connected with predominance of western wind direction was responsible for the development of fluvio-aeolian succession (Kasse, 2002).
The beginning and finish of fluvio-aeolian sedimentation in Western Europe took place during the Late Pleniglacial. In the Netherlands fluvio-aeolian deposits are described after Van der Hammen (1971) as Older Coversand I and dated between 20−17 ka (Bateman, Van Huissteden, 1999; Kasse et al., 2007; and Vandenberghe et al., 2013). Similar age was obtained in North Lincolnshire, UK (18−14 ka; Bateman et al., 2000) and in Nochten mine, eastern Germany (18 ka; Kasse et al., 2003). Younger dates of fluvio-aeolian sands and silts were documented in alluvial fan complex in NW Germany (Meinsen et al., 2014). Luminescence dates obtained in other sites in Poland and Western Ukraine suggest a younger age of fluvio-aeolian deposition, which developed at the very end of the Late Pleniglacial and continued to Bølling (Zieliński et al., 2014, 2015). Only in one site, Bełżec (SE Poland) fluvio-aeolian unit has age comparable to the type sites in Western Europe. The obtained results suggest that the deposition of these deposits in Poland and Western Ukraine began later than in Western Europe.
The location of study sites on interfluves is presumably the reason for the stratigraphic gap between cryogenic structure formation (LPM) and the start of fluvio-aeolian deposition. Interfluves were source areas for the most of the Late Pleniglacial, and it was only during the release of sand from upper river terraces that material was transported by the wind into these areas (Goździk, 2007).
One of the most important questions is which cold phase in the Late Glacial is mostly responsible for aeolian dune formation. Results from Western Europe reveal that pure aeolian coversand (Older coversand II) started before Bølling interstadial (Kasse et al., 2007 and Vandenberghe et al., 2013). Findings from central Poland suggest a later start of dune formation in the Oldest Dryas with the main phase taking place in the Older Dryas (Manikowska, 1995). Nevertheless, the main phase of dune formation seems to be dependent on local factors (Nowaczyk, 2000). The results presented in this article reveal that the first phase of dune formation was in the Oldest Dryas and continued through Bølling and the Older Dryas. This means that climate amelioration during Bølling was insufficient for soil formation. Aeolian processes stopped during Allerød when precipitation and mean annual temperatures were favourable for dense forest cover (Ralska-Jasiewiczowa et al. 1998). The second phase of dune formation began with rapid climate cooling after Allerød. During the Younger Dryas, dunes were overbuilt and slightly modified in their shape. The youngest OSL date (11.85±0.91 ka, GdTL-2638) documents the final stage of dune formation at the end of the Younger Dryas.
Previous models of fluvio-aeolian successions provided a scheme for comparison with data presented in the articles by Kasse (2002) and Vandenberghe et al. (2013). It was suggested, that the start of fluvio-aeolian cover deposition was asynchronous, nevertheless, preceded dune formation (Zieliński et al., 2015). What was unexpected was the fact that OSL data suggests the synchronous deposition of fluvio-aeolian and aeolian complexes at the investigated sites. This possibility needs further in-depth studies at subsequent outcrops in the area under study to provide confirmation.
. Conclusions
The present study used multi-proxy results to establish chronology and the types of depositional processes in the study area. Based on the results, several conclusions can be drawn:
A comparison of OSL and radiocarbon data reveal high compliance of dating results. Attention paid to OSL methodology shows that the elimination of 14C/ OSL discrepancies is possible.
LPM is visible in the well-developed periglacial complex at the Siedliska site. It documents the climate minimum at the Late Pleniglacial (24−17 ka).
The morphological position of the study area (interfluve) was presumably a reason for 17−15 ka stratigraphic gap.
The first phase of sediment accumulation took place in the time framework 15−13.2 ka (from the Oldest Dryas to the Older Dryas). There are no signs of a break-in sedimentation and development of soil processes during Bølling interstadial.
Fluvio-aeolian and aeolian (dune formation) activities developed at the same time in the Oldest Dryas.
Allerød warm phase is described in well-dated palaeosol of Usselo type.
The main dune formation phase took place during the Younger Dryas. Within this period, the initial low dunes were overbuilt. Climate amelioration at the beginning of the Holocene stopped aeolian processes. There is no evidence for younger aeolian activity.