

- EAER>
- Journal Archive>
- Contents>
- articleView
Contents
Citation
Article View
East Asian Economic Review Vol. 23, No. 1, 2019. pp. 55-88.
DOI https://dx.doi.org/10.11644/KIEP.EAER.2019.23.1.356
Number of citation : 8View
695
Download
503
Determinants of Trade Flows and Trade Structure between Korea and ASEAN
|
|
Vietnam Academy of Social Sciences |
|---|---|
|
|
National Dong Hwa University and Vietnam Academy of Social Sciences |
|
|
Vietnam Academy of Social Sciences |

Abstract
Our paper contributes to existing literature by empirically investigate the trade structure and trade performance between Korea and ASEAN. Overall, trade activities between Korea and almost major ASEAN economies have significantly focused on capital goods, medium and high technology goods, while the remaining ASEAN countries’ exports over Korea have been mainly primary and low technology goods. There has been a higher complementarity in between Korea’s exports and ASEAN’s imports compared with between ASEAN’s exports and Korea’s imports. Estimation results show that ASEAN’s GDP and income have larger impacts than those of Korea on aggregate trade flows as well as sectoral level between two sides. Additionally, geographical conditions are critical factors impeding Korea-ASEAN trade. Meanwhile, other factors in the estimation model have mixed impacts on components of Korea-ASEAN trade structure. Finally, there is a significant room for Korea’s trade expansion with ASEAN, particularly new and less developed members in future.
JEL Classification: B27, F1, F13, F14
Keywords
ASEAN, Gravity Model, Korea, Trade Performance, Trade Structure
I. INTRODUCTION
Following Japan, South Korea (thereafter Korea) along with Taiwan, Hong Kong and Singapore were usually cited as the most successful economic development stories and good reference models for developing countries in all over the world (Chen, 2016). With highly export-oriented economy and favorably international economic environment from the 1970s to before the Asian financial crisis 1997-1998, Korea had rapidly developed to become one of the key players in global market over electronic products and automotive products. Meanwhile, the Association of Southeast Asian Nations (ASEAN) was established since 1967 but only after the end of the so-called ‘Cold war’ period in the early 1990s, the integration process of the region was really enhanced through admitting countries having the opposite ideology such as Vietnam and Laos into the association. Since then, ASEAN has gained many achievements, particularly the establishment of the ASEAN Economic Community (AEC) in the last day of 2015 and has been recently depicted as an importantly emerging economic bloc in the region.
With respect to bilateral foreign relations, ASEAN and Korea first initiated sectoral dialogues in 1989 and two years later, Korea became a full dialogue partner of ASEAN. Especially, in 2005 Korea and ASEAN signed the Framework Agreement on Comprehensive Economic Cooperation, aiming to strengthen and foster bilateral economic, trade and investment relations between the two sides. This agreement set up a crucial basis for the signing of ASEAN-Korea free trade agreement (AKFTA) in goods, services and investment in 2006, 2007 and 2009 respectively.
On a broader scope, Korea, ASEAN and the other two largest Northeast Asian economies, namely China and Japan also set up the so-called “ASEAN plus three” that serves as a common cooperation and dialogue mechanism in East Asian region. Even further, ASEAN in cooperation with its trading partners (including Korea, China, Japan, India, Australia and New Zealand) are now negotiating an agreement on the Regional Comprehensive Economic Partnership (RCEP) with the target at stimulating economic activities in the region (Truong, 2013). All of above cooperation and interactions between ASEAN and Korea have positively contributed to the significant economic expansion between the two parties in recent decades.
Specifically, data reported from United Nations (UN) Comtrade show that total trade exchange between Korea and ASEAN has rapidly extended about 15 fold, from 8 billion United States dollar (US$) in 1989 rising to US$121 billion in 2016. As a result, Korea has currently become the fifth largest trading partner of ASEAN after China, Japan, European Union (EU) and the US, on the opposite direction ASEAN has even surpassed the US, EU and Japan to occupy Korea’s second largest trading partner after China. Despite rapid bilateral trade volume, ASEAN countries have often undergone a huge trade deficit with Korea, rising from US$3.8 billion to US$36.1 billion between 2000 and 2016.
Looking at the literature, there have been many studies examining economic relations between Korea and ASEAN countries. For example, focusing on Korea’s economic cooperation with new ASEAN member states, Tinh (2007), Cheong (2010), and Lee et al. (2015) insisted that Korea’s trade, investment and official development assistance (ODA) positively contributed to economic growth and the improvements of social conditions in those ASEAN nations. Based on data from UN Comtrade, Cheong (2011) also highlighted that the increasing trade in intermediate goods between Korea and ASEAN represents the higher integration degree between the two parties in the regional production network and regional value chains. By capitalizing gravity model, Phan and Jeong (2014) found that foreign direct investment (FDI) was among crucial elements determining the level of intra-industry trade in manufacturing between Korea and major manufacturing ASEAN countries. Through using Global Trade Analysis Project (GTAP) model, Phan and Jeong (2016) proved that FTA between Korea and Vietnam could increase the welfare, trade and investment of the two sides. On the other side, based on using trade pattern indices such as Reveal Comparative Advantage (RCA), Intra-industry trade (IIT), Trade intensity index (TII), etc., many studies such as Nam (2000, 2003), Kwon (2004), Yoon and Yeo (2007), Yoshida (2008), Tran et al. (2010), Phan and Jeong (2012), and Truong (2017) explored trade structure between East Asian countries. As a whole, these works argued that Japan, China and Korea have been still influencing trade activities and trade patterns in the region, but ASEAN countries to some extent are also increasing their roles in the regional production network.
Nevertheless, there are a few studies that deeply analyzing trade structure between Korea and all ASEAN countries, particularly new member states. In addition, little empirical research has focused on quantifying determinants of trade structure and analyzing trade potential between Korea and ASEAN nations. Thus, this present study tries to partly fulfill this gap by analyzing trade structure between Korea and ASEAN as the stages of processing, technological content, export diversification and trade complementarity since the year 2000 onwards. Especially, through employing gravity model using PPML estimator (Poisson pseudo-maximum-likelihood) proposed by Santos Silva and Tenreyro (2006), this paper identifies determinants of aggregate trade and trade structure between Korea and ASEAN countries during this period. Also relying on estimation results from gravity model, the paper discusses the trade potential and provides implications for enhancing trade activities between the two sides in the years to come.
This present paper is structured as follows. Following the introduction, Section II decomposes trade structure between Korea and ASEAN according to stages of processing, technological content, export diversification and trade complementary. Section III elaborates econometrics model and data analysis. This section is designed to show the rationale of employing gravity model with PPML estimator to quantify the determinants of trade structure and trade follows between Korea and ASEAN countries. Section IV discusses estimation results. Finally, Section V provides concluding remarks.
II. TRADE STRUCTURE
1. Stages of processing
Through observing the changes in composition of intermediate goods and capital goods, we could somewhat evaluate whether a country has moved to higher stages of production. This is because trade in intermediate goods, especially parts and components and capital goods could determine the level of sophistication of a country’s basket and its position in global production network (Gaulier et al., 2007; Athukorala, 2011). The most widely accepted and used method to analyze stages of processing in international trading relations is based on the Broad Economic Categories (BEC) classification of the United Nations. This classification bases on the principal use of goods (UNCTAD, 2015). Also basing on the end-use of products and creating the product concordance between BEC and The Harmonized Commodity Description and Coding System (HS) at 6 digit,1 the World Integrated Trade Solution (WITS) of World Bank has grouped goods into four broad categories, namely raw material, intermediates, consumer and capital products. Using the WITS, this paper explores Korea-ASEAN trade structure according to these stages of processing. The illustrated results in Figure 1 and Figure 2 show that there have been remarkable changes to the shares of each stage of processing in Korea-ASEAN commodity trade between 2000 and 2015.
With respect to ASEAN, Figure 1 demonstrates that export shares of each stage of processing to Korea market relatively differ between ASEAN member states over time. In 2000, except Indonesia, export of the largest ASEAN countries such as Singapore, Malaysia, Thailand and Philippines to Korea highly focused on capital goods with the shares ranging between nearly 50 percent and 80 percent. On the contrary, the major export proportion from new ASEAN member countries to Korea was raw materials (such as Cambodia and Laos), intermediate goods (such as Myanmar) and consumer goods (such as Vietnam). As for Indonesia and Brunei, their exports over Korea depended on consumer goods and raw material goods.
In 2015, capital goods still dominated export structure to Korea market in Singapore, Philippines and Thailand. Another striking point is there has been a growing export share of consumer goods to Korea from many other ASEAN countries, especially Cambodia, Brunei, Myanmar and Malaysia. It is worth underlining that among ASEAN economies, Vietnam has significantly improved its export structure to Korea when export share of capital goods surged to more than 30 percent in 2015 compared with below 10 percent in 2000.
Regarding Korea, it can be seen from Figure 2 that there have been notable changes taken place in its export structure over ASEAN countries between 2000 and 2015. In particular, in 2000 Korea’s export to major manufacturing ASEAN nations such as Singapore, Malaysia, Thailand and Philippines highly concentrated on capital goods, sharing between 50 percent and 75 percent. Conversely, in the same year, export from Korea to other ASEAN countries was mainly consumer goods (such as Brunei, Laos and Myanmar) or intermediate goods (such as Indonesia, Vietnam and Cambodia).
After 15 years, Korea’s export to Philippines and Singapore still focused on capital goods although its shares in 2015 were lower as compared with that in 2000. In 2015, Korea’s export to Thailand, Malaysia and Indonesia mainly relied on intermediate goods. With respect to other ASEAN nations including Myanmar, Vietnam and Laos there have been considerable rising shares of capital goods in their imports from Korea. This is understandable since those ASEAN nations have grown with a high speed in recent years which has induced the increasing import demand for capital goods, particularly machinery from Korea and other advanced economies. Additionally, the significant import shares of intermediate goods in many ASEAN economies possibly reflect Korea’s mounting investment to the region that has led to the increasing import demand of ASEAN countries over this commodity category from parent companies in Korea.
2. Technological content
Normally, export of developed countries includes a large volume of high-skill and technological-intensive goods that would create higher addition values for these economies. On the contrary, a major part of goods exported by developing countries is often primary goods and low technological goods with limited addition values (Pavitt, 1984; Lall, 2000; Hinloopen and van Marrewijk, 2008; Truong, 2016). This paper follows the classification of Lall (2000) to grasp the changes of technological content taken place in Korea-ASEAN commodity trade. Accordingly, export products at Standard International Trade Classification (SITC)-3 digit are grouped into five categories as follows: primary products; resource-based product; low technology products; medium technology products; and high technology products.
With respect to ASEAN, Figure 3 shows that its export structure to Korea has been very distinct between member states in 2000 and 2016. Given the more developed manufacturing sector, export over Korea from Malaysia, Singapore, Philippines and Thailand principally focused on high technology products, sharing between 50 percent and nearly 80 percent in 2000. At the same year, export from other ASEAN countries was mainly primary products (such as Brunei, Laos and Vietnam) and resource-based products (such as Myanmar). As for Cambodia, its export to Korea relied on both low and medium technology products.
By 2016, high technology products have been found to share the highest proportion in export of Singapore, Philippines, Thailand and Malaysia to Korea market but its shares have been much lower as compared with those in 2000. It is worth highlighting that Vietnam has remarkably enlarged its export share of high technology products to Korea, reaching nearly 40 percent in 2016 which is 30 percent higher than that in 2000. This is likely stemmed from the fast extending FDI of Korean enterprises into Vietnam’s manufacturing sector, particularly electric and electronic industries. On the other side, export of other ASEAN countries has still concentrated on primary goods (such as Laos and Brunei), or low technology products (such as Cambodia and Myanmar). As for Indonesia, the total share of primary goods and resource-based goods in its exports to Korea has accounted for 48 percent in 2016 which is much lower comparing with the share in 2000. Albeit a rising proportion of high technology products during this period, its importance to Indonesia’s total export over Korea has remained modest.
Regarding Korea’s export, Figure 4 demonstrates that in 2000 the lion’s share of its export to most of the biggest ASEAN economies, including Malaysia, Philippines, Singapore and Thailand was high technology products. At the same time, export from Korea to other ASEAN countries concentrated on low technology products (such as Laos), medium technology products (such as Brunei and Cambodia), or low and medium technology products (such as Vietnam). Interestingly, Korea’s export to Indonesia equally divided into resource-based products, low technology products and medium technology products. As for 2016, there are also differences in Korea’s export structure to ASEAN countries. In particular, Korea’s exports to Brunei, Laos, Malaysia, Philippines, Singapore and Vietnam have been mainly medium and high technology products. Meanwhile, at the same year there has been an increasing export share of low technology products from Korea to Cambodia, Indonesia and Myanmar.
All in all, except Indonesia, between 2000 and 2016, Korea’s trade with major manufacturing ASEAN economies has been primarily medium and high technology products. This possibly indicates Korea and those economies have become each other’s important trading partner over regional production network in sophisticated manufactures as well as this somewhat reflects the rapid industrialization course taken place in many ASEAN countries in recent decades.
3. Export diversification
Next examined dimension in this study is export diversification that is arguably important for countries especially developing economies to be able to minimize negative impacts from external shocks (Chandra et al., 2007). This paper employs Herfindahl-Hirschman index-HHI (1964), which is an index used for measurement of export product concentration, to reveal the oppostite denfition, namely export diversification between Korea and ASEAN. Accordingly, the HHI is caculated as follows:

where: HHIij is the export concentration index of export from country i (Korea) to partner country j (ASEAN countries);
With respect to ASEAN’s export, it can be observed from Table 1 that over the period of 2000-2014, the least developed ASEAN member states such as Laos and Myanmar and the countries that highly depend on exports of raw materials such as Brunei have revealed a highly specialized export structure over Korea market. It is worth emphasizing that between 2000 and 2014, export concentration of Malaysia and Singapore over Korea fluctuated but the overall trend was up. Conversely, there has been an improvement of export diversification of Philippines, Thailand and Cambodia to Korea over time. As for Indonesia, its export concentration to Korea had remained insignificant changes during this period. Among ASEAN nations, Vietnam and Thailand have had the most diversified export structure to Korea from the past decade. Those results are compatible with analyses mentioned above when export of Vietnam and Thailand has not so focused on several categories like capital goods and high technology products in cases of Singapore and Philippines or primary goods and low technology products in cases of Brunei and Myanmar.
Regarding Korea’s export, Table 2 shows that its export concentration to ASEAN has been relatively various between ASEAN member countries over 2000-2014. Specifically, export structure from Korea to Vietnam, Thailand and Myanmar has been diversified with its HHI remaining below 0.2 throughout this studied period. On the contrary, Korea’s export to Brunei, Singapore and Laos has shown a highly specialized structure over time. The similar pattern could be found in export from Korea to Indonesia. Meanwhile, Korea’s export to Malaysia and Philippines has been also specialized but its concentration level has a decreasing tendency. Broadly speaking, Korea’s export structure has increasingly specialized with Brunei, Indonesia and Laos since as stated the import demand of those economies for capital goods embodied with higher technology from Korea has been on the rise over time.
4. Trade complementarity
From classical trade theory perspective, when the trade structure between the two countries is principally complementary (or natural trading partners) then there would have a high potential for trade expansion between them, whereas if this trade pattern is primarily competitive, there could have little space for trade growth between the two sides (Reis and Farole, 2012). Following this literature, to measure the trade complementarity between Korea and ASEAN, this paper employs the trade complementarity index (TCI) at SITC-3digit from the research of Michaely (1996) and is calculated as below:

where Xni is the share of goods n in total exports of country i to the world, while Mnj is the share of goods n in total imports of country j from the world. The TCI takes value between zero and unity. The index equals zero when no product exported by one country is imported by the other, whereas it takes unity when the export and import shares are perfectly matched. In terms of practical implication, a high TCI index possibly reveals that two countries would stand to gain from increased trade, as well as could be especially useful in assessing prospective bilateral or regional trade agreements, or similar cooperation initiatives.
Taking ASEAN countries as exporters and Korea as importer, Table 3 provides information on the changes of the TCI between the two parties from 2000 to 2013. Overall, ASEAN countries’ export structure has exposed a low compatibility with Korea’s import although excluding Indonesia, Singapore and Thailand, trade complementarity between export of the remaining ASEAN economies and import of Korea has increased over time. Another striking point is that the TCI between exports of Malaysia with Korea’s import has remained the highest values during studied period. One implication draw is that among ASEAN countries, Malaysia’s export sector has the greatest potential to gain from trade with Korea if trade barriers between the two economies are significantly removed in future.
Considering Korea as exporter and ASEAN countries as importers, it can be seen from Table 4 that over the last decade, Korea’s export has fit well with most ASEAN countries’ import. For example, Korea’s export has shown the highest compatibility over import of Malaysia, Vietnam and Indonesia with the TCI between those economies ranging from 0.577 to 0.608. Vietnam and Laos are also countries that the trade complementarity between their import and Korea’s export has revealed the greatest improvements from 2000 to 2013. On the contrary, trade complementarity between import of Singapore, Philippines, Thailand and Myanmar with Korea’s export has demonstrated a decreasing trend over time.
On the whole, it can be argued from Table 3 and Table 4 that the complementarity level between Korea’s export and ASEAN’s import has been higher than that of between ASEAN’s export and Korea’s import. Those figures to some extent explain why Korea’s export to ASEAN has expanded much faster than ASEAN’s export to Korea during the last decade. In addition, it could be insisted that there would have a higher potential for Korea to raise its export value over ASEAN countries, particularly the largest ASEAN economies providing that the economic linkages between the two sides could be more reinforced in future, especially via signing bilateral FTAs between Korea and these ASEAN nations.
1)See the product concordance table between BEC and HS at
III. ECONOMETRICS MODEL AND DATA ANALYSIS
1. Econometrics Model
1) Conventional gravity model
The conventional gravity model in econometrics was stemmed from Newton’s Law of universal gravitation in physics that subjects are proportional to their masses and inversely proportional to distance between them. Tinbergen (1962) is the first economist applying gravity model to estimate the relation between scale of economy, distance, and their trade degree. Then, there have been a number of scholars using the model time and again to examine bilateral trade flows between partners.
The conventional gravity model in international trade takes a form as below:

where, Tij indicates trade flows from origin country i to destination countries j (usually denoted flows of exports, imports, total trade, or those components at sector level). Yi, Yj present economic size of two observed states (normally defined as gross domestic products or gross national products). Dij is physical distance between two countries. And, G is the gravitational constant.
Equation (1) of gravity model is not linear, then we must transform it into a form of linear equation. By simply taking the natural logarithms, equation (1) then can be rewritten as follows:

In literature, there are a huge range of modifications being incessantly developed and massively applied from original gravity model. One of the most popular derivations is a variation gravity equation proposed and developed by Anderson and van Wincoop (2003). Authors argue that the conventional gravity equation is biased because of not taking multilateral resistance terms into account. By being augmented with multilateral resistance terms, the formula of gravity model can be presented as follows:

where a0 is constant, Rij is trading multilateral resistances, πij is dummy variables, and eij is a random error term.
2) Estimate gravity equation
To analyze trade flows between South Korea and ASEAN, this paper uses an augmented gravity model proposed by Anderson and van Wincoop (2003). The estimate gravity equation takes a form as follows:

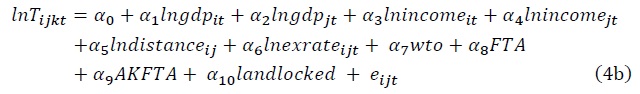
where, Tijt is bilateral trade flows between original country i (Korea) and destination country j (nations of ASEAN) in year t in which trade will be treated separately as exports and imports at aggregate level, while Tijkt denotes that of components at k sub-sectoral level. Variables gdp and income indicate in turn gross domestic products and per capita income. Variable distance is geographical distance between capital of South Korea and each nation of ASEAN, while variable exrate presents foreign exchange rate between national currencies. Variable wto presents the participation of Korea and ASEAN countries in World Trade Organization. Dummy variables of FTA and AKFTA denote legitimate status of free trade agreement between Korea and each country of ASEAN and whole ASEAN respectively, while variable represents landlocked economies. Finally, eij is error term.
The origin gravity with gravitas model developed by Anderson and van Wincoop (2003) has not inserted directly exchange rate as a specific variable, however the model also implies that variable of exchange rate can be used as a proxy of multilateral resistances on trade. The empirical studies show that there is a relatively close correlation between the volatility of exchange rate and the performance of trade flows among countries, of which an undervaluation of currency could advance exports, simultaneously restrict imports (Adam and Cobham, 2007; Nicita, 2013; Anderson, Vesselowsky and Yotov, 2013). Thus, it is rational to take variable of real exchange rate into account to strengthen more explanation capacity of estimated gravity equation.
2. Estimation Issues
Theoretically, some factors affect positively flow of imports while negatively impact its exports such as exchange rate. Theoretical foundation and practices on gravity model also indicate that estimated results would be better if trade flows are treated separately as imports and exports. Hence, we perform analysis of trade between Korea and ASEAN on both ways of aggregate trade and each of its component.
In this research, panel data is employed as a framework for estimation of gravity equation. Advantage of using panel data is that it can partially mitigate bias caused by unobserved heterogeneity across countries and determine individual effects of undetectable variables (Egger, 2002; Bacchetta et al., 2012; Gómez-Herrera, 2013). As quoted by Baltagi (2013), panel data is “to give more informative data, more variability, less collinearity among variables, more degrees of freedom and more efficiency”. According to Bacchetta et al. (2012), when working with gravity equation, heterogeneous observations in many ways can probably damage assumption of homoscedasticity of error terms. Naturally, the presence of heteroskedasticity is as characteristic of cross-section data that is theoretically unavoidable in estimation of gravity equation. And, of course this problem could lead to inefficiency in interpretation of estimated results.
Gravity equation (4a) and (4b) are augmented by multilateral resistance terms in which those variables are not directly observed. So, estimating gravity equation for those cases require non-linear least square (NLS) estimator. Some applied researchers have used NLS to estimate multiplicative model, but it is likely very arguable because of ignoring presence of heteroskedasticity. Anderson and van Wincoop (2003) suggest that one of solutions to remedy biased estimates of log-linearized models by OLS is to use individual (country or firm) fixed effects for importers and exporters. However, Santos Silva and Tenreyro (2006) argue that fixed effects gravity equation is multiplicative model (in some cases raising the problem of zero trade), so estimating equation of log-linearized model in the existence of heteroskedasticity could come up with biased results. To solve this problem, Santos Silva and Tenreyro (2006) proposed a technique of using a PPML estimator (Poisson pseudo-maximum-likelihood). By developing theoretical foundation for estimating gravity equation and practicing successfully empirical experiments, Santos Silva and Tenreyro (2006) demonstrated that PPML estimator is likely to be more appropriate than other methods estimated by OLS and NLS. With further simulation evidence, Santos Silva and Tenreyro (2011) once again confirmed that the performance of PPML estimator is more consistent in estimating gravity equation. Additionally, to test the accuracy of estimated model, Ramsey test will be operated to check the appropriate estimator of the restricted expectation (Santos Silva and Tenreyro, 2006).
3. Data Analysis
The data inserted to estimate in the paper is compiled a panel dataset containing variables of trade flows, GDP, income per capita, distance, exchange rate, FTA, AKFTA, WTO and landlocked between Korea and ten nations of ASEAN over period of 2000-2015 (see Table 5 for descriptive statistics of variables). The figures of trade flows including exports and imports between Korea and ASEAN presented in US$ are obtained from UN Comtrade database. Data on the GDP and income per capita of Korea and ASEAN countries expressed in US$ are taken from the database of the World Development Indicators and The World Bank. Variable of GDP acts as a proxy of size of economy while variable of income is representative for magnitude and purchasing power of market. In theory, bigger economies and more powerful markets trend to trade more together due to increasing effects of both supply and demand on products, thus variables GDP and income per capita are expected to have positive signs.
In gravity model, distance is considered as a proxy of transportation costs and determined by point-to-point distance between two capital cities of the two trading partners or two countries. Since a further distance represents higher costs for transportation, variable DIS calculated by distance in kilometers from capital Seoul of Korea to each capital of ASEAN member countries performs as an impediment of bilateral trade. Data on distance are retrieved from GeoDist and CEPII.
Data on exchange rate are compiled from Official Exchange Rate, The World Bank and presented in US$. In literature, an appreciation of exchange rate could contribute positively to import flows while harm relevantly to degree of export volume; otherwise a depreciation of that would act vice versa. So, exchange rate between currencies of Korea and each nation of ASEAN would be considered as an important factor in elucidating bilateral trade flows among them. Because exchange rates of Korea currency to national currency units of ASEAN are not officially directly quoted, thus exchange rate is determined indirectly by taking annual average exchange rate of US$ to unit of Korea’s currency divided by annual average exchange rate of US$ to currency units of ASEAN.
Becoming a member of WTO is argued to help foster trade transactions and foster activities of foreign trade. So, variables WTO is believed to hold positive signs, and take value of 1if Korea and members of ASEAN are jointly official members of the WTO, other options hold value of 0. Information on members of WTO is retrieved from the official website of this organization.
The inclusion of dummy variable FTA is on the one hand to improve the reliability of estimation results, on the other hand to control biased issues arisen behind the model. It is believed that FTA could intensify bilateral trade activities between countries thanks to the easier access to the market of each party. Thus, the embracement of variable FTA aims to catch individual effects of FTA between Korea and each country of ASEAN; while dummy variable AKFTA is taken into consideration to control effects of a FTA between Korea and whole ASEAN nations on trade flows of the two sides. The dummy variables take value of unity if joining FTA, otherwise zero.
Finally, being limited access to the sea is seen among the largest obstacles for landlocked countries to convey goods from factories to destinations (ports, delivery hub or importing countries) (Raballand, 2003). Thus, landlocked dummy is expected to hold negative signs.
In terms of trade structure, the effect of GDP, income, exchange rate, wto, AKFTA, FTA on components of trade between Korea and ASEAN would be mixed. This is likely because there are the huge economic and social gaps existing between ASEAN member states. In particular, Singapore and Brunei are high-income economies; Thailand, Indonesia and Philippines are middle and up-middle income ones; by while Vietnam, Laos, Cambodia and Myanmar are still low-middle or low-income countries. Meanwhile, geographical variables such distance and landlocked are supposed to negatively components of trade between Korea and ASEAN countries as well as within ASEAN member states.
IV. ESTIMATION RESULTS
1. Estimation results for aggregate trade
Based on the outcomes of Ramsey test shown in second-last row of Table 6, it is practically clear that estimating the gravity equation under approach of PPML estimator is likely more accurate than under that of OLS specification. In addition, Ramsey test results for separate trade flows in each sector in Table 7, 8, 9 and 10 also present that PPML estimator is suitable.
It can be seen from Table 6 that Korea-ASEAN trade is positively determined by economic scale and economic development level of ASEAN countries while the coefficients for Korea’s economic influences are statistically insignificant. In particular, one percent of positive change of ASEAN’s GDP and income could in turn create a growth of 0.63 percent and 0.42 percent of Korea’s export to ASEAN while the figures for Korea’s imports are 0.73 percent and 0.60 percent, respectively.
Another element that positively contributes to trade flows is FTA between Korea and individual ASEAN member states, namely Singapore and Vietnam. One important implication could be draw from this is to enhance trade exchange in future Korea should put more efforts to establish bilateral FTAs and member states of ASEAN. Meanwhile, there is no evidence supporting hypothesis that AKFTA as well as the participation in WTO have ability to facilitate trade activities between the two sides since the coefficients of those variables are statistically insignificant. As noted, the reason why AKFTA and WTO fail to be statistically significant may be due to the large economic and social gap existing between Korea and ASEAN countries as well as within ASEAN member states.
On the contrary, variable of landlocked is found to negatively influence both export and import between Korea and ASEAN countries because those coefficients are both statistically significant. At a lower level, variable distance is also found to impede Korea-ASEAN trade exchange. These imply that Korea and ASEAN should have joint efforts in investing and developing hard infrastructure system, particularly ASEAN member countries to mitigate the existing geographical constraints.
2. Estimation results for components of trade structure
Along with aggregate trade, we also provide estimation for components of trade structure between Korea and ASEAN countries as technology content and stages of processing. The results are depicted in Table 7, Table 8, Table 9 and Table 10 below.
Considering technology content, in terms of exports, similar to results illustrated in Table 6, Table 7 shows that Korea’s exports to ASEAN in all level of technology content, particularly resource-based goods and high technology goods are positively determined by economic size and per capita income of ASEAN countries. The same direction could be observed in variable of exchange rate. Conversely, variables of distance and landlocked are shown to obstruct exports of Korea to ASEAN countries, especially in case of low and medium technology goods and primary goods. Those estimated outcomes also reveal that more efforts in improving infrastructure and logistic system should be realized to lower negative impacts of geographical elements on Korea’s exports to ASEAN.
On the other side, dummy variables wto and FTA have mixed effects on Korea’s exports to ASEAN, with a positive role in high technology goods, and the negative one in resource-based goods and low technology goods. This is understandable since both Korea and Singapore are advanced economies so trade between them has principally taken place in sophisticated products. As for Vietnam, Korea is among the most important investors in Vietnam and a large number of investment projects there focus on high technology sector. Given the less developed domestic industries of Vietnam, Korean companies have to significantly purchase high technological inputs from Korea or third nations. In a boarder context, this result also suggests that Korea’s exports of high technology over ASEAN market would be increased if more bilateral FTAs established between Korea and ASEAN member states.
Regarding imports, it can be pointed out from Table 8 that economic scale and per capita income of Korea have sizable effects on Korea’s imports from ASEAN countries, especially for primary goods, low technology goods and high technology goods. Also, GDP and per capita income of ASEAN positively affect its exports to Korean market, particularly high technology goods but the magnitude of importance is much lower than those of Korea. The positive contribution to ASEAN’s exports over Korea is also found in variables wto and individual FTAs between Korea and members of ASEAN. Meanwhile, variable AKFTA is shown to impede high technology goods exports whilst fostering low technology goods exports from ASEAN to Korea. This demonstrates there is still a space for ASEAN countries to promote exports of low technology products, particularly textile and garment goods to Korea market when the commitments of AKFTA are fully implemented. On the other hand, variables landlocked and distance are elements that obstruct ASEAN’s exports to Korea, especially with high technology goods.
Next, Table 9 and Table 10 illustrate estimated results for trade flows between Korea and ASEAN with a view from stages of processing. It could be affirmed that both exports and imports at all stages of processing are principally determined by economic scale and income per capita of ASEAN countries. However, the direction of impacts is different with specific stages of processing. For example, ASEAN’s per capita income has positive link with consumer goods exports and negative one with raw materials exports from Korea to this bloc. Meanwhile, Korea’s GDP and per capita income only have impact on trading flows of raw materials. It is worth noting that variable wto and individual FTAs have speed up two-way trade in capital goods. Accessing to WTO is also found to support exports of consumer goods, intermediate goods and raw materials from ASEAN to Korea. Estimated results also indicate that variable real exchange rate has positively affected Korea’s exports to ASEAN at all stages of processing. However, this element and variable AKFTA negatively affect Korea’s imports of capital goods from ASEAN countries.
Other interesting point taken from Table 9 and Table 10 is that variable distance impedes both exports and imports of Korea with ASEAN countries in nearly all stages of processing. There is only an exception for Korea’s imports of consumer goods when the coefficient of variable distance is statistically insignificant. The same as distance, estimated results show that landlocked variable has negatively affected Korea-ASEAN trade flows at almost all stages of processing, especially Korea’s exports of intermediate goods and Korea’s imports of capital goods and consumer goods. Again, those estimated results indicate that there should have measures implemented to restrict unexpected impacts stemming from geographical factors between Korea and ASEAN.
3. Trade potentials
To evaluate the trade potentials between Korea and ASEAN, this study performs an index of Average Standardized Trade Potential (ASTP) proposed by De Benedictis and Vicarelli (2005) as follows:

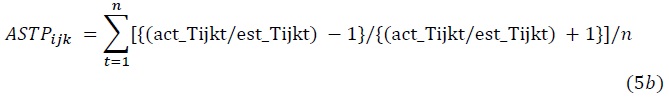
where, act_Tijt and act_Tijkt are in turn actual aggregate and sectoral exports/ imports of Korea (i) to/from ASEAN countries (j) in year t, est_Tijt and est_Tijkt are estimated figures of that obtained from gravity equation (4a) and (4b), respectively. Meanwhile, n stands for total numbers of observed years accounting for from 2000 to 2015; and k denotes sectoral trade. ASTPij and ASTPijk present the levels of aggregate and sectoral average standardized trade potential between Korea and ASEAN members during studying period, respectively; and take a value range of -1 to +1. If ASTP has value of approximately zero, exports/imports of Korea to/from ASEAN countries are expected to reach closely to the critical point. Otherwise, trade flows between Korea and ASEAN nations are untapped if ASTP is negative and overtraded for the opposite side.
We provide estimation for aggregate trade as well as for sectoral level between Korea and ASEAN countries. In terms of aggregate level, it can be seen from Table 11 that there has a significant room for export expansion of Korea to almost ASEAN economies, particular Brunei, Myanmar, Thailand and Laos. On the contrary, Korea’s exports only reveal overtraded status with Malaysia and Vietnam. Likewise, there is a significant space for extending ASEAN’s exports to Korean market, excluding Malaysia, Vietnam and Indonesia. Of which, the potential is largest in exports of Cambodia, Myanmar, Laos and Thailand. One crucial implication draw from those estimation results is that Korea-ASEAN economic cooperation should more concentrate on new and promising ASEAN economies, particularly mainland Southeast Asian countries.
Next, we estimate potential trade between Korea and ASEAN according to technology content (see Appendix 1 and Appendix 2). Regarding Korea’s exports, its exports to ASEAN countries particularly Brunei, Indonesia and less developed member nations have not achieved the predicted value at all degree of technology content. Of which, Korea’s largest export potential is mainly high technology goods. Interestingly, among ASEAN countries, Vietnam is only nation that Korea’s actual exports at all level of technology content are larger than its forecasted value. The same observation is found in Malaysia’s imports excepting resource-based goods (see Appendix 1). In terms of imports, contrary to Malaysia and Vietnam, there is a considerable room for expansion of Korea’s imports from Cambodia, Laos and Thailand at all technology level. The same assessments could be given out with exports of Myanmar (excluding low technology goods), Philippines (excluding primary goods and high technology) and Indonesia (excluding primary and resource-based goods) (see Appendix 2).
Finally, we measure trade potential between Korea and ASEAN countries as stages of processing (see Appendix 3 and Appendix 4). Regarding Korea’s exports, its export potential, at all stages of processing, has not obtained the critical value in cases of Brunei and Laos. In next years, there has also a possibility for export growth from Korea to Cambodia, Indonesia and Philippines (except consumer goods) and Singapore (except capital goods). What more is, comparing the predicted value Korea’s exports to Vietnam show overtraded status at all stages of processing. The same pattern could be taken in cases of Myanmar (excluding capital goods) and Malaysia (excluding raw materials) (see Appendix 3). With respect to imports, it is noteworthy that there is still much room for expanding Korea’s imports from Brunei, Cambodia, Laos, Myanmar and Thailand at different stages of processing. Likewise, most exports of Singapore and Philippines to Korea have not reached the critical point. By contrast, actual exports from Malaysia to Korea has been larger than predicted value at all stages of processing, especially consumer goods. The same as Malaysia, there has little space for export expansion of Indonesia and Vietnam to Korea, excluding capital goods and raw materials (see Appendix 4).
V. CONCLUDING REMARKS
Over the past decade, Korea and ASEAN have become important trading partners to each party, in which ASEAN countries have often undergone the huge trade deficit. Yet it is worth emphasizing that as long as ASEAN has processing system, imports of intermediate and capital goods from Korea would also be useful for ASEAN countries to broaden its export activities.
When analyzing the trade structure between Korea and ASEAN countries, this study explores that Korea’s export over the major ASEAN economies has significantly focused on capital goods as well as medium and high technology products. The same assessments could be given out in exports of the biggest ASEAN countries (except Indonesia) over Korea market. It is noteworthy that among ASEAN economies, Vietnam has considerably ameliorated its trade structure with Korea over time. Meanwhile, with less developed manufacturing sectors, exports of Cambodia, Laos and Myanmar to Korea have largely concentrated on primary and low technology products. In terms of diversification level, export structure between Korea with Vietnam and Thailand and vice versa have been diversified whereas there has been a highly specialized tendency in trade structure between Korea and other ASEAN’s countries. Regarding trade complementarity, trade between Korea’s export and ASEAN’s import has demonstrated a higher complementarity level as compared with between ASEAN’s export and Korea’s import.
By capitalizing gravity model using PPML estimator proposed by Santos Silva and Tenreyro (2006), this present study detects that aggregate trade flows (exports and imports) between Korea and ASEAN countries are mainly determined by economic conditions of ASEAN rather than those of Korea. Meanwhile, individual FTAs between Korea and ASEAN member nations are positive factors contributing to trade growth, however, there is no evidence found that supporting the same role of AKFTA and accessing to WTO. On the contrary, distance and landlocked are factors that impede export-import flows between the two sides. Estimation results also show the bigger role of ASEAN’s GDP and per capita income in trade flows between Korea and ASEAN under dimensions of technology content and stages of processing. It is found that accessing to WTO has relatively significant role in promoting trade in high technology goods and capital good between the two parties. On the other side, variables of exchange rate, individual FTAs and AKFTA have mixed impacts on Korea-ASEAN trade structure. Finally, variables of distance and landlocked significantly obstruct trade activities between the two sides under most stages of processing and level of technology content.
This present paper also measures the trade potential between Korea and ASEAN countries. In general, there is much room for aggregate trade expansion as well as under all level of technology content and stages of processing between Korea with new and less developed member countries such as Cambodia, Laos and Myanmar. Meanwhile, Korea’s actual trade with Malaysia and Vietnam is larger than the predicted value. Also, estimation results for technology content and stages of processing show mixed pictures of Korea’s trade potential with Singapore, Philippines, Thailand and Indonesia.
The fundamental challenge for both Korea and ASEAN in years to come is how to create a new motivation for bilateral economic, trade and investment relations between the two regions when the positive impacts of AKFTA and other current cooperation programmes are likely fading away. In response to this challenge, this study proposes that Korea should continue to negotiate and sign bilateral FTAs with individual ASEAN countries. Thus, more trading promotion events between Korea and ASEAN, under both government level and local level should be organized, which would help the two sides to understand more about each other’s market and the large potential benefits from lowering trade barriers. The economic cooperation programs between the two are suggested to focus more on new and promising ASEAN markets, particularly mainland Southeast Asian nations because the trade potential between Korea and those countries is still significant. Many ASEAN countries are still low-income economies so there is a high input demand for developing domestic industries, especially machinery, parts and components from Korea and other advanced nations. Those suggestions have been increasingly feasible when Korea, under Moon Jae-in administration, has been implementing the New Southward Policy since November 2017, with the aim of lifting trade volume between Korea and ASEAN to US$ 200 billion during the next 5 years. It is believed that under this initiative, Korean enterprises will continue to expand its investment in ASEAN market which in turn raises the demand for purchase of machinery, parts and components from parent companies in Korea or ASEAN’s local suppliers. In addition, efforts to improve income and mitigate disadvantage caused by geographical elements between Korea and ASEAN countries should be top priorities in the coming years, particularly through enhancing investment on hard and soft infrastructure systems and educational system, coupled with speeding up trade reforms especially in less developed ASEAN countries. If successfully, these could positively contribute to promoting Korea-ASEAN aggregate trade as well as moving the trade pattern between the two sides to a more advanced one.
Tables & Figures
Figure 1.
ASEAN’s Export to Korea as the Stages of Processing

Note: Authors’ estimation using the WITS of the World Bank.
Figure 2.
Korea’s Export to ASEAN as the Stages of Processing

Note: Authors’ estimation using the WITS of the World Bank.
Figure 3.
ASEAN’s Export to Korea as the Technological Content

Note: Authors’ estimation using UN Comtrade Database.
Figure 4.
Korea’s Export to ASEAN as the Technological Content

Note: Authors’ estimation using UN Comtrade Database.
Table 1.
ASEAN’s Export Concentration to Korea

Note: Authors’ estimation using UNCTAD Database.
Table 2.
Korea’s Export Concentration to ASEAN

Note: Authors’ estimation using UNCTAD Database.
Table 3.
Trade Complementarity between ASEAN's Export and Korea’s Import

Note: Authors’ estimation using UNCTAD Database.
Table 4.
Trade Complementarity between ASEAN's Import and Korea’s Export

Note: Authors’ estimation using UNCTAD Database.
Table 5.
Descriptive Statistics

Table 6.
Determinants of Korea’s Total Exports and Imports with ASEAN

Legend: * p<0.05; ** p<0.01; *** p<0.001
Table 7.
Determinants of Korea’s Exports to ASEAN as Technology Content

Legend: * p<0.05; ** p<0.01; *** p<0.001
Table 8.
Determinants of Korea’s Imports from ASEAN as Technology Content

Legend: * p<0.05; ** p<0.01; *** p<0.001
Table 9.
Determinants of Korea’s Exports to ASEAN as Stages of Processing

Legend: * p<0.05; ** p<0.01; *** p<0.001
Table 10.
Determinants of Korea’s Imports from ASEAN as Stages of Processing

Legend: * p<0.05; ** p<0.01; *** p<0.001
Table 11.
Trade Potential between Korea and ASEAN Countries

Close (-) and (+) show bilateral trade approached the critical point from under-traded and over-traded sides, respectively; while Untapped denotes bilateral trade still had more room for trade
Appendix 1.
Korea’s Export Potential to ASEAN According to Technology Content

Appendix 2.
Korea’s Import Potential from ASEAN According to Technology Content

Appendix 3.
Korea’s Export Potential to ASEAN According to Stages of Processing

Appendix 4.
Korea’s Import Potential from ASEAN According to Stages of Processing

References
- Adam, C. and D. Cobham. 2007. Modelling Mutilateral Trade Resistance in a Gravity Model with Exchange Rate Regimes. The CDMA Conference Series, no. 0702, Centre for Dynamic Macroeconomic Analysis.
-
Anderson, J. E. and E. van Wincoop. 2003. “Gravity with Gravitas: A Solution to the Border Puzzle,”
American Economic Review , vol. 93, no.1, pp. 170-192.
- Anderson, J. E., Vesselovsky, M. and Y. V. Yotov. 2013. Gravity, Scale and Exchange Rates. NBER Working Paper, no. 18807.
-
Athukorala, P. C. 2011. “Production Networks and Trade Patterns in East Asia: Regionalization or Globalization?,”
Asian Economic Papers , vol. 10, no. 1, pp. 65-95.
-
Bacchetta, M., Beverelli, C., Cadot, O., Fugazza, M., Grether, J. M., Helble, M., Nicita, A. and R. Piermartini. 2012.
A Practical Guide to Trade Policy Analysis . Geneva: WTO Publications. -
Baltagi, B. H. 2013.
Econometric Analysis of Panel Data, 5th Edition . Chichester, West Sussex: John Wiley & Sons, Inc. - Chandra, V., Boccardo, J. and I. Osorio. 2007. “Export Diversification and Competitiveness in Developing Countries.” Unpublished. Washington, D.C: World Bank.
-
Chen, P. 2016. “Lessons from Taiwan’s Economic Development,”
Orbis: A Journal of World Affairs , vol. 60, no. 4, pp. 515-530.
-
Cheong, J. 2010. Korea’s Economic Cooperation with CLMV Countries: Vietnam Case. In Kagami, M. (ed.)
Japan and Korea with the Mekong River Basin Countries . Bangkok: IDE-JETRO. pp. 121-163. -
Cheong, J. 2011. Korea’s Intermediate Goods Trade with ASEAN. In Kagami, M. (ed.)
Intermediate Goods Trade in East Asia: Economic Deepening through FTAs/EPAs . Bangkok: IDE-JETRO. pp. 119-162. -
De Benedictis, L. and C. Vicarelli. 2005. “Trade Potentials in Gravity Panel Data Models,”
B. E. Journal of Economic Analysis & Policy , vol. 5, no.1, pp. 1-33. -
Egger, P. 2002. “An Econometric View on the Estimation of Gravity Models and the Calculation of Trade Potentials,”
World Economy , vol. 25, no. 2, pp. 297-312.
-
Gaulier, G., Lemoine, F. and D. Ünal-Kesenci. 2007. “China’s Integration in East Asia: Production Sharing, FDI & High-tech Trade,”
Economic Change and Restructuring , vol. 40, no. 1-2, pp. 27-63.
-
Gómez-Herrera, E. 2013. “Comparing Alternative Methods to Estimate Gravity Models of Bilateral Trade,”
Empirical Economics , vol. 44, no. 3, pp. 1087-1111.
-
Hinloopen, J. and C. van Marrewijk. 2008. “Empirical Relevance of the Hillman Condition for Revealed Comparative Advantage: 10 Stylized Facts,”
Applied Economics , vol. 40, no. 18, pp. 2313-2328.
-
Hirschman, A. O. 1964. “The Paternity of an Index,”
American Economic Review , vol. 54, no. 5, pp. 761-762. -
Kwon, Y. 2004. “Toward a Comprehensive Partnership: ASEAN-Korea Economic Cooperation,”
East Asian Review , vol. 16, no. 4, pp. 81-98. -
Lall, S. 2000. “The Technological Structure and Performance of Developing Country Manufactured Exports, 1985‐98,”
Oxford Development Studies , vol. 28, no. 3, pp. 337-369.
-
Lee, C. L., Hong, S. J. and D. Y. Youn. 2015.
ASEAN-Korea Relations: Twenty-five Years of Partnership and Friendship . Seoul: Nulmin Books Publishers. - Michaely, M. 1996. Trade Preferential Agreements in Latin America: An Ex-ante Assessment. World Bank Policy Research Working Paper, no. 1583.
- Nam, S. Y. 2000. Competition and Complementarity in Northeast Asian Trade: Korea’s Perspective. Korea Institute for International Economic Policy Working Paper, no. 200-02.
- Nam, S. Y. 2003. Trade Structure and Complementarity among APEC Member Economies. Korea Institute for International Economic Policy APEC Study Series, no. 03-01.
- Nicita, A. 2013. Exchange Rates, International Trade and Trade Policies. UNCTD-PIITC Study Series, no. 56.
-
Pavitt, K. 1984. “Sectoral Patterns of Technical Change: Towards a Taxonomy and a Theory,”
Research Policy , vol. 13, no. 6, pp. 343-373.
- Phan, T. H. and J. Y. Jeong. 2012. An Analysis of Korea-Vietnam Bilateral Trade Relation. MPRA Paper, no. 48312.
-
Phan, T. H. and J. Y. Jeong.2014. “An Empirical Analysis of Intra Industry Trade in Manufactures between Korea and ASEAN,”
Journal of Economic Studies , vol. 41, no. 6, pp. 833-848.
-
Phan, T. H. and J. Y. Jeong.2016. “Potential Economic Impacts of the Vietnam-Korea Free Trade Agreement on Vietnam,”
East Asian Economic Review , vol. 20, no. 1, pp. 67-90.
-
Raballand, G. 2003. “Determinants of the Negative Impact of Being Landlocked on Trade: An Empirical Investigation Through the Central Asian Case,”
Comparative Economic Studies , vol. 45, no. 4, pp. 520-536.
-
Reis, J. G. and T. Farole. 2012.
Trade Competitiveness Diagnostic Toolkit . Washington DC: World Bank. -
Santos Silva, J. M. C. and S. Tenreyro. 2006. “The Log of Gravity,”
Review of Economics and Statistics , vol. 88, no. 4, pp. 641-658.
-
Santos Silva, J. M. C. and S. Tenreyro. 2011. “Further Simulation Evidence on the Performance of the Poisson Pseudomaximum Likelihood Estimator,”
Economics Letters , vol. 112, no. 2, pp. 220-222.
-
Tinbergen, J. 1962.
Shaping the World Economy: Suggestions for an International Economic Policy . New York: The Twentieth Century Fund. -
Tinh, L. D. 2007. ASEAN-Korea Co-operation in the Development of New ASEAN Members. In Leong, H. K. (ed.)
ASEAN-Korea Relations: Security, Trade and Community Building . Singapore: ISEAS Publishing. pp. 103-110. -
Tran, N. K., Lee, H. R. and Y. Heo. 2010. “Dynamic Patterns of Korea-Vietnam Trade Relations,”
International Area Studies Review , vol. 13, no. 2, pp. 257-279.
-
Truong, Q. H. 2013. “The Formation of Regional Comprehensive Economic Partnership Agreement and Some Issues for ASEAN,”
Southeast Asian Studies , vol. 156, no. 3, pp. 14-21. (in Vietnamese) -
Truong, Q. H. 2016. “Technological Structure in Vietnam-Thailand Bilateral Trade Relations,”
Vietnam’s Socio- Economic Development , vol. 85, no. 1, pp. 42-50. -
Truong, Q. H. 2017. “The Structure of Commodity Trade between Thailand and Vietnam (2004-2013),”
Rian Thai: International Journal of Thai Studies , vol. 10, no. 1, pp. 73-97. -
United Nations Conference on Trade and Development (UNCTAD). 2015.
Key Statistics and Trends in International Trade . Geneva: UNCTAD. -
Yoon, Y. M. and T. D. Yeo. 2007. “Trade Structures and Relations among China, Japan, and Korea,”
Journal of the Korean Economy , vol. 8, no.1, pp. 121-145. - Yoshida, Y. 2008. Intra-industry Trade between Japan and Korea: Vertical Intra-industry Trade, Fragmentation and Export Margins. Kyushu Sangyo University Discussion Paper, no. 32.