
Excluding Large Wild Herbivores Reduced Norway Spruce Dominance and Supported Tree Species Richness in a Young, Naturally Regenerated Stand


Abstract
:1. Introduction
2. Materials and Methods
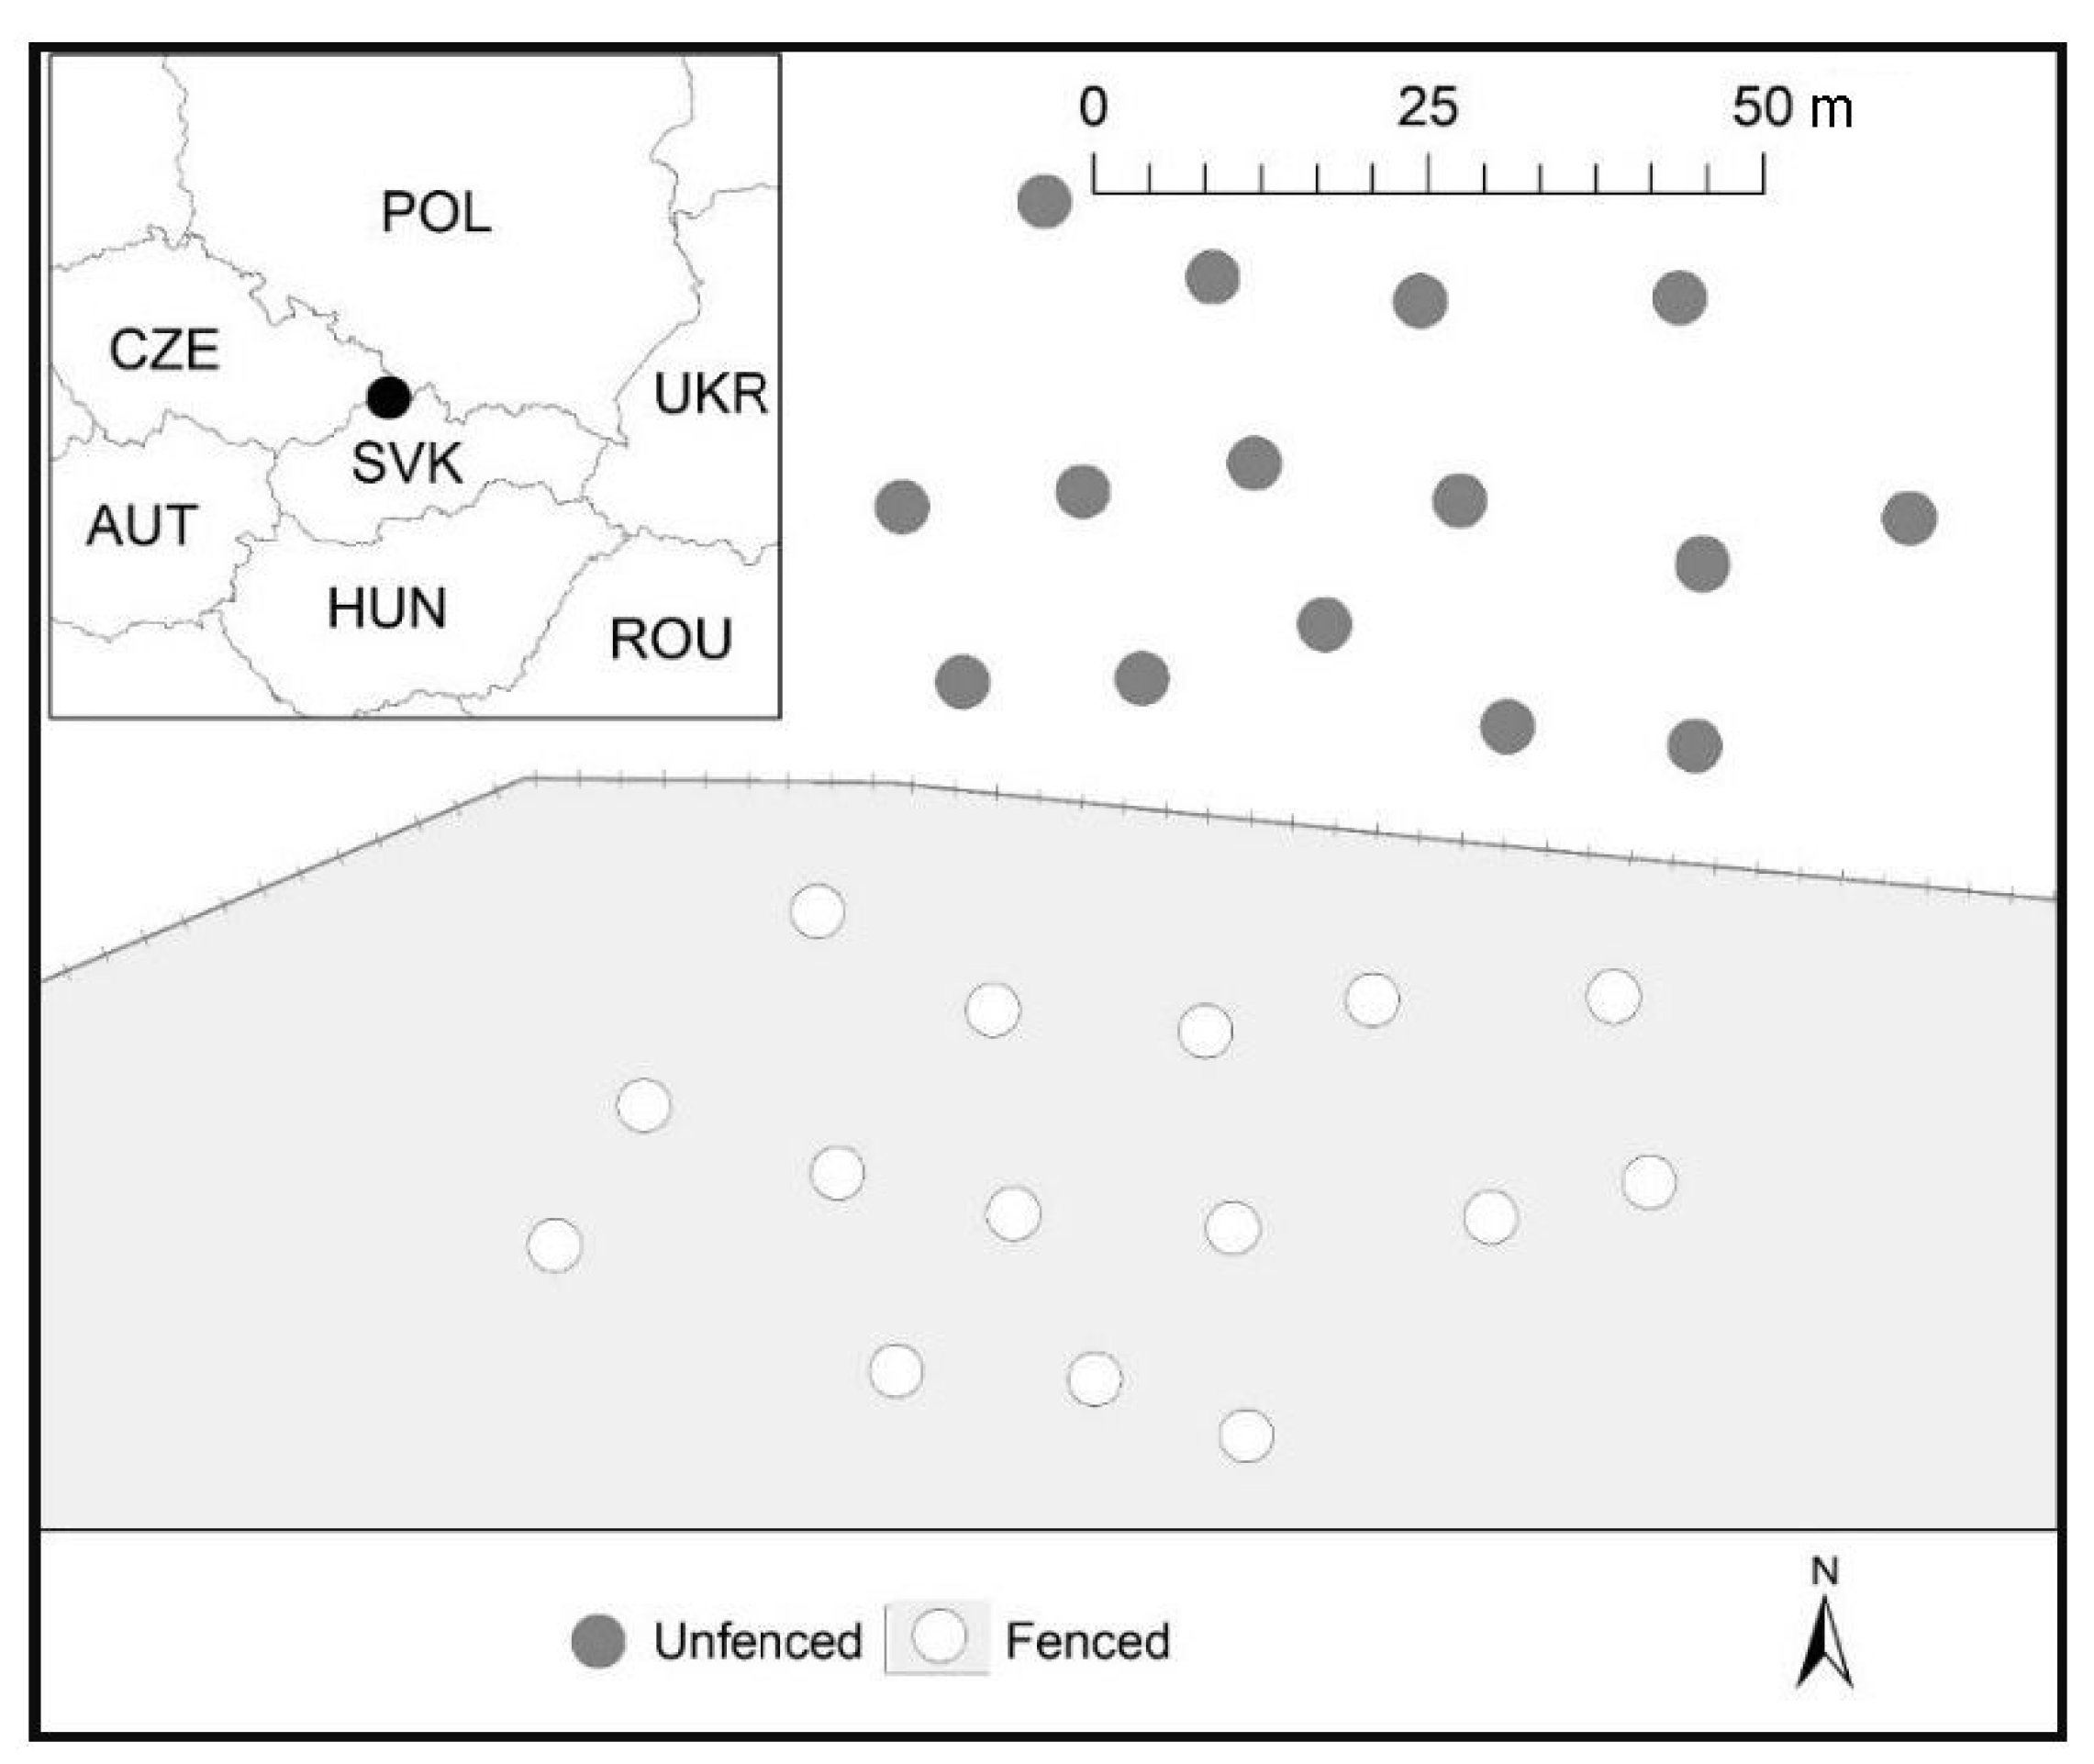
2.1. Site and Plot Conditions
2.2. Tree Measurement and Calculations
- Babvg—tree aboveground biomass (kg);
- d0—stem base diameter (mm);
- h—tree height (m);
- b0, b1, b2—equation coefficients;
- λ—correction factor (see Marklund [34]).
- hi—height of individuals (m);
- n—number of individuals.
- ri—radius from i-individuals to nearest neighbor tree (m);
- n—number of individuals;
- A—area (m2).
- s—tree species;
- pi—share of species, calculated as share on basal area related to d0.
3. Results
4. Discussion
4.1. Herbivores Influence to Basic Stand Characteristics
4.2. Herbivores Influence on Structure and Diversity of Stand
5. Conclusions
Author Contributions
Funding
Institutional Review Board Statement
Informed Consent Statement
Acknowledgments
Conflicts of Interest
References
- Forbes, E.; Cushman, J.H.; Burkepile, D.E.; Young, T.P.; Klope, M.; Young, H.S. Synthesizing the effects of large, wild herbivore exclusion on ecosystem function. Funct. Ecol. 2010, 33, 1597–1610. [Google Scholar] [CrossRef] [Green Version]
- Maron, J.L.; Crone, E. Herbivory: Effects on plant abundance, distribution and population growth. Proc. R. Soc. B 2006, 273, 2575–2584. [Google Scholar] [CrossRef] [Green Version]
- Červený, J.; Hell, P.; Slamečka, J. Otto’s Encyclopeda Game Management; Otto’s Publisher: Praha, Czech Republic, 2010; p. 591. [Google Scholar]
- Gordon, I.J.; Hester, A.J.; Festa-Bianchet, M. The management of wild large herbivores to meet economic, conservation and environmental objectives. J. Appl. Ecol. 2004, 41, 1021–1031. [Google Scholar] [CrossRef]
- Spake, R.; Bellamy, C.; Gill, R.; Watts, K.; Wilson, T.; Ditchburn, B.; Eigenbrod, F. Forest damage by deer depends on cross-scale interactions between climate, deer density and landscape structure. J. Appl. Ecol. 2020, 57, 1376–1390. [Google Scholar] [CrossRef]
- White, M.A. Long-term effects of deer browsing: Composition, structure and productivity in a northeast Minnesota old-growth forest. For. Ecol. Manag. 2012, 269, 222–228. [Google Scholar] [CrossRef]
- Kiffner, C.; Rössiger, E.; Trisl, O.; Schulz, R.; Rühe, F. Probability of recent bark stripping damage by red deer (Cervus elaphus) on Norway spruce (Picea abies) in as low mountain range in Germany—A preliminary analysis. Silva Fenn. 2008, 42, 125–134. [Google Scholar] [CrossRef] [Green Version]
- Schäfer, D.; Prati, D.; Schall, P.; Ammer, C.; Fischer, M. Exclusion of large herbivores affects understorey shrub vegetation more than herb vegetation across 147 forest sites in three German regions. PLoS ONE 2019, 14, 0218741. [Google Scholar] [CrossRef] [PubMed] [Green Version]
- Milner, J.M.; Nilsen, E.B.; Andreassen, H.P. Demographic side effects of selective hunting in ungulates and carnivores. Conserv. Biol. 2007, 21, 35–47. [Google Scholar] [CrossRef] [PubMed] [Green Version]
- Burbaité, L.; Csányi, S. Red deer population and harvest changes in Europe. Acta Zool. Litu. 2010, 20, 179–188. [Google Scholar] [CrossRef] [Green Version]
- Bučko, J.; Cibula, R.; Štefančíková, E.; Zimová, L.; Lehocká, K.; Kyseľová, M.; Frič, L. Game Management Annual Book of the Slovak Republic of 2010; National Forest Centre: Zvolen, Slovak, 2010; p. 181. (In Slovak) [Google Scholar]
- IBULH, 2021: Information Bank on Forestry, Wood-Processing Industry and Game Management. Available online: https://gis.nlcsk.org/ibulh (accessed on 10 May 2021). (In Slovak).
- Finďo, S.; Petráš, R. Ekologické základy ochrany lesa proti poškodzovaniu zverou. Ecological Bases of Forest Protection to Game Damage; National Forest Centre: Zvolen, Slovak, 2010; p. 186. (In Slovak) [Google Scholar]
- Kamler, J.; Homolka, M.; Barančeková, M.; Krojerová-Prokešová, J. Reduction of herbivory density as a tool for reduction of herbivore browsing on palatable tree species. Eur. J. For. Res. 2010, 129, 155–162. [Google Scholar] [CrossRef]
- Klopcic, M.; Jerina, K.; Boncina, A. Long-term changes of structure and tree species composition in Dinaric uneven-aged forests: Are red deer an important factor? Eur. J. For. Res. 2010, 129, 277–288. [Google Scholar] [CrossRef]
- Bergvall, U.A.; Co, M.; Bergström, R.; Sjöberg, P.J.R.; Waldebäck, M. Turner, Ch.: Anti-browsing effects of birch bark extract on fallow deer. Eur. J. For. Res. 2013, 132, 717–725. [Google Scholar] [CrossRef]
- Vacek, Z. Structure and dynamics of spruce-beech-fir forests in Nature Reserves of the Orlické hory Mts. in relation to ungulate game. Cent. Eur. For. J. 2017, 63, 23–34. [Google Scholar] [CrossRef] [Green Version]
- Konôpka, B.; Pajtík, J.; Shipley, L.A. Intensity of deer browsing on young rowans differs between freshly-felled and standing individuals. For. Ecol. Manag. 2018, 429, 511–519. [Google Scholar] [CrossRef]
- Shafer, E.L.; Grisez, T.J.; Sowa, E. Results of deer exclosure studies in northeastern Pennsylvania. USDA For. Res. Notes 1961, 121, 7. [Google Scholar]
- Nopp-Mayr, U.; Reimoser, S.; Reimoser, F.; Sachser, F.; Obermair, L.; Gratzer, G. Analyzing long-term impacts of ungulate herbivory on forest-recruitment dynamics at community and species level contrasting tree densities versus maximum heights. Sci. Rep. 2020, 10, 20274. [Google Scholar] [CrossRef] [PubMed]
- Bucher, R.; Rochlitz, J.; Wegner, N.; Heiss, A.; Grebe, A.; Schabo, D.G.; Farwig, N. Deer Exclusion Changes Vegetation Structure and Hunting Guilds of Spiders, but Not Multitrophic Understorey Biodiversity. Diversity 2010, 13, 25. [Google Scholar] [CrossRef]
- Hester, A.; Edenius, L.; Buttenschon, R.M.; Kuiters, A.T. Interactions between forets and herbivores: The role of controlled grazing experiment. Forestry 2010, 73, 381–391. [Google Scholar] [CrossRef] [Green Version]
- Bernes, C.; Macura, B.; Jonsson, B.G.; Junninen, K.; Müller, J.; Sandström, J.; Lohmus, A.; Macdonald, E. Manipulating ungulate herbivory in temperate and boreal forests: Effects on vegetation and invertebrates. A systematic review. Environ. Evid. 2018, 7, 13. [Google Scholar] [CrossRef] [Green Version]
- Hlásny, T.; Sitková, Z. Spruce Forests Decline in the Beskids; National Forest Centre: Zvolen, Slovak, 2010; p. 182. [Google Scholar]
- Bošeľa, M.; Sedmák, R.; Sedmáková, D.; Marušák, R.; Kulla, L. Temporal shifts of climate–growth relationships of Norway spruce as an indicator of health decline in the Beskids, Slovakia. For. Ecol. Manag. 2014, 325, 108–117. [Google Scholar] [CrossRef]
- Konôpka, B.; Zach, P.; Kulfan, J. Wind—An important ecological factor and destructive agent in forests. Lesn. Cas. For. J. 2016, 62, 123–130. [Google Scholar] [CrossRef]
- Kunca, A.; Zúbrik, M.; Galko, J.; Vakula, J.; Leontovyč, R.; Konôpka, B.; Nikolov, C.; Gubka, A.; Longauerová, V.; Malová, M.; et al. Salvage felling in the Slovak Republic’s forests during the last twenty years (1998–2017). Cent. Eur. For. J. 2019, 65, 3–11. [Google Scholar]
- Sitková, Z.; Kulla, L. Reconstruction of Allochthonous Spruce Stands, Findings—Experience—Recommendations; National Forest Centre: Zvolen, Slovak, 2012; p. 160. [Google Scholar]
- Saniga, M.; Dendys, P. Reconstruction of Spruce Stands (Findings and Practical Experience); Technical University: Zvolen, Slovak, 2015; p. 36. (In Slovak) [Google Scholar]
- Šebeň, V. National Inventory and Monitoring in the forests of the Slovak Republic in 2015–2016. For. Stud. 2017, 65, 26. (In Slovak) [Google Scholar]
- Šebeň, V.; Kulla, L. Implementation Project for the Husárik Research-Demonstration ENTITY (Updated 1.2 Version); National Forest Centre—Forest Research Institute: Zvolen, Slovak, 2011; p. 29. (In Slovak) [Google Scholar]
- Hančinský, L. Forest Types in Slovakia; Príroda: Bratislava, Slovak, 1972; p. 307. (In Slovak) [Google Scholar]
- Kulla, L.; Sitková, Z. Reconstruction of Allochthones Spruce Stands; National Forest Centre: Zvolen, Slovak, 2010; p. 208. [Google Scholar]
- Marklund, L.G. Biomass Functions for Norway Spruce (Picea abies L. Karst.) in Sweden; Department of Forest Survey, Report No. 43. Umea, Swedish University of Agricultural Sciences: Uppsala, Sweden, 1987; p. 73. [Google Scholar]
- Gini, C. Measurement of inequality on income. Econ. J. 1921, 31, 22–43. [Google Scholar] [CrossRef]
- Clark, P.J.; Evans, F.C. Distance to nearest neighbour as a measure of spatial relationships in populations. Ecology 1954, 35, 445–453. [Google Scholar] [CrossRef]
- Shannon, C.E. A mathematical theory of communication. Bell Syst. Tech. J. 1948, 27, 379–423. [Google Scholar] [CrossRef] [Green Version]
- De Jager, N.R.; Pastor, J. Effects of simulated moose Alces alces browsing on the morphology of rowan Sorbus aucuparia. Wildlife Biol. 2010, 16, 301307. [Google Scholar] [CrossRef] [Green Version]
- Myking, T.; Solberg, E.J.; Austrheim, G.; Speed, J.D.; Bohler, F.; Astrup, R.; Eriksen, R. Browsing of sallow (Salix caprea L.) and rowan (Sorbus aucuparia L.) in the context of life history strategies: A literature review. Eur. J. For. Res. 2013, 132, 399–409. [Google Scholar] [CrossRef]
- D’Aprile, D.; Vacchiano, G.; Meloni, F.; Garbarino, M.; Motta, R.; Ducoli, V.; Partel, P. Effects of Twenty Years of Ungulate Browsing on Forest Regeneration at Paneveggio Reserve, Italy. Forests 2020, 11, 612. [Google Scholar] [CrossRef]
- Muiruri, E.W.; Milligan, H.T.; Morath, S.; Koricheva, J. Moose browsing alters tree diversity effects on birch growth and insect herbivory. Funct. Ecol. 2015, 29, 724–735. [Google Scholar] [CrossRef] [Green Version]
- Favero, A.; Daigneault, A.; Sohngen, B. Forests: Carbon sequestration, biomass energy, or both? Sci. Adv. 2020, 6, eaay6792. [Google Scholar] [CrossRef] [Green Version]
- Konôpka, B.; Pajtík, B. Why was browsing by red deer more frequent but represented less consumed mass in young maple than ash trees? J. For. Sci. 2015, 61, 431–438. [Google Scholar] [CrossRef] [Green Version]
- Renaud, P.C.; Verheyden-Tixier, H.; Dumont, B. Damage to saplings by red deer (Cervus elaphus): Effect of foliage height and structure. For. Ecol. Manag. 2003, 181, 31–37. [Google Scholar] [CrossRef]
- San-Miguel-Ayanz, J.; De Rigo, D.; Caudulo, G.; Durrant, T.H.; Mauri, A. European Atlas of Forest Tree Species; Publication Office of the European Union: Luxembourg, 2016; p. 200. [Google Scholar]
- Merganič, J.; Russ, R.; Beranová, J.; Merganičová, K. Assessment of the impact of deer on the diversity of young trees in forest ecosystems in selected localities of the Czech Republic. Ekológia 2009, 28, 424–437. [Google Scholar] [CrossRef] [Green Version]
- Martin, J.L.; Daufresne, T. Introduced species and their impacts on the forest ecosystem of Haida Gwaii. In Proceedings of the Cedar Symposium, Haida Gwaii, Canada, 28–30 May 1996; Wiggins, G.G., Ed.; Ministry of Forests: Queen Charlotte Island, BC, Canada, 1999; pp. 69–85. [Google Scholar]
- Gill, R.M.A. A review of damage by mammals in north temperate forests: 3. Impact on trees and forests. Forestry 1992, 65, 365–388. [Google Scholar] [CrossRef] [Green Version]
- Koyama, A.; Uchida, K.; Ozeki, M.; Iwasaki, T.; Nakahama, N.; Suka, T. Conservation of endangered and rare plants requires strategies additional to deer-proof fencing for conservation of sub-alpine plant diversity. Appl. Veg. Sci. 2021, 24, e12553. [Google Scholar] [CrossRef]
- Harrison, P.A.; Berry, P.M.; Simpson, G.; Haslett, J.T.; Blicharska, M.; Bucur, M.; Dunford, R.; Egoh, B.; Garcia-Llorente, M.; Geamana, N.; et al. Linkages between biodiversity attributes and ecosystem services: A systematic review. Ecosyst. Serv. 2014, 9, 191–203. [Google Scholar] [CrossRef] [Green Version]
- Mori, A.; Lertzman, K.P.; Gustafsson, L. Biodiversity and ecosystem services in forest ecosystems: A research agenda for applied forest ecology. J. Appl. Ecol. 2017, 54, 12–27. [Google Scholar] [CrossRef]
- Lindner, M.; Maroschek, M.; Netherer, S.; Kremer, A.; Barbati, A.; Garcia-Gonzalo, J.; Seidl, R.; Delzon, S.; Corona, P.; Kolström, M.; et al. Climate change impacts, adaptive capacity, and vulnerability of European forest ecosystems. For. Ecol. Manag. 2010, 259, 698–709. [Google Scholar] [CrossRef]
- Hisano, M.; Searle, E.B.; Chen, H.Y.H. Biodiversity as a solution to mitigate climate change impacts on the functioning of forest ecosystems. Biol. Rev. 2017, 93, 439–456. [Google Scholar] [CrossRef]


| Tree Species | b0 | b1 | b2 | λ | Source |
|---|---|---|---|---|---|
| Norway spruce | −0.579 | 2.039 | 0.297 | 1.030 | I |
| Silver birch | −1.545 | 2.032 | 0.586 | 1.033 | II |
| Common rowan | −1.586 | 2.262 | 0.299 | 1.018 | I |
| Sycamore maple | −1.04 | 1.998 | 0.549 | 1.024 | I |
| Goat willow | −0.705 | 1.81 | 0.815 | 1.021 | I |
| Silver fir * | −0.579 | 2.039 | 0.297 | 1.030 | I |
| European beech | −1.236 | 2.124 | 0.521 | 1.038 | I |
| Trembling aspen | −1.434 | 2.177 | 0.434 | 1.031 | I |
| European ash | −0.589 | 1.838 | 0.754 | 1.032 | I |
| Specific Tree Species or Group of Species | Unfenced Plots | Fenced Plots | ||||||
|---|---|---|---|---|---|---|---|---|
| Nr. of Measured Trees (individuals) | Tree Height (m) | Stem Base Diameter (mm) | Tree Density (individuals per 10 m2) | Nr. of Measured Trees (individuals) | Tree Height (m) | Stem Base Diameter (mm) | Tree Density (Individuals per 10 m2) | |
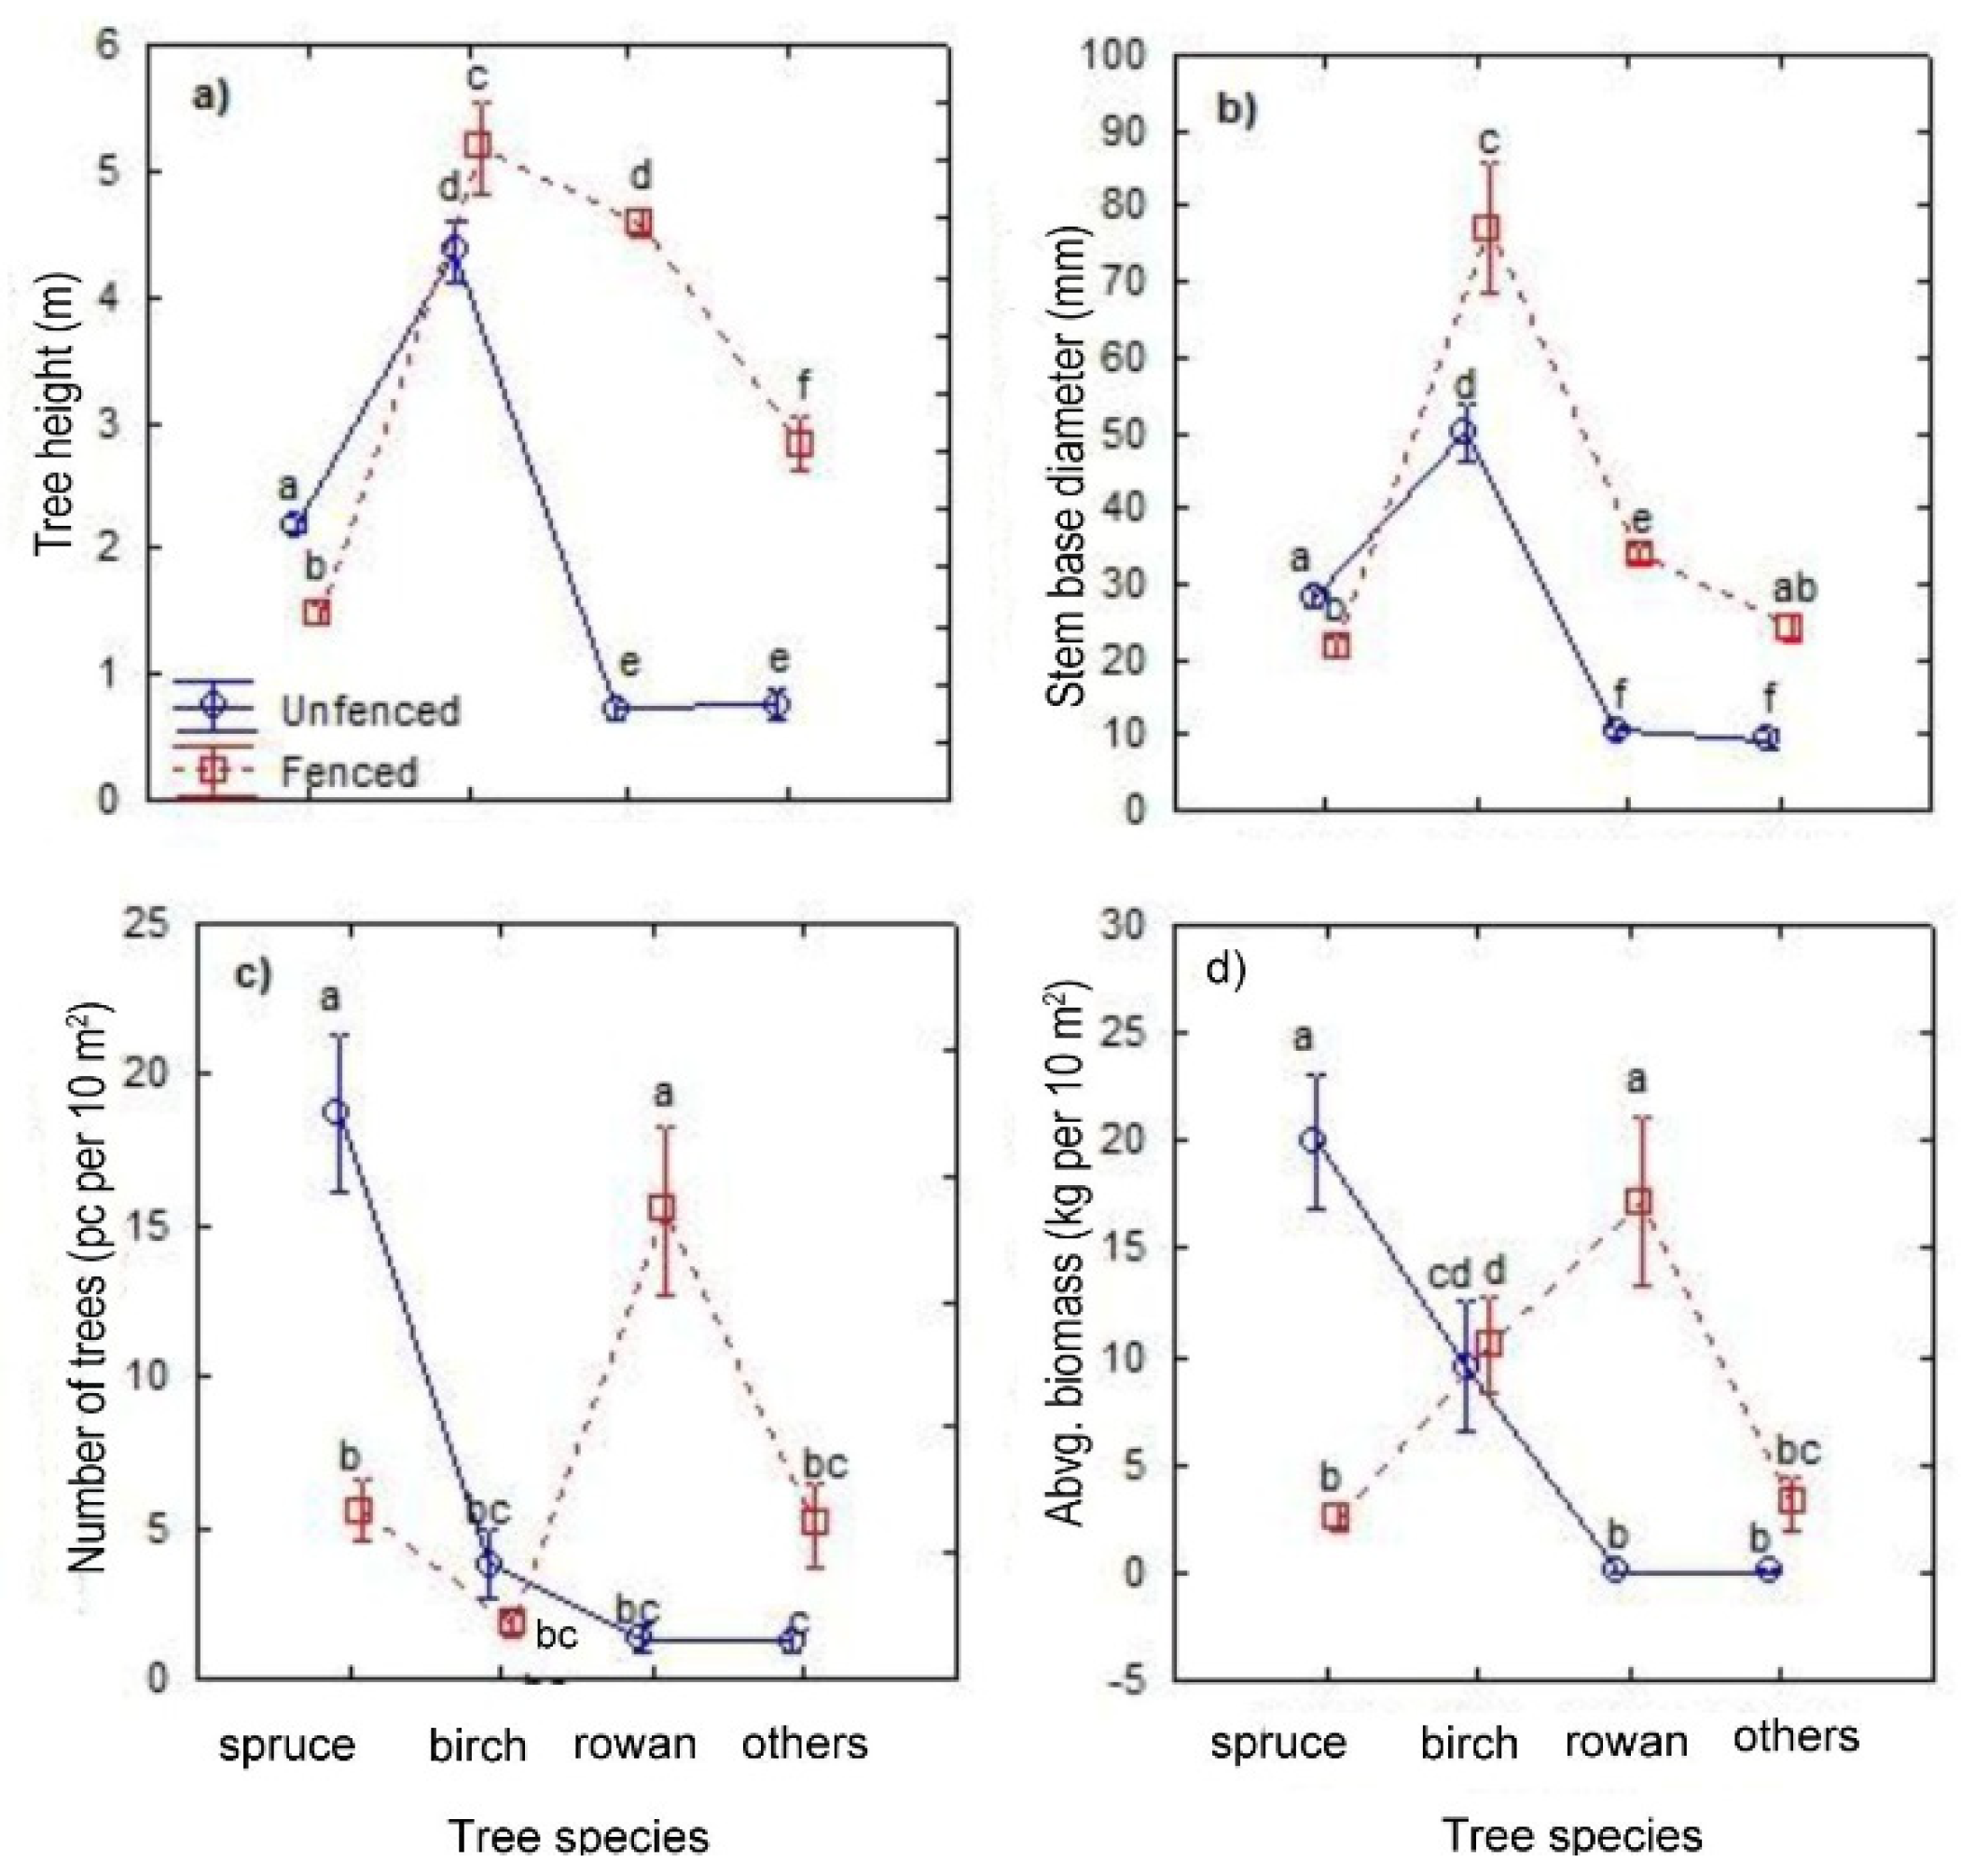
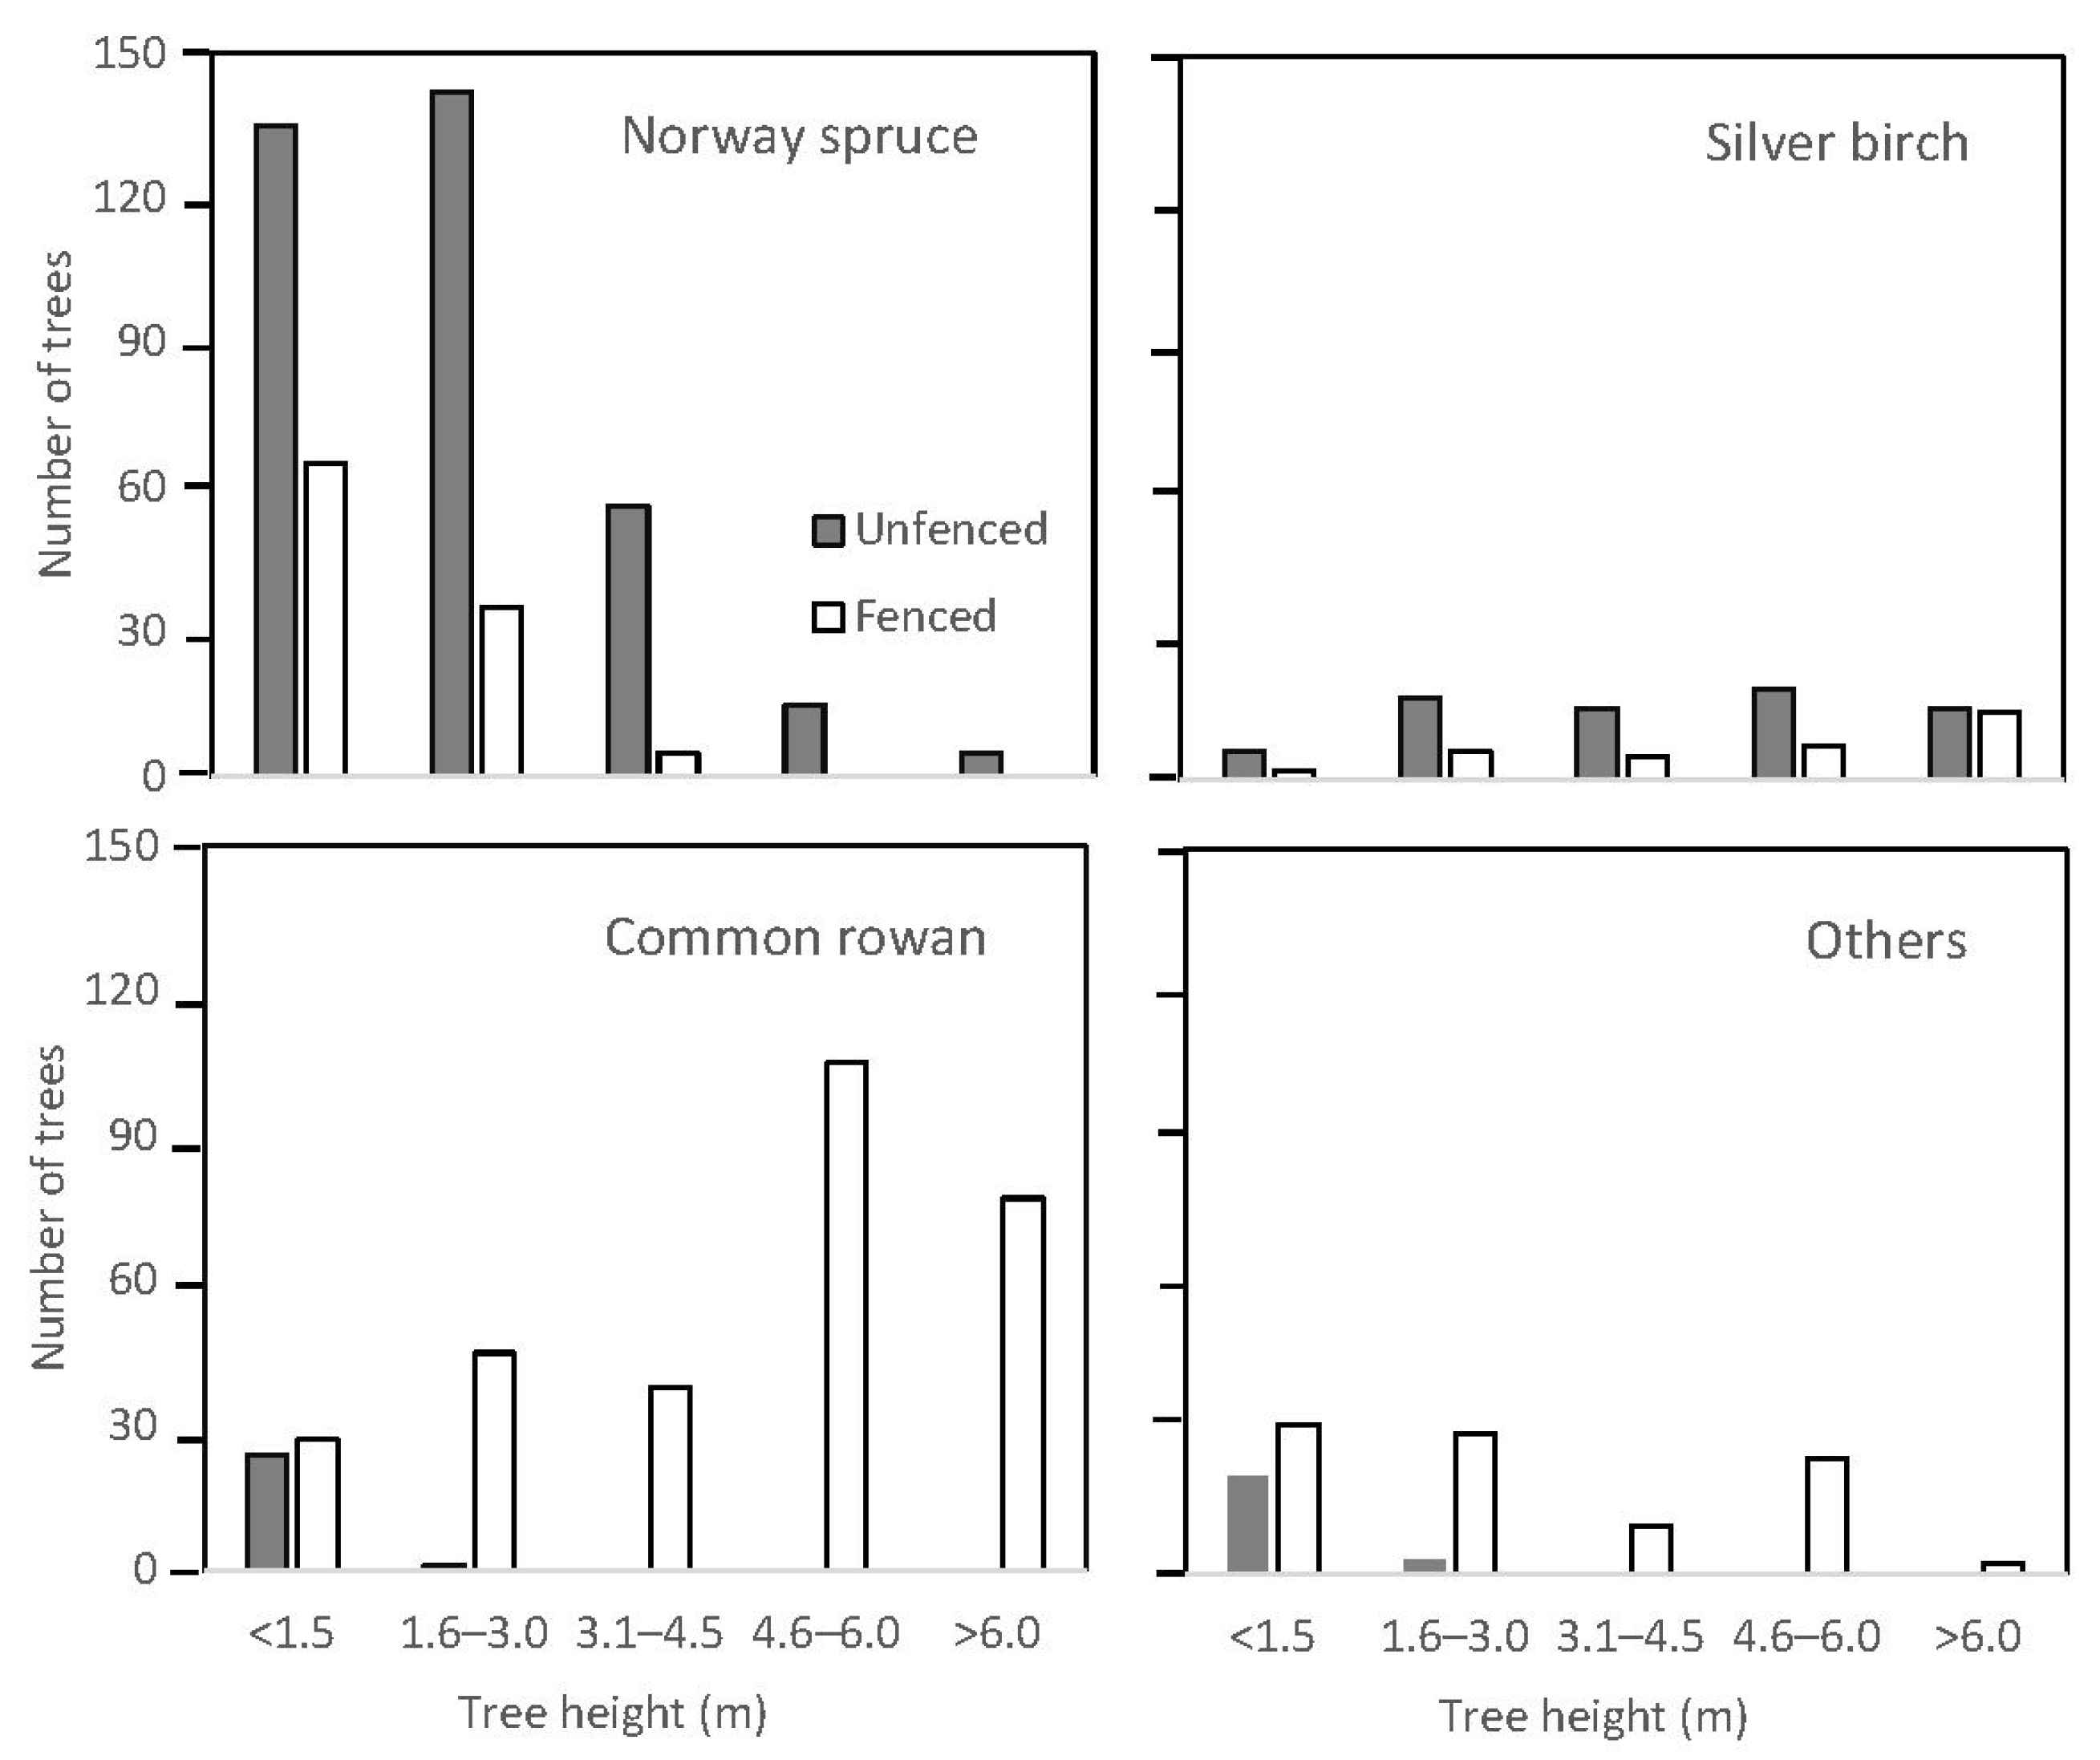
| Norway spruce (A) | 353 | 2.2 (0.1) | 28.2 (0.1) | 18.7 (2.6) | 105 | 1.5 (0.1) | 21.8 (0.1) | 5.6 (1.0) |
| Silver birch (B) | 72 | 4.4 (0.2) | 50.1 (0.3) | 3.8 (1.1) | 34 | 5.2 (0.4) | 77.1 (0.6) | 1.8 (0.4) |
| Common rowan (C) | 25 | 0.7 (0.1) | 10.5 (0.1) | 1.3 (0.4) | 292 | 4.6 (0.1) | 34.0 (0.1) | 15.5 (2.8) |
| Sycamore maple (D) | 8 | 0.3 (0.1) | 5.0 (0.1) | 0.4 (0.2) | 14 | 0.6 (0.1) | 9.0 (0.1) | 0.7 (0.3) |
| Goat willow (E) | 5 | 0.9 (0.3) | 7.8 (0.2) | 0.3 (0.2) | 66 | 3.7 (0.2) | 30.6 (0.2) | 3.5 (1.3) |
| Silver fir (F) | 5 | 1.3 (0.3) | 15.4 (0.4) | 0.3 (0.2) | 8 | 0.5 (0.1) | 7.9 (0.1) | 0.4 (0.1) |
| European beech (G) | 4 | 0.9 (0.3) | 12.4 (0.1) | 0.2 (0.1) | 2 | 0.8 (0.4) | 7.8 (0.1) | 0.1 (0.1) |
| Trembling aspen (H) | 1 | 0.6 (0.1) | 10 (0.1) | 0.1 (0.1) | 4 | 2.2 (1.1) | 16.6 (0.7) | 0.2 (0.1) |
| European ash (I) | 0 | 0 | 0 | 0 | 2 | 1.5 (1.0) | 14.8 (1.0) | 0.1 |
| Other species (D–I) | 23 | 0.8 (0.1) | 9.4 (0.1) | 1.2 (0.3) | 96 | 2.8 (0.1) | 24.2 (0.1) | 5.1 (1.3) |
| All species together (A–I) | 473 | 2.4 (0.1) | 29.7 (1.1) | 25.1 (2.2) | 527 | 3.7 (0.1) | 32.6 (0.1) | 28.0 (2.2) |
| Variable | Factor | F-Value | p-Value |
|---|---|---|---|
| Tree height (m) | Treatment | 93.56 | <0.001 |
| Species | 85.74 | <0.001 | |
| Treatment × species | 55.74 | <0.001 | |
| Stem base diameter (mm) | Treatment | 51.59 | <0.001 |
| Species | 98.94 | <0.001 | |
| Treatment × species | 23.43 | <0.001 | |
| Number of trees per 10 m2 | Treatment | 0.43 | 0.512 |
| Species | 16.94 | <0.001 | |
| Treatment × species | 27.45 | <0.001 | |
| Aboveground biomass per 10 m2 | Treatment | 0.36 | 0.549 |
| Species | 7.11 | <0.001 | |
| Treatment × species | 19.46 | <0.001 |
| Variable | Species | Unfenced Plots | Fenced Plots | Unfenced vs. Fenced Plots |
|---|---|---|---|---|
| Mean (Standard Error) [Coefficient of Variability] | t-Value (p-Value) | |||
| Number of species per plot | all species | 3.27 (0.31) [0.35] | 4.80 (0.37) [0.29] | 3.300 (<0.001) |
| Norway spruce | 71.02 (6.47) [0.34] | 21.66 (4.21) [0.19] | −6.620 (<0.001) | |
| Species share expressed | silver birch | 7.99 (6.00) [0.36] | 7.85 (4.92) [0.43] | −1.719 (0.097) |
| on number of trees | common rowan | 4.76 (1.37) [0.93] | 51.77 (6.67) [0.48] | 7.150 (<0.001) |
| (%) | other species | 5.80 (1.72) [0.90] | 18.73 (5.60) [1.12] | 2.285 (0.030) |
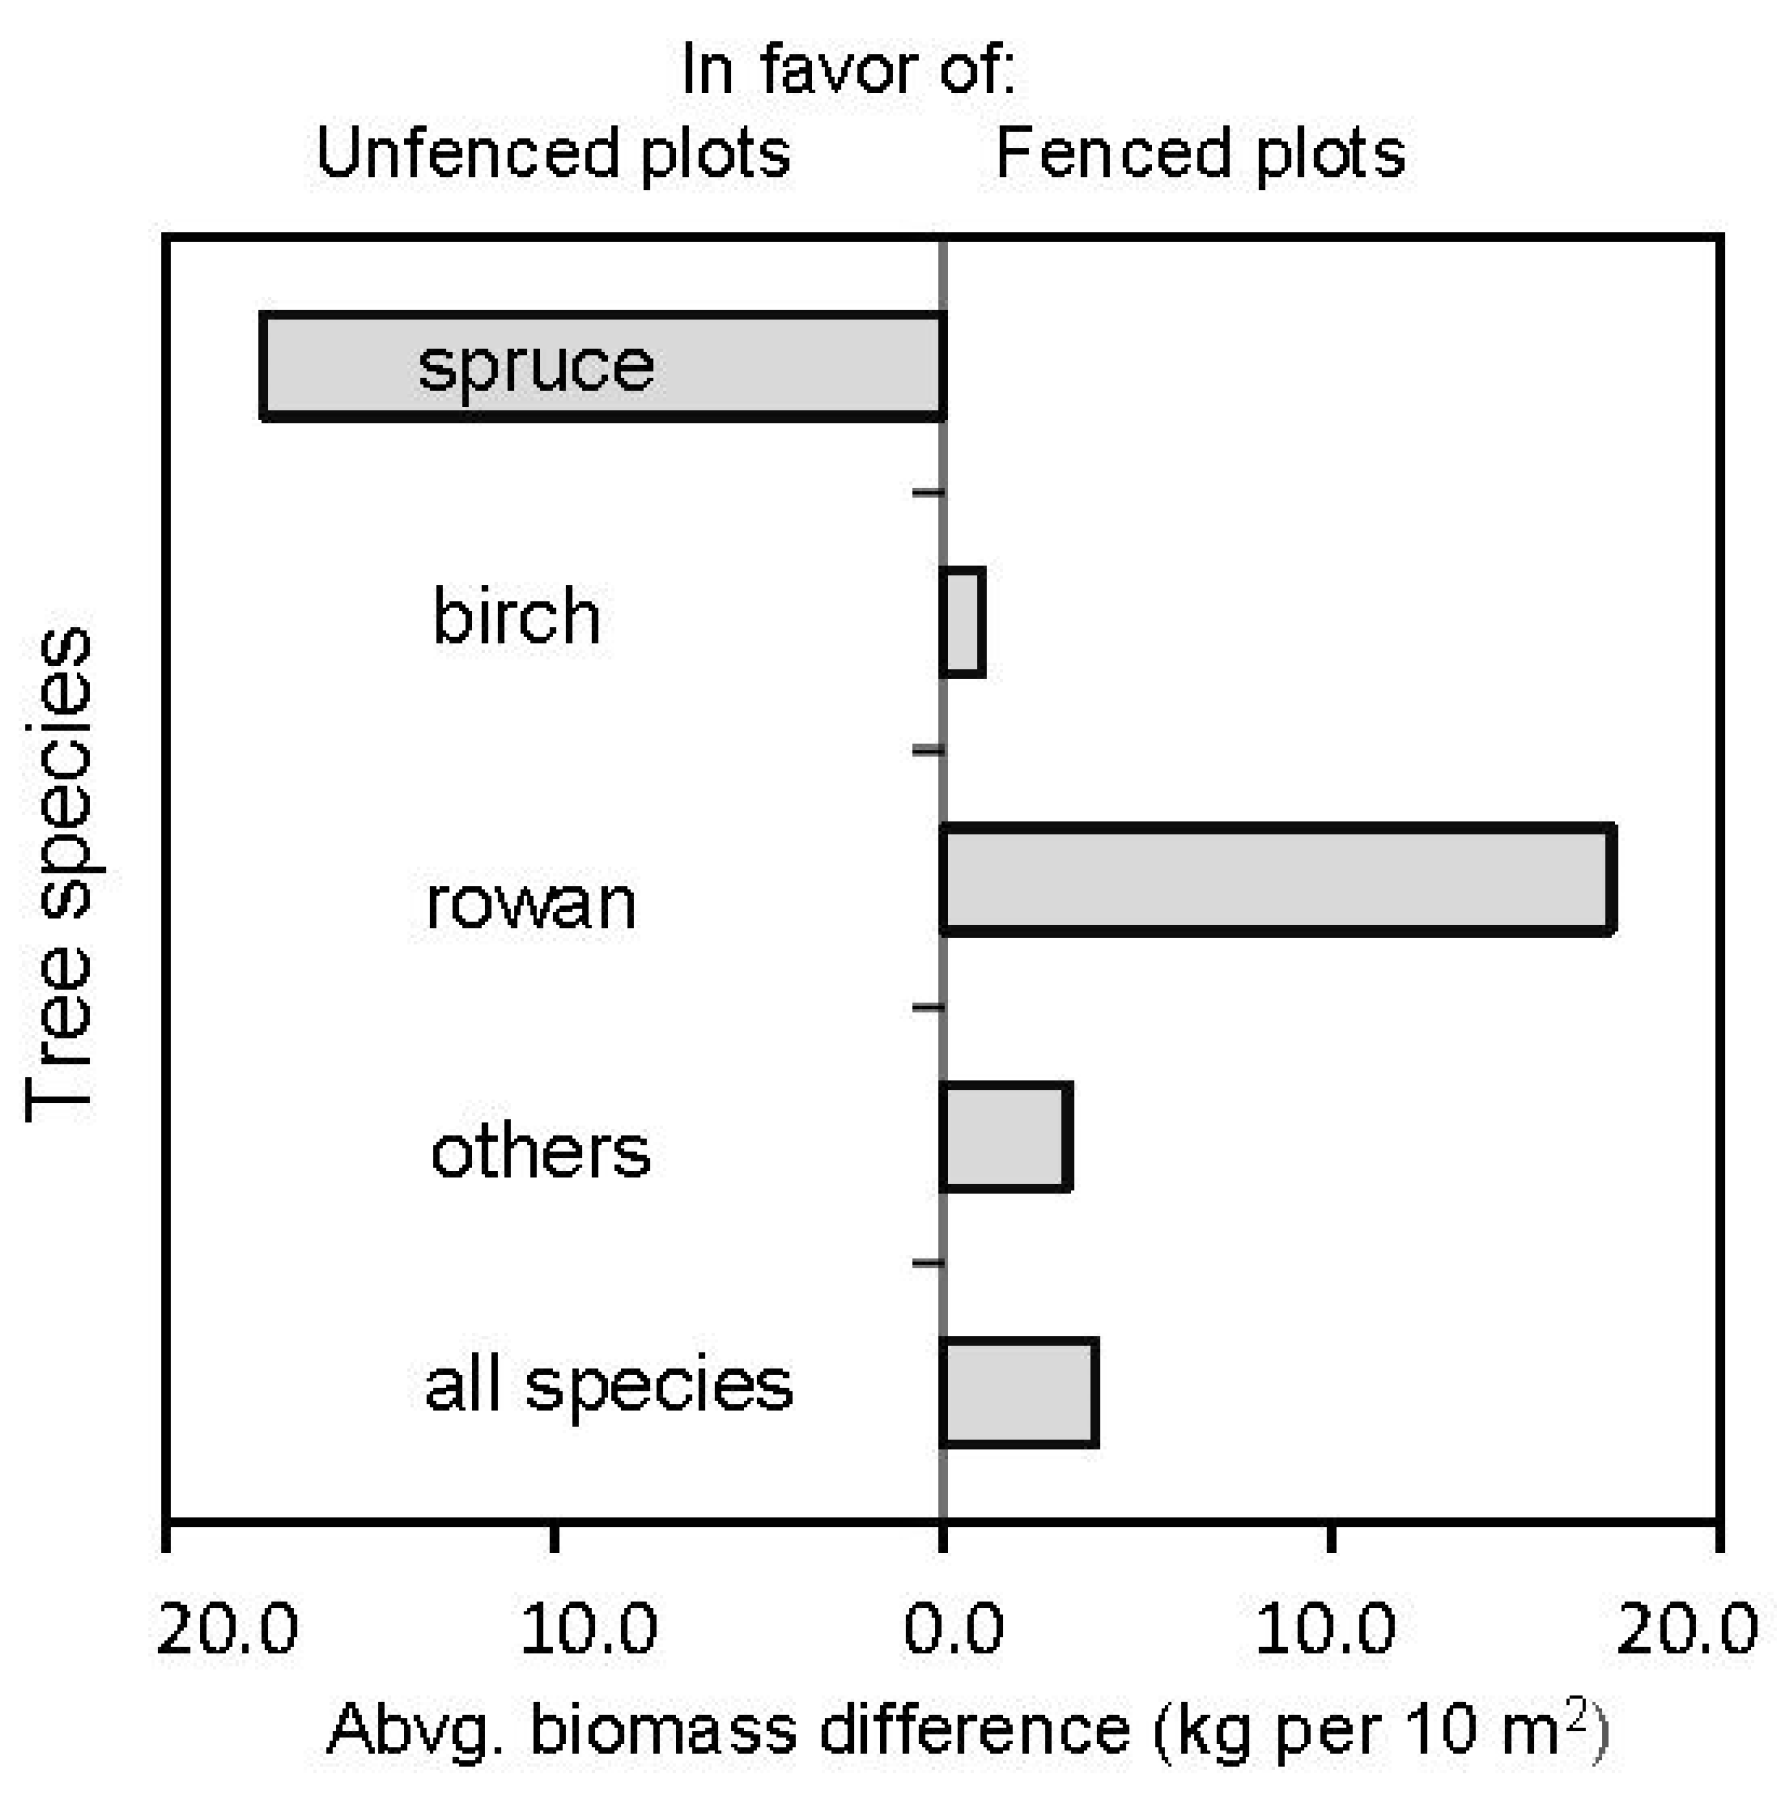
| Norway spruce | 68.82 (9.64) [0.52] | 8.45 (2.03) [0.90] | −6.346 (<0.001) | |
| Species share expressed | silver birch | 30.72 (9.71) [1.18] | 32.42 (7.12) [0.82] | 0.146 (0.884) |
| on aboveground biomass | common rowan | 0.16 (0.07) [1.63] | 49.44 (8.83) [0.67] | 5.778 (<0.001) |
| (%) | other species | 0.30 (0.21) [1.33] | 9.69 (4.36) [1.17] | 2.228 (0.034) |
| Index | Unfenced Plots | Fenced Plots | Unfenced vs. Fenced Plots |
|---|---|---|---|
| Mean (Standard Error) [Coefficient of Variability] | t-Value (p-Value) | ||
| Gini | 0.36 (0.05) [0.52] | 0.32 (0.03) [0.35] | −1.250 (0.222) |
| Clark–Evans | 0.98 (0.10) [0.38] | 0.75 (0.04) [0.20] | −3.734 (<0.001) |
| Shannon | 0.32 (0.14) [1.64] | 0.78 (0.17) [0.82] | 3.998 (<0.001) |
Publisher’s Note: MDPI stays neutral with regard to jurisdictional claims in published maps and institutional affiliations. |
© 2021 by the authors. Licensee MDPI, Basel, Switzerland. This article is an open access article distributed under the terms and conditions of the Creative Commons Attribution (CC BY) license (https://creativecommons.org/licenses/by/4.0/).
Share and Cite
Konôpka, B.; Šebeň, V.; Pajtík, J.; Shipley, L.A. Excluding Large Wild Herbivores Reduced Norway Spruce Dominance and Supported Tree Species Richness in a Young, Naturally Regenerated Stand. Forests 2021, 12, 737. https://doi.org/10.3390/f12060737
Konôpka B, Šebeň V, Pajtík J, Shipley LA. Excluding Large Wild Herbivores Reduced Norway Spruce Dominance and Supported Tree Species Richness in a Young, Naturally Regenerated Stand. Forests. 2021; 12(6):737. https://doi.org/10.3390/f12060737
Chicago/Turabian StyleKonôpka, Bohdan, Vladimír Šebeň, Jozef Pajtík, and Lisa A. Shipley. 2021. "Excluding Large Wild Herbivores Reduced Norway Spruce Dominance and Supported Tree Species Richness in a Young, Naturally Regenerated Stand" Forests 12, no. 6: 737. https://doi.org/10.3390/f12060737