
What Causes Waterlogging?—Explore the Urban Waterlogging Control Scheme through System Dynamics Simulation


1
School of Management, Tianjin University of Technology, Tianjin 300391, China
2
School of Humanities, Tsinghua University, Beijing 100084, China
3
School of Civil Engineering, Hebei University of Technology, Tianjin 300401, China
*
Author to whom correspondence should be addressed.
Sustainability 2021, 13(15), 8546; https://doi.org/10.3390/su13158546
Submission received: 25 May 2021
/
Revised: 29 June 2021
/
Accepted: 29 July 2021
/
Published: 30 July 2021
Abstract
:It is a common phenomenon in cities that waterlogging affects people’s normal life. It is of great significance for targeted transformation and upgrading to identify the risk factors of urban waterlogging. This paper collected the waterlogging data of Tianjin in China, analyzed the coupling mechanism among waterlogging risk factors of urban drainage systems, and then selected the system dynamics theory and the Vensim software as the analysis tools due to the mixing characteristic and the limited availability of data. After that, the sensitive factors were identified by model simulation and sensitivity analysis, and the prominent impact of urban expansion on waterlogging risk was discussed. Then, through the comparison of the three simulation scenarios, it was found that, compared with the urban development focus shifting strategy, the strategies of sponge city reconstruction and management optimization could achieve the risk control goal within a shorter time. On this basis, two kinds of governance schemes with strong operability were put forward, which were the data governance strategy and the sponge city reconstruction strategy of giving priority to old urban areas. According to the simulation results, a city can reverse the increasing trend of waterlogging risk within ten years under the appropriate scheme. Furthermore, the paper puts forward the strategic reimagining of the rural revitalization strategy and the ecological restoration strategy for the long-term sustainable development transformation of Tianjin.
1. Introduction
Urban waterlogging refers to the phenomenon of surface water accumulation caused by the insufficient drainage capacity of urban areas in which the runoff cannot be eliminated in time when heavy rain or continuous precipitation comes [1,2,3]. In recent years, there was a sharp increase in the duration of waterlogging worldwide, and China was hit particularly hard [4,5,6]. According to 2011 data from China’s Ministry of Housing and Urban-Rural Development, about 62% of cities, especially large and coastal ones, are facing waterlogging problems [7]. According to data from China Development and Reform Commission, in 2017, 43 large-scale heavy rains in China caused a total of 190.99 billion CNY of direct economic losses. In 2018, the rare rainstorm caused rivers to back flood and inundate Shouguang, one of China’s main vegetable-growing towns. Additionally, in the months of continuous precipitation caused by the typhoon “Mangkhut”, the flooding of Huizhou and Guangdong was another reminder that the flooding situation in China is problematic. In recent years, the Chinese government issued a series of policies, such as Technical Code for Urban Flooding Prevention and Control, Technical Guidelines for the Construction of Sponge Cities—Construction of Low Impact Development Rainwater Systems, and National Comprehensive Disaster Prevention and Mitigation Plan, taking natural disaster assessment and prevention as a national key project. At the same time, the frequent occurrence of urban waterlogging disasters attracted wide attention in academic circles [8,9].
Since the 1970s, Europe started to study urban waterlogging disasters [10]. Japan attaches great importance to urban disasters and formulated relevant laws and designed a system analysis model for urban water disasters [11]. The United States then got involved in the scientific early warning research of flood disasters [12]. Since the end of the last century, the prevention and the control of water disasters in China carried out studies on the causes and the mechanisms of urban waterlogging, the relationship between production and confluence in different regions, as well as the early warning and forecasting of disasters and emergency rescue [13,14]. In recent years, the development of computers, communication, geographic information, and other technologies provides support for the breakthrough of urban disaster management ability and level [15].
Waterlogging is a complex phenomenon, which is the result of both natural environment and human activities. First of all, the data difference of waterlogging among cities implies that cities, as geographically and economically independent social economies, divide the boundaries of waterlogging research objects. In addition to the changes of ecological environment (such as precipitation and topography), urban waterlogging disaster events are closely related to human activities [16,17,18,19], such as the rapid urban expansion, the reduction of surface seepage level, the operation and the management level of urban drainage facilities, etc. However, which factors dominate the formation of urban waterlogging? What can be done to control the deterioration of waterlogging risk or reduce waterlogging losses as quickly as possible? What is the sustainable direction of future urban development? Clarifying the relationship between urban waterlogging and its environment and human behavior as well as the relative contribution of each environmental or human factor is essential to answer these questions.
In this work, we overcame the lack of investigation to present a highly representative case study of the central urban area of Tianjin, a large coastal city in China. Through systematic analysis, we preliminarily explored the relative contribution of environmental and human factors in the complex mechanism of urban waterlogging. Based on the actual situation, we put forward an operable waterlogging control and reconstruction scheme in the old urban area and proposed an assumption for urban sustainable planning. This study provided theoretical and practical reference for urban managers to control urban waterlogging and plan urban development.
2. Materials and Methods
2.1. Situation of Study Area
Tianjin is located in the North China Plain, the lower reaches of the Haihe River Basin, whose terrain is low-lying. It used to be the only entrance to the sea in 263,000 square kilometers of water. After the catastrophic floods occurred in the 1960s, the Chinese government excavated a number of rivers to relieve the hidden dangers of the waters converge. Now, there are 4 first-class rivers and 21 s-class rivers in the main urban area to undertake the flood control function in respective basins. The water area is wide, and the average annual rainfall is about 550 mm. Among them, the rainfall from June to August accounts for about 80% of the annual total. Combined with the topography and the river form of the city, it is extremely prone to waterlogging.
Since the founding of the country, Tianjin, once the largest city in the north of China, experienced many transformations from an industrial city to a light industrial city and then to an innovative city. With the rapid economic development, the urban area expanded again and again. In the past 70 years, the urban population increased about by 15 times and the urban area expanded by 17 times. According to the data of 2018, the urban area of Tianjin is 2585.2 km2, the built-up area is 1077.8 km2, the construction land area is 950.6 km2, the green coverage rate of the built-up area is 38%, the area of municipal roads is 15,131 m2, the length of urban drainage pipeline is 21,369 km, and the urban population density is 5016 people/km2. There are about 120 rainwater pumping stations; with that, the popularization rate of the rainwater pipe network is about 80%, which is still considerable. However, according to the data in recent years, the urban waterlogging situation is being aggravated, which often leads to submergence of sunken road sections and ponding in area, affecting social and economic order and reflecting the gap between the rainwater drainage capacity and the drainage demand of the Tianjin drainage system.
2.2. Urban Waterlogging Risk Simulation Method
Firstly, when we constructed the risk hierarchy of the urban drainage system, we used the risk coupling method to describe the relationship between system factors. Risk coupling refers to the process in which different risks interact with risk carriers through a certain path, resulting in changes in the nature or the intensity of risks [20,21]. However, the multi-layer network theory uses nodes and edges to describe the structure and the function of the research object [22]. On this basis, it abstracts the risk carrier of the objective world into a multi-layer random network structure, and then the coupling relationship between urban waterlogging risk elements are described mathematically, which lays the foundation for the subsequent quantitative discussion [23].
Next, we used the system dynamics method in the follow-up study. System dynamics is a computer simulation method to study the dynamic behavior of social systems, which is based on classical fluid mechanics principle and system theory [24]. It defines the components and the boundaries of the system in the process of modeling, analyzes the system behavior in the process of analyzing the relationship between variables, and generates the insights into strategies [25,26]. The system dynamics provide the possibility of quantitative analysis on a qualitative basis and are especially suitable for complex system problems that evolve over time [27]. Therefore, it plays a role in the analysis of urban waterlogging disaster mechanism and the exploration of risk management strategies.
2.3. Coupling Mechanism Analysis of Urban Waterlogging Risk
2.3.1. The Hierarchical Structure of Urban Waterlogging Risk
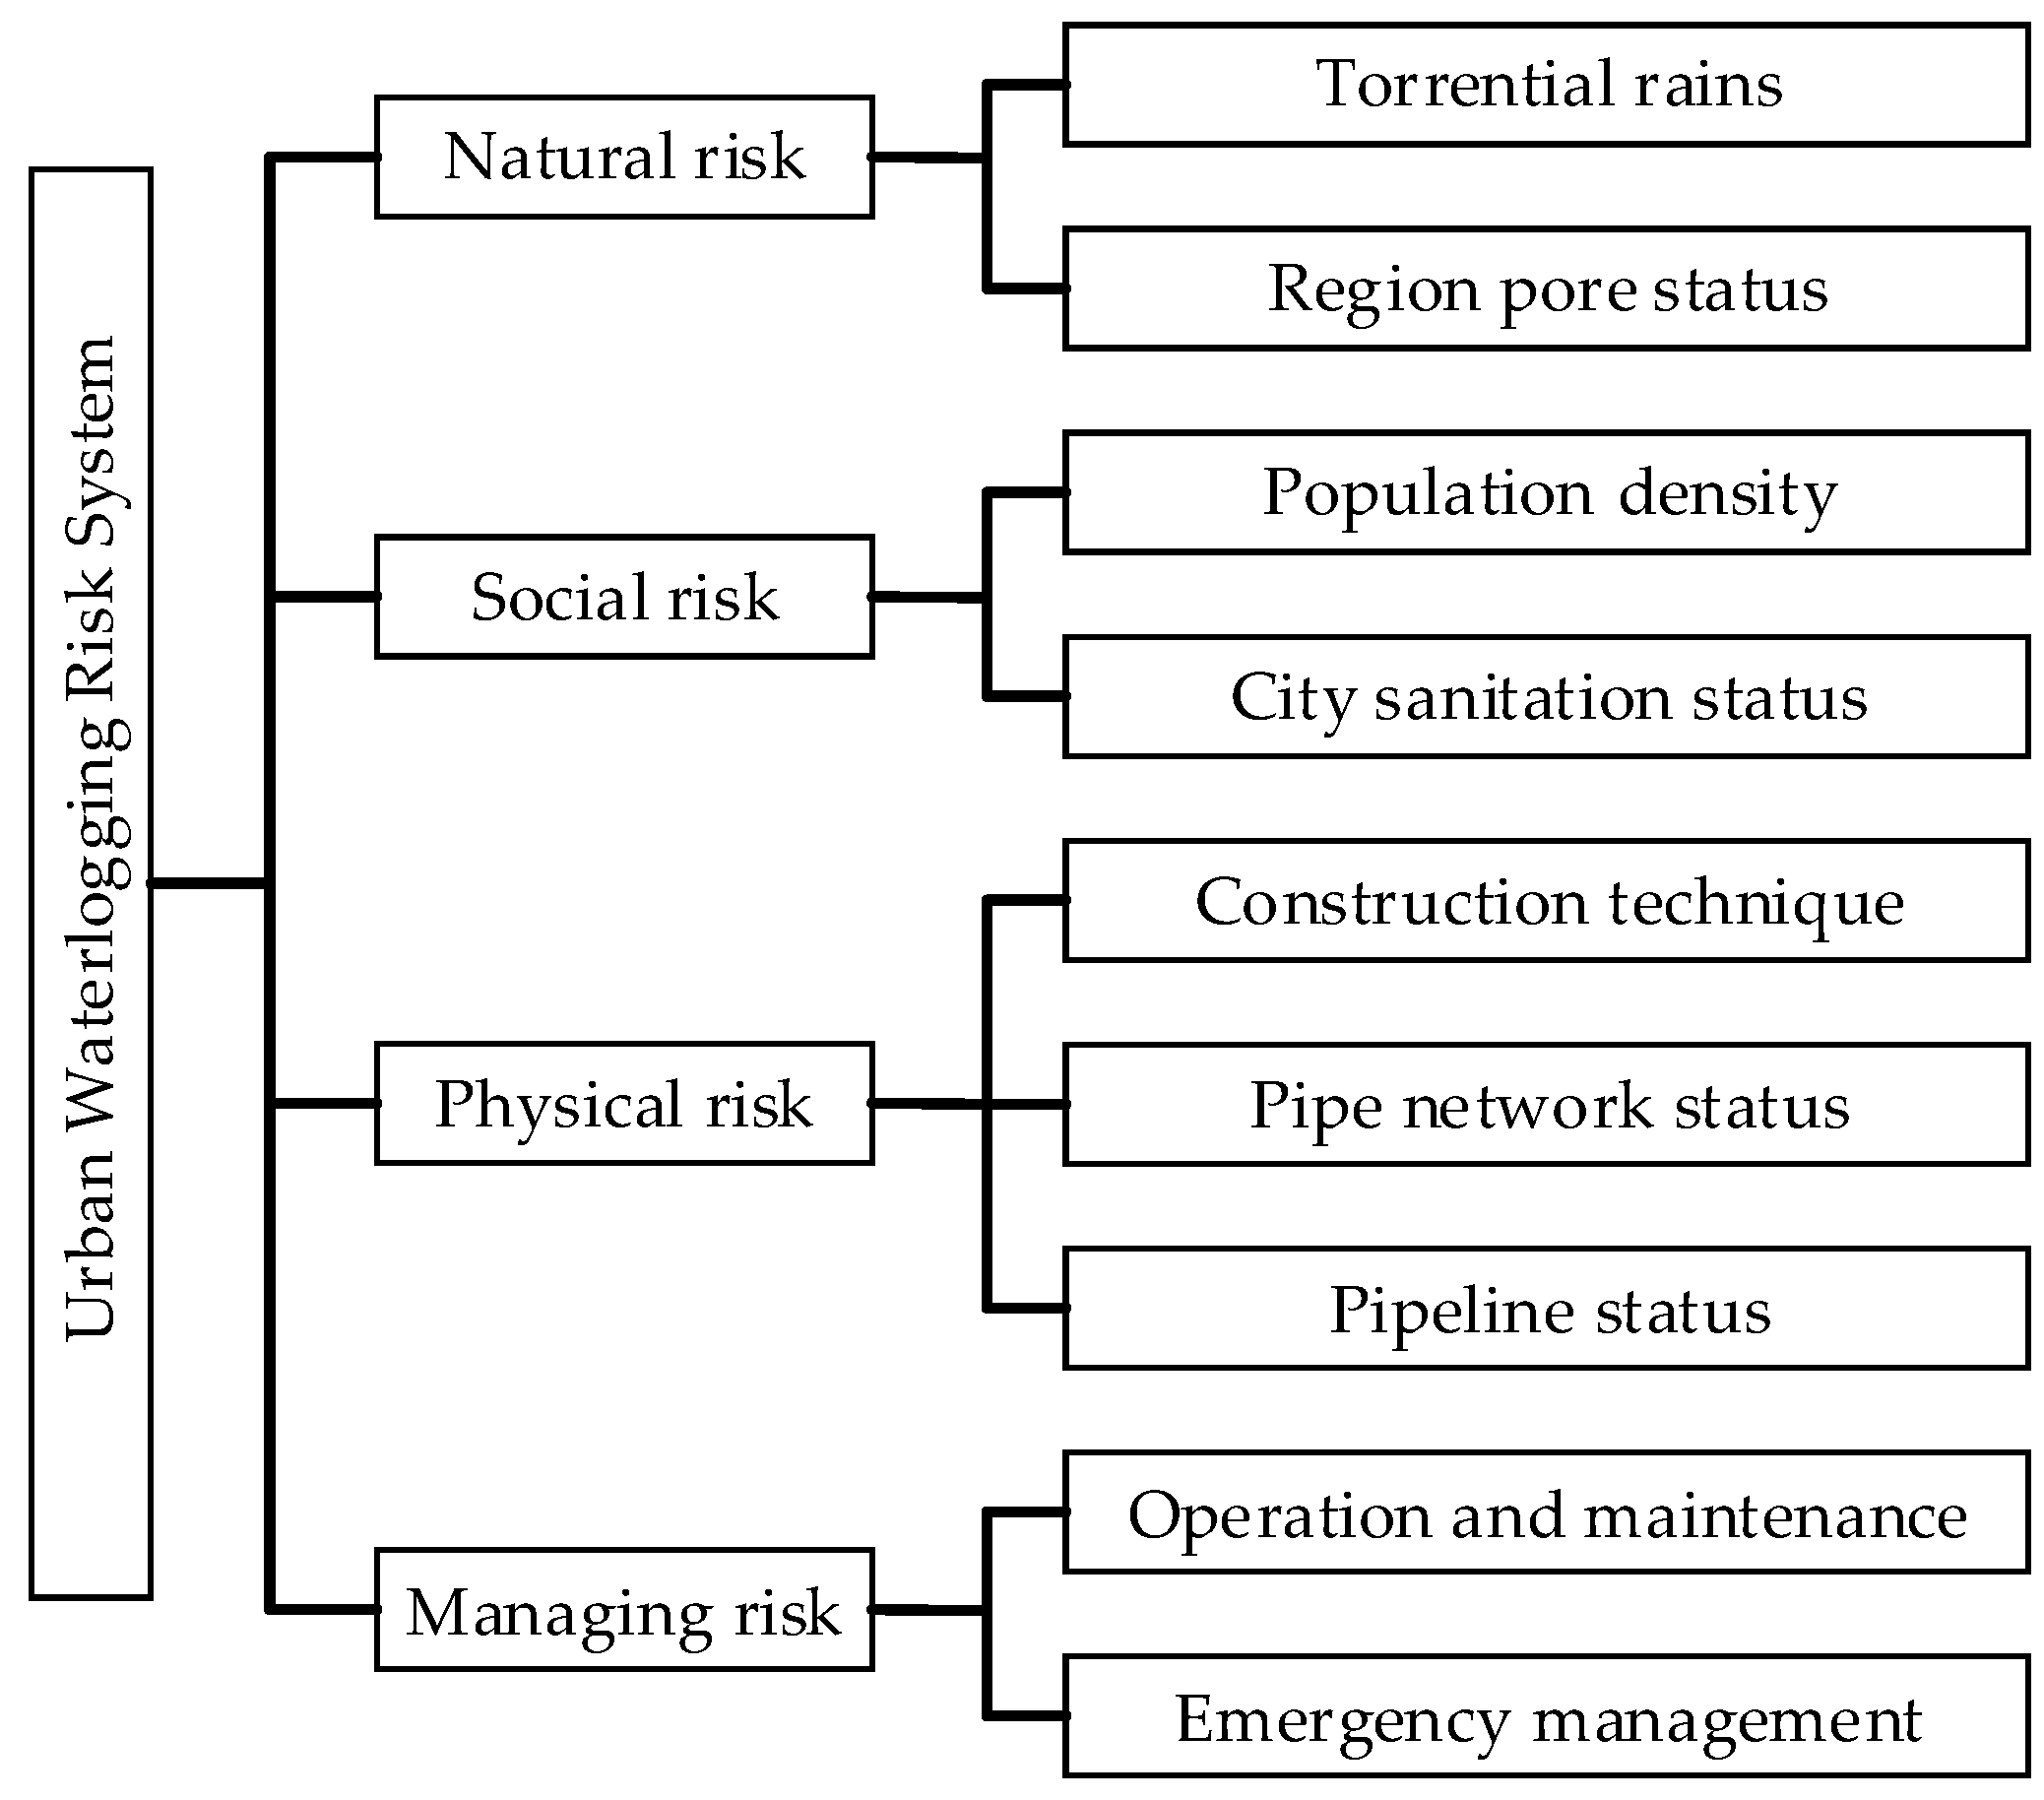
Formulating responses to urban waterlogging risk requires knowledge of the complex behavior of the socioeconomic system. Although people take action, urban drainage facilities and related management systems are also key to these responses. Therefore, this paper first defined the urban drainage system as the main response body of urban waterlogging risk. The first and the last boundaries of the system were the rainwater inlets distributed on the urban surface and the outlets on each river. This study assumed that the channels capacity was sufficient. Then, based on the human-mechanical-environment system engineering analysis and referring to relevant literature, we considered the causes of urban waterlogging and the risk classification mode from the perspective of risk management [28,29,30]. We believed that the factors that caused urban drainage systems to show waterlogging risk vulnerability could be divided into the internal risks (such as the management level and the physical characteristics of the drainage system) and the external risks (including urban surface conditions and social environment) [31,32]. The further factorization was as follows and is shown in Figure 1.
- Natural risk referred to the unfavorable natural environment in which the urban drainage pipe network was located, which mainly affected the operation level of the drainage pipe network through the runoff into the rainwater inlet. Ignoring the phenomenon of atmospheric evaporation, the rainfall runoff could be regarded as the difference between the total amount of torrential rains and the region pore status.
- For social risk, on the one hand, the urbanization process led to rapid urban expansion and continuous increase in population density, resulting in a mismatch between the design level of the old area pipe network and the expanded urban drainage demand; on the other hand, the hardened urban surface made gutters the main channel of urban drainage, which meant more work for the city’s sanitation staff. After discussion, the urban expansion factor was adjusted to the three-level index that affects the region pore status index, and the social risk, which affects the urban waterlogging value, was divided into two aspects: population density and city sanitation status.
- The physical risk of urban drainage network included three levels. Construction technique reflected the gap between the completion year level of the pipeline network and the design level. After the process of adding, aging, and repairing, pipeline status referred to the gap between the pipeline level in the evaluation year and the design level. The pipe network status referred to the evaluation of the network matching degree and the coverage integrity from the entire pipe network system without considering the pipeline itself.
- Obviously, managing risk could be divided into the operation and the maintenance as well as the emergency management. In the sample city, operation and maintenance mainly focused on the construction of regulation and storage level of the pipeline network and the treatment of waterlogged land. The realization of emergency management relied on the construction of an early warning system based on the Internet of Things and the operation of the linkage mechanism for broken departmental barriers.
2.3.2. The Hierarchical Structure of Urban Waterlogging Risk
In China, the administrative area of a city usually includes urban areas, towns, and large areas of farmland. Obviously, in the database of urban waterlogging, there were obvious differences in the waterlogging levels between the main urban area and the surrounding towns and villages. For representativeness and accuracy, the study area was determined as the main urban area of Tianjin, including six old districts and four new districts surrounding them. In addition, considering the factor characteristics and the data availability, we designed the research period from 2010 to 2030, of which 2021–2030 was the forecast period. This study reflected the change of natural environment over time and ignored changes in the demand for urban drainage system capacity due to long-term economic and population growth. The system contained the following elements:
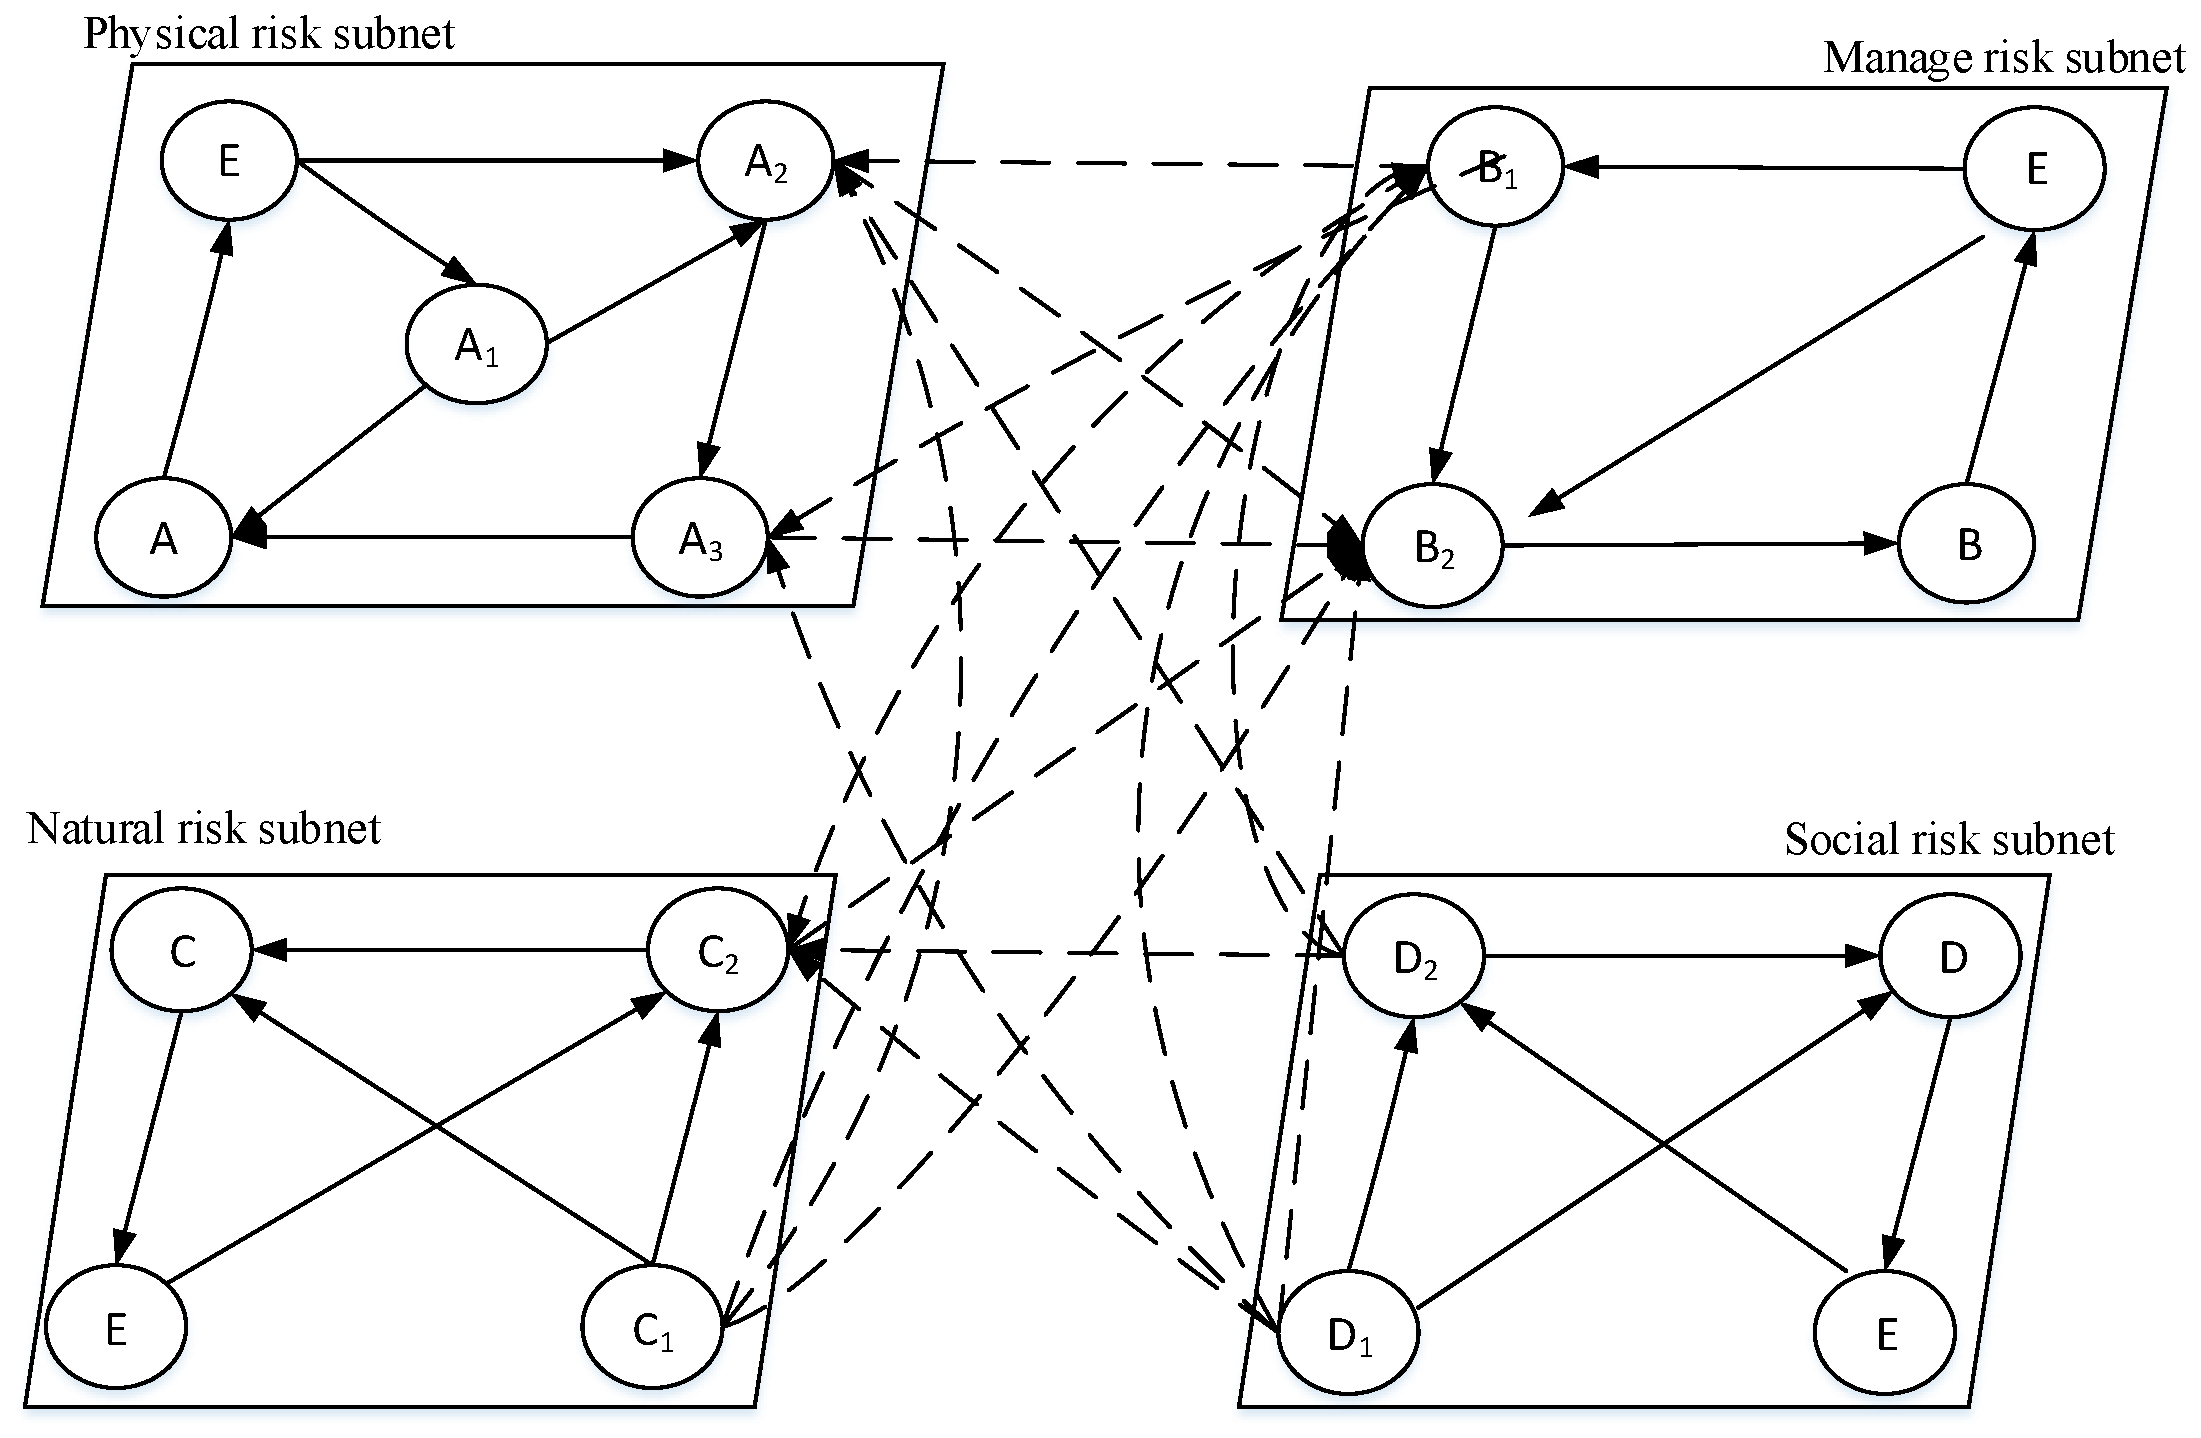
- Physical risk subsystem A: construction technology A1, pipeline status A2, pipe network status A3;
- Management risk subsystem B: operation and maintenance B1, emergency management B2;
- Natural risk subsystem C: torrential rains C1, region pore status C2;
- Social risk subsystem D: population density D1, city sanitation status D2.
2.3.3. Analysis of Risk Factors Coupling
Next, a multi-layer network model of risk factors that make urban drainage systems vulnerable to waterlogging was constructed, which included four subnets: natural risk, social risk, physical risk, and management risk. Additionally, based on the logic analysis of risk events and previous literature data, we discussed the interaction process of various factors in the urban waterlogging risk mechanism. As reflected in the multi-layer network model, the coupling relationship expressed by nodes and edges in and between subnets is shown in Figure 2. Among them, the social environment, as an intervention risk source, mostly indirectly affected the vulnerability level of urban drainage systems through influencing other factors. However, the operation and the maintenance as well as the emergency management were mostly manifested as result factors in the network and directly affected system function.
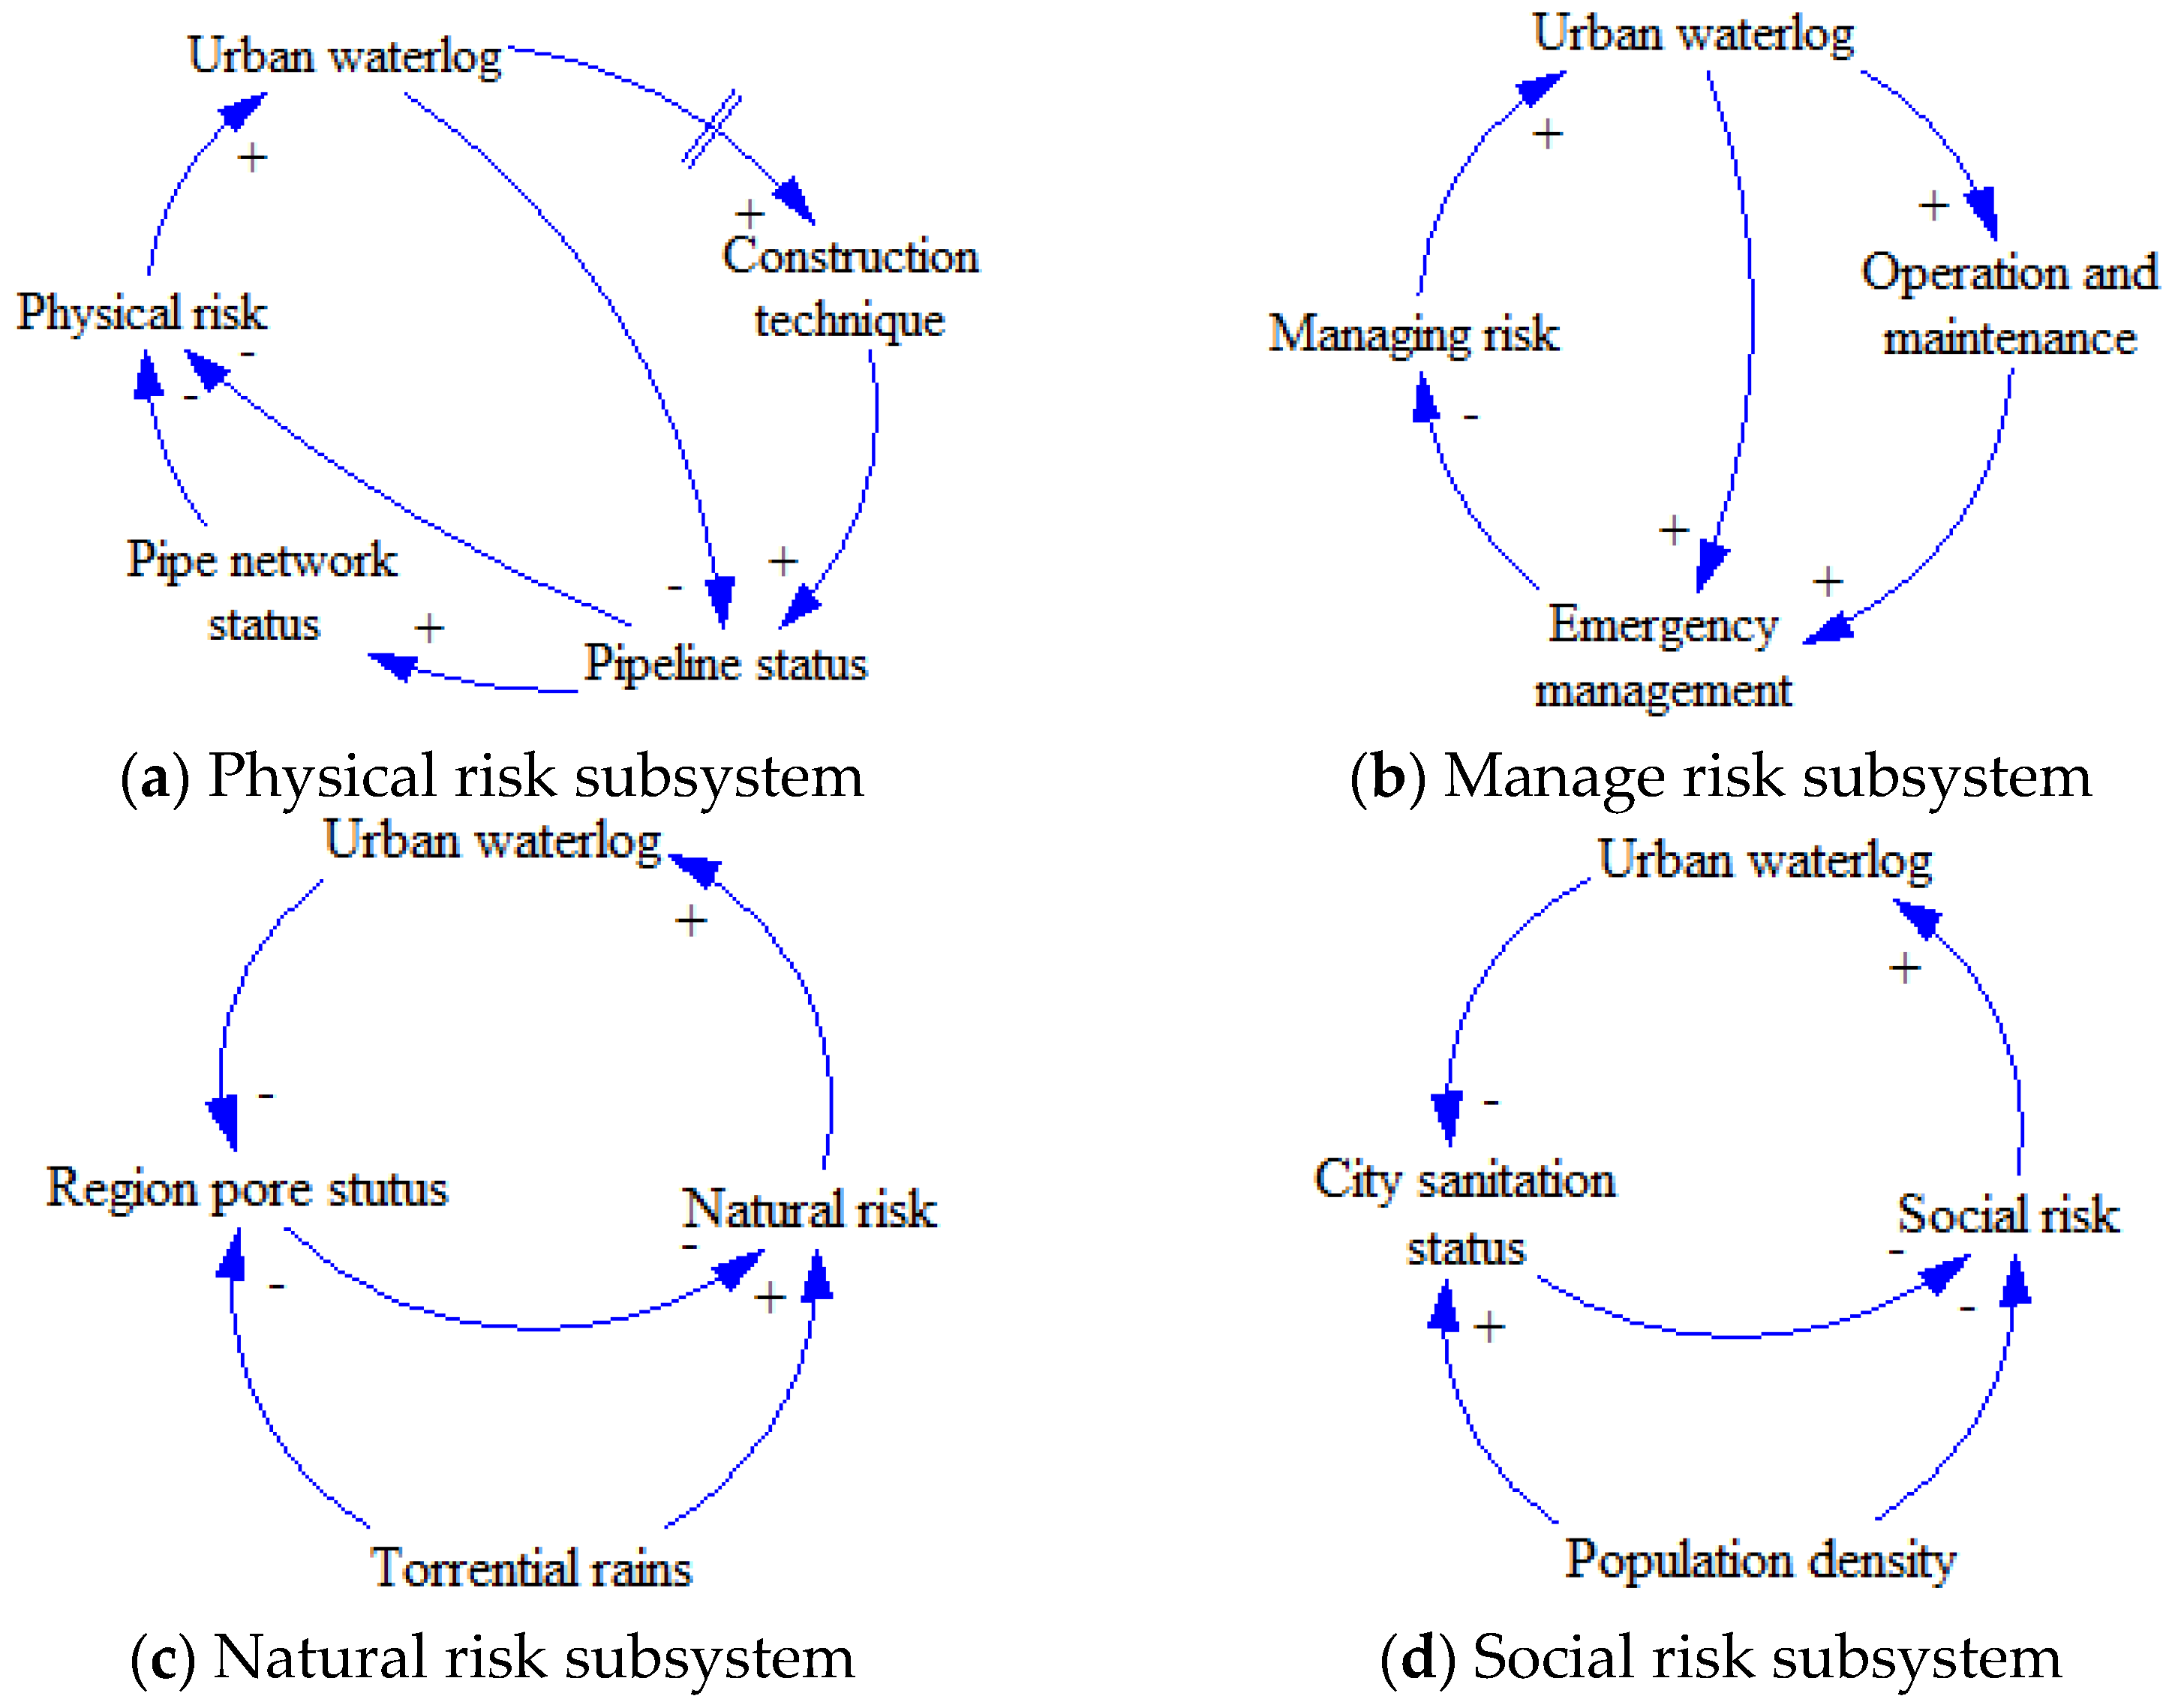
2.3.4. Construction of System Causality Diagram
Based on the multi-layer network model of the urban waterlogging risk system, the causal circuit in the physical risk subsystem could be decomposed as follows:
Urban waterlog → Pipeline status → Pipe network status → Physical risk → Urban waterlog
Urban waterlog → Pipeline status → Physical risk → Urban waterlog
Urban waterlog → Construction technique → Pipeline status → pipe network status → physical risk → urban waterlog
Urban waterlog → Construction technique → Pipeline status → physical risk → urban waterlog
The causality in other subsystems is shown in Figure 3.
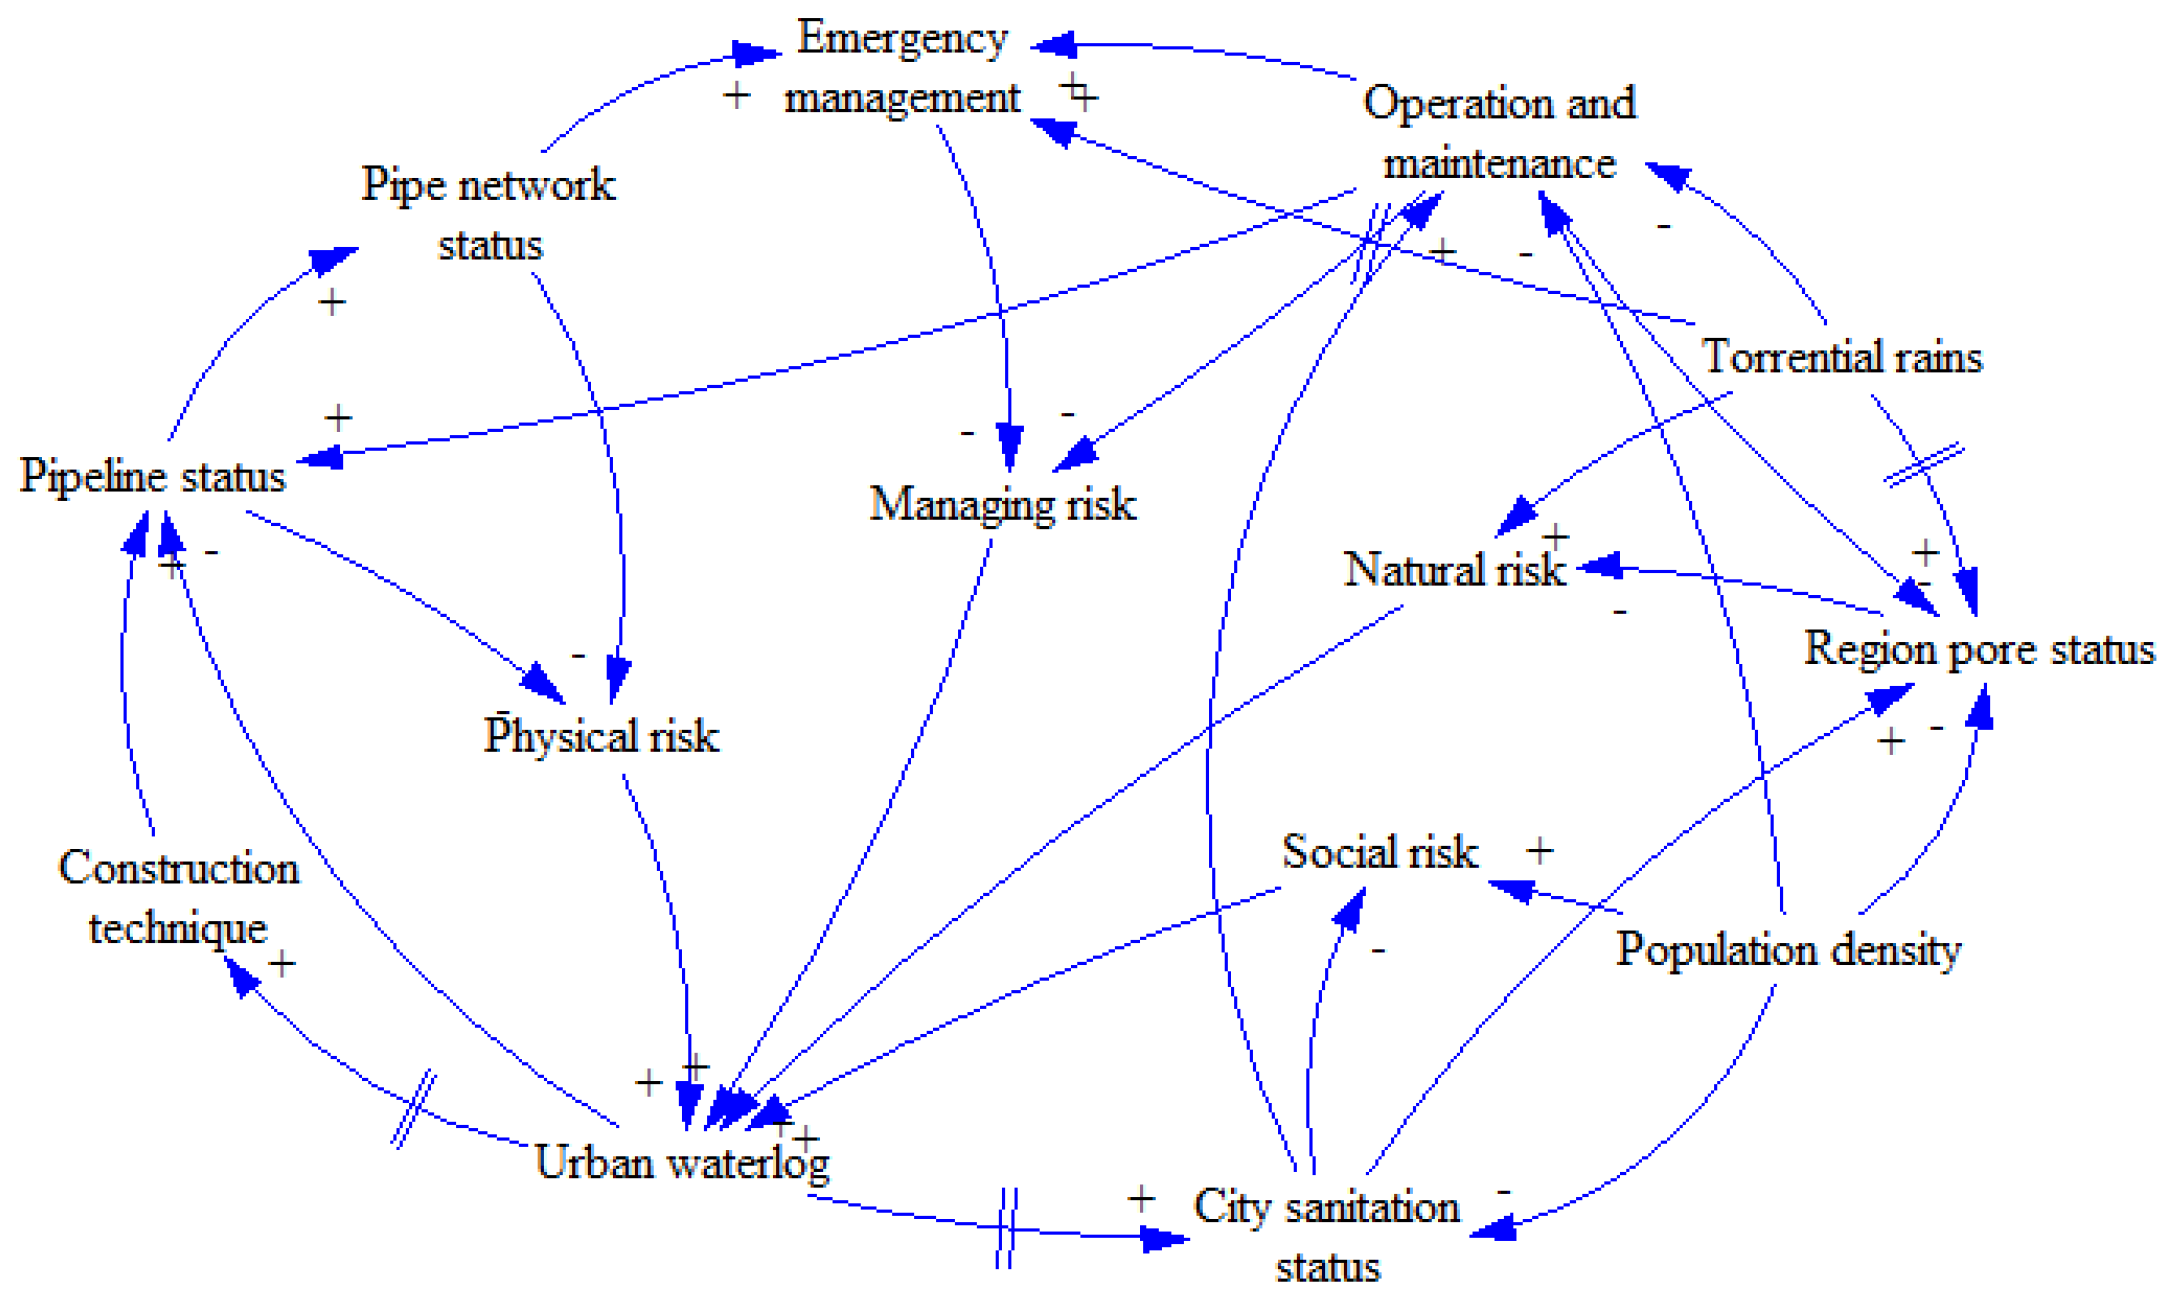
Combining the inter-layer influence of various factors, the system causal relationship was drawn as shown in Figure 4.
2.4. Flow Chart Construction of Urban Waterlogging Risk System
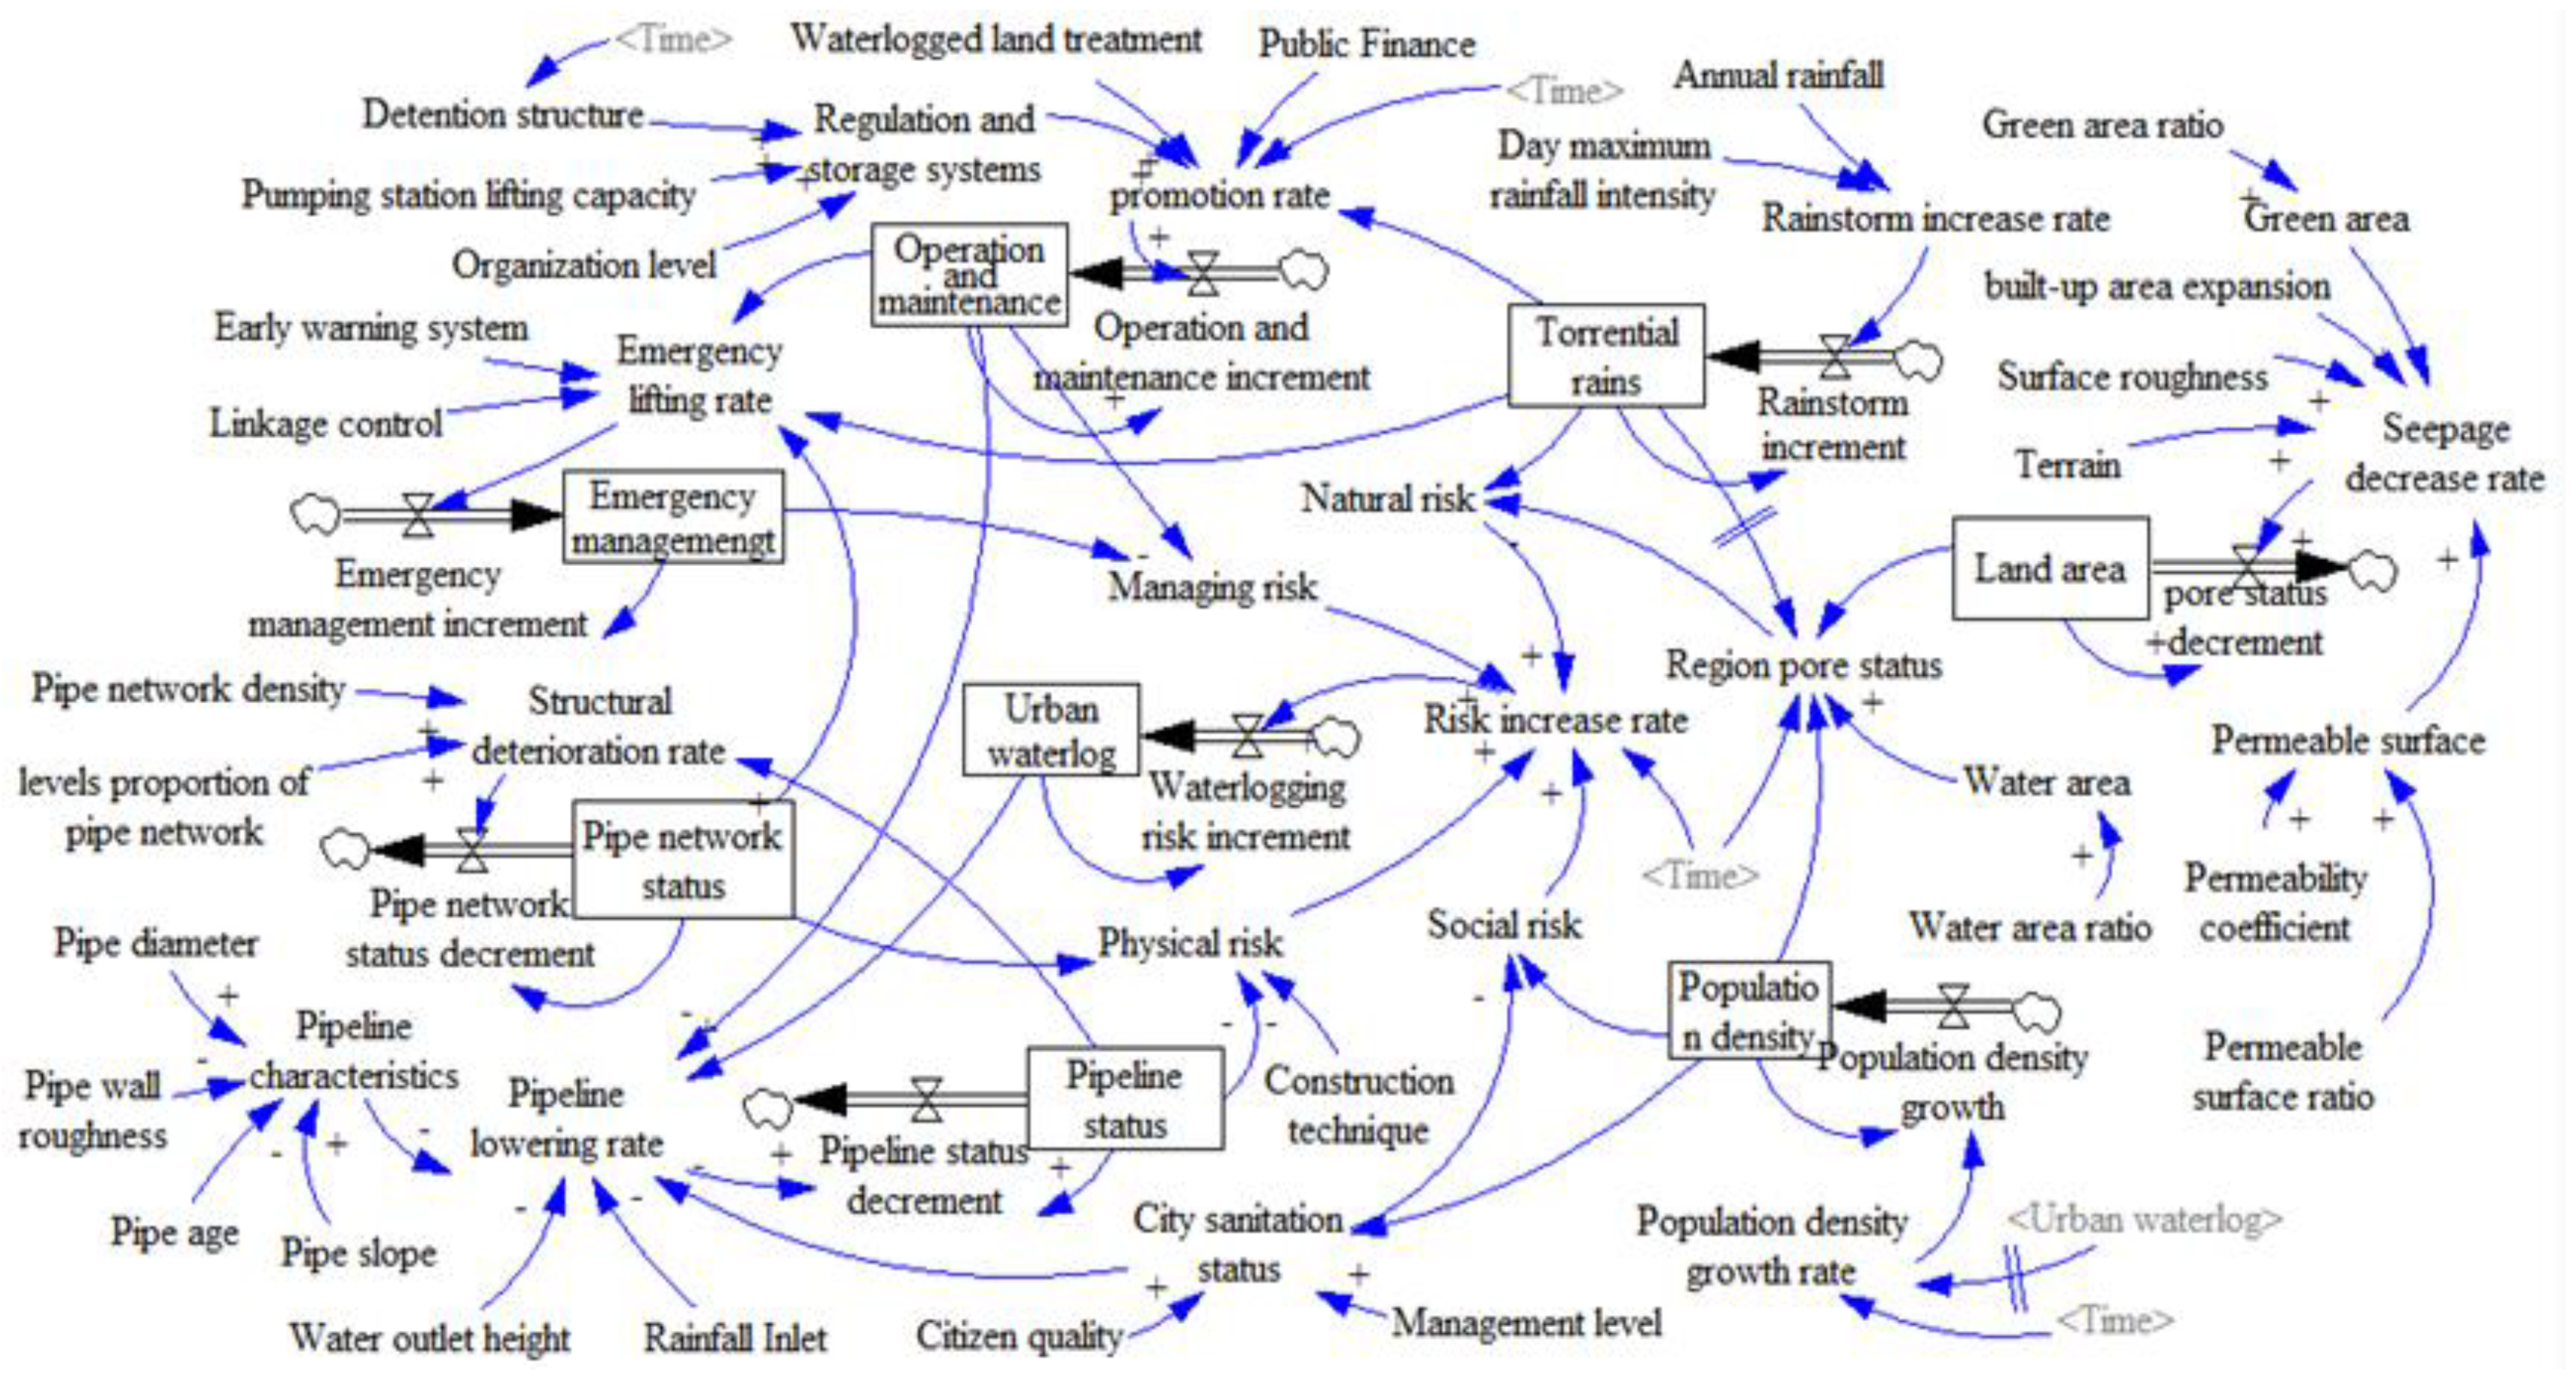
In view of the validity of the model and the availability of data and other factors, auxiliary variables and constant indicators were set, including 26 factors such as green area ratio, build-up area expansion, public finance, citizen quality, etc. The cumulative expression of state variables was used to express the process of the continuous coupling increase of risks, then the system flow diagram was drawn, as shown in Figure 5. It contained 4 leveling variables, 4 rate variables, and 19 auxiliary variables. Furthermore, according to the survey data, based on the model structure logic combined with the expert rating and the revision of the fuzzy analytic hierarchy process, the weight ratio of the indicators was determined to clarify the functional relationship among the variables of the system flow diagram.
For example, we first set the initial parameters of the model as follows:
TIME UNITS = 20 Year,
TIME STEP = 1
Then,
and so on.
Urban waterlog = INTEG(Waterlogging risk increment, Initial value of urban waterlogging),
Waterlogging risk increment = Urban waterlog × Risk increase rate
2.5. Model Simulation
2.5.1. Determination of System Parameters
Based on the dynamic model of the urban waterlogging structure system in Tianjin, the data sources and the initial parameters of the model are described in detail as follows. The model data came from “Tianjin Statistical Yearbook” (2010–2019), “China Statistical Yearbook” (2010–2020), and the cases listed in various news apps and related literature. The missing data in individual years were obtained through trend extrapolation and other methods. The industry standards of China that the parameters mainly referred to included: “Code for Urban Wastewater and Stormwater Engineering Planning” (GB50318-2017), “Code for Design of Outdoor Wastewater Engineering “ (GB50014-2006) (2016 Edition), “Code for Urban Planning on Flood Control”(GB51079-2016), “Sponge City Construction Technology Guide—Low Impact Development Rainwater System Construction” (MOHURD 2014), “Tianjin Special Drainage Plan (2008–2020)”, “Tianjin Central City Drainage and Waterlogging Prevention Comprehensive Plan (2016–2025)”, “ Tianjin City Waterlogging Drainage Master Plan (2011–2020), Tianjin Sponge City Construction Special Plan (2016–2030), “Pipeline Risk Manual”, etc.
The forms of equation parameters were divided into initial value, constant value, mean value, and table function. In this study, the initial value of the parameters was determined by the design standard of the pipe network and the change rate of the data from the design year to the initial year. Taking the urban waterlogging index as an example, the urban waterlogging level could be expressed by various indexes, such as waterlogging depth, waterlogging duration, size of waterlogging area, and annual waterlogging times. However, in order to comprehensively reflect the level of urban waterlogging and to consider the availability of data, this study selected the average return time of the largest month rain fall in every year as the measurement index. In addition, it scored the initial year status based on the design year data, the initial value of urban waterlogging, etc.
Then, the measurement criteria and the parameter values of the relevant indicators were determined with the available data. In the model, parameters that did not change significantly with time were taken as constants, such as city sanitation status, pipe slope, terrain, etc.; rate parameters that changed regularly over time were determined according to the mean value of historical data, such as green area ratio, built-up area expansion, permeable surface ratio, etc.; parameters that changed obviously but not regularly with time were set by table functions, such as detention facilities and waterlogged land treatment, etc. Combined with the data of urban pipeline level, surface runoff characteristics, management level, and social environment in the past ten years, other equation parameters were set. All are shown in Table 1.
2.5.2. Inspection and Simulation
Based on further analysis of data, the meaning of parameters and data sources was tested. After verifying the rationality of causality and the consistency between the model and the system internal mechanism, the model test, the unit test, and the history test were performed to determine the effectiveness of the model.
3. Results
3.1. Initial Simulation Results
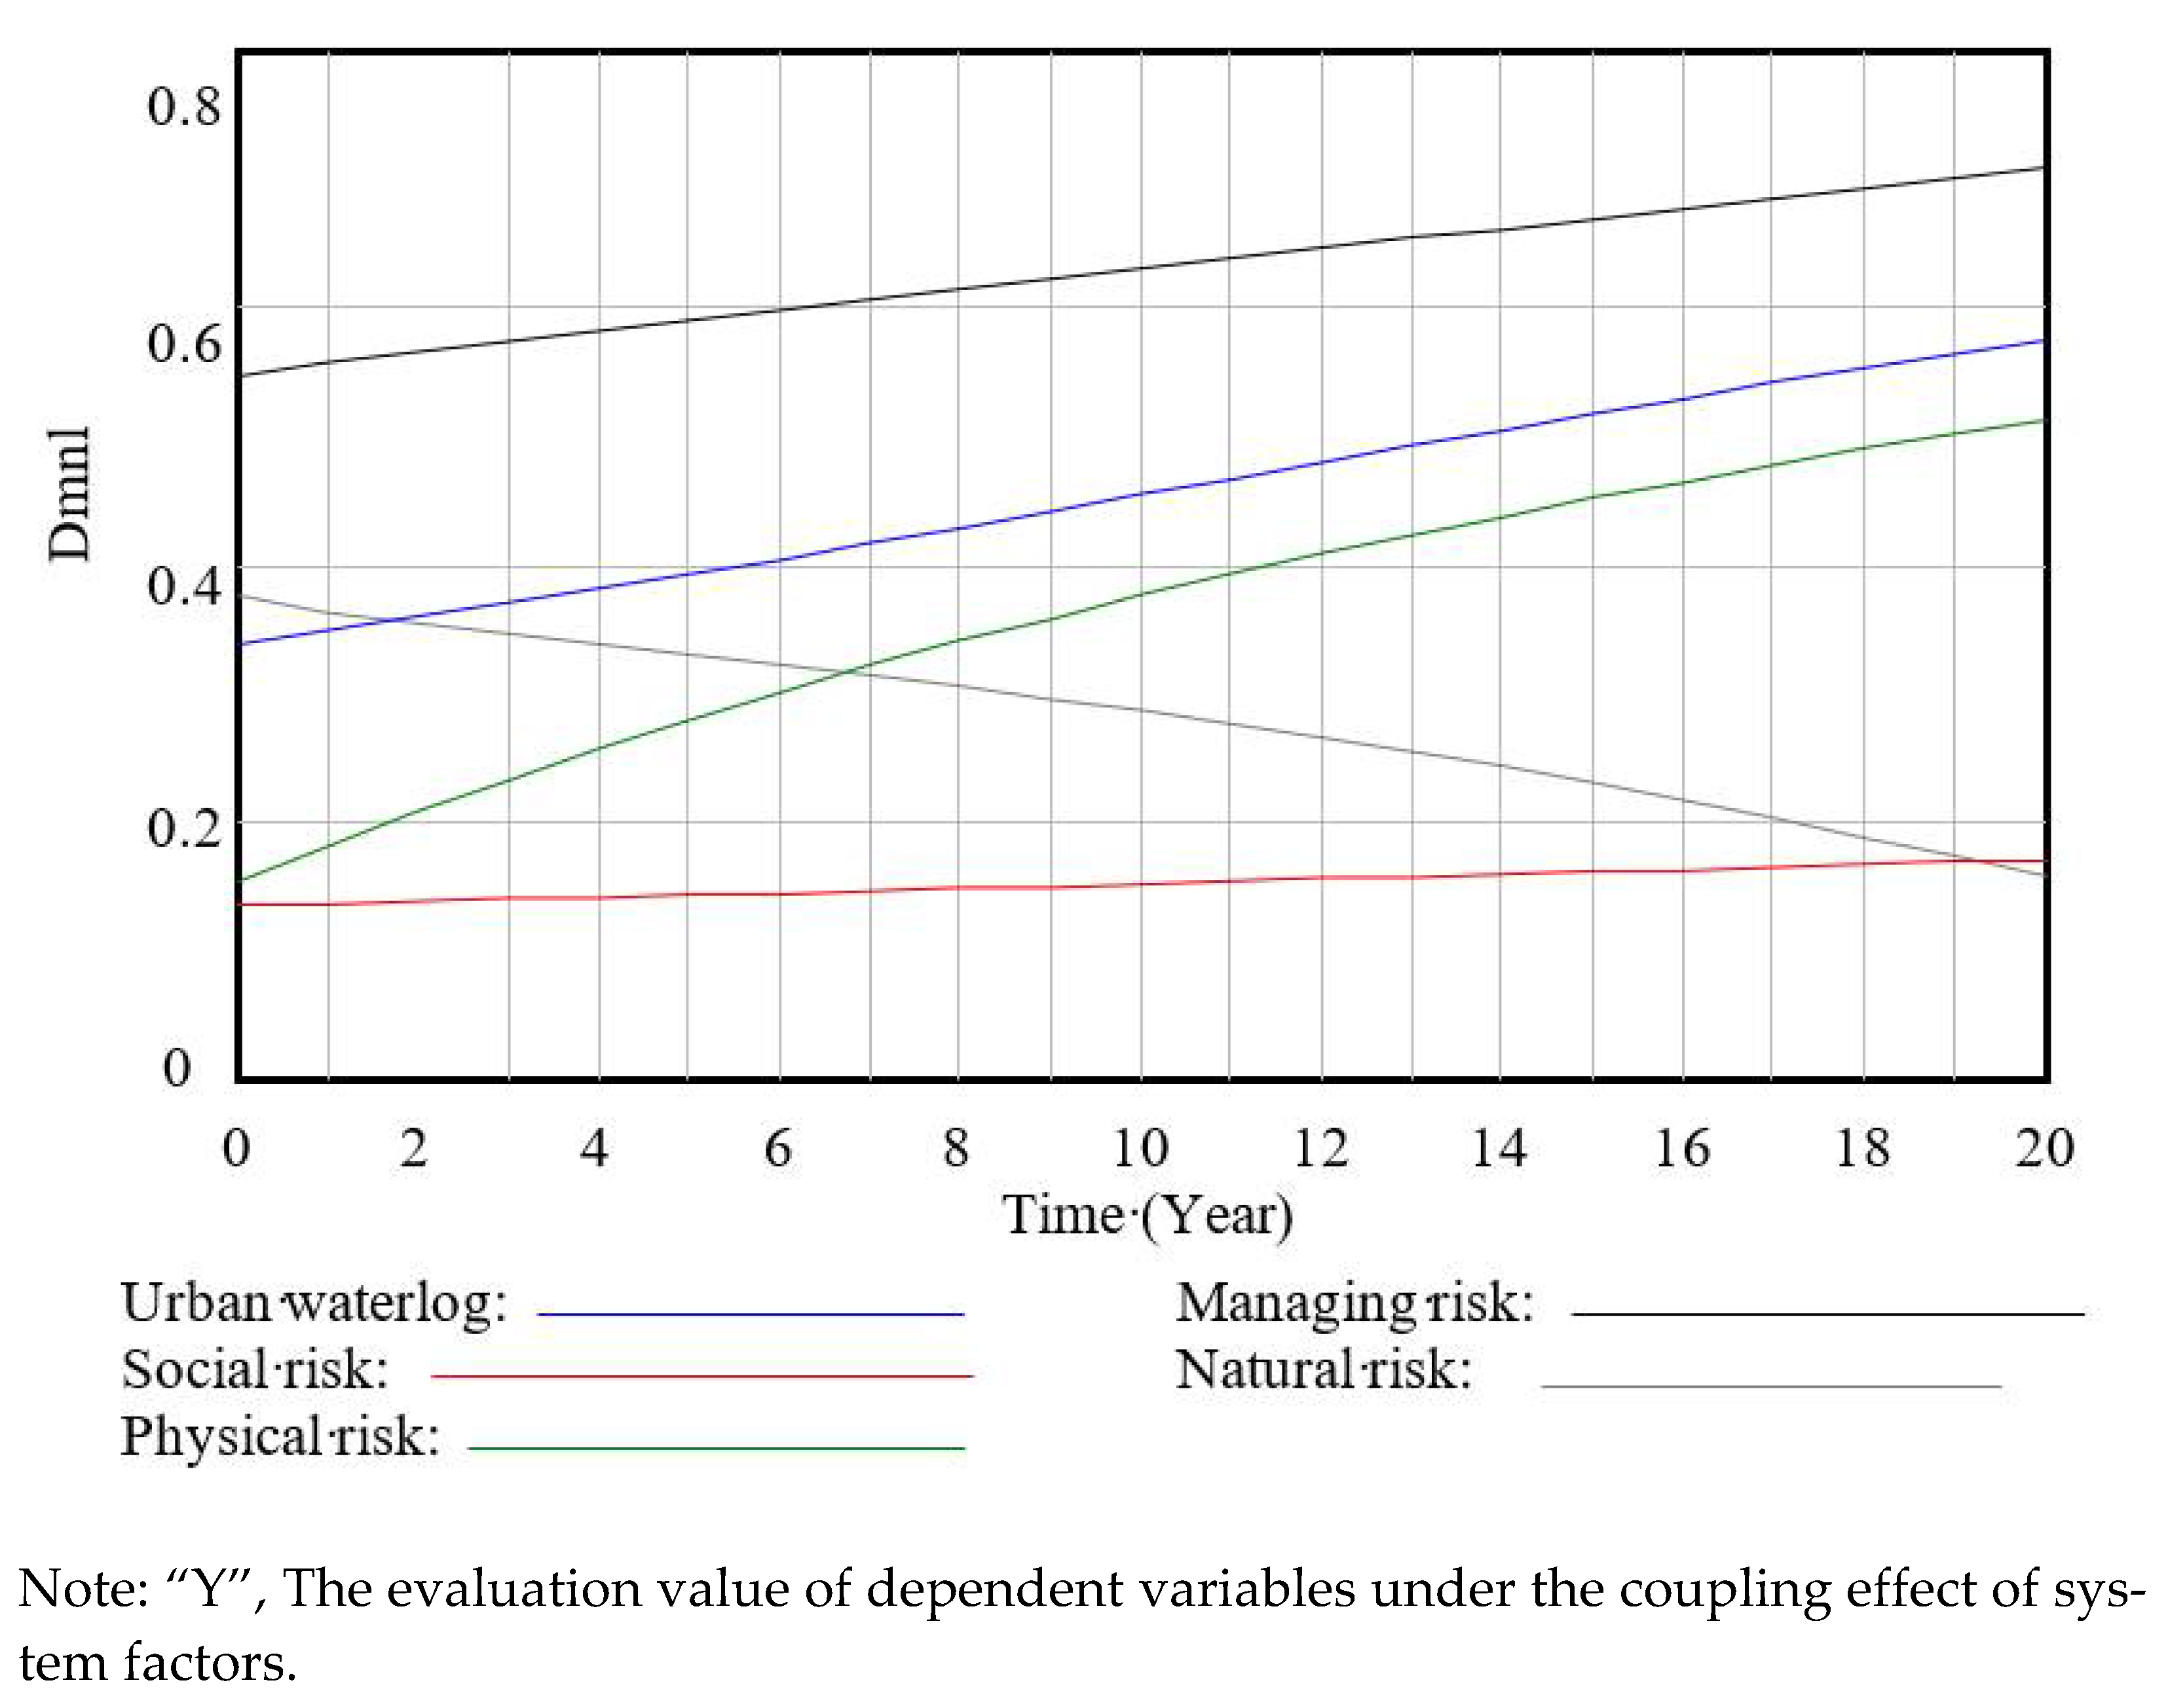
After passing the model inspection, the initial system simulation results were analyzed as follows (Figure 6):
- urban waterlogging accidents were on the rise, but the growth rate was relatively slow;
- Among the four causes of urban waterlogging, natural risk was the most significant one, and it also showed a slow growth trend year by year;
- The change trend of physical risk was the same as that of natural risk, but its value was relatively low;
- The year-on-year decrease of management risk indicated that the improvement of management level might be a feasible mean to control the growth of urban waterlogging.
3.2. Ranking of Sensitive Factors
Sensitivity analysis was carried out to gain a deeper understanding of what causes urban waterlogging and the different influences of various factors on the system variability. This was done to adjust the system constant and to explore the basic mechanism of system operation by comparing the variability of system model behavior under the same change rate of various parameters. In this paper, the constants were set to increase by 10%, and the parameters with high influence on the urban waterlogging index were found as shown in Table 2.
According to the model, when the daily maximum rain increased by 10%, the urban waterlogging risk increased by 0.38%, and when the average annual rainfall increased by 10%, the urban waterlogging risk increased by only 0.18%, which indicated that the influence degree of rain storm was less than 1/10 of the green space rate. Thus, the increase of rainstorm intensity was not the main factor causing waterlogging. Considering the data, although the maximum daily rainfall increased by 89% in ten years, it could not be regarded as the main cause of a general risk phenomenon for its transient and emergent characteristics. However, the average annual rainfall index that more accurately reflected the level of heavy rainfall increased 12% in ten years, and it was quite small when compared to the risk of waterlogging by an increase of 35%. Thus, it could be seen that heavy rain was not the primary factor leading to the risk of urban waterlogging.
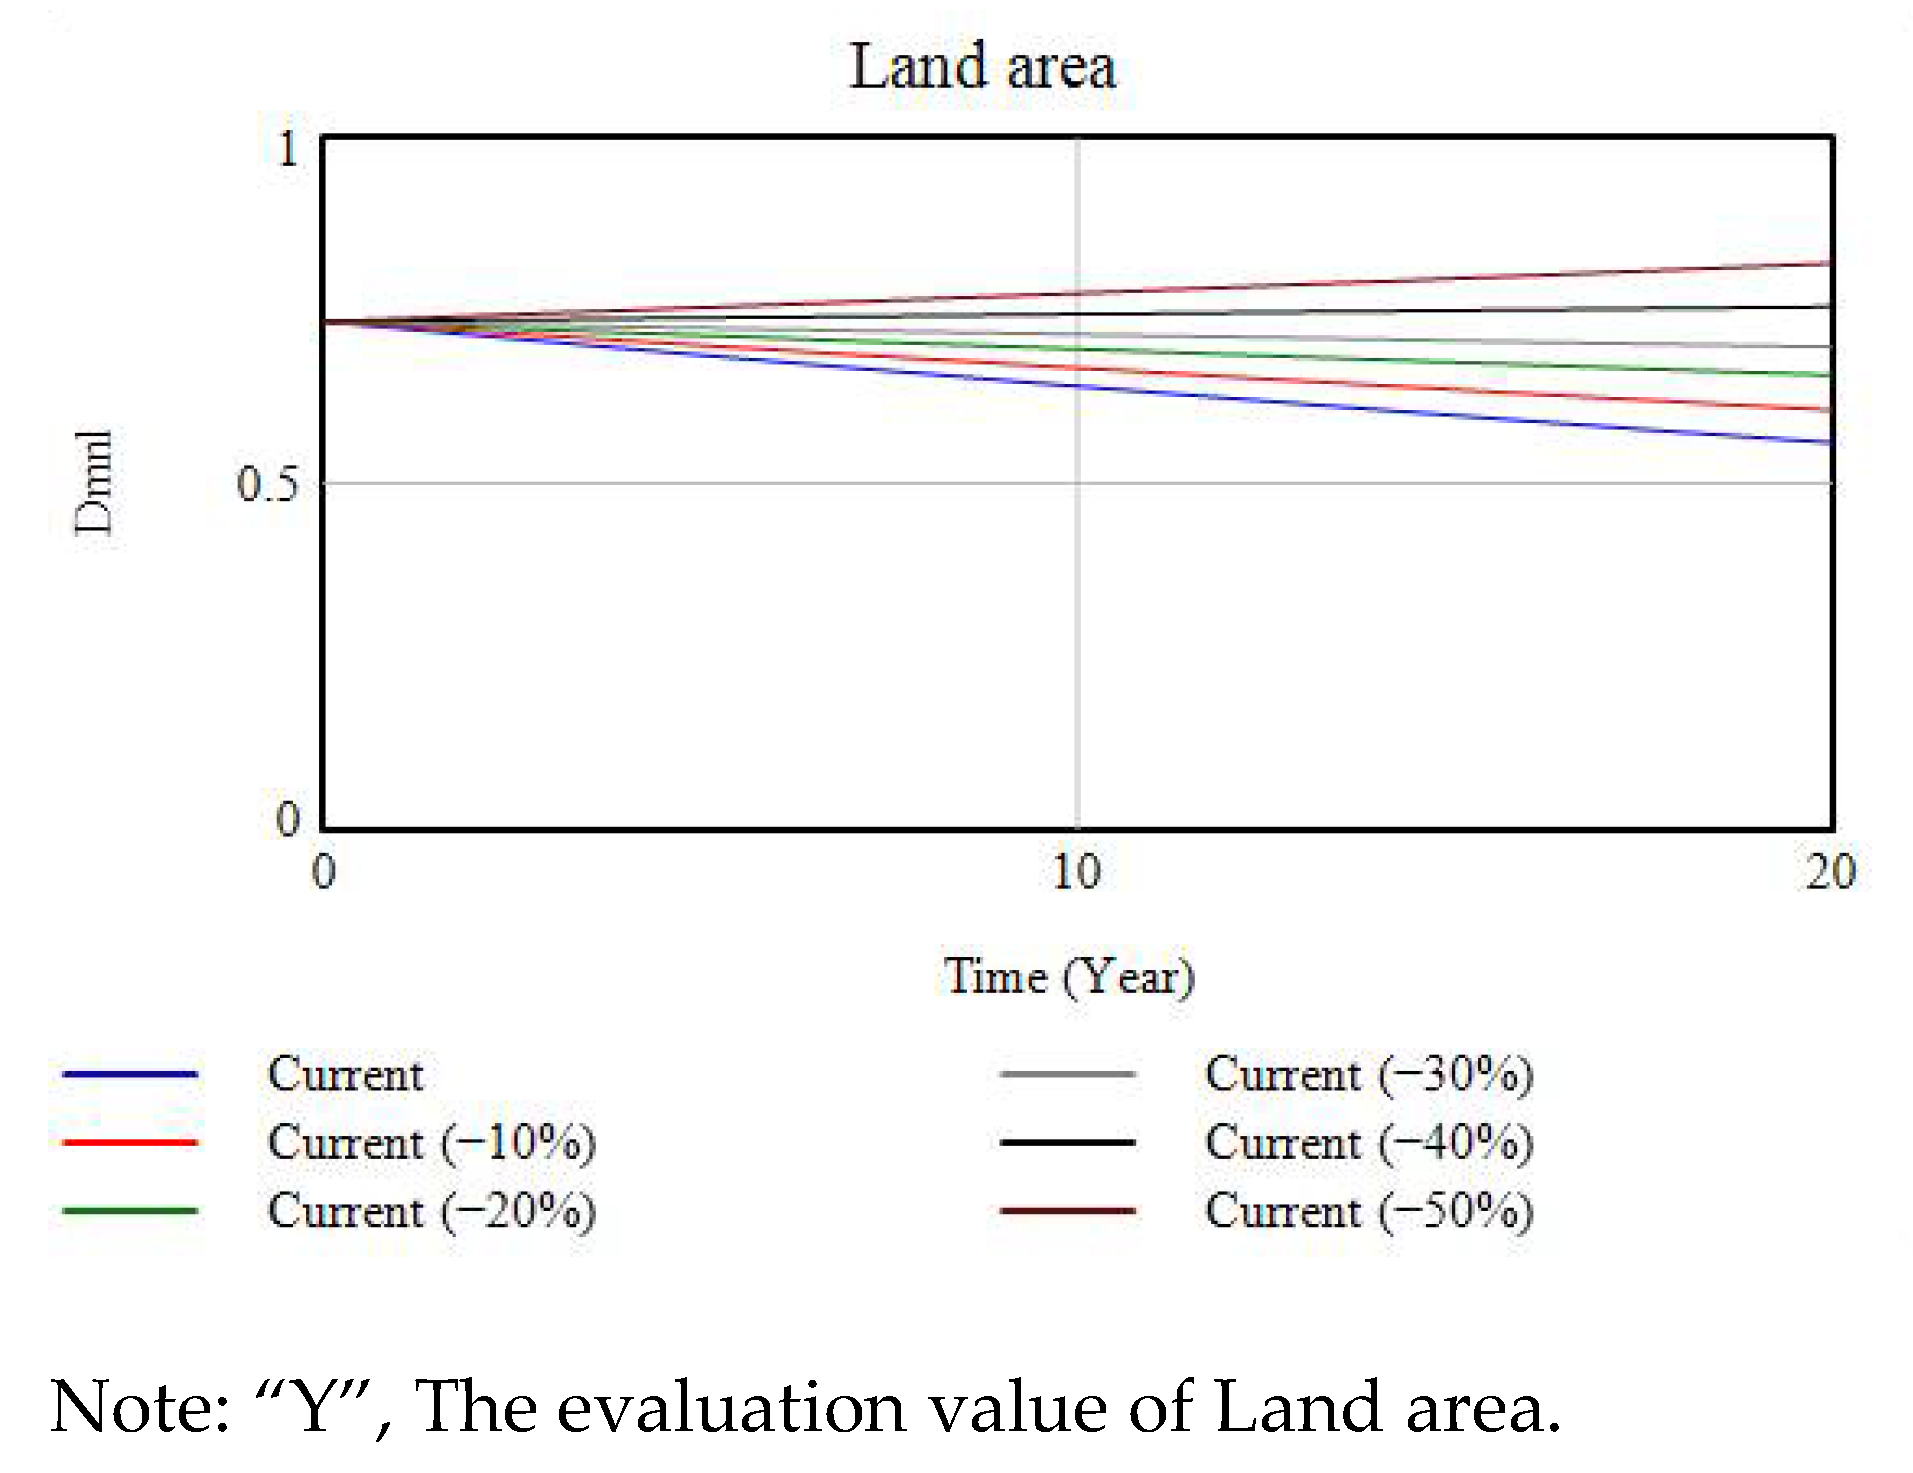
Instead, the expansion of built-up areas was the most likely predictor of the waterlogging risk except the rate of green land, and it might be the main cause of urban waterlogging. In the past nine years, the built-up area of Tianjin increased by 38%. Although the green area ratio also increased by 38% in nine years, and the pervious surface reconstruction projects were also being carried out in succession, the increasing urban waterlogging events hinted that the impact of urban expansion was beyond imagination. According to the simulation analysis, on the premise that the variation rates of other factors remained the status quo, if the urban expansion rate was halved, the downward trend of the region pore status of land area would turn into an upward trend, while the upward trend of urban waterlogging risk would also become flat, as shown in Figure 7 and Figure 8. Coupled with the high sensitivity of the green area ratio to the risk of urban waterlogging, considering ecological restoration and ecological city transformation in future urban planning might be a feasible way to maintain older urban areas.
3.3. Scenario Simulation
3.3.1. Scenario Setting
In view of the results of sensitivity analysis combined with the current situation of the Tianjin drainage system and urban development planning, simulation scenarios were designed on the basis of the original scenario named “Current” in order to obtain more effective governance strategies.
Scenario 1: Sponge City Reconstruction Strategy
The design standard of drainage pipe network in Tianjin was relatively low, whose recurrence period of heavy rain in most areas was once a year. Moreover, due to technical and data age reasons, the precision level of rainstorm intensity formula as the design basis of the pipe network did not well reflect the rainfall law in recent years. At the same time, some areas adopted the confluence system design, or the downstream drainage channels were not smooth, and so on. In view of the limitations of the underground drainage network transformation of the old urban area, the improvement of drainage capacity mainly focused on the improvement of surface runoff characteristics. Therefore, the first design scenario was to optimize the urban construction plan and implement the sponge city transformation by increasing green area ratio as well as permeable surface ratio and permeability coefficient by 10% and 20%, respectively. The specific settings are shown in Table 3.
Scenario 2: Management Optimization Strategy
To analyze the top ten sensitive factors related to the improvement of the system structure, five were related to the improvement of the management level and the physical state of the pipeline, thus the second scenario was set to:
- Improve the physical level of the pipeline through operation and maintenance management methods;
- Use emergency management methods to improve the level of risk management and control.
The specific settings are shown in Table 4.
Scenario 3: The Focus Shifting Strategy on Urban Development
The foregoing analysis shows that urban expansion became a bottleneck that aggravated urban waterlogging and even restricted the development of other aspects of the city. From the perspective of sustainable development, the focus of economic construction should be shifted to rural or low-developed areas to ease the rate of urban expansion. Additionally, the process of urban construction could consider environmental and ecological restoration, which might be an effective strategy for urban waterlogging risk control. Therefore, the third scenario was built-up area expansion, green area ratio, water area ratio, and population density growth rate optimized corresponding to percentage.
The specific settings are shown in Table 5.
3.3.2. Simulation Results of the Scenarios
Scenario 1: Sponge City Reconstruction Strategy
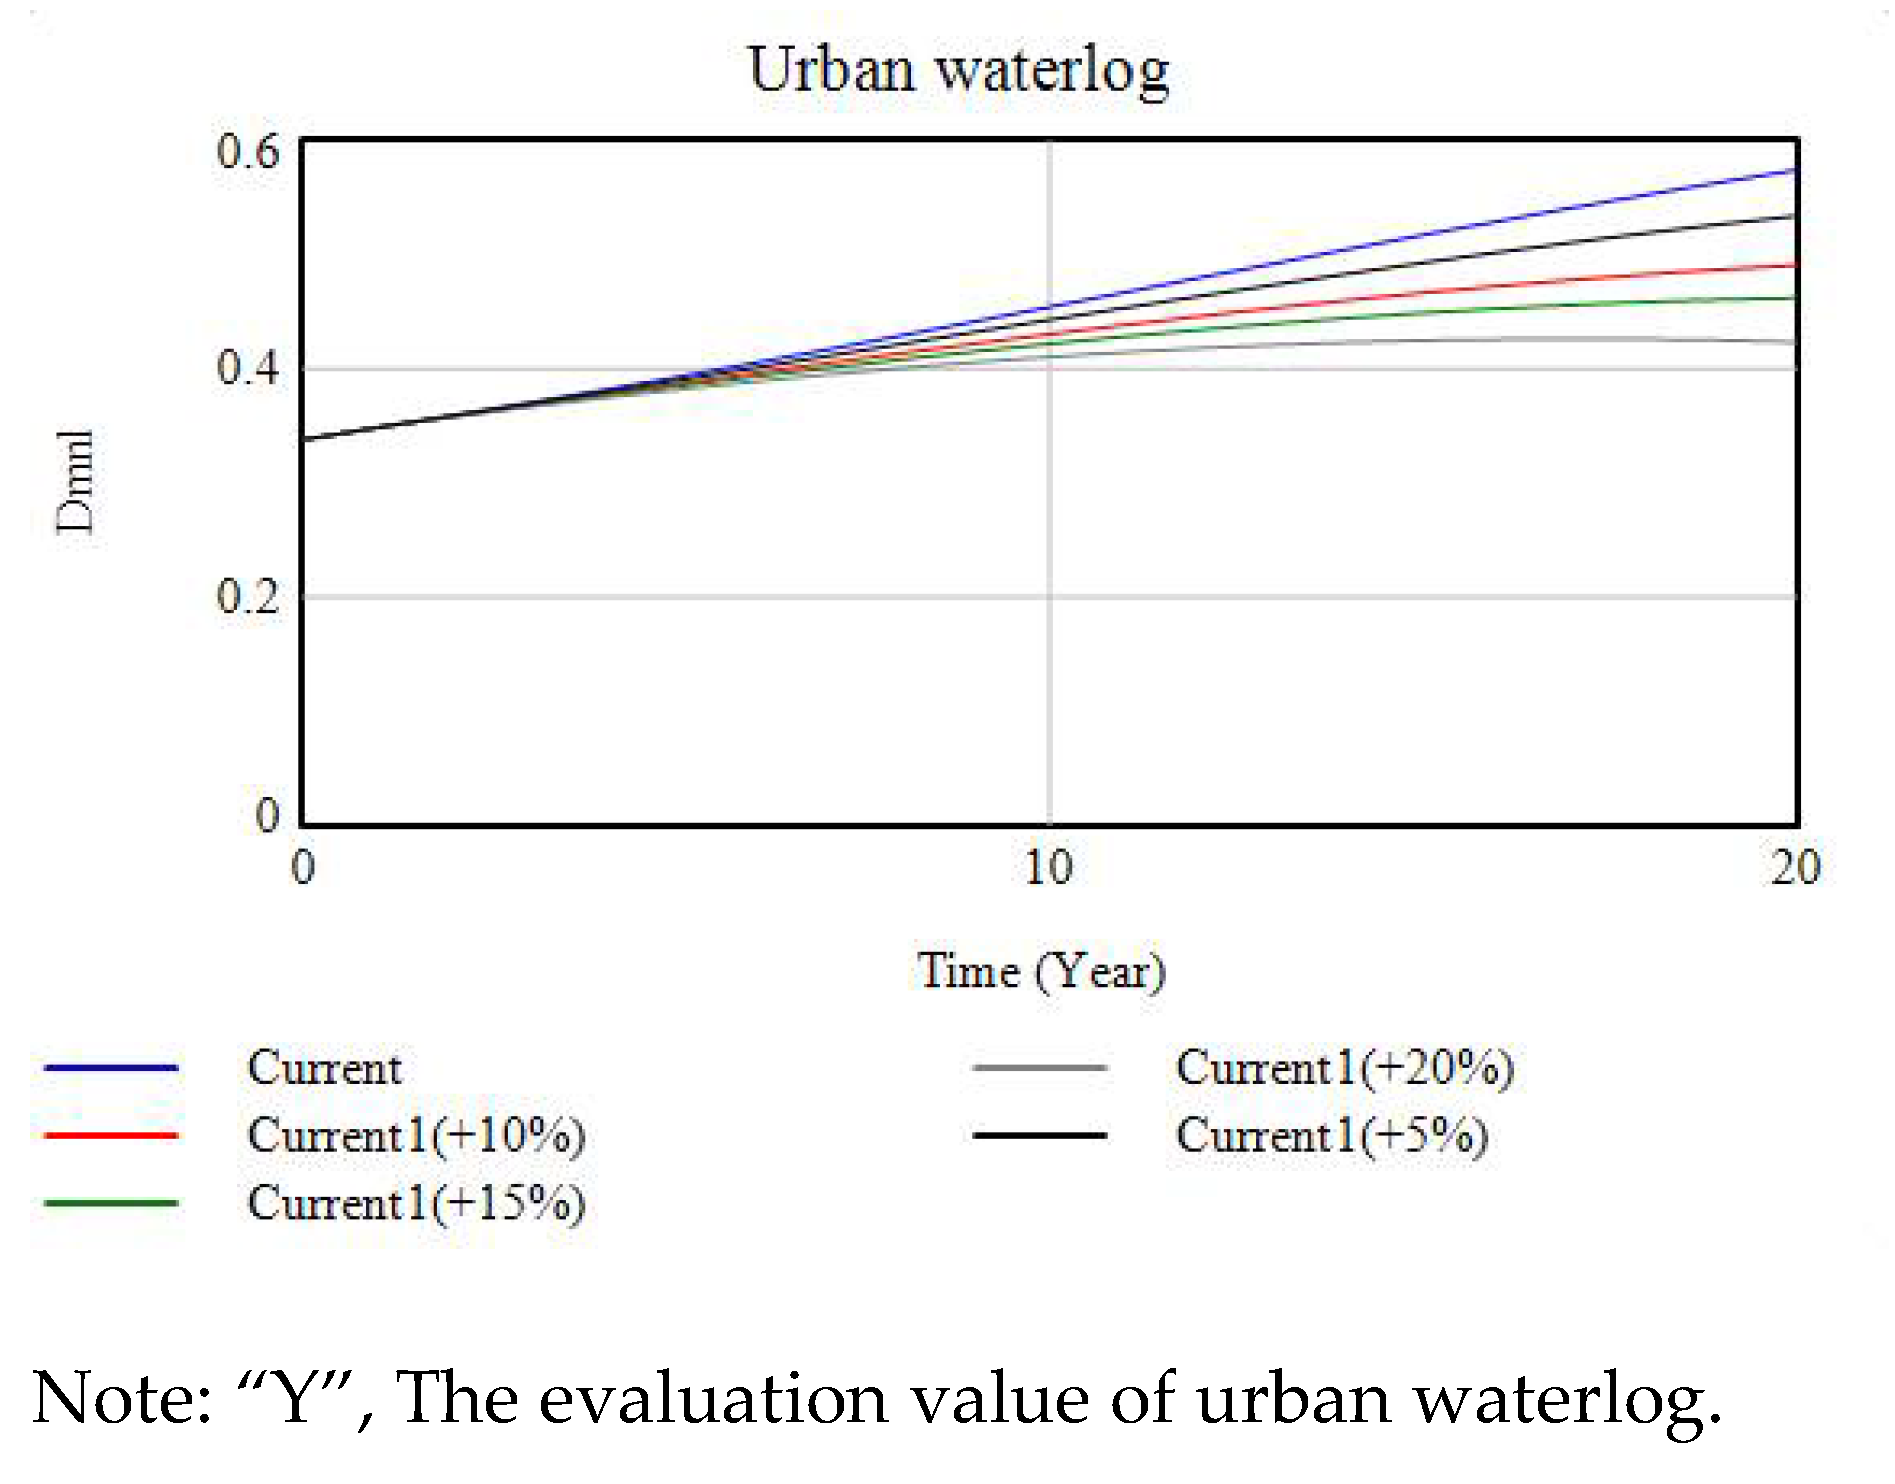
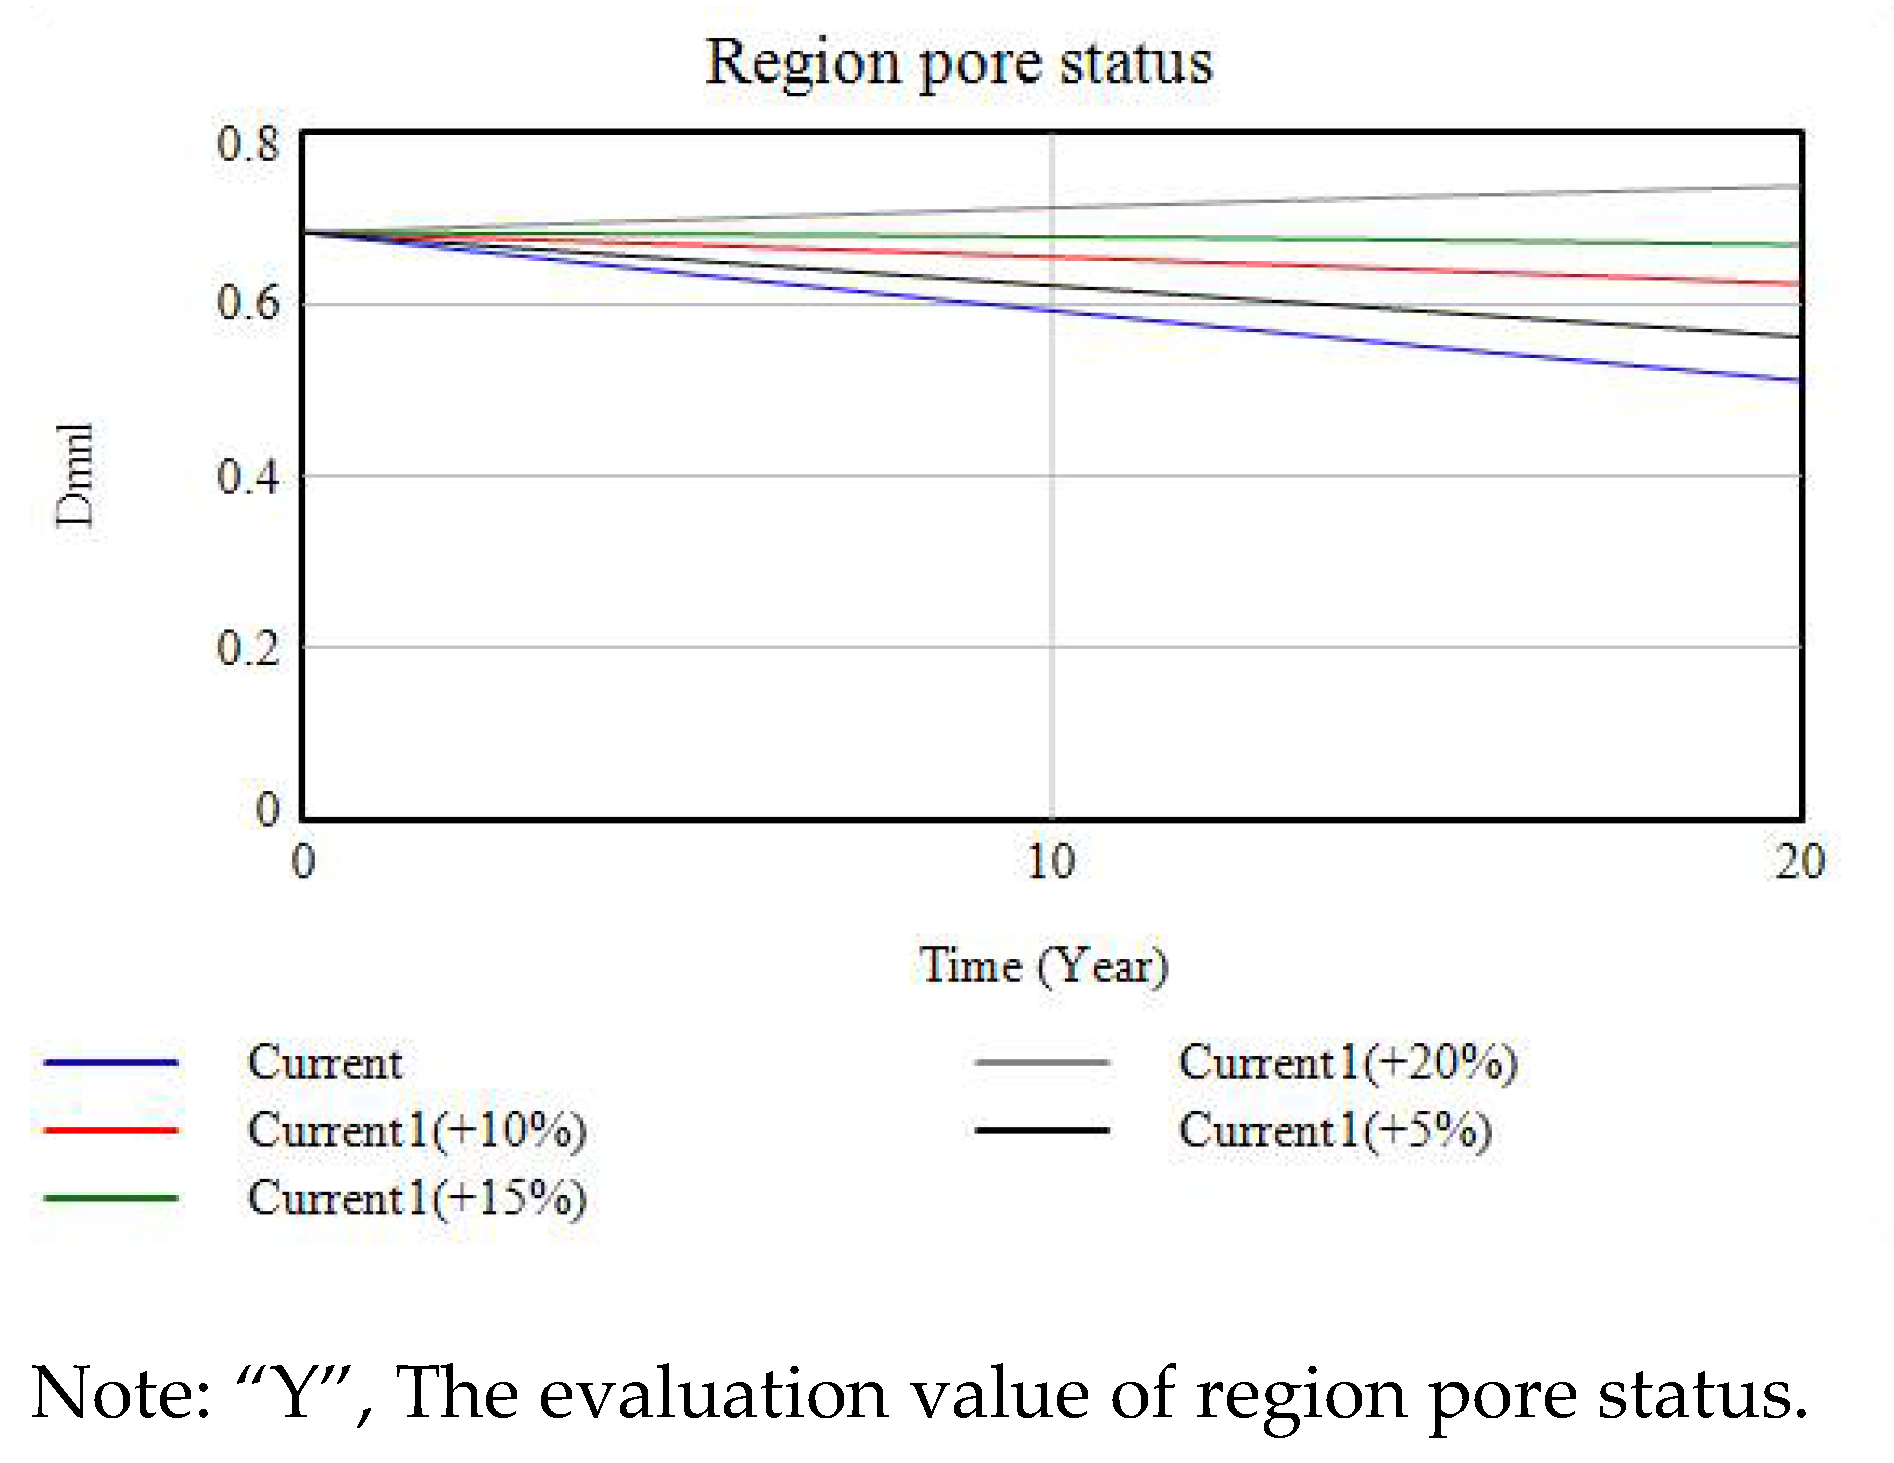
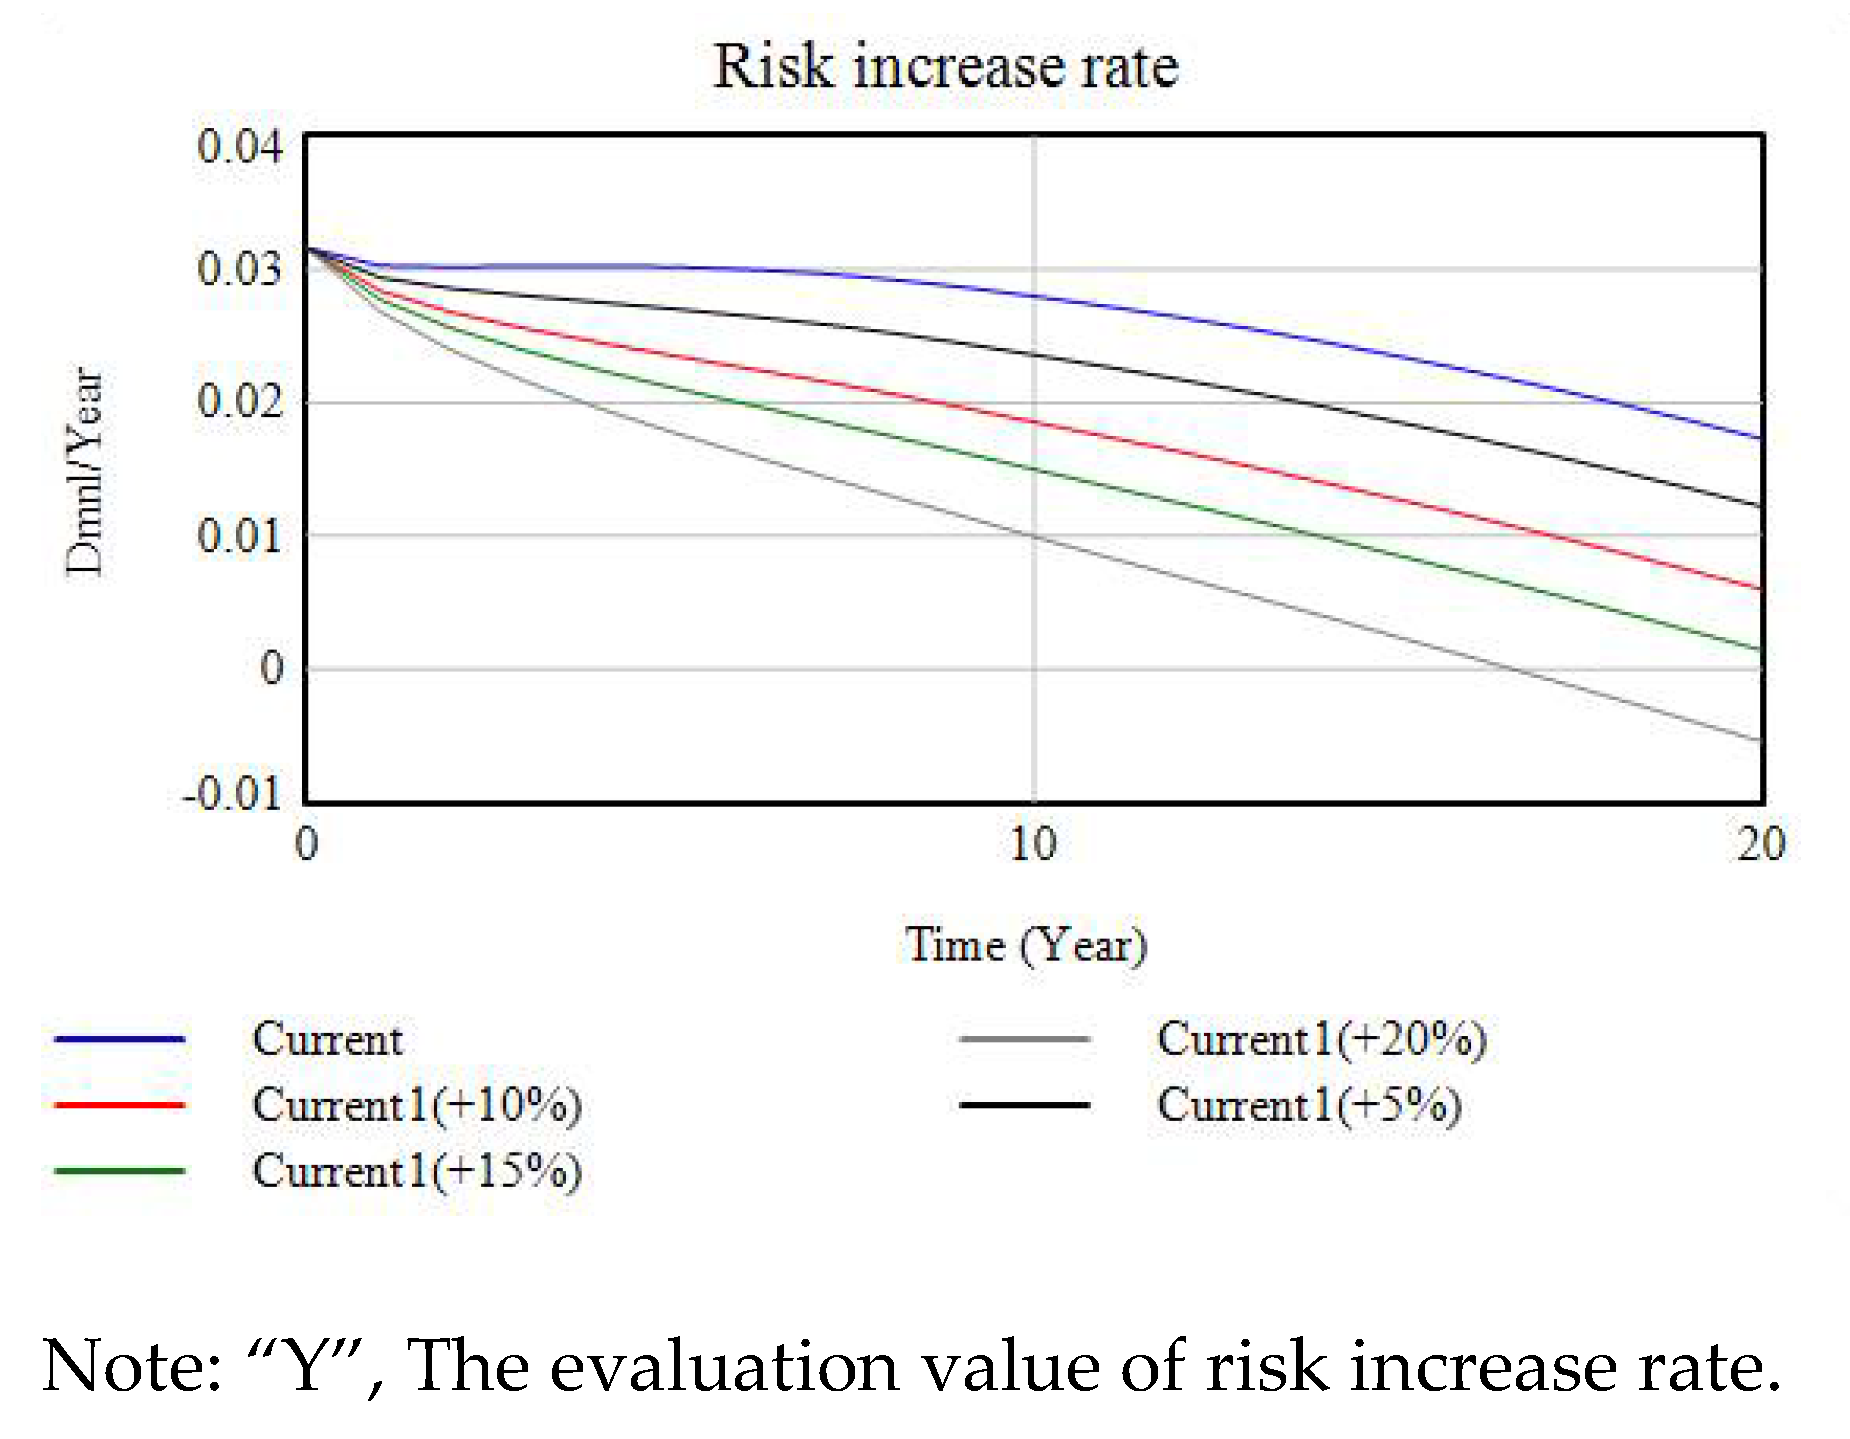
Table 6 and Table 7 show that, when the level of sponge city increased by 10%, the level of region pore status would increase by 22% by 2030, corresponding to a 14.6% reduction in urban waterlogging risk, which was obviously leveled off. When the level of sponge city increased by 20%, the urban risk growth rate would change from positive 0.006 to negative 0.005, with the urban waterlogging risk turning from a rise to a fall in the 10th year. The corresponding change trend is shown in Figure 9, Figure 10 and Figure 11.
Scenario 2: Management Optimization Strategy
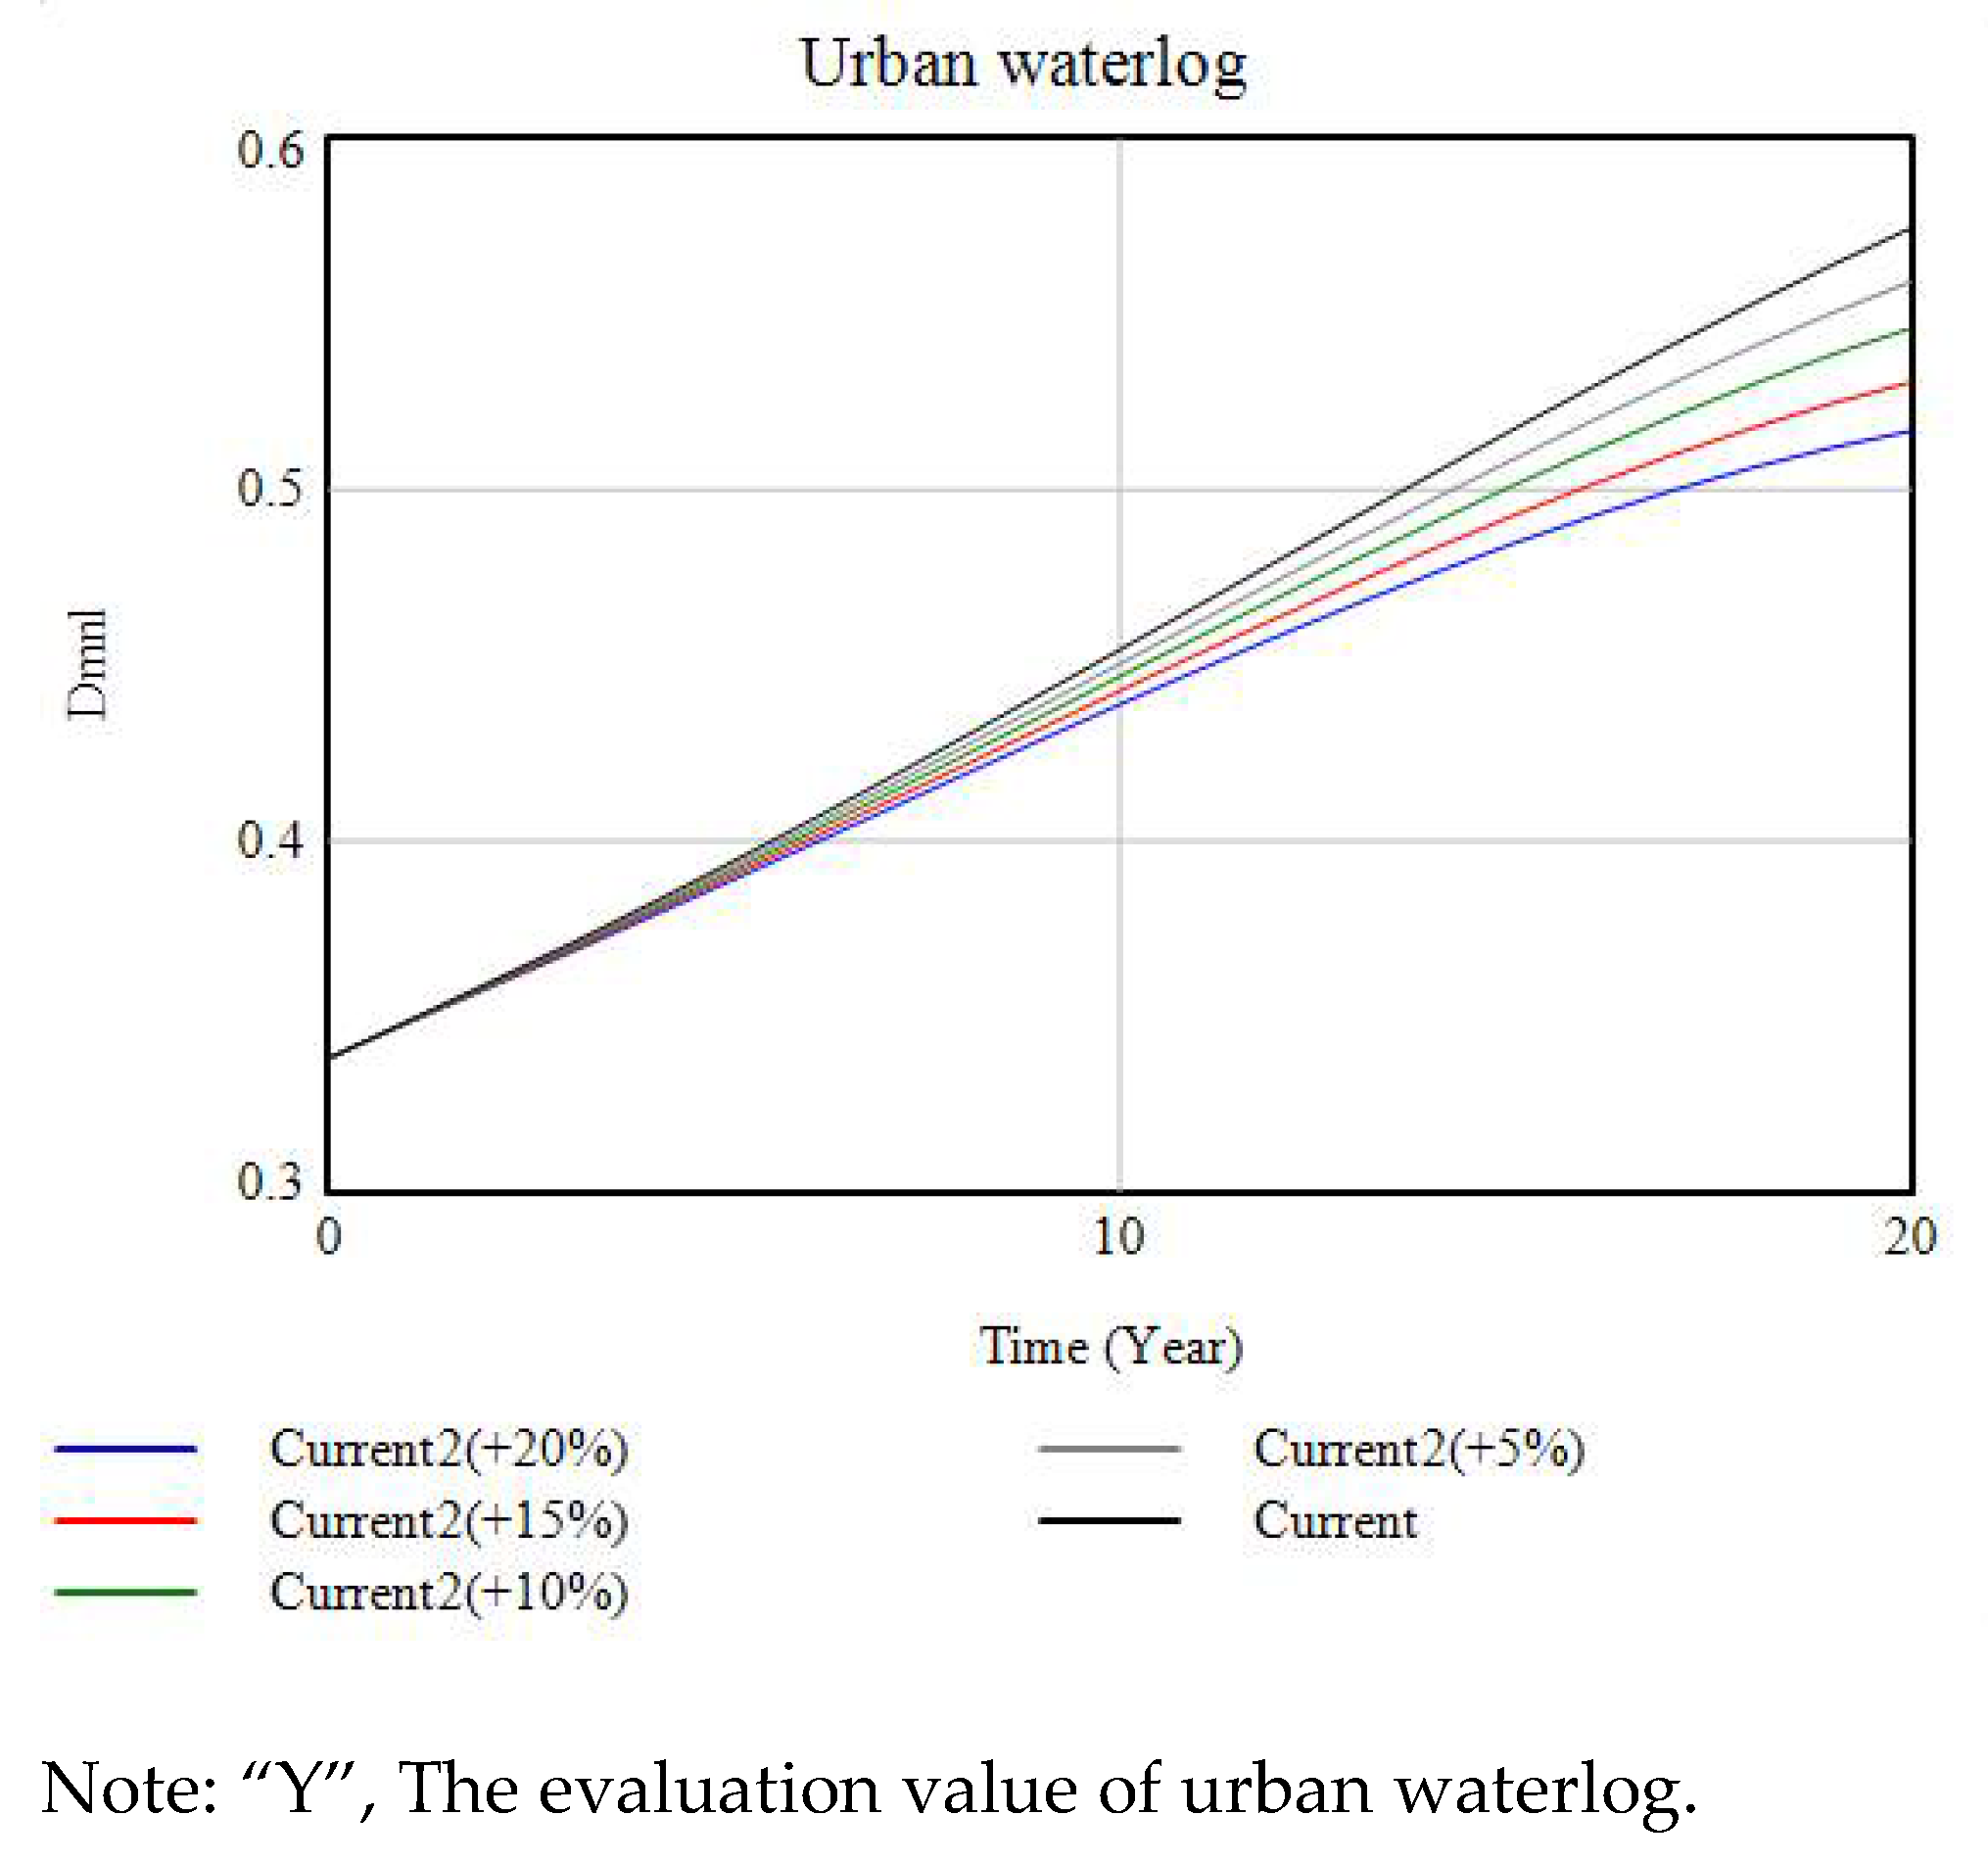
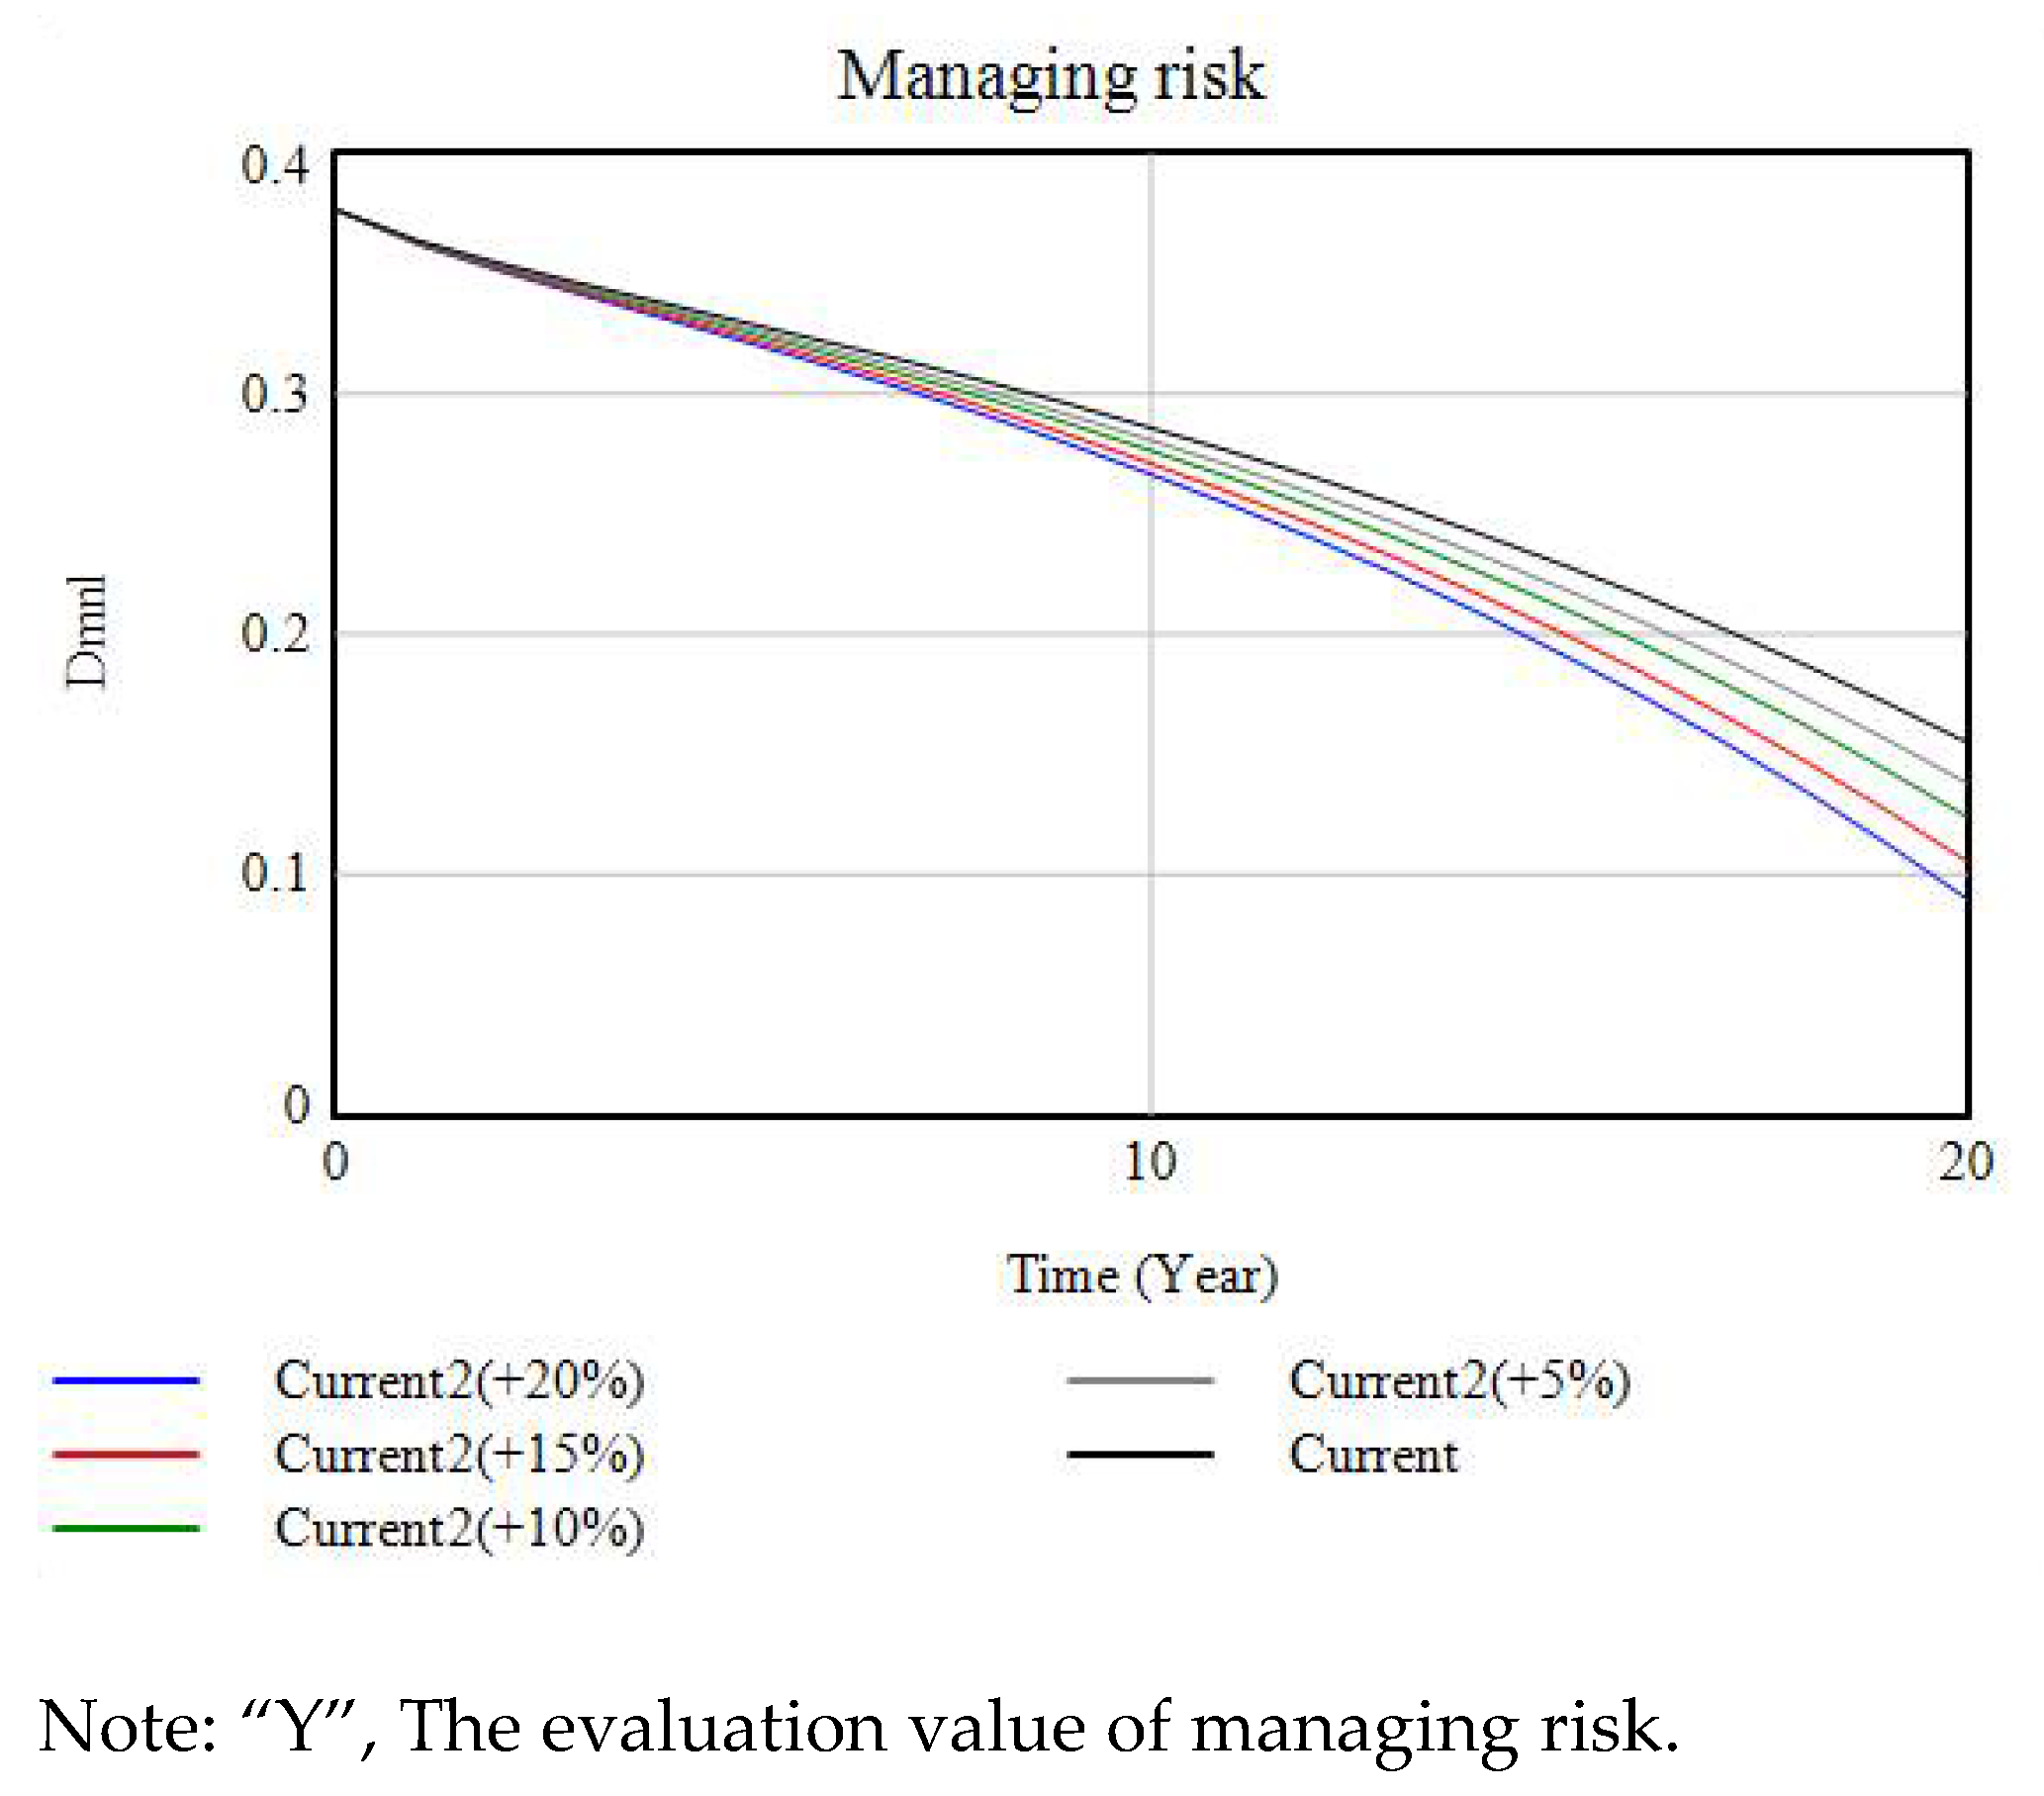
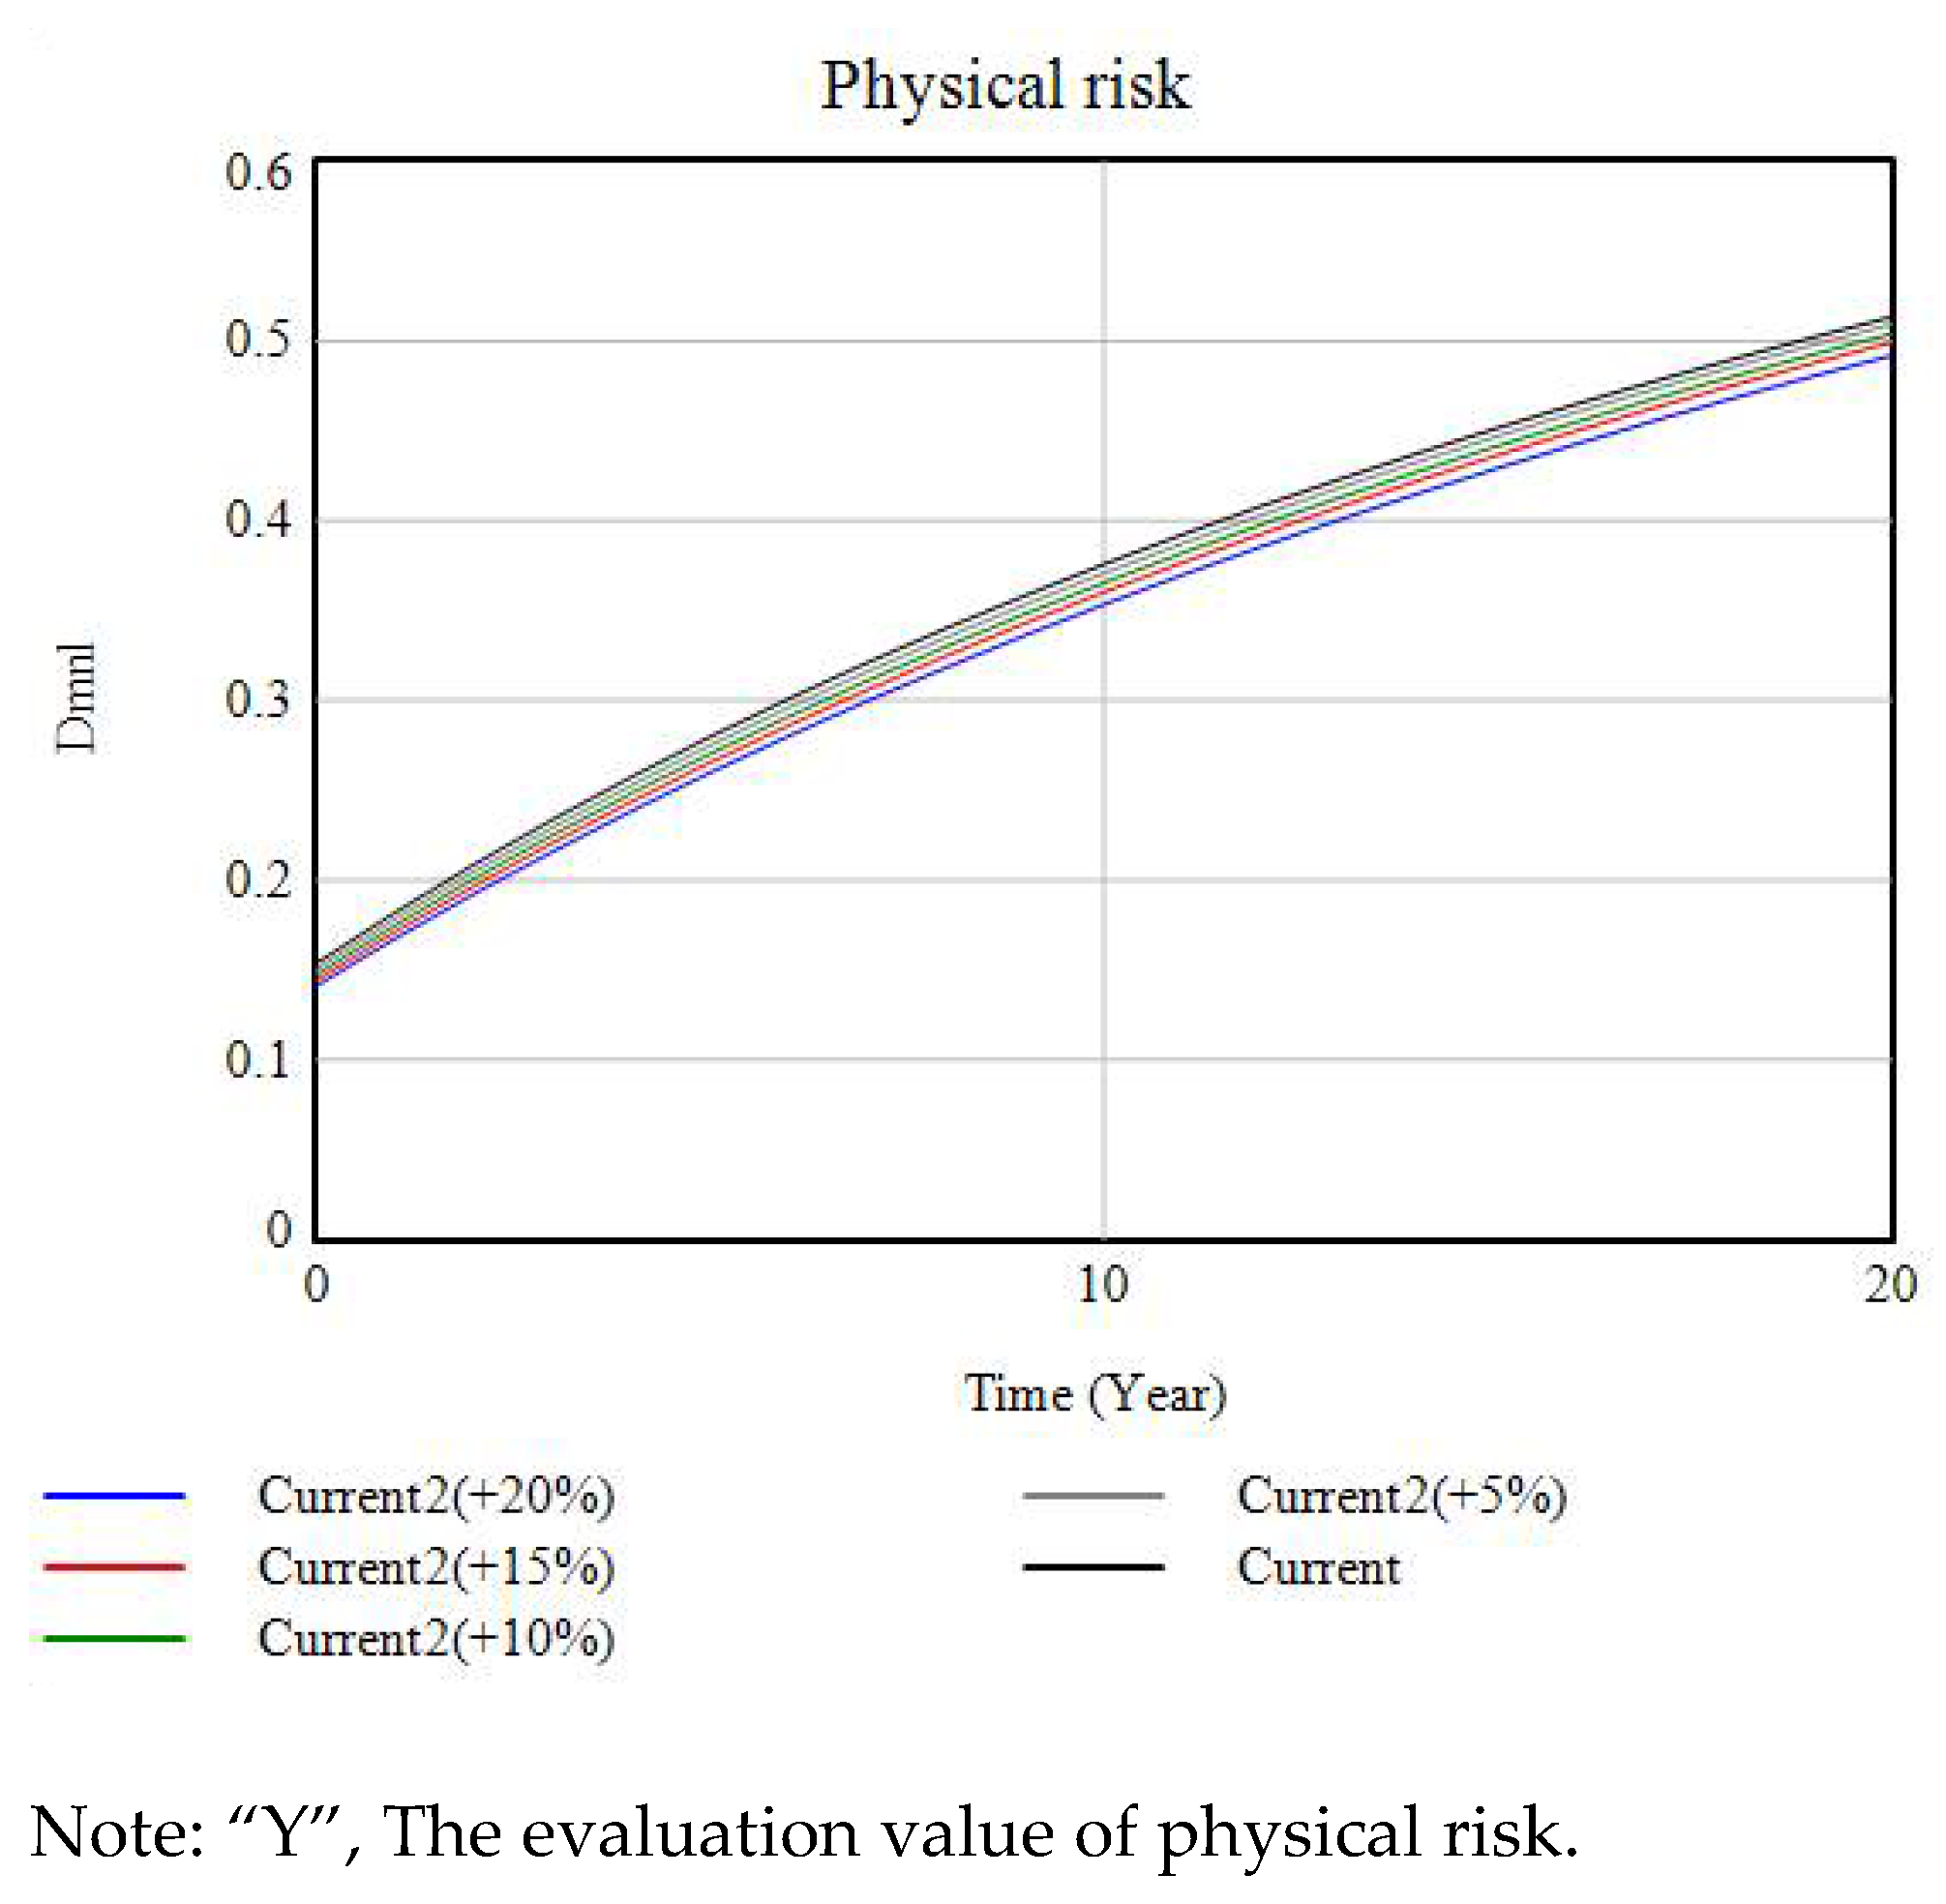
Similar to the trend of scenario one, when the management level improved, the urban waterlogging risk presented a corresponding control state. According to the data in Table 8, Table 9 and Table 10, by 2030, when the management effect was improved by 10%, the management risk was reduced by 20%, the physical risk was reduced by 1.8%, and the urban waterlogging risk was reduced by 5%. When the management effect was improved by 20%, the management risk was reduced by 41.9%, the physical risk was reduced by 4.2%, and the urban waterlogging risk was reduced by 10.1%. The change trend is shown in Figure 12, Figure 13 and Figure 14.
Scenario 3: The Focus Shifting Strategy on Urban Development
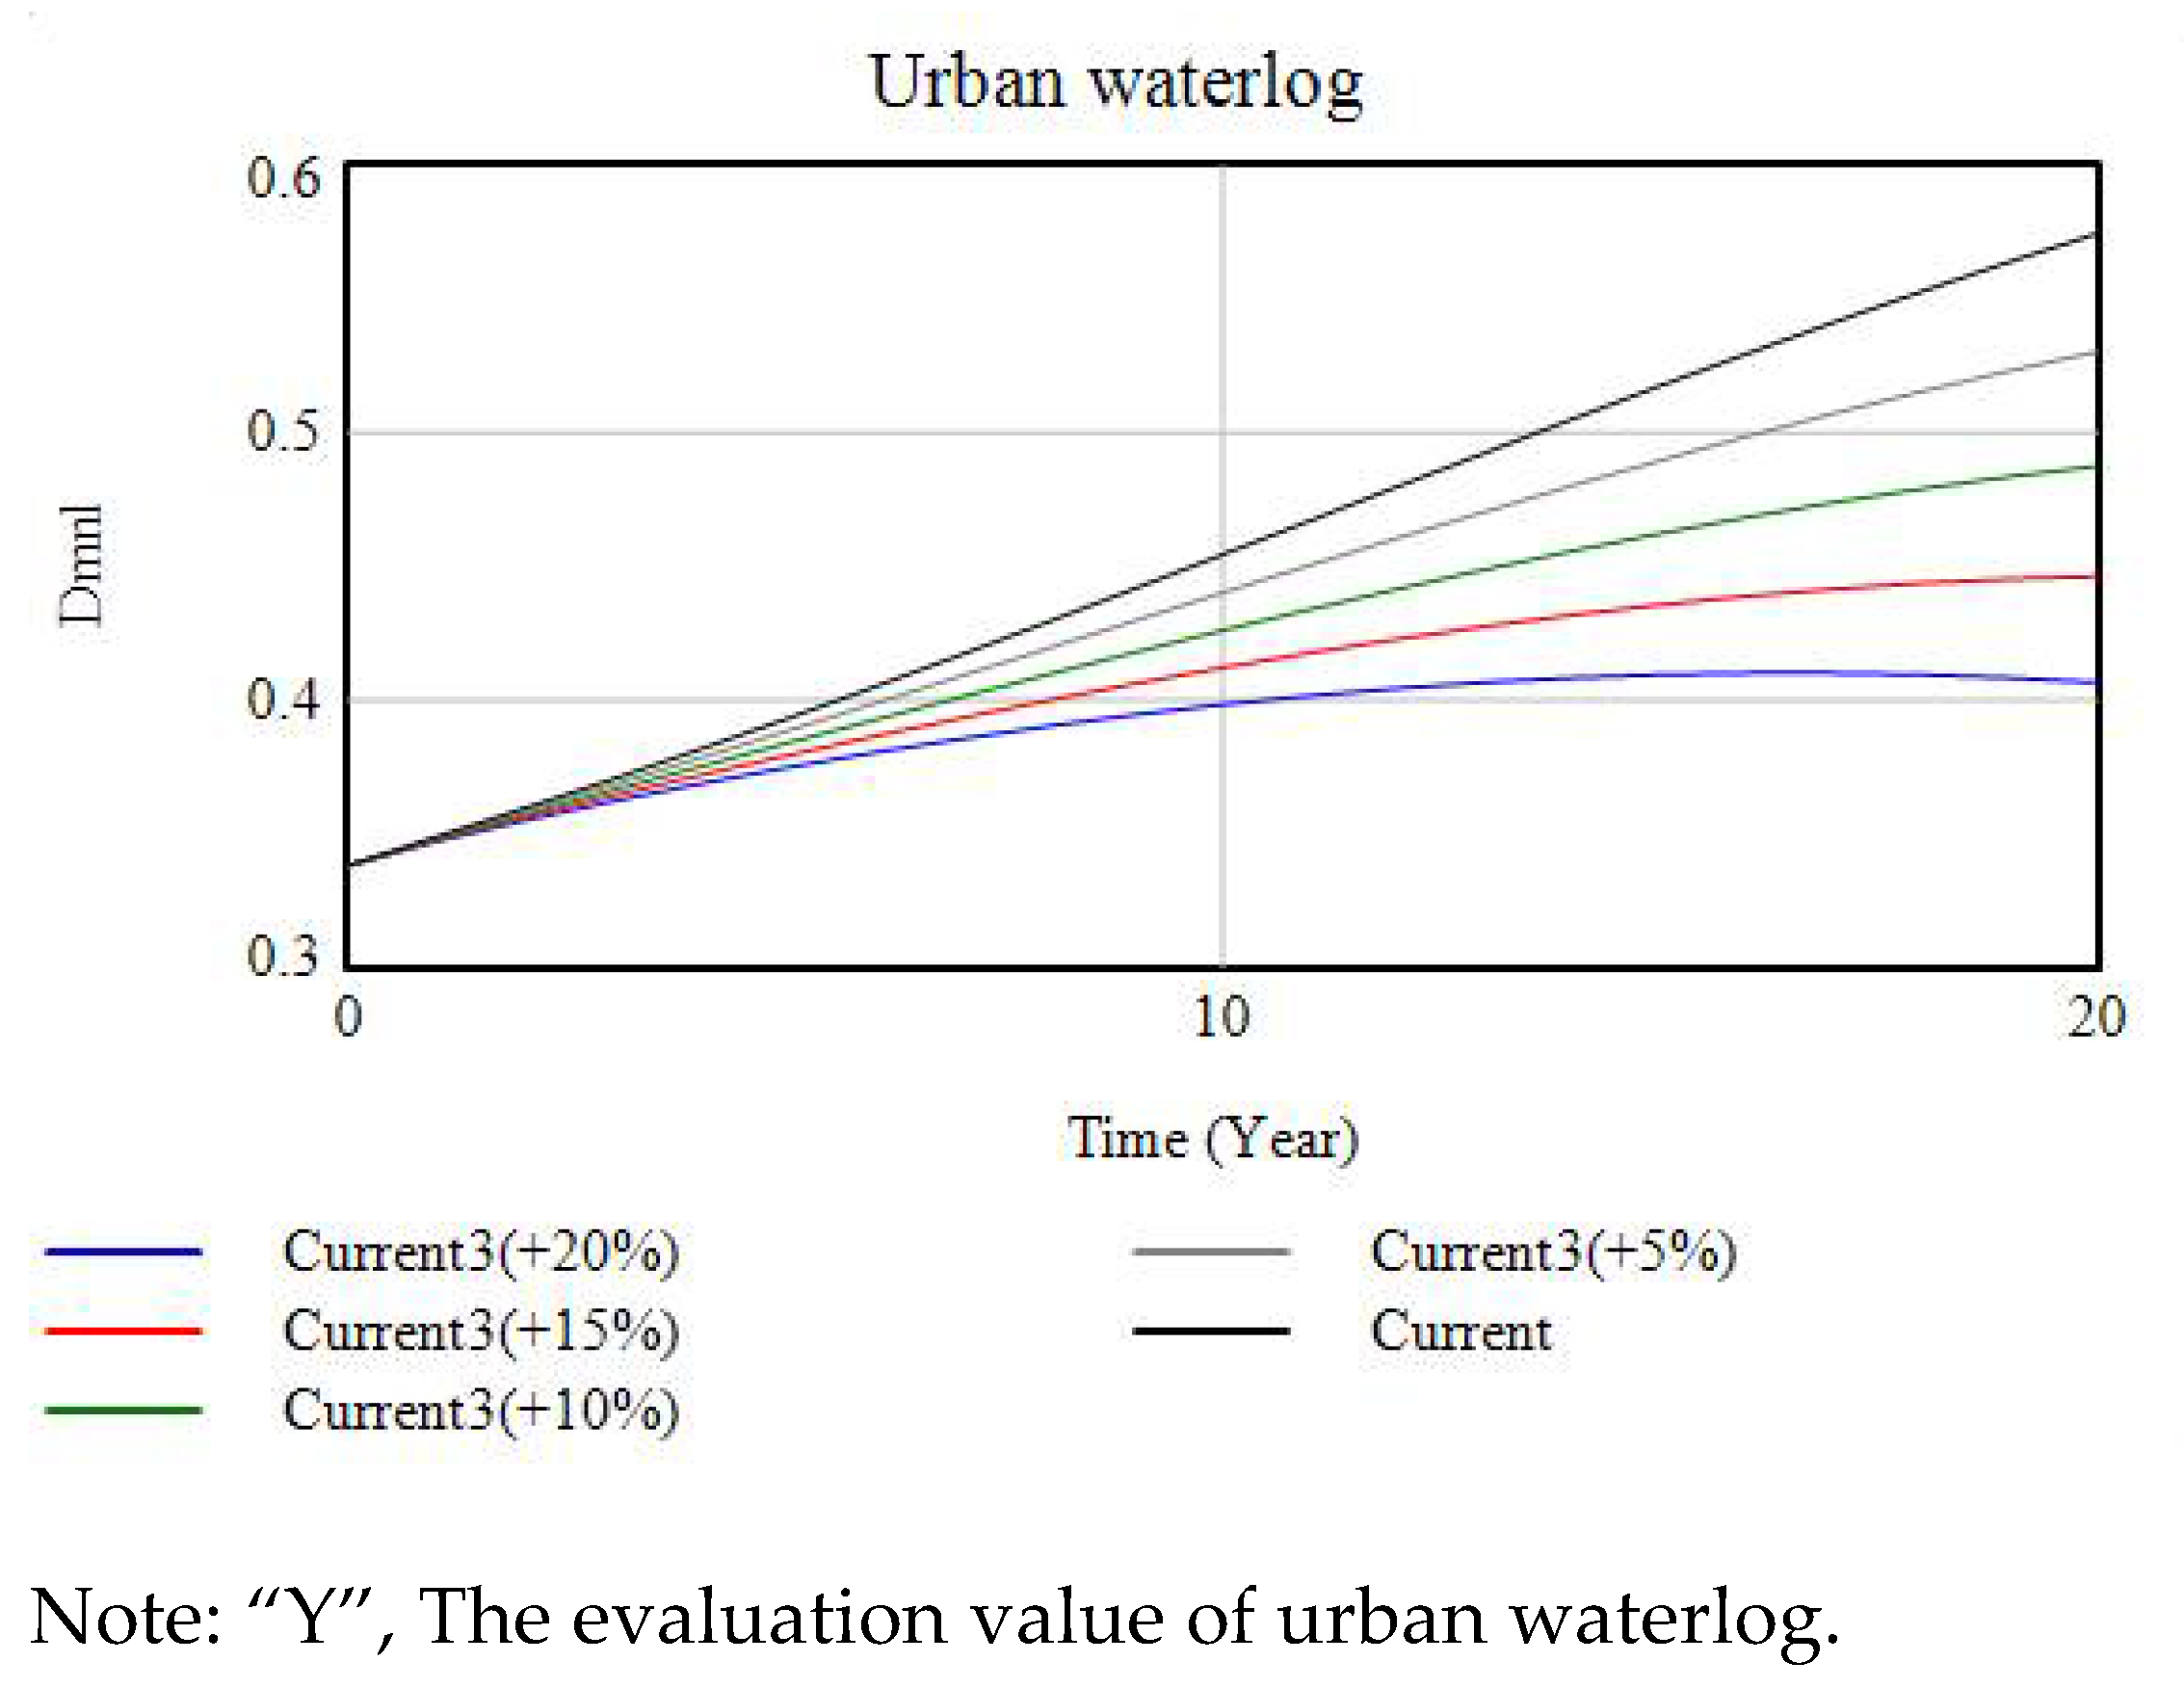
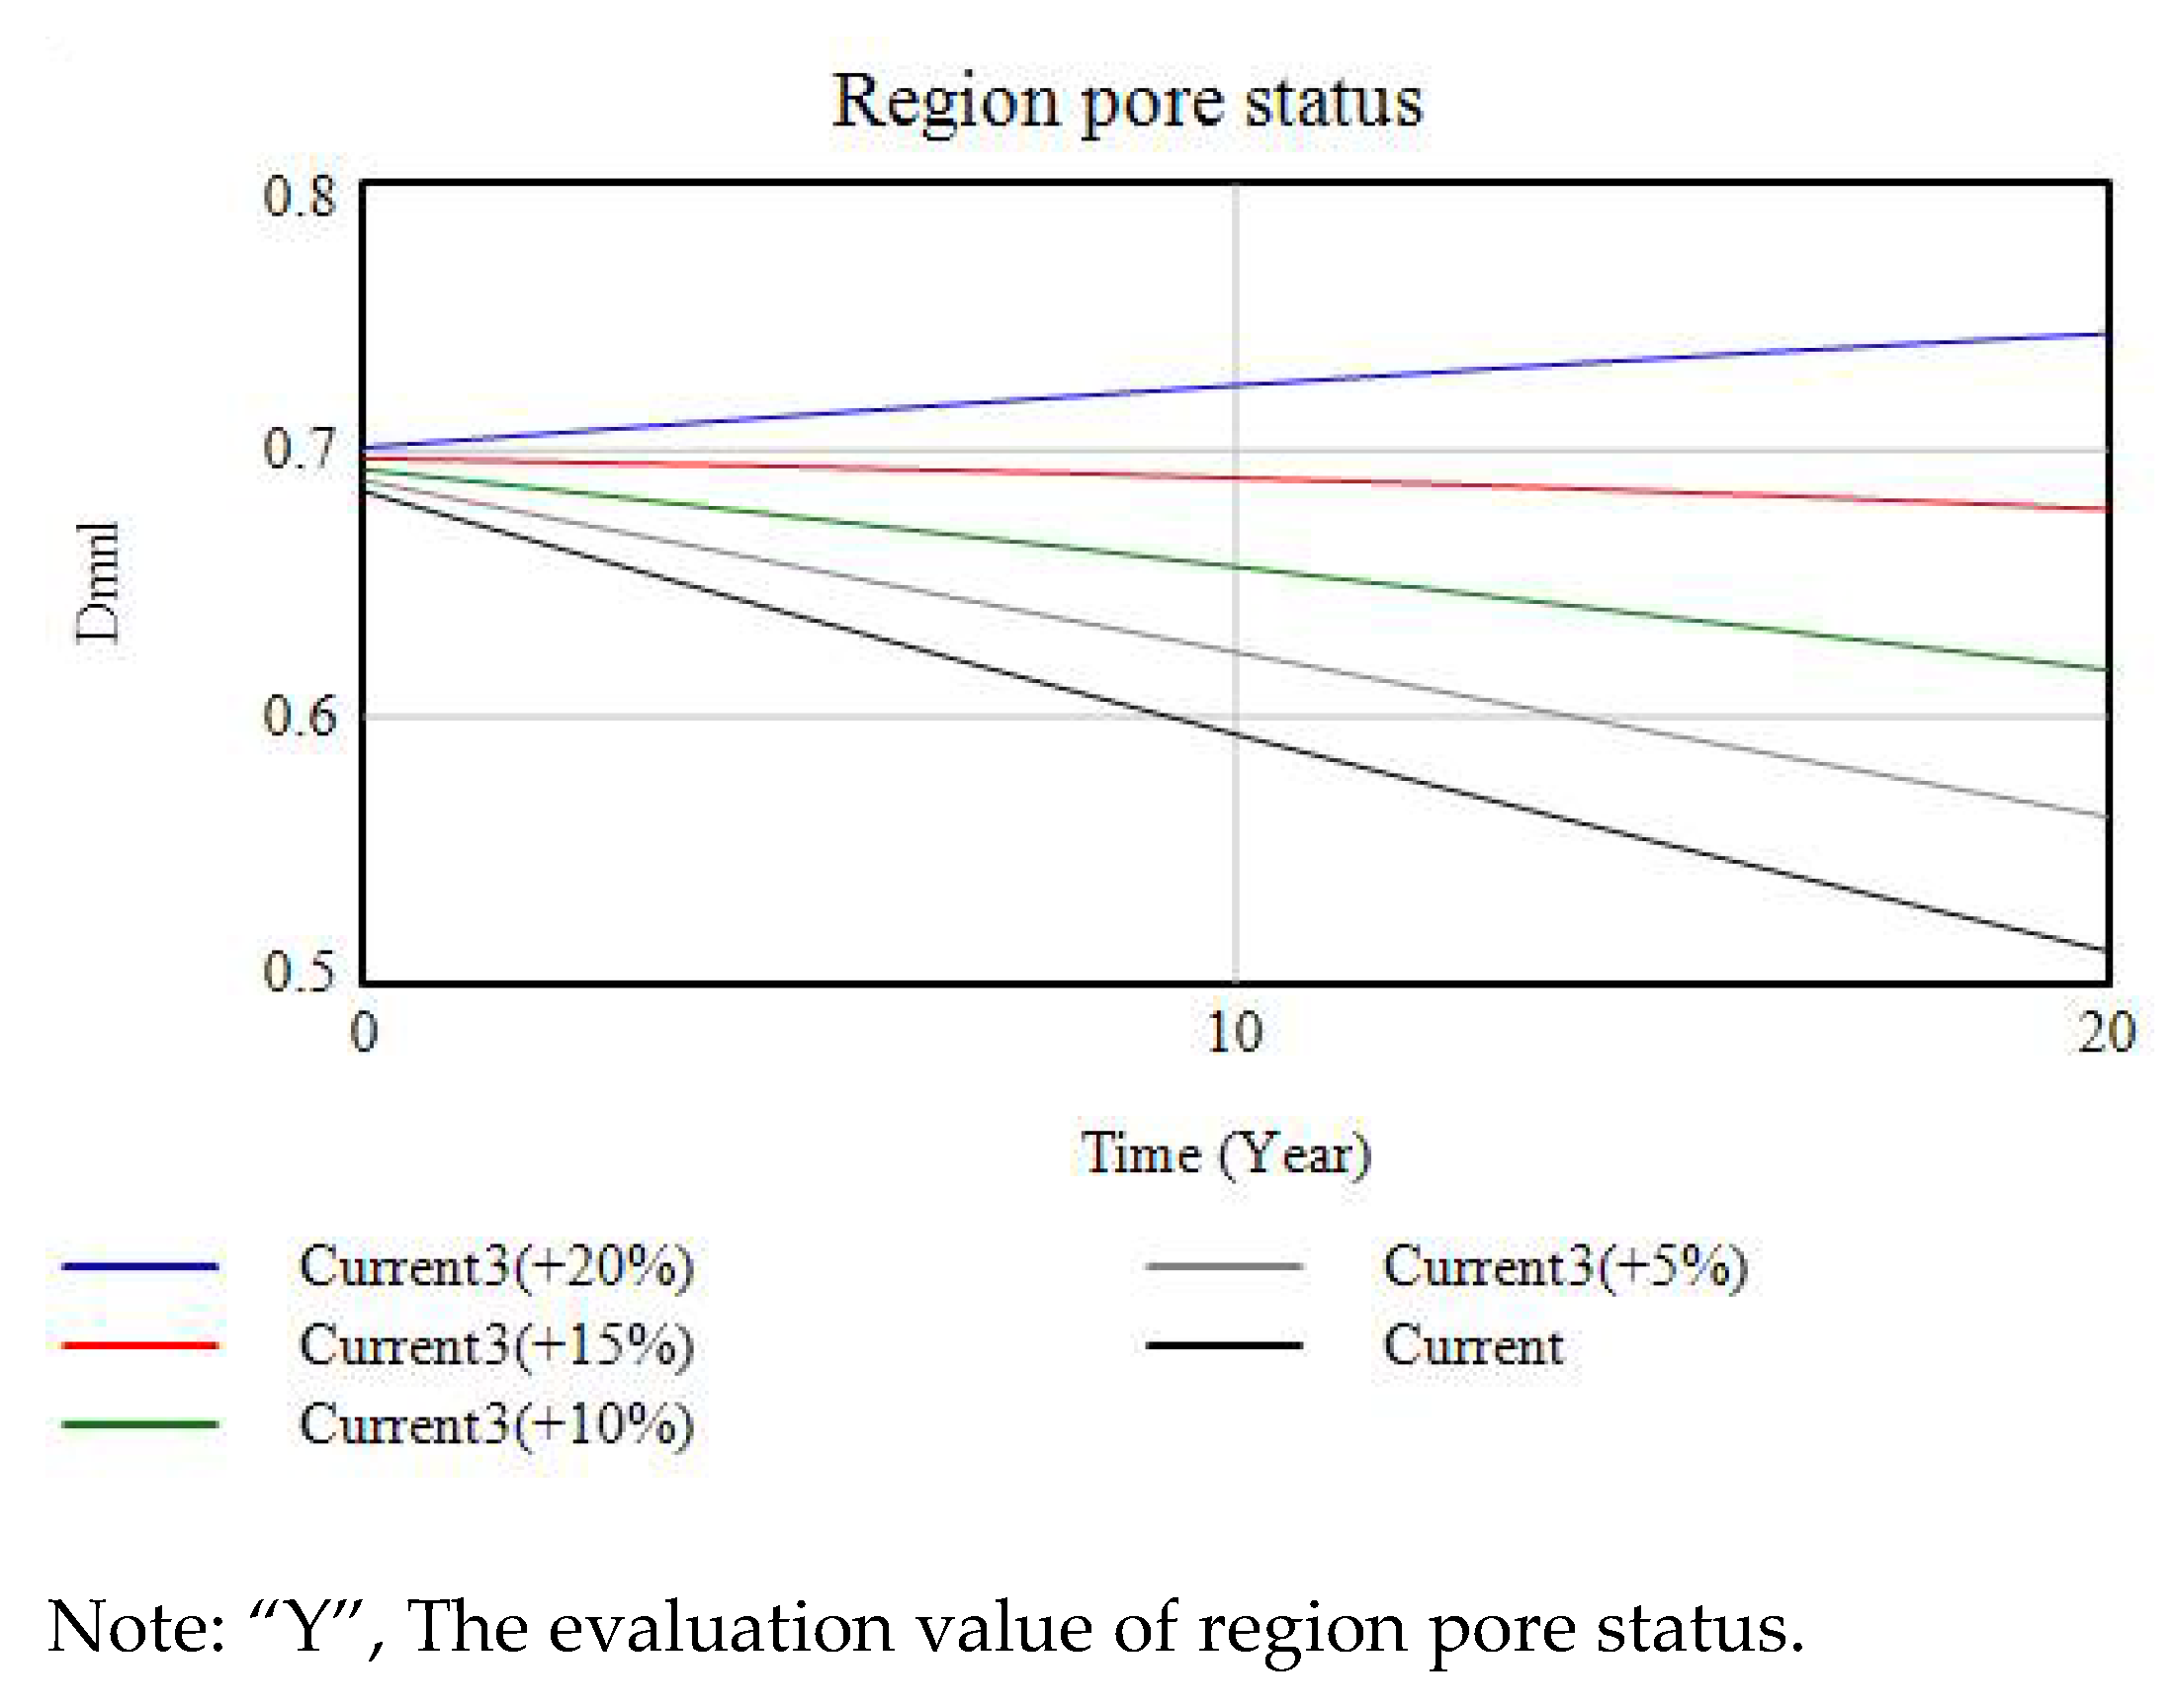
Obviously, compared with the previous two scenarios, the effect of the development focus shifting strategy was more obvious. Based on the simulation data of the 10th year in Table 11 and Table 12, when the urban expansion slowed by 10%, the region pore status reduced by 20.6%, and the risk of urban waterlogging reduced by 15.2%. When the urban expansion slowed by 20%, the last two numbers became 45.3% and 29.3%. The change trend was shown in Figure 15 and Figure 16.
4. Discussion
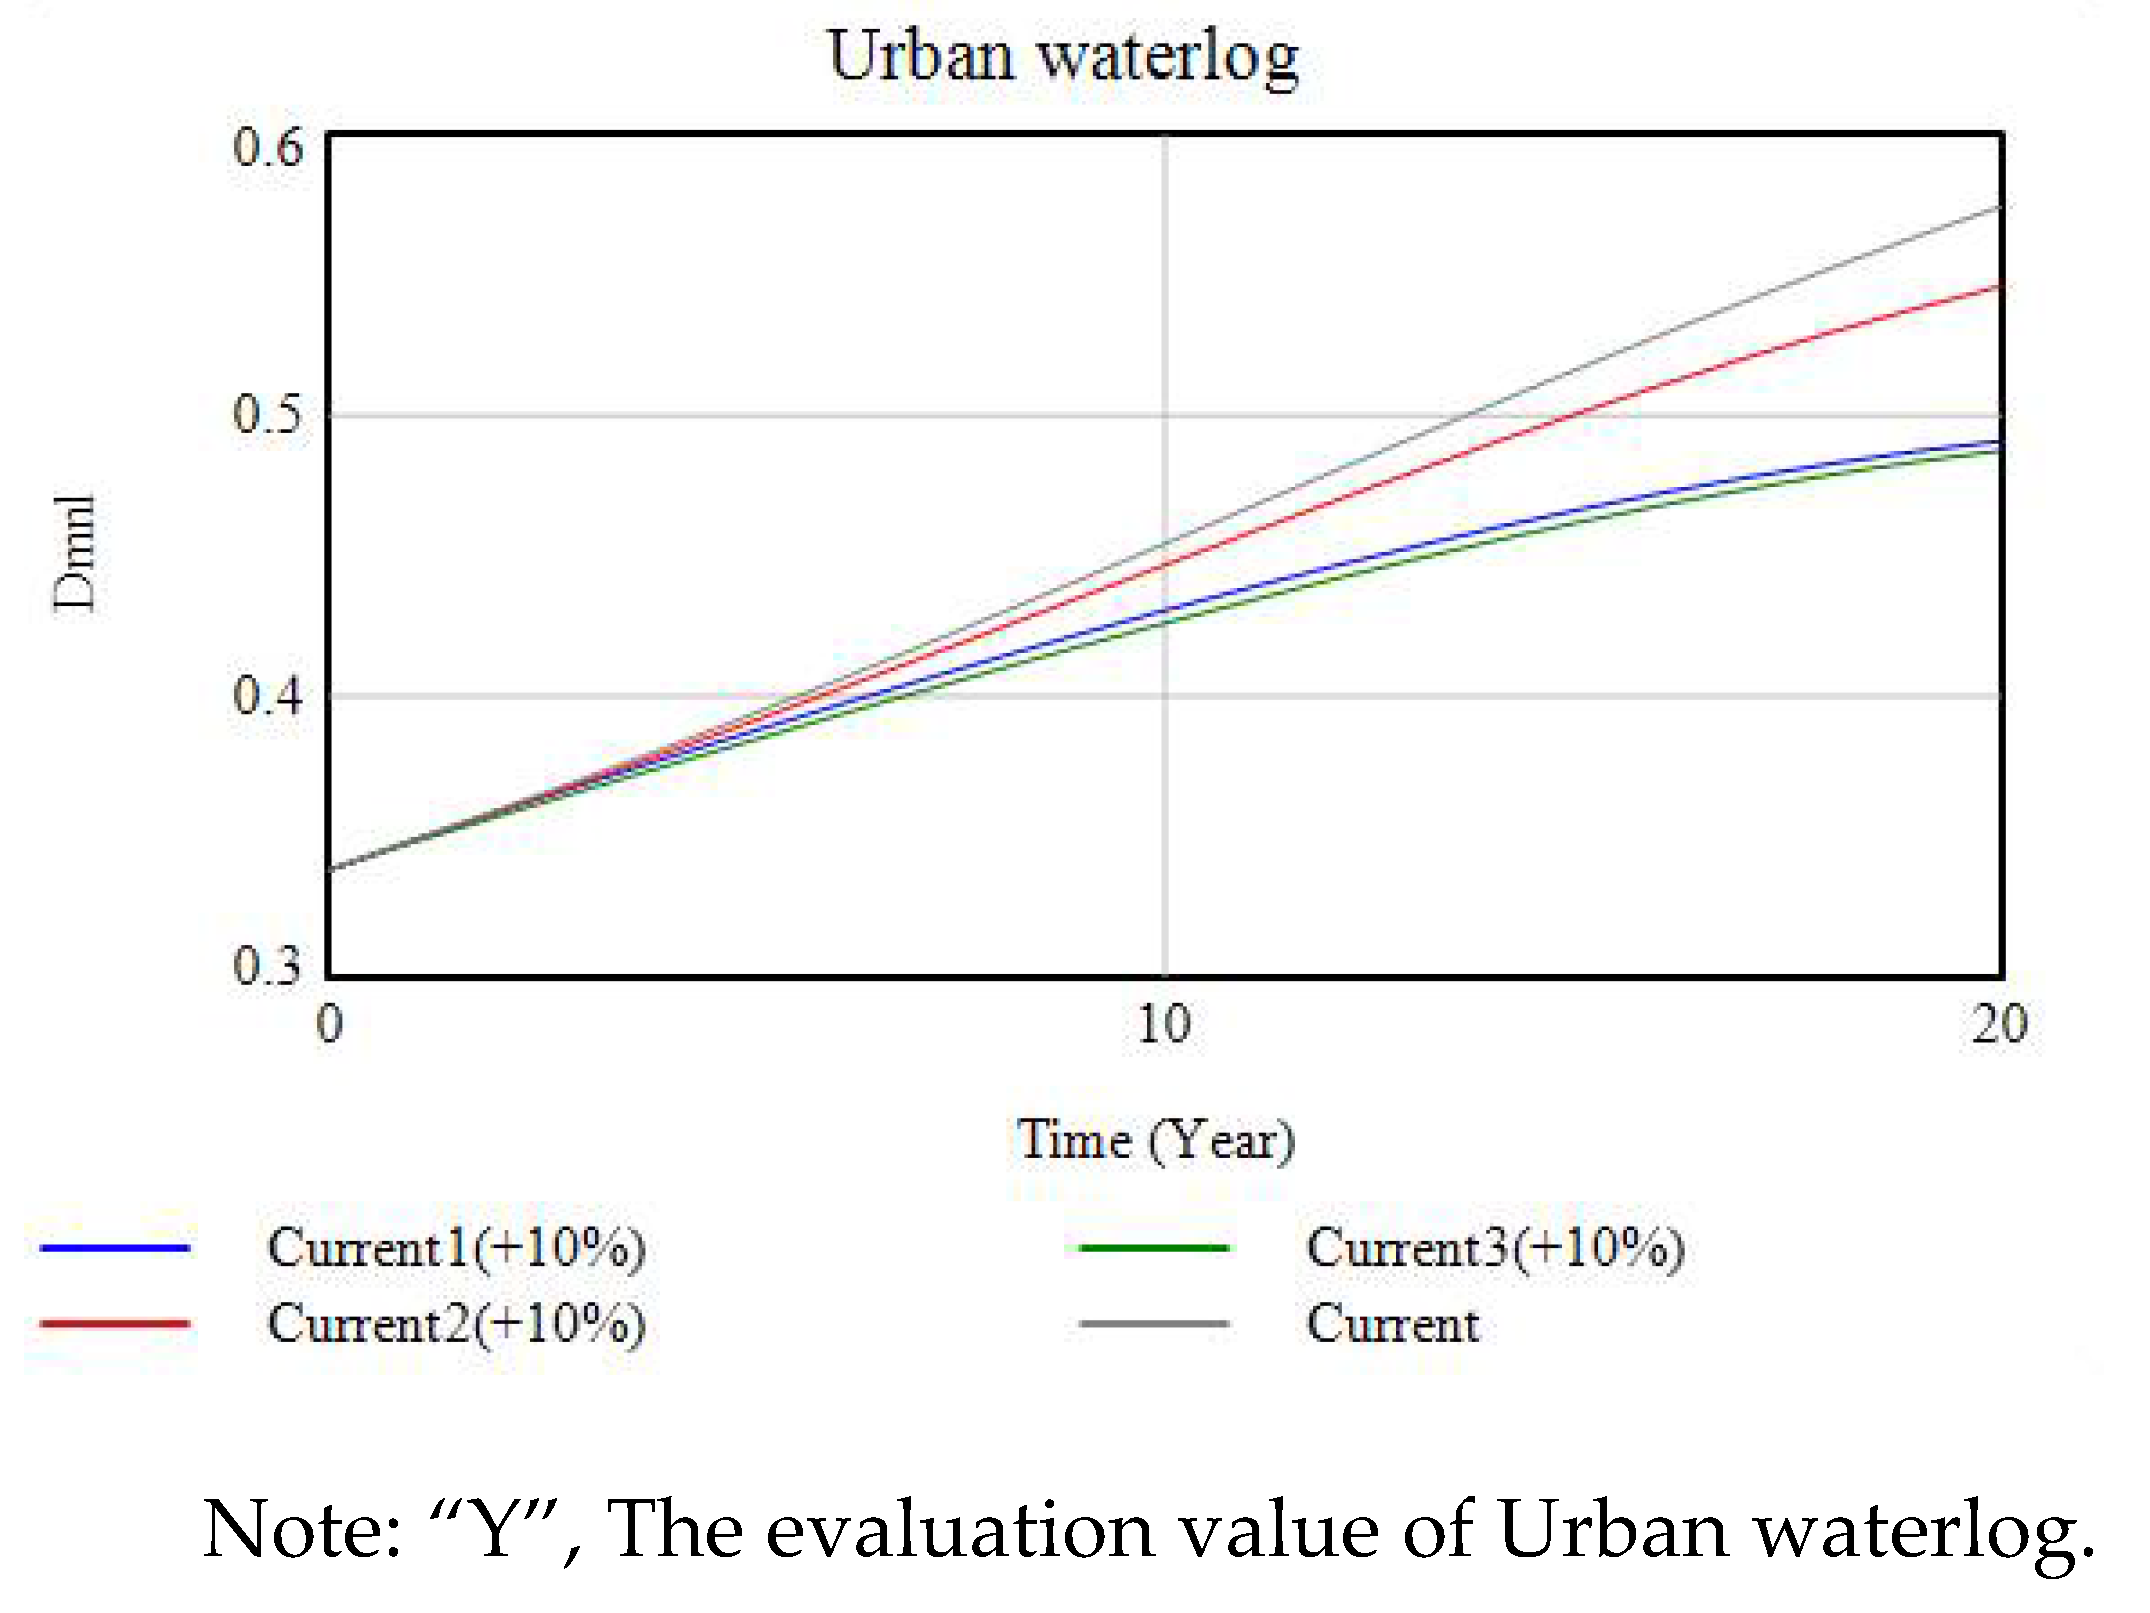
Comparing the three scenarios, scenario three was the most effective, while scenario one and scenario three were basically the same, and that effectiveness was about three times that of scenario two, the whole of which is shown in Figure 17. Moreover, the three strategies were not in conflict and should be vigorously implemented when the resources such as human, material, and finance are sufficient. However, with further discussion, we may find that, under the constraints of resources and time, the different feasibilities of the three are worth exploring.
- Feasibility of sponge city construction
It can be seen from the simulation results that both the first and the third scenarios with high efficiency contained the parameter of green area ratio. Combined with the previous analysis results of sensitive factors, green area ratio was the most significant factor affecting the urban waterlogging level, indicating the exclusion of the original ecological environment to the hydrops. Coupled with the high impact of urban expansion on the risk of urban waterlogging, both imply the accuracy of the sponge city theory, which adheres to the concept of low-impact development. It advocates that the most important aspect is infiltration rather than drainage and is committed to maintenance and restoration of the original ecological environment of the city, trying to achieve the maximum rainwater infiltration in situ. Since the 1990s, the concept of low impact development (LID) is practiced in stormwater management in Maryland, USA [33]. At the same time, Australia began to study and establish water sensitive urban design (WSUD) to deal with multiple water problems such as storm flood risks, shortage of fresh water resources, and water deterioration [34]. These two mutually promoted with the UK’s sustainable urban drainage (SUDS) and Germany’s decentralized rain water management (DRWM) and were developed. In fact, in order to deal with urban water problems, China also continued to explore the possibility of sponge city construction in recent years. In 2015, the sponge city plan was launched, in which the Chinese government would provide 80 billion RMB for 30 sponge city pilot projects in five years [35]. Sponge city reconstruction will be an effective direction for urban waterlogging control.
- 2.
- Improving management level is an effective means of urban waterlogging control
As a matter of fact, for large cities with a long history, sponge city reconstruction of Tianjin in old urban areas is a complex action which needs strong support from policies and finance as well as a great deal of time. However, although the effect is minor compared with strategy one, efficient hazard management can prevent dangerous events developing into disasters or reduce disaster losses, reflecting the level of waterlogging risk management. The current academic circles believe that the variable process of human society’s response to hazards makes hazard management face many uncertain superimposed effects and give attention to the latest management methods that match the development of contemporary science and technology [36]. In October 2019, the topic of promoting the modernization of governance level and governance capacity was put forward in China. Under its special political background, actions to break the barriers among the organizational system of management departments, integrate “fragmented” management problems, and improve the management level of organizations were vigorously promoted. However, China’s emergency management research started late. It was put on the agenda since SARS in 2003, more than 20 years later than the founding of Federal Emergency Management Agency (FEMA) in 1979 [37]. Therefore, further improvement of the management level, especially the emergency management level, is an important direction for urban waterlogging control.
- 3.
- The focus shifting strategy is a consideration for the further future
Similar to the sponge city action, scenario three is the most effective plan. It considers the urban-rural structural adjustment at the city level and is actually a sustainable development strategy that fits the current development status of Tianjin. The Intergovernmental Panel on Climate Change (IPCC) and many research institutions and government organizations recognized that the sustainable development strategy is the ultimate solution for human beings to cope with global climate change and coexist with other species on the planet in the long term [38]. Of course, the simulation results also confirmed this point. However, sustainable development is a long-term and complex action of the city, even linked to regional development or national policies, which requires more people to participate. Therefore, its adjustment in urban planning is difficult to achieve quickly. Thus, although this is a direction that we should strive for, the specific implementation of the scheme requires more detailed planning and step-by-step action, and the goal of this planning is not the urban waterlogging control, which a trivial matter when compared with the sustainable development of the city. Moreover, it could be difficult to evaluate the effect of the overall action on urban waterlogging control.
5. Conclusions
Through the discussion of the three schemes, it was concluded that sponge city construction needs the cooperation of more departments and requires a great deal of time. Correspondingly, the management optimization strategy may be a more direct and effective way to improve the overall level of waterlogging management, while the transformation of the overall development strategy of the city is a higher and further consideration. Therefore, combined with the current waterlogging situation of Tianjin, the development stage of the city, as well as the national development policy and urban planning, our suggestions are divided into three levels.
- The “data governance” strategy to improve the efficiency of operation and maintenance and emergency management.
According to the 2016 “Tianjin Central City Drainage and Waterlogging Prevention Comprehensive Plan”, the latest waterlogging prevention and control standards are far from the current drainage pipe network design standard in most areas of Tianjin, whose corresponding rainfall level is once a year. Limited to the limitations of the existing urban pipe network transformation combined with the simulation results of the model, it is an effective means to improve the urban waterlogging control effect by strengthening the rainwater runoff control ability and the emergency management ability of waterlogging disasters. In the current stage of rapid development of the Internet and 5G technology, it is one of the feasible ways to improve the management level, especially the emergency management level, with the help of intelligent technology. In the framework of smart water research, the Internet of Things, the Internet, and other information technologies are used to build a big data processing platform, to collect data related to rainfall and flood runoff, and to sort out the connection mechanism between elements such as various liability subjects or data. Then, this “data management platform” based on information technology should improve the early warning, forecasting, and response system, establish the emergency reserve and emergency rescue linkage mechanism, and improve the flood control and drainage emergency plan, then handle the cohesive relations between urban flood control and drainage actions and sponge city measures in order to achieve the purpose of improving the management level of urban municipal management system and providing assistance for effective improvement of the government’s management capacity and level.
- 2.
- Implement the sponge city plan in stages, giving priority to urban areas with more serious waterlogging.
It is necessary to optimize the infiltration and the drainage structure of urban rainwater with the help of “sponge city” acting for urban waterlogging control. Learning from the experience of developed countries, the best annual runoff control rate is 80–85%; the level of rainwater runoff control in large cities in China shows a big gap, where the runoff discharge rate of Tianjin exceeds 0.7. Thus, the comprehensive implementation of sponge city strategy will take time. In order to effectively improve the current urban waterlogging situation, differentiated actions should be taken in different areas of the city. Firstly, sponge city reconstruction should be carried out for the old urban areas with particularly severe waterlogging disasters. China’s “Interim Provisions of the Planning Compilation of Sponge City 2016” proposes that cities should, in view of the current situation and according to the natural ecological spatial pattern, delimit the construction zones of sponge cities, draw the layout of water-related infrastructures, and formulate phased construction plans. Beginning in 2019, the sponge city reconstruction projects in Nankai District and Hexi District of Tianjin are implementing in sequence, and efforts can be made in the following three aspects:
- The action of research and development and application of permeable materials would be supported strongly, aiming to improve the permeable level of permeable surfaces through the transformation of the permeable function of the pavement;
- The permeable surface rate would also be increased through rainwater resource utilization measures such as the reconstruction of the infiltrating residential roofs and the construction of the rainwater collection systems;
- The feasibility of increasing green space should be considered in the future urban planning of new projects, and the acting process, the scheme evaluation, and the adjustment should be noticed to improve the urban surface runoff control level;
- In addition, considering the development and the construction of a comprehensive pipe gallery in new urban areas may be the better path for the future governance of urban lifeline facilities.
- 3.
- Implement strategies of rural revitalization and ecological restoration for urban sustainable development.
It was further demonstrated that the urbanization process in recent years accelerated the expansion of urban scale and the increase of population density, resulting in the current situation of insufficient transport capacity of the drainage network. Therefore, although this is very difficult, we will work hard for it. At the present stage, when the urban waterlogging problem is increasingly prominent, we must pay attention to the disadvantages of urban repeated development and consider balancing urban and rural development and optimizing urban and rural structures in further urban planning. In terms of economic development, the focus of urban development should be shifted to towns and villages; in terms of environmental protection, we should pay attention to the ecological restoration and maintenance in urban areas. For example, in 2017, China’s President Xi Jinping proposed the Rural Revitalization Strategy in his report to the 19th CPC National Congress; in 2018, the State Council of China issued “the Strategic Plan for Rural Revitalization (2018–2022)”; in 2020, the “Opinions of the CPC Central Committee and the State Council on Devoting to the Key Work Concerning Agriculture, Rural Areas and Peasants to Ensure the Realization of Moderately Prosperous Living on Schedule” was released. These provide the basis for the follow-up implementation of rural revitalization in Tianjin to relieve the operating pressure of the urban area. In addition, the concept of “Lucid Waters and Lush Mountains are Invaluable Assets” proposed by China in 2017, which implements the national policy of harmonious coexistence between man and nature, provides theoretical and actionable basis for Tianjin for management and restoration of the ecological environment in future urban development. Therefore, to resolve the problem of urban waterlogging, fundamental considerations should be made. Top-level design and overall planning should be done at the level of sustainable development, and various fields including municipal managers, industry organizations, and even the all citizens should take joint actions step by step to optimize the urban environment in the long-term exploration and make it more conducive to human survival.
To sum up, in the face of the current situation, rapid action in improving management and sponge city renovation in old urban areas is expected to curb the increasing trend of waterlogging risk in the next decade. At the same time, on the premise of striving for the improvement of the current situation in the severely waterlogged areas, we should also consider the sustainable development in the overall development of the city. The urban development will surely usher in a better future through the two-pronged approach and the gradual actions.
Author Contributions
Conceptualization and methodology, W.C., J.D. and H.D.; software, J.D. and C.Y.; validation, J.D.; investigation, J.D. and C.Y.; resources, W.C. and P.L.; data curation, W.C., J.D. and P.L.; writing—original draft preparation, W.C. and J.D.; writing—review and editing, W.C. and H.D.; visualization, J.D.; supervision, W.C.; project administration, W.C. All authors have read and agreed to the published version of the manuscript.
Funding
This research was funded by the National Social Science Foundation of China, grant number 17BGL210.
Institutional Review Board Statement
Not applicable.
Informed Consent Statement
Not applicable.
Data Availability Statement
Not applicable.
Acknowledgments
The authors gratefully acknowledge the editors and the anonymous reviewers for their valuable comments.
Conflicts of Interest
The authors declare no conflict of interest.
References
- Zhang, Q.; Wu, Z.; Zhang, H.; Fontana, G.D.; Tarolli, P. Identifying Dominant Factors of Waterlogging Events in Metropolitan Coastal Cities: The Case Study of Guangzhou, China. J. Environ. Manag. 2020, 271, 110951. [Google Scholar] [CrossRef]
- Tang, X.; Shu, Y.; Lian, Y.; Zhao, Y.; Fu, Y. A Spatial Assessment of Urban Waterlogging Risk based on a Weighted Naïve Bayes Classifier. Sci. Total Environ. 2018, 630, 264–274. [Google Scholar] [CrossRef]
- Zhang, H.; Cheng, J.; Wu, Z.; Li, C.; Qin, J.; Liu, T. Effects of Impervious Surface on the Spatial Distribution of Urban Waterlogging Risk Spots at Multiple Scales in Guangzhou, South China. Sustainability 2018, 10, 1589. [Google Scholar] [CrossRef] [Green Version]
- IPCC. Intergovernmental Panel on Climate Change Special Report on Managing the Risks of Extreme Events and Disasters to Advance Climate Change Adaptation; Cambridge University Press: Cambridge, UK, 2011. [Google Scholar]
- Hallegatte, S.; Green, C.; Nicholls, R.J.; Corfee-Morlot, J. Future Flood Losses in Major Coastal Cities. Nat. Clim. Chang. 2013, 3, 802–806. [Google Scholar] [CrossRef]
- UNISDR (United Nations International Strategy for Disaster Reduction). GAR 2015 Making Development Sustainable: The Future of Disaster Risk Management; UNISDR: Geneva, Switzerland, 2015. [Google Scholar]
- Woodruff, J.; Irish, J.; Camargo, S. Coastal Flooding by Tropical Cyclones and Sea-level Rise. Nature 2013, 504, 44–52. [Google Scholar] [CrossRef] [Green Version]
- Shi, P.; Wei, X.; Wang, J.B. Natural Disaster System in China, 1st ed.; Springer: Berlin/Heidelberg, Germany, 2016; pp. 1–36. [Google Scholar]
- Chen, Q.; Zhong, P.; Zhang, X.; Liu, J.; Jia, L. Establishment of an Innovative System of Natural Disaster Prevention. Hydrogeol. Eng. Geol. 2020, 47, 1–4. (In Chinese) [Google Scholar]
- Radcliffe, J.C. Approaches to Water Sensitive Urban Design; Woodhead Publishing: Sawston, UK, 2019. [Google Scholar] [CrossRef]
- Sayama, T.; Fukami, K.; Tanaka, S.; Takeuchi, K. Rainfall-runoff-inundation Analysis for Flood Risk Assessment at the Regional Scale. In Proceedings of the Fifth Conference of Asia Pacific Association of Hydrology and Water Resources (APHW), Hanoi, Vietnam, 8–10 November 2010; pp. 568–576. [Google Scholar]
- Sadiq, A.-A.; Noonan, D.S. Flood Disaster Management Policy: An Analysis of the United States Community Ratings System. J. Nat. Resour. Policy Res. 2015, 7, 5–22. [Google Scholar] [CrossRef] [Green Version]
- Sang, Y.F.; Yang, M. Urban Waterlogs Control in China: More Effective Strategies and Actions Are Needed. Nat. Hazards 2017, 85, 1291–1294. [Google Scholar] [CrossRef]
- Wei, M.; She, L.; You, X.Y. Establishment of Urban Waterlogging Pre-warning System Based on Coupling Rbf-narx Neural Networks. Water Sci. Technol. 2020, 82, 1921–1931. [Google Scholar] [CrossRef]
- Sukmaningsih, D.W.; Suparta, W.; Trisetyarso, A.; Abbas, B.S.; Kang, C.H. Proposing Smart Disaster Management in Urban Area. In Intelligent Information and Database Systems: Recent Developments; ACIIDS 2019; Springer: Cham, Switzerland, 2020. [Google Scholar] [CrossRef]
- Tehrany, M.S.; Jones, S.; Shabani, F. Identifying the Essential Flood Conditioning Factors for Flood Prone Area Mapping Using Machine Learning Techniques. Catena 2018, 175, 174–192. [Google Scholar] [CrossRef]
- Wang, C.; Du, S.; Wen, J.; Zhang, M.; Gu, H.; Shi, Y.; Xu, H. Analyzing Explanatory Factors of Urban Pluvial Floods in Shanghai Using Geographically Weighted Regression. Stoch. Environ. Res. Risk A 2017, 31, 1777–1790. [Google Scholar] [CrossRef]
- Zhang, H.; Wu, C.; Chen, W.; Huang, G. Assessing the Impact of Climate Change on the Waterlogging Risk in Coastal Cities: A Case Study of Guangzhou, South China. J. Hydrometeorol. 2017, 18, 1549–1562. [Google Scholar] [CrossRef]
- Yu, H.; Zhao, Y.; Fu, Y.; Li, L. Spatiotemporal Variance Assessment of Urban Rainstorm Waterlogging Affected by Impervious Surface Expansion: A Case Study of Guangzhou, China. Sustainability 2018, 10, 3761. [Google Scholar] [CrossRef] [Green Version]
- Bonté, B.; Therville, C.; Bousquet, F.; Abrami, G.; Dhenain, S.; Mathevet, R. Analyzing Coastal Coupled Infrastructure Systems Through Multi-scale Serious Games in Languedoc, France. Reg. Environ. Chang. 2019, 19, 1879–1889. [Google Scholar] [CrossRef]
- Anderies, J.M.; Barreteau, O.; Brady, U. Refining the Robustness of Social-Ecological Systems Framework for Comparative Analysis of Coastal System Adaptation to Global Change. Reg. Environ. Chang. 2019, 19, 1891–1908. [Google Scholar] [CrossRef]
- Xue, Y.; Xiang, P.; Jia, F.; Liu, Z. Risk Assessment of High-Speed Rail Projects: A Risk Coupling Model Based on System Dynamics. Int. J. Environ. Res. Public Health 2020, 17, 5307. [Google Scholar] [CrossRef]
- Zhou, M.; Feng, X.; Liu, K.; Zhang, C.; Xie, L.; Wu, X. An Alternative Risk Assessment Model of Urban Waterlogging: A Case Study of Ningbo City. Sustainability 2021, 13, 826. [Google Scholar] [CrossRef]
- Li, Z.; Xu, Y.; Sun, Y.; Wu, M.; Zhao, B. Urbanization-Driven Changes in Land-Climate Dynamics: A Case Study of Haihe River Basin, China. Remote Sens. 2020, 12, 2701. [Google Scholar] [CrossRef]
- Abebe, Y.; Adey, B.T.; Tesfamariam, S. Sustainable Funding Strategies for Stormwater Infrastructure Management: A System Dynamics Model. Sustain. Cities Soc. 2021, 64, 102485. [Google Scholar] [CrossRef]
- Rathore, Z.; Elwakil, E. Hierarchical Fuzzy Expert System for Organizational Performance Assessment in the Construction Industry. Algorithms 2020, 13, 205. [Google Scholar] [CrossRef]
- Halog, A.; Manik, Y. Advancing Integrated Systems Modelling Framework for Life Cycle Sustainability Assessment. Sustainability 2011, 3, 469–499. [Google Scholar] [CrossRef] [Green Version]
- She, L.; Wei, M.; You, X.Y. Multi-objective Layout Optimization for Sponge City by Annealing Algorithm and its Environmental Benefits Analysis. Sustain. Cities Soc. 2021, 66, 102706. [Google Scholar] [CrossRef]
- Wang, G.; Chen, J.; Zhao, C.; Zhou, X.; Deng, X. Exploration of the Causality between Area Changes of Green Spaces and Waterlogging Frequency in Beijing. Phys. Chem. Earth Parts A/B/C 2017, 101, 172–177. [Google Scholar] [CrossRef]
- Ren, X.; Hong, N.; Li, L.; Kang, J.; Li, J. Effect of Infiltration Rate Changes in Urban Soils on Stormwater Runoff Process. Geoderma 2020, 363, 114158. [Google Scholar] [CrossRef]
- Liu, J.; Shao, W.; Xiang, C.; Mei, C.; Li, Z. Uncertainties of Urban Flood Modeling: Influence of Parameters for Different Underlying Surfaces. Environ. Res. 2020, 182, 108929. [Google Scholar] [CrossRef]
- Shao, W.; Zhang, H.; Liu, J.; Yang, G.; Chen, X.; Yang, Z.; Huang, H. Data Integration and its Application in the Sponge City Construction of CHINA. Procedia Eng. 2016, 154, 779–786. [Google Scholar] [CrossRef] [Green Version]
- Ahiablame, L.M.; Engel, B.A.; Chaubey, I. Effectiveness of Low Impact Development Practices: Literature Review and Suggestions for Future Research. Water Air Soil Poll. 2012, 223, 4253–4273. [Google Scholar] [CrossRef]
- Allen, R.; Wong, T.; Beringer, J.B. Blueprint 2012—Stormwater Management in a Water Sensitive City; Cooperative Research Centre for Water Sensitive Cities: Sydney, Australia, 2012. [Google Scholar]
- Zhang, C.; He, M.; Zhang, Y. Urban Sustainable Development Based on the Framework of Sponge City: 71 Case Studies in China. Sustainability 2019, 11, 1544. [Google Scholar] [CrossRef] [Green Version]
- Tagarev, T.; Ratchev, V. A Taxonomy of Crisis Management Functions. Sustainability 2020, 12, 5147. [Google Scholar] [CrossRef]
- Comfort, L.K.; Waugh, W.L.; Cigler, B.A. Emergency Management Research and Practice in Public Administration: Emergence, Evolution, Expansion, and Future Directions. Public Adm. Rev. 2012, 72, 539–547. [Google Scholar] [CrossRef]
- Yang, S.; Cui, X. Building Regional Sustainable Development Scenarios with the SSP Framework. Sustainability 2019, 11, 5712. [Google Scholar] [CrossRef] [Green Version]
Figure 1.
The urban waterlogging risk system.

Figure 2.
Multi-layer network model of urban waterlogging risks. Note: E, Urban waterlog; see Section 2.3.2 for the meaning of other factors.
Figure 2.
Multi-layer network model of urban waterlogging risks. Note: E, Urban waterlog; see Section 2.3.2 for the meaning of other factors.

Figure 3.
Causality diagrams of all subsystems. Note: “+”: positive correlation; “−”: negative correlation; “//”: time delay.
Figure 3.
Causality diagrams of all subsystems. Note: “+”: positive correlation; “−”: negative correlation; “//”: time delay.

Figure 4.
Causality diagram of urban waterlogging risk system. Note: “+”: positive correlation; “−”: negative correlation; “//”: time delay.
Figure 4.
Causality diagram of urban waterlogging risk system. Note: “+”: positive correlation; “−”: negative correlation; “//”: time delay.

Figure 5.
Flow chart of urban waterlogging risk system. Note: “+”: positive correlation; “−”: negative correlation; “//”: time delay.
Figure 5.
Flow chart of urban waterlogging risk system. Note: “+”: positive correlation; “−”: negative correlation; “//”: time delay.

Figure 6.
Performance of main factors of waterlogging risk in time course.

Figure 7.
Influence of built up area expansion speed on the pore status of land area.

Figure 8.
Influence of built up area expansion speed on waterlogging risk.

Figure 9.
The change of urban waterlogging risk in Current 1.

Figure 10.
The change of region pore status in Current 1.

Figure 11.
The change of increase rate of urban waterlogging risk in Current 1.

Figure 12.
The change of urban waterlogging risk in Current 2.

Figure 13.
The change of managing risk in Current 2.

Figure 14.
The change of physical risk rate in Current 2.

Figure 15.
The change of urban waterlog risk in Current 3.

Figure 16.
The change of region pore status in Current 3.

Figure 17.
The comparison of three scenarios.


Table 1.
Equation constants.
| Index Name | Numerical Value | Index Name | Numerical Value |
|---|---|---|---|
| Public finance | 0.68 | Built-up area expansion | 0.38 |
| Pumping station lifting capacity | 0.75 | Permeability coefficient | 0.47 |
| Organization level | 0.7 | Permeable surface ratio | 0.16 |
| Linkage control | 0.5 | Water area ratio | 0.2 |
| Early warning system | 0.5 | Levels proportion of pipe network | 0.75 |
| Citizen quality | 0.75 | Pipe network density | 0.75 |
| Management level | 0.8 | Pipe wall roughness | 0.85 |
| Day maximum rainfall intensity | 0.89 | Pipe diameter | 0.8 |
| Annual rainfall | 0.12 | Pipe slope | 0.9 |
| Green area ratio | 0.38 | Water outlet height | 0.95 |
| Surface roughness | 0.1 | Rainfall inlet | 0.95 |
| Terrain | 0.1 | Construction technique | 0.8 |
Table 2.
Ranking of sensitive factors.
| Parameter | Waterlogging Index Variability | Parameter | Waterlogging Index Variability |
|---|---|---|---|
| Green area ratio | −7.77% | Waterlogged land treatment | −0.60% |
| Built-up area expansion | 5.15% | Levels proportion of pipe network | −0.59% |
| Permeable surface ratio | −3.76% | Pumping station lifting capacity | −0.55% |
| Permeability coefficient | −3.13% | Pipe age | −0.54% |
| Water area ratio | −2.65% | Citizen quality | −0.39% |
| Early warning system | −1.61% | Day maximum rainfall intensity | 0.38% |
| Linkage control | −1.18% | Annual rainfall | 0.19% |
| Management level | −1.01% | Detention structure | −0.14% |
| Pipe diameter | −0.90% | Pipe wall roughness | −0.12% |
| Organization level | −0.85% | Water outlet height | −0.04% |
| Pipe network density | −0.61% | Rainfall Inlet | −0.04% |
Table 3.
Variability settings of permeability parameters.
| Parameter | Current | Current1 (+5%) | Current1 (+10%) | Current1 (+15%) | Current1 (+20%) |
|---|---|---|---|---|---|
| Green area ratio | +0% | +5% | +10% | +15% | +20% |
| Permeable surface ratio | +0% | +5% | +10% | +15% | +20% |
| Permeability coefficient | +0% | +5% | +10% | +15% | +20% |
Table 4.
Variability settings of parameters under management scheme.
| Parameter | Current | Current2 (+5%) | Current2 (+10%) | Current2 (+15%) | Current2 (+20%) |
|---|---|---|---|---|---|
| Linkage control | +0% | +5% | +10% | +15% | +20% |
| Early warning system | +0% | +5% | +10% | +15% | +20% |
| Organization level | +0% | +5% | +10% | +15% | +20% |
| Pipe network density | +0% | +5% | +10% | +15% | +20% |
| Levels proportion of pipe network | +0% | +5% | +10% | +15% | +20% |
| Pipe diameter | +0% | +5% | +10% | +15% | +20% |
| Construction technique | +0% | +5% | +10% | +15% | +20% |
Table 5.
Variability settings of parameters for scenario 3.
| Parameter | Current | Current3 (+5%) | Current3 (+10%) | Current3 (+15%) | Current3 (+20%) |
|---|---|---|---|---|---|
| Built-up area expansion | +0% | +5% | +10% | +15% | +20% |
| Green area ratio | +0% | +5% | +10% | +15% | +20% |
| Water area ratio | +0% | +5% | +10% | +15% | +20% |
Table 6.
Partial data of urban waterlogging risk in Current 1.
| Time (Year) | 0 | 5 | 10 | 15 | 20 |
|---|---|---|---|---|---|
| Current | 0.338 | 0.393 | 0.455 | 0.518 | 0.575 |
| Current1 (+10%) | 0.338 | 0.387 | 0.431 | 0.467 | 0.491 |
| Current1 (+20%) | 0.338 | 0.382 | 0.411 | 0.425 | 0.424 |
Table 7.
Partial data of region pore status in Current 1.
| Time (Year) | 0 | 5 | 10 | 15 | 20 |
|---|---|---|---|---|---|
| Current | 0.685 | 0.638 | 0.593 | 0.551 | 0.512 |
| Current1 (+10%) | 0.685 | 0.671 | 0.656 | 0.641 | 0.625 |
| Current1 (+20%) | 0.685 | 0.699 | 0.713 | 0.727 | 0.734 |
Table 8.
Partial data of urban waterlogging risk in Current 2.
| Time (Year) | 0 | 5 | 10 | 15 | 20 |
|---|---|---|---|---|---|
| Current | 0.338 | 0.393 | 0.455 | 0.518 | 0.575 |
| Current2 (+10%) | 0.338 | 0.390 | 0.447 | 0.502 | 0.546 |
| Current2 (+20%) | 0.338 | 0.388 | 0.439 | 0.485 | 0.517 |
Table 9.
Partial data of managing risk in Current 2.
| Time (Year) | 0 | 5 | 10 | 15 | 20 |
|---|---|---|---|---|---|
| Current | 0.378 | 0.330 | 0.286 | 0.230 | 0.155 |
| Current2 (+10%) | 0.378 | 0.326 | 0.277 | 0.212 | 0.124 |
| Current2 (+20%) | 0.378 | 0.322 | 0.267 | 0.192 | 0.091 |
Table 10.
Partial data of physical risk in Current 2.
| Time (Year) | 0 | 5 | 10 | 15 | 20 |
|---|---|---|---|---|---|
| Current | 0.154 | 0.280 | 0.376 | 0.452 | 0.513 |
| Current2 (+10%) | 0.148 | 0.270 | 0.366 | 0.442 | 0.504 |
| Current2 (+20%) | 0.141 | 0.260 | 0.354 | 0.429 | 0.492 |
Table 11.
Partial data of urban waterlogging risk in Current 3.
| Time (Year) | 0 | 5 | 10 | 15 | 20 |
|---|---|---|---|---|---|
| Current | 0.338 | 0.393 | 0.455 | 0.518 | 0.575 |
| Current3 (+10%) | 0.338 | 0.384 | 0.426 | 0.462 | 0.488 |
| Current3 (+20%) | 0.338 | 0.375 | 0.398 | 0.409 | 0.406 |
Table 12.
Partial data of region pore status in Current 3.
| Time (Year) | 0 | 5 | 10 | 15 | 20 |
|---|---|---|---|---|---|
| Current | 0.685 | 0.638 | 0.593 | 0.551 | 0.512 |
| Current3 (+10%) | 0.693 | 0.675 | 0.656 | 0.637 | 0.617 |
| Current3 (+20%) | 0.701 | 0.713 | 0.725 | 0.735 | 0.744 |
Publisher’s Note: MDPI stays neutral with regard to jurisdictional claims in published maps and institutional affiliations. |
© 2021 by the authors. Licensee MDPI, Basel, Switzerland. This article is an open access article distributed under the terms and conditions of the Creative Commons Attribution (CC BY) license (https://creativecommons.org/licenses/by/4.0/).
Share and Cite
MDPI and ACS Style
Chen, W.; Dong, J.; Yan, C.; Dong, H.; Liu, P. What Causes Waterlogging?—Explore the Urban Waterlogging Control Scheme through System Dynamics Simulation. Sustainability 2021, 13, 8546. https://doi.org/10.3390/su13158546
AMA Style
Chen W, Dong J, Yan C, Dong H, Liu P. What Causes Waterlogging?—Explore the Urban Waterlogging Control Scheme through System Dynamics Simulation. Sustainability. 2021; 13(15):8546. https://doi.org/10.3390/su13158546
Chicago/Turabian StyleChen, Weike, Jing Dong, Chaohua Yan, Hui Dong, and Ping Liu. 2021. "What Causes Waterlogging?—Explore the Urban Waterlogging Control Scheme through System Dynamics Simulation" Sustainability 13, no. 15: 8546. https://doi.org/10.3390/su13158546
Note that from the first issue of 2016, this journal uses article numbers instead of page numbers. See further details here.