Article

Technical Efficiency of Traditional Village Chicken Production in Africa: Entry Points for Sustainable Transformation and Improved Livelihood

by
Mulugeta Y. Birhanu
1,*,
Tesfahun Alemayehu
2,
Jasmine E. Bruno
3,
Fasil Getachew Kebede
4,
Emmanuel Babafunso Sonaiya
5,
Ezekiel H. Goromela
6,
Oladeji Bamidele
1 and
Tadelle Dessie
1
1
International Livestock Research Institute (ILRI), Addis Ababa P.O. Box 5689, Ethiopia
2
Environmental Economics and Natural Resources Group, Wageningen University and Research, 6706 Wageningen, The Netherlands
3
Department of Forest and Rangeland Stewardship, Colorado State University, Fort Collins, CO 80523, USA
4
Department of Animal Breeding and Genomics, Wageningen University & Research, 6708 Wageningen, The Netherlands
5
Department of Animal Sciences, Obafemi Awolowo University, Ile-Ife 220282, Nigeria
6
Tanzania Livestock Research Institute (TALIRI)-Naliendele, Mtwara P.O. Box 1425, Tanzania
*
Author to whom correspondence should be addressed.
Sustainability 2021, 13(15), 8539; https://doi.org/10.3390/su13158539
Submission received: 24 June 2021 / Revised: 19 July 2021 / Accepted: 27 July 2021 / Published: 30 July 2021

Abstract

:
Increasing poultry product consumption trends have attracted researchers and development practitioners to look for interventions that transform the low-input low-output-based village chicken production to a high yielding production system. However, due to the intricate nature of the production system, there is a dearth of evidence that helps design comprehensive interventions at the smallholder level. Using national-level representative data collected from 3555 village chicken producers in Ethiopia, Nigeria, and Tanzania, this study examines the technical efficiency of village chicken production and investigates the main factors that explain the level of inefficiency. We applied a stochastic frontier analysis to simultaneously quantify the level of technical efficiency and identify factors associated with heterogeneity in inefficiency. We found that the level of technical efficiency is extremely low in the three countries, suggesting enormous opportunities to enhance productivity using available resources. The heterogeneity in technical efficiency is strongly associated with producers’ experience in breed improvements and flock management, limited technical knowledge and skills, limited access to institutions and markets, smaller flock size, gender disparities, and household livelihood orientation. We argue the need to adopt an integrated approach to enhance village producers’ productivity and transform the traditional subsistence-based production system into a commercially oriented semi-intensive production system.

1. Introduction

In most developing countries, village chicken production is an essential contributor of animal-source protein and income to the resource-poor and marginal groups of the society [1,2]. This sub-sector produces the largest proportion of chicken products consumed by rural and urban households, and these products have important cultural and religious values. Additionally, village chicken production is an integral part of the farming system that converts low-quality feeds and household wastes into high-quality proteins and supply manure for crop production. Despite the momentous contribution of the sub-sector to household livelihood and overall wellbeing, the level of production and productivity remains very low [3,4]. As a result, the contributions of this sub-sector to household food security, income, and overall growth and development of society remain unrealized.
The lower production level could be associated with a type of production technologies, the efficiency of the production, available institutions and markets, and other management and environment-related factors [5,6,7]. Changes in production technologies can shift production functions towards increased quantity or quality of outputs while maintaining the level of inputs [8]. Additionally, production technologies can also enable sustained production outputs with fewer inputs. Depending on the production environment, this could be achieved by introducing suitable technologies, such as improved breeds, quality feeds, vaccines or other management options. The production efficiency deals with the process that combines inputs to produce maximum outputs [9]. The institutions and market-related factors deal with building the capacity of producers and enhancing their access to better inputs-output markets and services. Changes in technology or technical efficiency would lead to changes in productivity, as noted by Korres [10].
Given smallholders’ limited access to productive resources, technologies, and markets, it is imperative to consider productivity improvements through modern technologies and the use of available inputs and technologies. Sometimes, compared with the technological change approach, productivity change using existing technologies with better input allocation or modern technologies with available inputs could better contribute to economic and environmental sustainability. Thus, efforts to improve village chicken productivity need to follow a comprehensive approach, including consideration of technological change, improvement of the efficiency of the production process, and enhancing other institutional and market-related factors [11]. However, lessons learned from research and development efforts demonstrate that improved efficiency should be the primary driver of productivity growth and economic development, as it can successfully benefit impoverished populations in developing economies [10,12,13].
Based on economic theories, production efficiency could be associated with technical, allocative or economic efficiency [14]. Among these categories, technical efficiency, which refers to the production of the maximum possible output using a given set of inputs, is the most commonly reported measure for agricultural commodities and other firms globally [15,16,17]. An agricultural firm is considered technically efficient when producing the maximum output using available inputs [14]. Conversely, a firm is technically inefficient when it cannot produce the expected output using available inputs. Thus, as producers’ transition to technical efficiency, they either maintain production levels with minimum inputs or increase outputs while using the same inputs [14].
There is a considerable amount of literature on an increasing trend in using different inputs such as supplementary feeds, disease treatments, and improved production practices by village producers [18,19]. Coupled with existing lower productivity, this makes understanding the efficiency of the production system a good starting point to design productivity-enhancing policies and strategies. Notably, given the limited access to production technologies and inputs, the identification of factors associated with the technical efficiency of producers is a substantial contribution. However, in most developing countries, including those in Sub-Saharan Africa, comprehensive evidence on the technical efficiency of village chicken production and major factors that trigger efficiency/inefficiency is very scanty. The contributions of Aboki, Jongur [6], and Alabi and Aruna [20] serve as the exception, but these works have small sample sizes and are specific to distinct locations. Extensive evidence based on country, multi-country or regional level data is almost non-existent. As a result, there is no comprehensive evidence to design development interventions at diverse socio-economic conditions and geographical areas. Therefore, using national-level representative data from Ethiopia, Nigeria, and Tanzania, this research presents comprehensive and policy-relevant insights on the level of efficiency and major factors associated with the existing level of efficiency in the region. This paper explores the policy-relevant shreds of evidence and entry points for development interventions that would help transform the sector’s production and productivity. The rest of this paper is organized as follows. Section 2 presents the research methods and empirical approaches adopted. Section 3 explores the results and discussion. Section 4 highlights the conclusions and policy implications.

2. Research Methodology and Empirical Approaches

2.1. Sampling Methods

The data for this study were generated from a baseline survey of the African Chicken Genetic Gains (ACGG) project, which was conducted in Ethiopia, Nigeria, and Tanzania in 2015. This baseline survey adopted multi-stage sampling techniques that include sub-national areas/regions, zones, districts, villages, and households. Through desk review and key informant interviews at each administrative level in each country, we identified the following purposive selection criteria: Chicken production potential, agroecology, number of holders, and contribution of chicken production to household income and food security. Based on the above criteria, 203 sample villages were randomly selected from a thorough list of villages. Finally, from the sampled villages, a total of 3555 (Ethiopia = 1258; Nigeria = 1146; Tanzania = 1151) households were randomly selected for a structured interview. All the respondents consented to the survey, and data were collected by well-trained enumerators through face-to-face interviews using tablet computers loaded with Open Data Kit (ODK). We conducted the data management and analysis using the Stata Version 16 Statistical Package. Based on the major objective of the study, sample village producers who keep both local and improved chicken breeds were dropped and 3029 (Ethiopia = 932; Nigeria =1000; Tanzania = 1097) village producers who keep only local breeds were used for the analysis.

2.2. Dependent and Independent Variables

Unlike commercial agriculture farms, efficiency analysis for the village chicken production system is not straightforward due to the following two primary reasons. First, as Taylor and Adelman [21] indicated, rural households face dual production and consumption decisions that may force them to use outputs for home consumption, income generation, and other purposes, making the estimation of real output values difficult. Second, village chicken production generates multiple outputs, live birds, and eggs that violate the single-output production principle of the most common advanced econometric models used for technical efficiency analysis. Researchers have recommended various approaches to conduct efficiency analysis [22,23]. According to Coelli and Perelman [23], aggregation of the total output into a single index such as revenue, dual cost function, input-requirement functions, and ‘n’ output- or input-orientated distance function are some of the possible options. The first options require the observability of the output prices and the second option requires the cost minimization behavior of the producer. Based on the nature of our data, we chose the aggregation approach and generated the total value of eggs and live birds used for different purposes. These include income generated from the sale of live birds and eggs, the estimated value of live birds and eggs consumed at home, the estimated value of change in flock size, and the estimated values of output transferred to others in the form of a gift or used for other social or cultural values. We used this aggregated value as the output of the frontier function.
The inputs used in the frontier function include the value of purchased and owned feed used, the total number of local hens, cost of vaccination and disease treatment, time allocated for chicken management, total land holding, and average household annual income (a proxy for capital). To explore the factors associated with the level of technical inefficiency, which is the main purpose of this analysis, we included various farm, institutional, and environment-related indicators in the inefficiency model.
Furthermore, considering the reported production and productivity indicators of the local breeds in the three countries and assuming a similar level of access to technologies in the study areas, we used the pooled and country-level data to estimate the efficiency. In the pooled data, the frontier is based on the best practices in the three countries. This does not only enable us to undertake cross-country comparison, but it also helps generate policy-relevant evidence to be used both at the country and regional levels. In addition, to capture unmeasured and unobservable sources of inefficiency at the country-level, such as macroeconomic policy, institutional, and infrastructural issues, we included a country dummy indicator in the pooled frontier model. The value of inputs and outputs in each country is converted to its USD equivalent using the average annual official exchange rate of 2015 [24].

2.3. Theoretical and Empirical Approaches

Empirical researchers use different econometric models to assess the productivity and efficiency of agricultural commodities in developed and developing countries. Mostly, researchers have adopted parametric and non-parametric approaches [25]. The most commonly used non-parametric approaches are the Data Envelopment Analysis (DEA) and Free Disposal Hull models [16,26,27]. Although the DEA technique does not require a prior specific functional form for the production frontier, researchers primarily use this technique to handle multiple outputs and multiple inputs without aggregation [25]. While the absence of any prior assumption or lack of parameterization is an important strength for DEA, its sensitivity to extreme observations and attribution of all deviations from the frontier as inefficiency are its drawbacks. The drawbacks lead to biased parameter estimates in the frontier and inefficiency models. Furthermore, if one is interested in estimating both the level of efficiency and factors associated with inefficiency, it should be done using a two-stage analysis.
The main parametric approaches used in empirical studies, including frontier production functions and distance functions, can be categorized as stochastic or deterministic functions [9]. In Stochastic Frontier Analysis (SFA), unlike DEA, the deviation from the frontier function is attributed to firm characteristics and other external factors that affect the level of efficiency [28]. In other words, while DEA considers the random noise as inefficiency, SFA separates statistical noise associated with other factors outside the control of the firm and technical inefficiency. The ability to determine the efficiency and factors associated with efficiency simultaneously is considered an important feature in SFA [29]. As a result, SFA has been used by many researchers to assess the efficiency of agricultural productions in different countries [30,31,32,33]. Sometimes researchers use parametric and non-parametric approaches to check the consistency of estimates and compare their robustness [32,34]. Empirical researches show that the choice of models depends on the type of analysis, nature of the data, and the researchers underlying assumptions.
Considering the aim of the analysis, we applied SFA to estimate the level of efficiency and identify factors associated with inefficiency. SFA estimates the parameters using a two-step approach: Estimating the model parameters using maximum likelihood followed by estimating the inefficiency point estimate through conditional mean distribution using f u i / ε ^ i   , where ε ^ i   = y i   α ^ x i β ^ [14]. The level of inefficiency is estimated by using mean E   ( U | ε ^ ) . After obtaining the estimated values of point estimate u, the technical efficiency is obtained by E f f = exp   u   ^ . The formula for SFA is represented by the following equation:
y i = α + x i   β + ε i ,         i = 1 . . N
ε i = v i u i
v i N 0   ,   σ v   2
u i     F
where y i is the logarithm of the output, x i is the vector of inputs, such as feed, labor, vaccination, capital, land size, and number of chickens. The composite error term ε i stands for the measurement and specification error terms represented by v i and the inefficiency component u i . Both the error terms are assumed to be independent and identically distributed across observations. Furthermore, v i and u i are statistically Independent and Identically Distributed (IID) across observations, and f ( v i ) have symmetric distribution.
One prominent issue in efficiency analysis is determining the functional form of equations that designate the relationship between inputs and outputs. According to Greene [14] and Kumbhakar, Wang [9], Cobb-Douglas, and Trans Log functions are the most common functional forms used by most empirical research in stochastic frontier analysis. Considering the nature of our data, we applied the Cobb-Douglas production function as indicated below [9]:
ln y i =     ln y i * u i ,   u i   0
ln y i   * = f x i * ; β + v i ,
where y i   represents the observed output of village producer ‘i’ and y i   * is the potential output with zero mean and random error. The error term u i   is the effect of technical inefficiency on the outputs. The vectors x i   and β are distinct types of inputs used and their corresponding coefficients, respectively. The stochastic frontier is defined by Equation (5) due to the   u i and the model without u i represents the classical production function. We assumed that v i has a normal distribution with mean zero and variance σ v   2 and u i has truncated normal distribution with mean μ and variance σ u   2 . The notation N + μ   ,   σ u   2 shows the truncation of the normal distribution from above.
u i N + μ   ,   σ u   2
v i N 0   ,   σ v   2
Some of the explanatory variables in the frontier model have zero values. This is common in agricultural data as some producers may not use all the inputs for different reasons [35]. However, this leads to a significant loss of sample sizes, as the logarithm of zero gives missing data and results in biased coefficients estimates. Empirical research suggests the following approaches to handle the problem of zeros in Cobb-Douglas production functions. The first approach is adding one or any arbitrary number and including all the observations in the analysis. Although this approach helps keep a higher sample size, researchers criticize this approach due to its significant effect on the estimated parameters when the zero observations are large. The second approach uses Inverse Hyperbolic Sine (IHS) transformation, an innovative approach in econometric applications. However, as Bellemare and Wichman [36] explained, using this transformation would change the expected level of input elasticity. The third approach uses dummy variables associated with each of the independent variables that indicate the incidence of zeros. According to Battese [37], this approach gives unbiased parameter estimates and is applied to estimate the technical efficiency of smallholder farmers in developing countries [38]. This paper adopted this approach to include a maximum number of observations and generate unbiased parameter estimates.
The equation for the Cobb-Douglas production function of village chicken producers can be specified as follows:
ln ( Y i ) = β 0   + β 1 ln ( F D i ) +   β 2 ln ( L H i ) + β 3 ln ( V T i ) + β 4 ln ( F L i ) + β 5 ln ( L D i ) + β 6 ln ( K P i ) + B 1 D 1 i + B 2 D 2 i + B 3 D 3 i + B 4 D 4 i + B 5 D 5 i + B 6 D 6 i + v i u i ,     u i   0
where Y i is the total value of egg and live bird produced and F D i , L H i ,   V T i , ,   F L i ,   L D i ,   and   K i represent the feed, number of local hens, vaccination/treatment, family labor, land, and capital, respectively. The indicators represented by D i signify dummy indicators for the inputs, which have zero values. The individual efficiency level T E i is estimated through the following formula:
T E i = Y i Y * = exp ( u i )
where Y * is the frontier output and Y i is the output ith village producer. In the case of a production frontier, TEi will take a value between zero and one. The overall variance ε is given by:
σ 2 = σ u 2 + σ v 2
γ = σ u 2 ( σ u 2 + σ v 2 )
γ stands for the proportion variance accounted for technical inefficiency. The higher the proportion, the larger the technical inefficiency that accounts for the village producers’ variability.

2.4. Exogenous Determinants of Inefficiency

As stated above, one of the important advantages of stochastic frontier analysis is the inclusion of exogenous variables that affect the distribution of the inefficiency term in the same model. The exogenous variables should be neither input nor output variables that affect the performance of producers either by shifting or scaling the frontier and distribution functions or both. The inefficiency determinants model can be specified as follows:
U i = 0 + 1 x i + 2 x i + x 3
U i is the inefficiency component as defined above, and ‘xi’ represents different households and other socio-economic factors that affect the level of inefficiency. Although the distributional assumption is considered as the most important aspect in technical efficiency analysis, empirical findings suggest that models of technical efficiency analysis are robust for distributional assumptions [14].

3. Results and Discussion

3.1. Descriptive Summary of Output and Input Variables

Table 1 presents a summary of inputs and output variables used in the technical efficiency analysis. The average 3-month income generated from poultry products is about USD 18.1, 44.9, and 52.8 in Ethiopia, Nigeria, and Tanzania. The overall average 3-month income in the three countries is about USD 39.5. The average number of local hens owned by village producers is five, with a minimum of three in Ethiopia and six in Tanzania and Nigeria. The average feed cost is USD 16.2 in the three countries. The average feed cost in Tanzania is greater than in Nigeria and Ethiopia. Despite the higher disease outbreak and incidence report, the household expenditure for vaccination and disease treatment is low. The expenditure in Ethiopia is by far lower than in Nigeria and Tanzania.
On average, producers spend about 57.3 h for management, including purchasing inputs, feeding, watering, cleaning, and other related activities. Producers in Ethiopia spend more time on management than producers in Nigeria and Tanzania. The average landholding in the three countries is 1.7 h, and households in Tanzania have the largest average holding size than Ethiopia and Nigeria. Household capital indicators, the average yearly income, is the highest in Ethiopia and lowest in Nigeria. This shows that village chicken producers in Nigeria engage in limited agricultural and non-agricultural income-generating activities compared with Ethiopia and Tanzania. On average, village, chicken producers have about 1.7 h of land.

3.2. Summary of Exogenous Variables Used in the Inefficiency Model

We included household and farm characteristics, access to institutions and markets, and other socio-economic indicators in the inefficiency determinants model. Table 2 details a summary of these indicators. The length kept indicates producers’ experience in chicken production. On average, producers in the three countries have 13 years of experience in village chicken production. Producers in Nigeria and Tanzania have the highest and the lowest average experience, respectively. The average number of household head schooling years is about 6 years. Producers in Ethiopia have the lowest schooling years than producers in Nigeria and Tanzania. Training represents the average number of poultry-related extension and training activities the producers participated in the previous 12 months. This indicator shows that producers in the three countries have limited access to poultry production and marketing related education. On average, there are five persons (adult equivalent) within the producers’ households that could participate in poultry production and marketing activities. The average number in Nigeria is higher than in Ethiopia and Tanzania.
The housing index indicates the quality of chicken housing used by producers in dry and wet seasons and during the day- and night-time. This index is generated by weighting diverse types of housings used by the producers. It shows the level and quality of housing used for chicken production in wet and dry seasons. A higher value represents better housing quality. Producers who use separate poultry houses during dry and wet seasons would have a better index than producers who do not use any type of housing or keep the chicken in the home. On average, producers in Nigeria and Tanzania have a better housing system than producers in Ethiopia. The average distance of producers from all-weather roads is about 2.1 Km, a minimum of 1.30 Km in Tanzania and a maximum of 2.75 Km in Ethiopia. The distance to all-weather roads is a good indicator for access to input and output markets and institutions. The women empowerment index (Women Emp. Index) captures women’s engagement in income use decisions, asset ownership, and employment opportunities. We generated this index using normalization and aggregation approaches, and it shows the relative access of women to resources. The higher the value, the better the access to and use of resources. This index shows the presence of a statistically significant difference among the three countries. The overall average flock size is about 20, with a minimum average of 8 in Ethiopia and a maximum average of 26 in Nigeria. The average flock size in Nigeria and Tanzania is more than three times higher than the average flock size in Ethiopia. The last column shows the non-parametric Kruskal-Wallis test used to assess differences in the median values of indicators among the three countries. This test revealed statistically significant differences between the average values of all the variables in the three countries.
Table 3 presents a summary of the categorical variables included in the inefficiency determinant model. On average, 52.2 and 60.4% of the producers reported their experience in culling and breed selection activities. Compared with Nigeria, a higher percentage of producers in Tanzania and Ethiopia have experience in culling activities. A higher percentage (82.3%) of producers in Ethiopia and a lower percentage (40.7%) of producers in Nigeria have breed selection experiences. On average, 58.6 and 14.1% of the producers have access to health and credit services in the three countries. The percentage of producers who have access to health and credit services is lower in Nigeria than in Ethiopia and Tanzania.
Contribution to livelihood shows if poultry production is considered among the three most important livelihood activities in the household. Of the total respondents, 51.4% reported poultry production as being among the three major livelihood activities. Compared to Ethiopia and Nigeria, a higher percentage of producers in Tanzania consider poultry production as a major livelihood contributor. Producers’ feeding and watering practices are included as a categorical variable: Producers who do not provide water and feed in a container, producers who provide either water or feed in a container, and provide feed and water in a container. Only 5.2% of the respondents do not supply water in a container and throw feed on the ground from the total respondents. About 59.1% of the producers’ practice either of the management options, and the remaining 35.7% supply both water and feed in a container. Compared to Ethiopia and Nigeria, a higher percentage of producers in Tanzania are hygienic and use containers to supply feed and water. Of the total respondents, about 22.2% are female-headed producers. The gender of the head enables us to assess the associations between the gender of the head and the level of inefficiency.

3.3. Results of the Stochastic Frontier Model

Table 4 presents results from the stochastic frontier production function model for pooled and country-specific data. We regressed the aggregated value of total live birds and eggs produced with different inputs used for production. In the pooled model, the level of technical efficiency is positively associated with the number of local hens, cost of feed, cost of vaccination, amount of labor, and total land holding. The country-specific frontier model shows variability in the elasticities of different inputs used in each country. The number of hens has a positive and significant effect in the three countries models. The effect of vaccination and disease treatment is positive and significant in Ethiopia and Tanzania. The effect of feed, family labor, and household’s capital is positive and significant only in Tanzania.
The elasticity of inputs on outputs can be explained using the pooled model results. The value of total poultry production looks more elastic with the number of hens followed by vaccination and feed. A 1% increase in the number of hens increases the overall value of production by 0.264%, revealing that holding a lower number of productive hens reduces productivity. A small number of productive hens at the village level is attributed to financial capacity, high mortality, and the longer time needed to bring hens to reproductive maturity. Feed is the other production and productivity limiting factor under village management conditions. A 1% increase in feed expenditure increases the value of output by 0.041%. Similarly, the effect of vaccination and disease treatment on the value of outputs is positive and significant. A unit increase in vaccination expenditure increases the production value by 0.153%, which could be associated with reduced mortality and enhanced productivity.
The effect of time spent on management is also positive and significant. A 1% increase in an hour spent on management increases the value of production by 0.048%. Correspondingly, the effect of landholding size on the value of production looks elastic and positive. A 1% increase in total landholding size increases the overall value of production by 0.026%. This is expected as a larger holding size enables producers to keep larger flocks, produce more feed, and construct better chicken housing. The proxy for household capital, the average household income, has a positive but insignificant effect on the production value. The country dummy indicator for the difference in macroeconomic policy, institutional and environmental-related factors underline significant variations between countries. Considering Ethiopia as a reference, the indicators for Tanzania and Nigeria are positive and statistically significant at 1%. This implies that village chicken producers in Tanzania and Nigeria could produce more outputs by the given inputs than producers in Ethiopia.
Lambda, the ratio of ‘ui’ and ‘vi’, is remarkably high and statistically significant at 1% in the pooled and country-specific models. This shows that the variation in the technical inefficiency of chicken producers could be attributed to farm or household-specific characteristics than random variation. The estimated variance for the pooled model is 0.93, which indicates that about 93% of the total variation is due to variation in village producer’s production efficiency and not random variability. The country-specific variance for Ethiopia and Nigeria is also 93%, while the variance for Nigeria is 96%.
The sum of the partial elasticities of all the inputs or the return to scale for the pooled data is about 0.55. This highlights a decreasing return to scale and suggests that increasing all the inputs by 100% leads to an increase of output by 55%. Similarly, the country-specific return to scale for Nigeria and Tanzania are 0.39 and 0.69, respectively. Unlike Nigeria and Tanzania, the return to scale in Ethiopia is 1.0, which indicates a constant return to scale. The decreasing return to scale underscores that current production technologies used by village producers are not input elastic. This could be associated with the production system and type of poultry breeds kept by producers. Therefore, illuminating the need to avail other productive technologies and improved production practices with better elasticity to inputs. When the production function exhibits a decreasing return to scale, using more and more inputs would decrease productivity. Alternatively, the use of better technologies is an appropriate option [9].

3.4. Level of Estimated Technical Efficiency and Exogenous Determinants of Inefficiency

Table 5 presents the estimated overall and country-specific technical efficiency of village chicken producers in the three countries. The estimated technical efficiency for the pooled model is about 38%, with a minimum of 28.5% in Ethiopia and a maximum of 43.6% in Nigeria. This overall technical efficiency indicates that an average village chicken producer produces 38% of the value of output produced by the most efficient village chicken producer using the same technology and inputs. The average efficiency score in the pooled model is less than the country-specific efficiency score in Nigeria and Tanzania and greater than the country-specific efficiency score in Ethiopia. The pooled and country-specific models suggest that producers in Nigeria and Tanzania use existing resources efficiently than producers in Ethiopia. The estimated average technical efficiency scores prove significant productivity variation among village chicken producers in the three countries. This shows the presence of a tremendous opportunity to improve village chicken production and productivity with available inputs without a momentous change in production practices. A lower technical efficiency also highlights that improving farmers’ access to locally adapted technologies could be another important policy option to enhance productivity [39]. The available few empirical studies have also examined lower technical efficiency levels in the region [6,20,40].
The low level of technical efficiency underlines the need for examining the potential causes of efficiency differentials. This helps explore entry points for research and development activities. Furthermore, including exogenous determinants of inefficiency in the production function equation helps improve the estimated parameters [9,29]. As stated above, the dependent variable in the exogenous determinant model is technical inefficiency generated from the frontier model, and the exogenous determinants are household socio-economic and other institutional variables. We present a summary of the model results in Table 6. The estimated parameters from the regression model revealed that the level of technical inefficiency is strongly affected by household and farm level characteristics. In the estimated coefficients, a positive sign shows an increasing effect on technical inefficiency or a decreasing effect on technical efficiency and the negative sign shows a decreasing effect on technical inefficiency or an increasing effect on technical efficiency. We categorized these characteristics into lack of experience in breed selection and management, technical skill and experiences, management practices, access to institution and markets, household livelihood strategies, farm/flock size, and an inter- and intra-household gender disparity.

3.4.1. Experience in Breed Selection and Management

Improved production practices play a significant role in enhancing the level of production and productivity of smallholder farmers. In smallholder chicken production, the productivity of chicken depends on breeds performances, including sexual maturity age, the number of eggs/clutches, number of chicks produced per single hatch, adaptability, and growth performance. The estimated coefficients from the pooled and country-specific models highlight the presence of a negative and statistically significant association between breed selection and culling with the level of technical inefficiency.
The marginal effect in the pooled sample shows that producers who practice breed selection are 18% less inefficient than those who do not. The effect of breed selection in Ethiopia and Nigeria is higher than in Tanzania. In Ethiopia, producers who practiced breed selection are 36% less inefficient than others who do not. Breed selection improves productivity by building a flock with the desired characteristics. According to the sampled respondents’, producers use body size/weight, egg size/weight, egg productivity, feed requirement, and others to select breeds. Empirical studies in developing countries have also documented the critical role of breed selection in improving the production and productivity of chicken [5,41,42]. Despite the long duration it takes, in the rural household settings, breed improvement through selection is more sustainable than other breed improvement techniques [5]. The negative and significant association between breed selection and technical inefficiency also suggests enhancing smallholders’ access to locally adapted improved breeds that produce better eggs and meat using modest change in management practices.
The pooled model shows that producers who practice culling are 15% less inefficient than others. The effect of culling in Ethiopia is higher than the effect in Tanzania and Nigeria. In Ethiopia, producers who practiced culling are 28% less inefficient than others. Village producers cull chickens based on criteria related to farmers’ production objectives, mainly income generation and consumption of products [43]. Culling helps remove low productive and undesirable chickens. According to the sample respondents, most of them use egg productivity, age, disease concern, body weight, and broodiness as the most important criteria for culling. The strong relation between culling and technical efficiency underlines the important role of building producers’ capacity in this aspect through proper guidelines.

3.4.2. Technical Skills and Experiences

Village chicken producers’ skills and abilities in production and marketing decisions have a significant role in improving the production and productivity of the sector. Experience in poultry production and participation in poultry production and management training are the skill-related factors included in the inefficiency determinant model. There is a negative and statistically significant association between experience in production and technical inefficiency in the pooled and country-specific models. The marginal estimate shows that a unit increase in chicken production experience decreases technical inefficiency by 1%. There is a negative and significant association between the producer participation in training and technical inefficiency in the pooled and Tanzania models. The pooled model shows that producers’ participation in poultry production and marketing training decreases technical inefficiency by 15%. Producers who participated in poultry management (feeding, watering, housing, breeding, health) and marketing training are more technically efficient than others.
Moreover, to strengthen smallholders’ competitiveness with the emerging commercial sector, their entrepreneurial skills such as record keeping (e.g., breeding, financial), networking, and exploiting marketing opportunities need to be capacitated. The above findings highlight the critical role of building the smallholder ability to enhance production and productivity. Empirical studies have also documented the positive roles of skills and experiences in smallholder’s technical efficiency [44,45,46].

3.4.3. Management Practices

Improved flock management practices such as better housing, feeding and watering practices enhance smallholders’ production and productivity. The association between housing index and technical inefficiency is negative and significant in the pooled and Ethiopia models. The effect of this variable in Ethiopia is highly significant than the pooled model. The marginal estimate from the pooled model shows that a unit increase in the housing index reduces the technical inefficiency by 18.3%. In Ethiopia, a unit increase in the housing index reduces technical inefficiency by 96%. The negative relationship between these two variables is anticipated as poultry housing protects birds from extreme weather conditions, disease contamination, predator attacks, accidents, and theft. The multidimensional role of poultry housing to improve smallholder chicken production and productivity has been documented by other researchers [4,47]. Although it is not significant, the estimated parameter highlights the negative association between producers’ feeding and watering practices and producers’ inefficiency level. Taking producers who do not provide water and feed with containers as a reference, producers who provide water and feed with containers look less inefficient. The availability of feeders and drinkers enhances bird health through increased access to water and food, improved administration of drugs and vitamins, and reduced contaminations of feeds and clean water. It also prevents mice, rats, and other birds from eating their feed and transmitting diseases. Other researchers have also explored the positive role of improved husbandry practices and input use to enhance the productivity of the poultry sectors in developing countries [12].

3.4.4. Access to Institutions and Markets

We included producers’ access to credit, access to health services, and access to all-weather roads as institution and market related exogenous determinants of the inefficiency term. There is a negative and significant association between producers’ access to credit and technical inefficiency in the pooled and Ethiopia models. The pooled model show that producers who have access to credit services are 15% less inefficient than producers who have no access to credit services. In Ethiopia, producers who have access to credit are 36% less inefficient than others. Access to credit helps use productivity-enhancing inputs such as feeds, vaccines, and other fixed assets such as feeders, drinkers, and better housing systems. For instance, due to the limited financial capacity, smallholder producers usually do not provide adequate vaccines and balanced feeds, leading to substantial loss of chicks and reduced productivity. However, smallholders’ limited credit use could be attributed to both supply and demand related challenges [48], and adopting integrated approaches are feasible solutions. Other researchers have also examined the significant role of access to credit on the technical efficiency of smallholder farmers in developing countries [49,50].
Vaccination and disease treatment practices are expected to have a positive effect on technical efficiency. Contrary to expectation, there is a positive and significant association between access to health services and producers’ inefficiency in the pooled model and an insignificant positive association in Nigeria and Tanzania models. Although it is insignificant, access to health services seems to have a negative effect in Ethiopia. There are several explanations for the positive association between vaccination and disease treatment practices and technical inefficiencies, such as failures of vaccines/medication and limited extension and support services. Vaccine/medication failures might have resulted from a lack of proper handling, quality of vaccines, use of local antigens, immunogenic response inside the bird’s body, and inability to follow manufacturers’ instructions [51]. For example, from the total respondents who used vaccines or different medications in 12 months, more than half reported that the treatment was either poor or fair. Most of the producers administered the disease treatment by themselves, and only a smaller proportion (4.3%) received expert services. The limited skills of village producers and inadequate extension advice would contribute to the reported vaccines or drugs failures.
Furthermore, the availability of health services does not merely lead to using the services due to producers’ limited financial capacity or inadequate information on the available services. For instance, out of the total respondents who had access to paid health services, a sizeable proportion (51.6%) did not take any routine vaccination and treatments in 12 months. This could be associated with fatigue from repeated drug failure, poor services, limited capacity of veterinary workers, and inadequate supply of vaccines or drugs or the workload if it is time-consuming. Alternatively, from the total respondents who conducted routine vaccination or disease treatment, about 29.4% said they had no access to paid veterinary services, indicating that producers likely have alternative means of access to vaccine/disease treatment. The extensive use of traditional treatment options in the three countries could be the other potential cause for an unexpected relationship. Of the total respondents who experienced disease outbreaks, 26.2 and 32.3% of the producers used traditional and modern medicine, respectively. The extensive use of traditional treatment options may lead to significant loss of chicks due to the unstandardized administration and limited efficacy of the drugs.
Taken together, the above pieces of evidence demonstrate that the availability of paid health services may not lead to intensified use and success in disease prevention and treatments at the smallholder level. This suggests building producers’ capacity in health management options and establishing innovative health services delivery systems. Such changes could be achieved through integrated approaches that include building producers’ ability in disease monitoring and identification and improved treatment and prophylaxis of birds. Different stakeholders (e.g., the private sector, NGOs, cooperatives) that provide livestock health and extension services need to be engaged for sustained outcomes.
Producers’ distance from all-weather roads is an important indicator for access to different institutions and markets. There is a positive and significant association between distance to all-weather roads and inefficiency in the pooled, Ethiopia and Nigeria models. In the pooled model, a unit increase from an all-weather road increases technical inefficiency by 4%. In Ethiopia and Nigeria, a unit increase in distance to roads increases inefficiency by 7 and 2%, respectively. Access to all-weather roads enhances access to input and output markets and other productivity-improving services [18]. In developing countries where there are limited suppliers of inputs and seasonal products consumption, access to central markets has an irreplaceable role in improving the production and productivity of the sector. Limited rural road connectivity affects production by increasing the cost of moving inputs and outputs. Other empirical studies have also documented the positive role of access to roads in smallholders’ technical efficiency [52,53].

3.4.5. Household Livelihood Strategies

Smallholders’ livelihood strategies involve a range of farms and non-farm activities that significantly affect agricultural production and productivity. We included chicken production contribution and an income diversification index in the inefficiency models. The result highlights that producers who rank poultry production among the top three livelihood contributors have a negative and significant association only in the pooled model. The marginal estimate shows that compared to others, these producers are 9.0% less inefficient. Farmers’ production goals and attitudes can explain the observed significant association. Smallholder poultry production is mainly driven by economic and non-economic goals, which dictate the management practices of producers. Smallholders’ production goals affect the choice of input and decision on the size of farms. Producers who consider poultry production as significant livelihood contributors may invest their time and resources to maximize economic and other non-economic gains. This illustrates the role of producers’ orientation on the level of production and productivity.
The effect of the household income diversification index on the technical inefficiency of households is negative and significant in the pooled and Ethiopia models. This result implies that village producers who have diverse income sources are less inefficient than others. In the pooled model, a unit increase in income diversification of households would decrease the level of inefficiency by 8.0%, while in Ethiopia, it reduces the level of inefficiency by 13%. This could be associated with better access to liquid capital to purchase inputs, and improved social capital resulted during diverse activities [54]. In developing countries, where there is a significant challenge to access liquid capital, diversified income sources enhance producers’ ability to use the necessary inputs. The role of production objective and income diversification in smallholder’s technical efficiency has also been explored by other researchers [55,56,57].

3.4.6. Inter- and Intra-Household Gender Disparity

Poultry is the major type of livestock owned and managed by women in developing countries [4,58,59]. This shows the need for considering the role of gender in the production and productivity of the sector. We included a dummy indicator for head gender and simple women empowerment index as exogeneous determinants of inefficiency. Considering male as a reference, the relationship between the gender of head and technical inefficiency is positive and statistically significant in the pooled and Nigeria models, suggesting that female-headed households are more technically inefficient than male-headed households. Compared with male-headed households, female-headed households are 10.0% more technically inefficient. Higher technical inefficiency for female-headed households could be associated with limited access to resources, information, and other institutional services that help enhance production and productivity.
Conversely, there is a negative and significant association between the women empowerment index and technical inefficiency in the pooled model. This demonstrates the role of improving women’s access to resources and their decision-making ability on production and productivity. Due to their crucial role in producing and consuming poultry products, this depicts the need to identify gender-specific constraints and design intervention that would enhance the sector’s efficiency [60]. Altogether, mainstreaming gender in the research and development efforts and overcoming existing gender inequality could be among the essential strategies in developing countries. Few empirical studies have also documented the significant impact of gender empowerment in agricultural technical efficiency [61].

3.4.7. Farm/Flock Size

Understanding the relationship between farm size and technical efficiency is a critical issue given the relevance of the topic and uncertainties in the available researchers [62]. We included a total number of chickens kept by households, measured by quantile size, in the inefficiency model to assess the effect of flock size on the level of inefficiency. Considering the first quantile as a reference, there is a negative and significant association between flock size and technical inefficiency in the pooled and all country-specific models. However, unlike Nigeria and Tanzania, the effect in Ethiopia is lower, which could be associated with the smaller flock size variability among the sampled respondents. Compared with the first quantile, the pooled model shows that producers in the second, third, and fourth quantile are 24.3, 71.6, and 130.1% less inefficient, respectively. This result demonstrates that an increase in flock size decreases the technical inefficiency of producers. Apart from the economies of scale benefits, holding a larger flock size could be an incentive to use different inputs (e.g., feed, vaccines, and housing) and improve overall production and productivity. Empirical studies have also examined the effect of farm size on technical efficiency [63,64,65].
The farm size indicator strongly asserts the significant role of increasing flock size to enhance the sector’s productivity. A smaller flock size at smallholder production could be associated with a high mortality rate and slower replacement of productive stocks. The mortality rate is highest during the chick stage due to inadequate vaccination, poor management, and predators’ attack. A slower stock replacement is the result of low hatchability, longer brooding periods, and small numbers of eggs set in a single hatch. The availability of multiple factors for flock size-reduction suggests the need for innovative interventions that would simultaneously address the most critical constraints. This may demand introducing new chick delivery and raising system in the value chain that may include integrating smallholder producers into the commercial production system to benefit the two actors concurrently. However, as Alvarez and Arias [66] examined, increasing the size of farms without building the technical skills and knowledge of producers may lead to diseconomies of scale, which also underlines the critical role of integrated interventions to enhance agricultural production in developing countries.

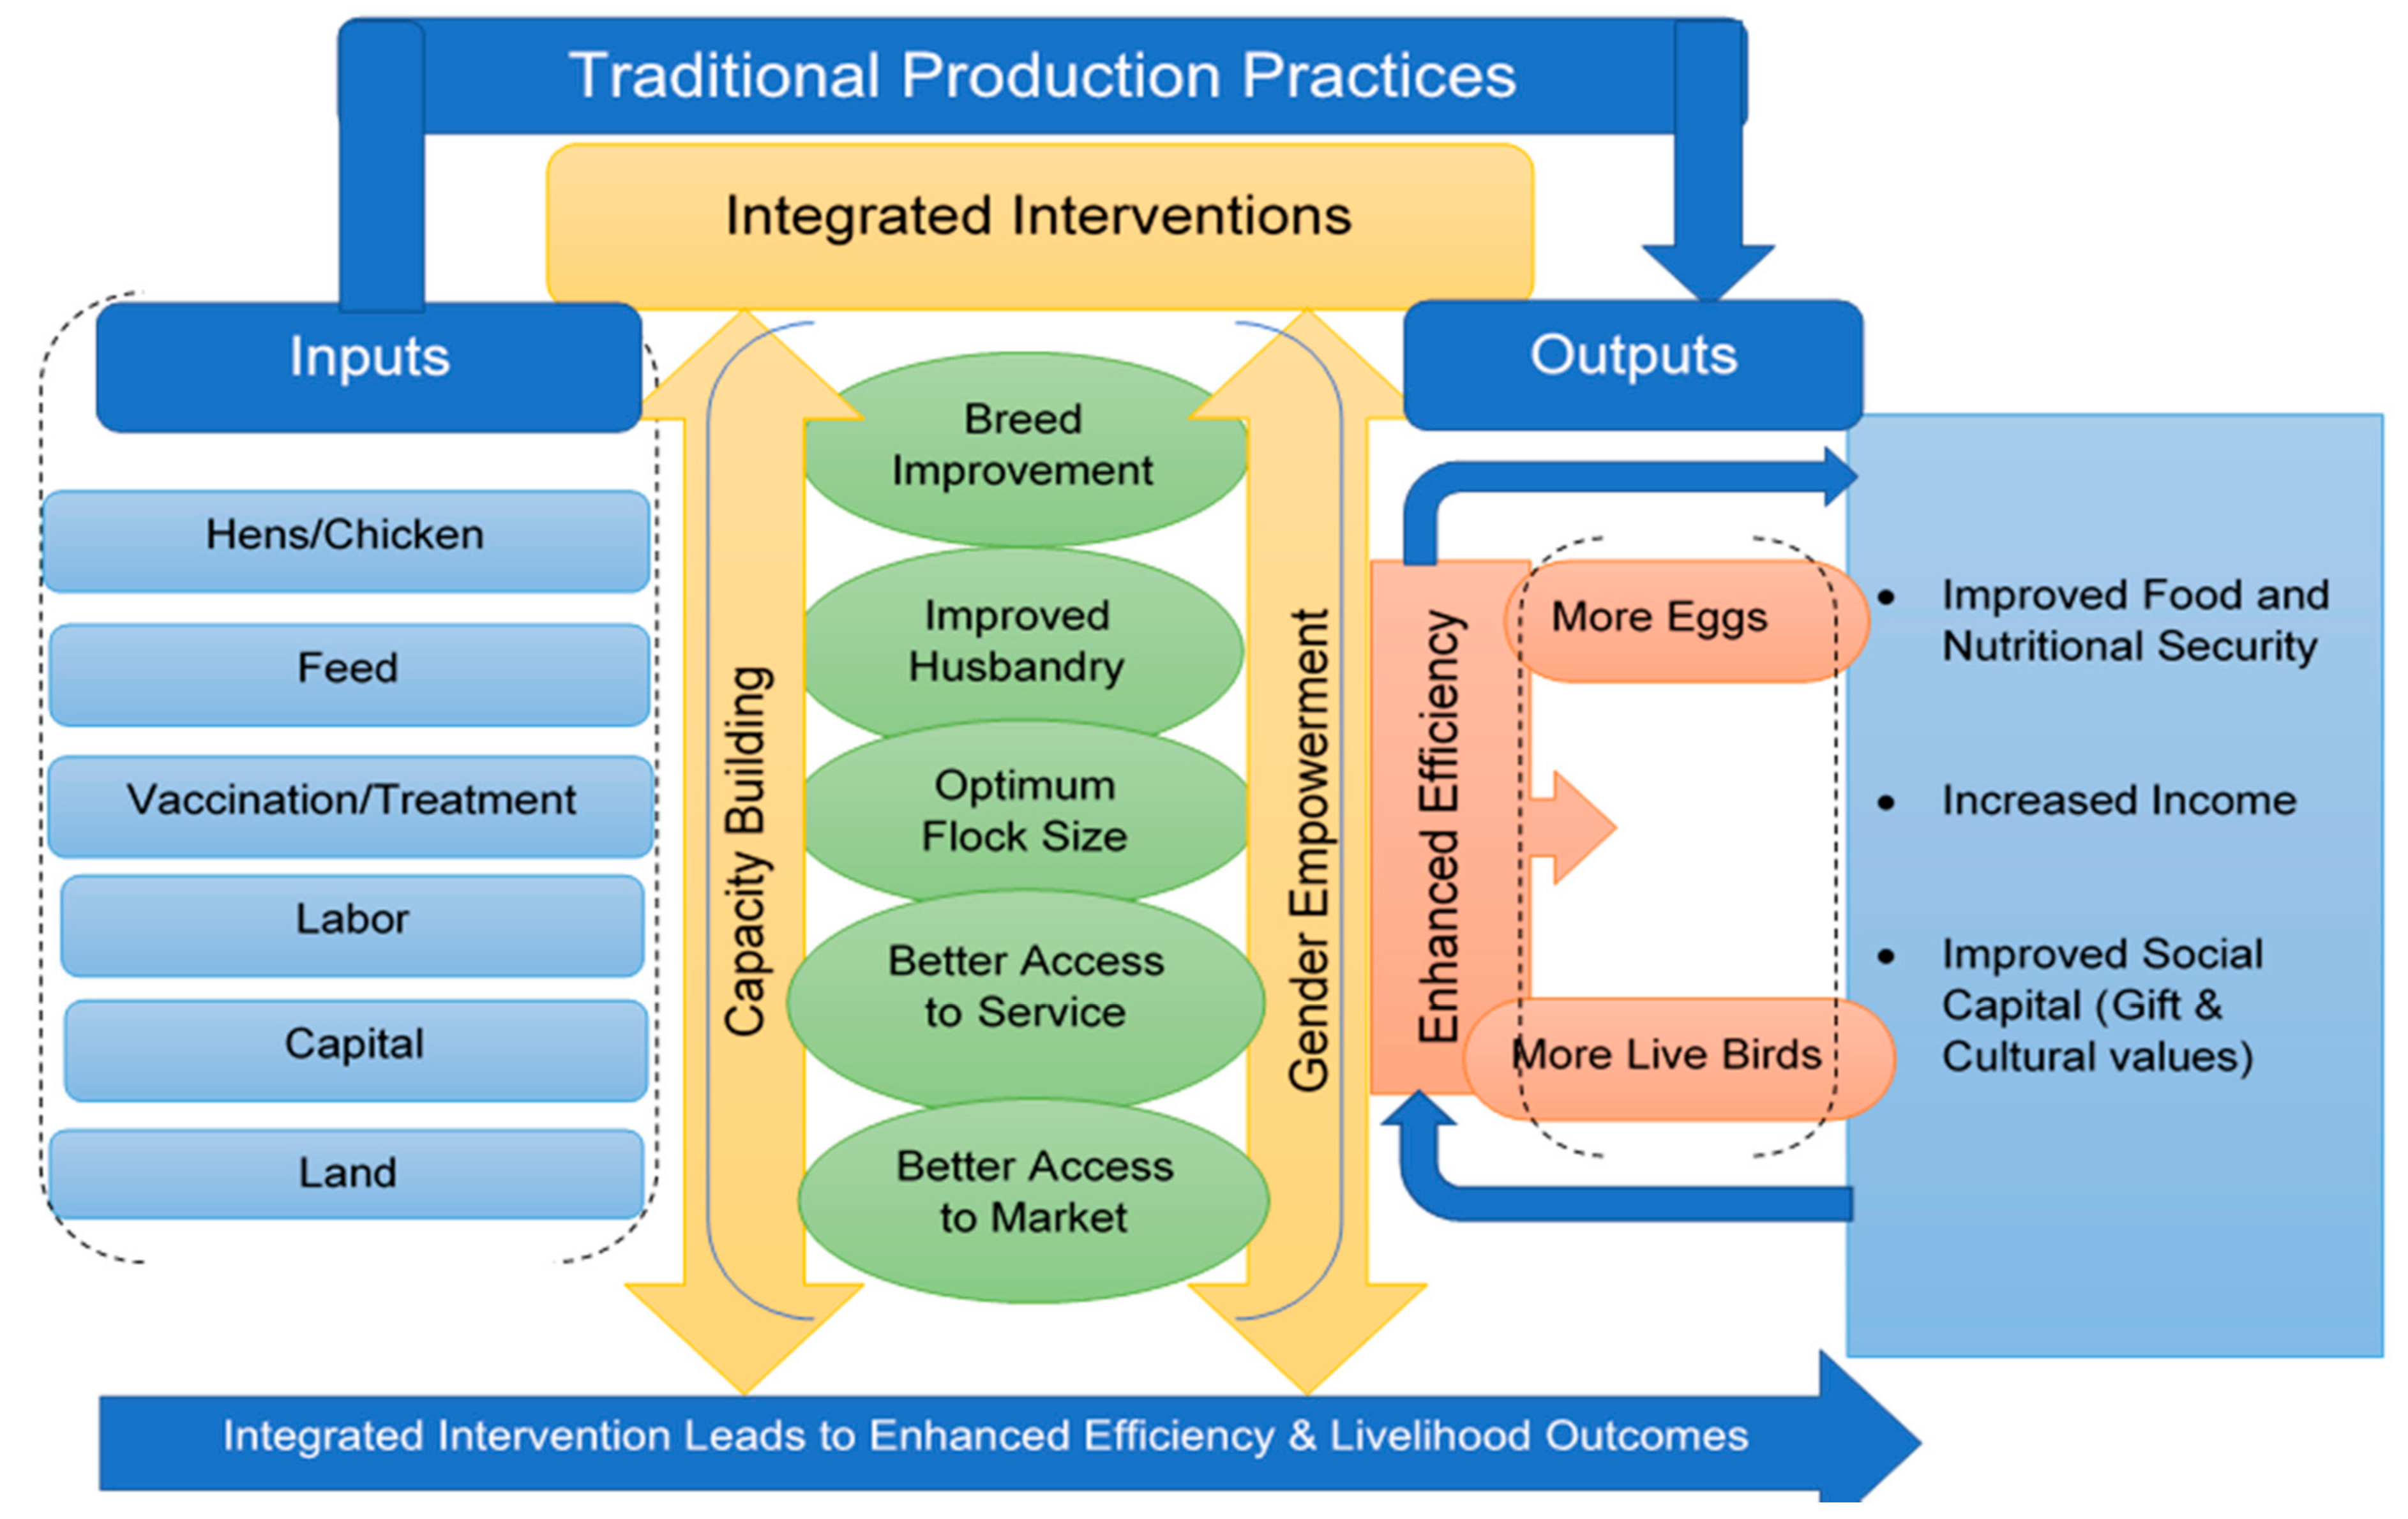
3.5. Implication for Sustainable Transformation

While the frontier model shows the number of productive hens, vaccination/disease treatment, feed, and labor as essential inputs to enhance efficiency, the inefficiency model demonstrates various socio-economic factors as the source of heterogeneous inefficiency. Remarkably, results from the frontier and inefficiency models underline the need to tackle multidimensional challenges to transform the inefficient, traditional production sector into a more productive and efficient sector. These needs integrated interventions that address the identified production and marketing constraints through innovative approaches. Such approaches require multi-stakeholder engagement, including village producers, government and non-government organizations, the private/commercial sector, marketing actors such as collectors, and downstream actors such as processors and consumers.
We present a simple graphic summary of the possible integrated interventions in Figure 1. The left side of the figure depicts major inputs currently used by most village producers in the traditional production system. These are available resources that village producers do not efficiently use due to the above-stated constraints. The center of the figure portrays the integrated interventions identified from the frontier and inefficiency models. While some of these interventions focus on addressing specific challenges at the farm, institutions or production environment level, others need to be integrated as a cross-cutting issue to address various challenges across the whole value chain. Capacity building and women empowerment are the two most critical cross-cutting issues that need to be mainstreamed within all interventions. Aligning these issues in different interventions would have significant contributions to sustain the sector transformation. Smallholder producers need to be capacitated in a range of issues, including feed formulation, disease prevention and treatments, flock management, marketing of products, collective actions, and networking with other actors. Similarly, due to their vital role in the production, consumption, and marketing of poultry products, women need to be at the center of any strategic intervention to transform the sector. Although implementing selected intervention may have specific outcomes, the sustainable transformation of the sector requires strategies that incorporate development options listed under the integrated interventions.
Moreover, strategies and development options that focus only on some of the suggested interventions may lead to other potential problems that would result in major economic and social losses. For instance, improved production and productivity without access to a better market can lead to significant economic and financial losses. Therefore, any intervention that aims to transform the sector should consider devising integrated interventions that could be implemented through partnership and collaborations. The role of integrated interventions for sustainable agricultural development is documented in various studies [67,68].
The right side of the figure shows the bidirectional interplay between enhanced efficiency and household livelihood outcomes. As stated above, household livelihood strategies have a significant effect on the level of technical efficiency. On the other hand, enhanced efficiency results in better livelihood outcomes through higher productivity gains and reduced production costs. Figure 2 presents the average number of eggs and chicken consumed in three months by quantile efficiency. On average, village producers in the lower quartile have lower egg and chicken consumption levels than producers in higher quantiles. For instance, producers in the fifth quantile consumed 13 eggs in three months, while producers in the first and second quartile consumed about two and seven eggs, respectively. Higher eggs and live bird productivity help improve household members’ food and nutritional security (i.e., women and children), increase household income, and even social capital. The above findings show that the association between enhanced efficiency and livelihood outcomes seems cyclical. We hypothesize that such cycles of improved productivity and livelihoods would positively affect the beliefs of village chicken producers, encouraging them to adopt better management and production practices. Therefore, enhanced efficiency has a short-term effect on higher production or productivity, but it also has a repercussive impact on the level of the sector’s overall performance due to the positive reinforcing changes in perceptions and livelihood outcomes.

4. Conclusions and Policy Implications

Village chicken production supports the livelihoods of many smallholder farmers in Africa, but the sector is widely known for low production and productivity. This could be associated with a lack of technical efficiency and inadequate technological progress in the production system. Results from the empirical analysis presented above reveal high technical inefficiency in the region, suggesting the presence of tremendous opportunities to enhance the production and productivity of the sector without additional inputs. The heterogeneity in technical efficiency is associated with multiple factors at household, farm, and institutional levels. Therefore, policy options that aim to transform the sector should address various challenges simultaneously at different levels. This may require implementing integrated interventions tailored to the specific socio-economic and environmental contexts of village producers. Research and development efforts need to give considerable attention to building the capacity of smallholder farmers in various production and marketing activities, with particular attention to the empowerment of women along the value chain. A higher level of production efficiency could be achieved through a sizable and strategical investment in capacity building through extension and training services and creating enhanced input delivery and output marketing systems. Moreover, a decreasing return to scale of the production frontier in our empirical model may suggest the limited potential of existing technologies and production practices to generate higher outputs with the increasing use of inputs. Shifting the production frontier by introducing improved technologies that respond to better inputs use could be the other policy option. A potential and immediate solution would be improving village producers’ access to locally adapted and farmer preferred improved breeds and production practices. The above policy options can be realized through innovative public-private partnerships, and stakeholder engagement approaches.

Author Contributions

Conceptualization, M.Y.B.; methodology, M.Y.B.; formal analysis, M.Y.B.; writing—original draft, M.Y.B.; incorporating co-authors comments and reviews; M.Y.B.; design and implementation of the survey, T.A.; drafting data collection tools, T.A.; supervising data collection, T.A.; data curation, T.A.; project administration, J.E.B.; funding acquisition, J.E.B.; design and implementation of the survey, J.E.B.; drafting data collection tools, J.E.B.; reviewing and editing the draft, J.E.B.; contribution in data collection tool preparation and survey design, F.G.K.; reviewing and editing the draft, F.G.K.; contribution in project conceptualization, E.B.S.; investigation and supervision in Nigeria, E.B.S.; contribution in project conceptualization, E.H.G.; implementation and supervision in Tanzania, E.H.G.; supervising data collection and data curation in Nigeria, O.B.; reviewing and editing the draft, O.B.; project conceptualization, T.D.; project proposal development, T.D.; funding acquisition, T.D.; project supervision, T.D.; drafting data collection tools, T.D. All authors discussed the results and commented on the manuscript. All authors have read and agreed to the published version of the manuscript.

Funding

This research was funded in part by the Bill & Melinda Gates Foundation (BMGF) (grant agreement OPP1112198) under the auspices of the ILRI. The findings and conclusions contained within are those of the authors and do not necessarily reflect the positions or policies of the BMGF.

Institutional Review Board Statement

Not Applicable.

Informed Consent Statement

Informed consent was obtained from all subjects involved in the study.

Data Availability Statement

The datasets used for this study can be found in the International Livestock Research Institute (ILRI) dataset portal in https://data.ilri.org/portal/ (accessed on 26 July 2021).

Acknowledgments

This research has contributions from the Ethiopian Institute of Agricultural Research (EIAR), Obafemi Awolowo University, Federal University of Agriculture, Abeokuta (FUNAAB) and National Animal Production Research Institute from Nigeria; and Tanzania Livestock Research Institute (TLRI). We would like to thank the African Chicken Genetic Gains (ACGG) team and the Research Methods Group at International Livestock Research Institute’s (ILRI’s) for their role during baseline conceptualization, development of training materials for enumerators, supervisors and national coordinators, the training workshops, data collection process, delivery of training, and the development of a sampling strategy for the survey. We are also incredibly grateful to smallholder chicken keepers and enumerators who were involved in the baseline survey.

Conflicts of Interest

The authors declare no conflict of interest.

References

  1. Hänke, H.; Barkmann, J. Insurance function of livestock, farmers coping capacity with crop failure in southwestern Madagascar. World Dev. 2017, 96, 264–275. [Google Scholar] [CrossRef]
  2. Akinola, L.A.F.; Essien, A. Relevance of rural poultry production in developing countries with special reference to Africa. World Poult. Sci. J. 2011, 67, 697–705. [Google Scholar] [CrossRef]
  3. Scanes, C.G. Contribution of Poultry to Quality of Life and Economic Development in the Developing World. Poult. Sci. 2007, 86, 2289–2290. [Google Scholar] [CrossRef] [PubMed] [Green Version]
  4. Wong, J.T.; de Bruyn, J.; Bagnol, B.; Grieve, H.; Li, M.; Pym, R.; Alders, R.G. Small-scale poultry and food security in resource-poor settings: A review. Glob. Food Secur. 2017, 15, 43–52. [Google Scholar] [CrossRef]
  5. Padhi, M.K. Importance of Indigenous Breeds of Chicken for Rural Economy and Their Improvements for Higher Production Performance. Scientifica 2016, 2016, 2604685. [Google Scholar] [CrossRef] [Green Version]
  6. Aboki, E.; Jongur, A.A.U.; Onu, J.I. Productivity and Technical Efficiency of Family Poultry Production in Kurmi local Government Area of Taraba State, Nigeria. J. Agric. Sustain. 2013, 4, 52–66. [Google Scholar]
  7. Kokkinou, A. A Note on Theory of Productive Efficiency and Stochastic Frontier Models. Eur. Res. Stud. 2010, 13, 109–118. [Google Scholar] [CrossRef] [Green Version]
  8. Jin, S.; Ma, H.; Huang, J.; Hu, R.; Rozelle, S. Productivity, efficiency and technical change: Measuring the performance of China’s transforming agriculture. J. Product. Anal. 2010, 33, 191–207. [Google Scholar] [CrossRef]
  9. Kumbhakar, S.C.; Wang, H.-J.; Horncastle, A.P. A Practitioner’s Guide to Stochastic Frontier Analysis Using Stata; Cambridge University Press: New York, NY, USA, 2015. [Google Scholar]
  10. Korres, G.M. Technical Change and Economic Growth: Inside the Knowledge Based Economy, 2nd ed.; Ashgate Publishing: London, UK, 2016; 392p. [Google Scholar]
  11. Food and Agriculture Organization. Family Poultry Development: Issues, Opportunities and Constraints. In Animal Production and Health Working Paper; Thieme, O., Sonaiya, E.B., Rota, A., Alders, R., Eds.; Food and Agriculture Organization: Rome, Italy, 2014. [Google Scholar]
  12. Nin-Pratt, A. Inputs, Productivity and Agricultural Growth in Sub-Saharan Africa. In Productivity and Efficiency Analysis; Greene, W., Khalaf, L., Sickles, R., Veall, M., Voia, M.C., Eds.; Springer: Berlin/Heidelberg, Germany, 2016. [Google Scholar]
  13. Barbier, E.B. Is green rural transformation possible in developing countries? World Dev. 2020, 131, 104955. [Google Scholar] [CrossRef]
  14. Greene, W.H. The Econometric Approach to Efficiency Analysis. In The Measurement of Productive Efficiency and Productivity Growth; Fried, H.O., Lovell, C.A.K., Schmidt, S.S., Eds.; Oxford University Press: New York, NY, USA, 2008. [Google Scholar]
  15. Kibirige, D.; Raufu, M.O.; Masuku, M.B. Efficiency Analysis of the Sub-Saharan African small-scale Agriculture: A Review of Literature on Technical Efficiency of Maize Production. J. Agric. Vet. Sci. 2014, 7, 124–131. [Google Scholar] [CrossRef]
  16. Mussa, E.C.; Obare, G.A.; Bogale, A.; Simtowe, F.P. Analysis of Resource Use Efficiency in Smallholder Mixed Crop-Livestock Agricultural Systems: Empirical Evidence from the Central Highlands of Ethiopia. Dev. Ctry. Stud. 2012, 2, 30–40. [Google Scholar]
  17. Tadesse, M.; Belay, K. Factors Influencing Adoption of Soil Conservation Measures in Southern Ethiopia: The Case of Gununo Area. J. Agric. Rural Dev. Trop. Subtrop. 2004, 105, 49–62. [Google Scholar]
  18. Hailemichael, A.; Gebremedhin, B.; Tegegne, A. Status and drivers of village poultry production and its efficiency in Ethiopia. NJAS Wagening. J. Life Sci. 2017, 83, 30–38. [Google Scholar] [CrossRef]
  19. Arnade, C. Using a Programming Approach to Measure International Agricultural Efficiency and Productivity. J. Agric. Econ. 1998, 49, 47–84. [Google Scholar] [CrossRef]
  20. Alabi, R.A.; Aruna, M.B. Technical Efficiency of Family Poultry Production in Niger-Delta, Nigeria. J. Cent. Eur. Agric. 2005, 6, 531–538. [Google Scholar]
  21. Taylor, J.E.; Adelman, I. Agricultural Household Models: Genesis, Evolution, and Extensions. Rev. Econ. Househ. 2003, 1, 33–58. [Google Scholar] [CrossRef]
  22. Liu, L.; Ondrich, J.; Ruggier, J. Estimating multiple-input–multiple-output production functions with an analysis of credit unions. Appl. Econ. 2012, 44, 1583–1589. [Google Scholar] [CrossRef]
  23. Coelli, T.; Perelman, S. Technical efficiency of European railways: A distance function approach. Appl. Econ. 2000, 32, 1967–1976. [Google Scholar] [CrossRef]
  24. Valev, N. The Global Economy: Business and Economic Data for 200 Countries. Dollar Exchange Rate—Country Rankings. 2020. Available online: https://www.theglobaleconomy.com/rankings/Dollar_exchange_rate/ (accessed on 10 September 2020).
  25. Coelli, T.J.; Rao, D.S.P.; O’Donnell, C.J.; Battese, G.E. An Introduction to Efficiency and Productivity Analysis; Springer: New York, NY, USA, 2005. [Google Scholar]
  26. Haji, J. Production Efficiency of Smallholders’ Vegetable-dominated Mixed Farming System in Eastern Ethiopia: A Non-Parametric Approach. J. Afr. Econ. 2006, 16, 1–27. [Google Scholar] [CrossRef]
  27. Beshir, H.H. Performance of mixed crop-livestock production system: The Data Envelopment approach. Livest. Res. Rural Dev. 2011, 23, 200. [Google Scholar]
  28. Aigner, D.; Lovell, K.; Schmidt, P. Formulation and Estimation of Stochastic Frontier Production Function Models. J. Econ. 1977, 6, 21–37. [Google Scholar] [CrossRef]
  29. Wang, H.-J.; Schmidt, P. One-Step and Two-Step Estimation of the Effects of Exogenous Variables on Technical Efficiency Levels. J. Product. Anal. 2002, 18, 129–144. [Google Scholar] [CrossRef]
  30. Alemu, B.A.; Nuppenau, E.A.; Bolland, H. Technical efficiency across agro-ecological zones in Ethiopia: The impact of poverty and asset endowment. Agric. J. 2009, 4, 202–207. [Google Scholar]
  31. Gebregziabher, G.; Namara, R.E.; Holden, S. Technical Efficiency of Irrigated and Rain-Fed Smallholder Agriculture in Tigray, Ethiopia: A Comparative Stochastic Frontier Production Function Analysis. Q. J. Int. Agric. 2012, 51, 203–226. [Google Scholar]
  32. Alene, A.D.; Zeller, M. Technology adoption and farmer efficiency in multiple crops production in eastern Ethiopia: A comparison of parametric and non-parametric distance functions. Agric. Econ. Rev. 2005, 6, 5–17. [Google Scholar]
  33. Furesi, R.; Madau, F.A.; Pulina, P. Technical efficiency in the sheep dairy industry: An application on the Sardinian (Italy) sector. Agric. Food Econ. 2013, 1, 1–11. [Google Scholar] [CrossRef] [Green Version]
  34. Alene, A.D.; Manyong, V.M.; Gockowski, J. The production efficiency of intercropping annual and perennial crops in southern Ethiopia: A comparison of distance functions and production frontiers. Agric. Syst. 2006, 91, 51–70. [Google Scholar] [CrossRef]
  35. Sheahan, M.; Barrett, C.B. Ten striking facts about agricultural input use in Sub-Saharan Africa. Food Policy. 2017, 67, 12–25. [Google Scholar] [CrossRef] [PubMed] [Green Version]
  36. Bellemare, M.F.; Wichman, C.J. Elasticities and the Inverse Hyperbolic Sine Transformation. Oxf. Bull. Econ. Stat. 2020, 82, 50–61. [Google Scholar] [CrossRef]
  37. Battese, G.E. A Note on the Estimation of Cobb-Douglas Production Functions When Some Explanatory Variables have Zero Values. J. Agric. Econ. 1997, 48, 250–252. [Google Scholar] [CrossRef]
  38. Battese, G.E.; Malik, S.J.; Gill, M.A. An Investigation of Technical Inefficiencies of Production of Wheat Farmers in Four Districts Of Pakistan. J. Agric. Econ. 1996, 47, 37–49. [Google Scholar] [CrossRef]
  39. Chavas, J.-P.; Petrie, R.; Roth, M. Farm Household Production Efficiency: Evidence from the Gambia. Am. J. Agric. Econ. 2005, 87, 160–179. [Google Scholar] [CrossRef] [Green Version]
  40. Adom, P.K.; Adams, S. Decomposition of technical efficiency in agricultural production in Africa into transient and persistent technical efficiency under heterogeneous technologies. World Dev. 2020, 129, 104907. [Google Scholar] [CrossRef]
  41. Okeno, T.O.; Kahi, A.K.; Peters, K.J. Breed selection practices and traits of economic importance for indigenous chicken in Kenya. Livest. Res. Rural Dev. 2011, 23, 209. [Google Scholar]
  42. Cheng, H.W. Breeding of tomorrow’s chickens to improve well-being. Poult. Sci. 2010, 89, 805–813. [Google Scholar] [CrossRef]
  43. Muchadeyi, F.C.; Wollny, C.B.A.; Eding, H.; Weigend, S.; Simianer, H. Choice of breeding stock, preference of production traitsand culling criteria of village chickens among Zimbabweagro-ecological zones. Trop. Anim. Health Prod. 2009, 41, 403–412. [Google Scholar] [CrossRef]
  44. Ogundari, K. The Paradigm of Agricultural Efficiency and its Implication on Food Security in Africa: What Does Meta-analysis Reveal? World Dev. 2014, 64, 690–702. [Google Scholar] [CrossRef]
  45. Theodoridis, A.M.; Anwar, M.M. A Comparison Of DEA And SFA Methods: A Case Study of Farm Households in Bangladesh. J. Dev. Areas. 2011, 45, 95–110. [Google Scholar] [CrossRef]
  46. Mango, N.; Makate, C.; Hanyani-Mlambo, B.; Siziba, S.; Lundy, M. A stochastic frontier analysis of technical efficiency in smallholder maize production in Zimbabwe: The post-fast-track land reform outlook. Cogent Econ. Financ. 2015, 3, 1117189. [Google Scholar] [CrossRef] [Green Version]
  47. Melesse, A. Significance of scavenging chicken production in the rural community of Africa for enhanced food security. World Poult. Sci. J. 2014, 70, 593–606. [Google Scholar] [CrossRef]
  48. Jabbar, M.A.; Ehui, S.K.; Kaufmann, R.V. Supply and Demand for Livestock Credit inSub-Saharan Africa: Lessons for Designing New Credit Schemes. World Dev. 2002, 30, 1029–1042. [Google Scholar] [CrossRef]
  49. Theriault, V.; Serra, R. Institutional Environment and Technical Efficiency: A Stochastic Frontier Analysis of Cotton Producers in West Africa. J. Agric. Econ. 2014, 65, 383–405. [Google Scholar] [CrossRef] [Green Version]
  50. Martey, E.; Wiredu, A.N.; Etwire, P.M.; Kuwornu, J.K. The impact of credit on the technical efficiency of maize-producing households in Northern Ghan. Agric. Financ. Rev. 2019, 79, 304–322. [Google Scholar] [CrossRef] [Green Version]
  51. Sharif, A.; Ahmad, T. Preventing Vaccine Failure in Poultry Flocks. In Vaccine Adjuvant Delivery System and Strategies; Wang, N., Ed.; IntechOpen: London, UK, 2018. [Google Scholar]
  52. Rabirou, K.; Ayanwale, A.B.; Idowu, E.O.; Williams, S.B. Effect of rural transportation system on agricultural productivity in Oyo State, Nigeria. J. Agric. Rural Dev. Trop. Subtrop. 2012, 113, 13–19. [Google Scholar]
  53. Oleke, J.M.; Isinika, A.C. Assessing the technical efficiency of commercial egg production in Tanzania for improved livelihoods. J. Dev. Agric. Econ. 2011, 3, 343–352. [Google Scholar]
  54. Bezemer, D.; Balcombe, K.; Davis, J.; Fraser, I. Livelihoods and farm efficiency in rural Georgia. Appl. Econ. 2005, 35, 1737–1745. [Google Scholar] [CrossRef]
  55. Berkhouta, E.D.; Schipper, R.A.; Kuyvenhoven, A.; Coulibaly, O. Does heterogeneity in goals and preferences affect efficiency? A case study of farm households in northern Nigeria. Agric. Econ. 2010, 41, 265–273. [Google Scholar]
  56. Awoyinka, Y.A.; Akinwumi, J.A.; Okoruwa, V.O.; Oni, O.A. Effects of Livelihood Strategies and Sustainable Land Management Practices on Food Crop Production Efficiency in South-West Nigeria. Agric. J. 2009, 4, 135–143. [Google Scholar]
  57. Ahmed, M.H.; Melesse, K.A. Impact of off-farm activities on technical efficiency: Evidence from maize producers of eastern Ethiopia. Agric. Food Econ. 2018, 6, 1–15. [Google Scholar] [CrossRef] [Green Version]
  58. Bagnol, B. Gender issues in small-scale family poultry production: Experiences with Newcastle Disease and Highly Pathogenic Avian Influenza Control. World Poult. Sci. J. 2009, 65, 231–240. [Google Scholar] [CrossRef]
  59. Gueye, E.H.F. Women and family poultry production in rural Africa. Dev. Pract. 2000, 10, 98–102. [Google Scholar] [CrossRef] [PubMed]
  60. Johnson, N.L.; Kovarik, C.; Meinzen-Dick, R.; Njuki, J.; Quisumbing, A. Gender, Assets, and Agricultural Development: Lessons from Eight Projects. World Dev. 2016, 83, 295–311. [Google Scholar] [CrossRef] [Green Version]
  61. Seymour, G. Women’s empowerment in agriculture: Implications for technical efficiency in rural Bangladesh. Agric. Econ. 2017, 48, 513–522. [Google Scholar] [CrossRef]
  62. Townsend, R.; Kirsten, J.; Vink, N. Farm size, productivity and returns to scale in agriculture revisited: A case study of wine producers in South Africa. Agric. Econ. 1998, 19, 175–180. [Google Scholar] [CrossRef]
  63. Hadley, D. Patterns in Technical Efficiency andTechnical Change at the Farm-level in England and Wales, 1982–2002. J. Agric. Econ. 2006, 57, 81–100. [Google Scholar] [CrossRef]
  64. Halkos, G.E.; Tzeremes, N.G. Productivity efficiency and firm size: An empirical analysis of foreign owned companies. Int. Bus. Rev. 2007, 16, 713–731. [Google Scholar] [CrossRef]
  65. Alvarez, A.; Arias, C. Technical efficiency and farm size: A conditional analysis. Agric. Econ. 2004, 30, 241–250. [Google Scholar] [CrossRef]
  66. Alvarez, A.; Arias, C. Diseconomies of Size with Fixed Managerial Ability. Am. J. Agric. Econ. 2003, 85, 134–142. [Google Scholar] [CrossRef]
  67. Hazell, P. Transformations in agriculture and their implications for rural development. J. Agric. Dev. Econ. 2007, 4, 47–65. [Google Scholar]
  68. Lowe, P.; Phillipson, J.; Proctor, A.; Gkartzios, M. Expertise in rural development: A conceptual and empirical analysis. World Dev. 2019, 116, 28–37. [Google Scholar] [CrossRef]
Figure 1. Entry points to transform traditional village chicken production.
Sustainability 13 08539 g001
Figure 2. Households’ egg and chicken consumption by quantile efficiency.
Sustainability 13 08539 g002
Table 1. Summary of inputs and outputs used in the stochastic frontier model.
Input/OutputEthiopiaNigeriaTanzaniaOverall
Mean (± SD)Mean (± SD)Mean (± SD)Mean (± SD)
Income (USD)18.1 (±25.3)44.9 (±42.2)52.8 (±61.2)39.5 (±48.5)
Number of Local Hen2.8 (±2.3)6.3 (±4.2)6.2 (±4.8)5.2 (±4.3)
Feed (USD)14.9 (±12.8)15.9 (±18.1)17.5 (±22.3)16.2 (±18.4)
Vaccination/
Disease Treatment (USD)
0.3 (±0.8)1.7 (±4.7)3.7 (±5.6)2.0 (±4.5)
Family Labor (H)77.7 (±251.7)34.9 (±88.1)60.2 (±199.6)57.3 (±191.7)
Land Holding (Ha)1.3 (±2.3)1.3 (±4.9)2.5 (±4.1)1.7 (±4.0)
Capital (Yearly Income-USD)540.6 (±2141.0)432.2 (±1138.4)474.1 (±1611.6)480.8 (±1667.0)
SD: Standard deviation; USD: United States dollar; H: Hours; Ha: Hectare.
Table 2. Descriptive summary of continuous explanatory variables used in the stochastic frontier analysis model.
VariablesEthiopiaNigeriaTanzaniaTotalChi. Sq Test
Mean (± SD)Mean (± SD)Mean (± SD)Mean (± SD)
Length Kept13.08 (± 10.54)16.70 (±12.14)8.55 (±7.80)12.63 (±10.79)345.7 ***
Head Education2.79 (±3.56)6.92 (±5.97)6.71 (±3.33)5.58 (±4.81)472.1 ***
Trainings0.11 (±0.39)0.03 (±0.27)0.23 (±0.61)0.13 (±0.46)143.6 ***
Adult Equivalent4.77 (±2.22)6.00 (±4.37)4.49 (±2.67)5.07 (±3.29)48.412 ***
Housing Index0.23 (±0.18)0.31 (±0.22)0.30 (±0.24)0.28 (±0.22)69.8 ***
Distance to Road2.75 (±3.53)2.21 (±3.62)1.30 (±2.08)2.05 (±3.18)171.5 ***
Women Empowerment Index0.44 (±0.18)0.48 (±0.17)0.56 (±0.12)0.49 (±0.16)135.7 ***
Income Sources1.63 (±0.82)1.54 (±0.69)1.30 (±0.59)1.48 (±0.71)125.0 ***
Flock size8.03 (±0.7.03)26.45 (±16.5425.04 (±16.05)20.27 (±16.58)1114.2 ***
Inference: *** p < 0.01; SD: Standard deviation.
Table 3. Descriptive summary of categorical variables used in the stochastic frontier analysis model.
IndicatorsEthiopia (%)Nigeria (%)Tanzania (%)Overall (%)Pearson Chi2
NoYesNoYesNoYesNoYes
Culling45.754.351.448.646.353.747.852.27.8 ***
Breed Selection17.782.359.340.740.359.739.660.4349.2 ***
Health Access27.672.472.227.825.174.941.458.6585.0 ***
Credit Access82.617.491.18.9841685.914.134.0 ***
Livelihood Contributions55.344.754.245.837.862.248.651.480.0 ***
ManagementNone1.8121.95.2449.7 ***
Either68.969.341.459.1
Both29.318.756.735.7
GenderMale80.97379.777.8
Female19.12720.322.220.7 ***
Inference: *** p < 0.01.
Table 4. Estimated parameters in the stochastic production function.
Frontier VariablesPooledEthiopiaNigeriaTanzania
Coef.Coef.Coef.Coef.
Constant2.999 ***2.974 ***3.486 ***−0.315
(0.255)(0.418)(0.402)(0.785)
Feed0.0413 *0.00536−0.01520.115 ***
(0.0249)(0.0635)(0.0437)(0.0332)
Number of Local Hens0.264 ***0.509 ***0.286 ***0.238 ***
(0.0306)(0.0673)(0.0486)(0.0468)
Vaccination/Disease Treatment0.153 ***0.462 **0.06610.155 ***
(0.0347)(0.228)(0.0571)(0.0467)
Family Labor0.0482 ***0.02000.02510.0914 ***
(0.0148)(0.0323)(0.0248)(0.0234)
Land Holding0.0262 *−0.009670.008220.0764 ***
(0.0141)(0.0426)(0.0178)(0.0253)
Capital0.01610.01550.02060.0144
(0.0166)(0.0405)(0.0263)(0.0243)
D_FDB0.06790.655 ***0.0659−0.0959
(0.0889)(0.223)(0.143)(0.141)
D_LHB−0.227 *−0.452 ***−0.133−0.422
(0.127)(0.159)(0.300)(0.337)
D_VTB−0.0316−0.2340.100−0.0463
(0.0585)(0.147)(0.0933)(0.0919)
D_FLB0.3540.5450.1854.049 ***
(0.222)(0.363)(0.279)(0.699)
D_LDB0.0154−0.2070.0719−0.0407
(0.0468)(0.130)(0.0563)(0.0970)
D_KPB0.1340.1470.06490.115
(0.103)(0.249)(0.166)(0.148)
Usigma (Cons.)1.228 ***0.807 ***1.740 ***1.438 ***
(0.102)(0.0941)(0.327)(0.258)
Vsigma (Cons.)−1.309 ***−1.763 ***−1.432 ***−1.165 ***
(0.0776)(0.317)(0.115)(0.105)
Sigma_U1.848 ***1.497 ***2.386 ***2.0525 ***
(0.00943)(0.0704)(0.3907)(0.2647)
Sigma_V0.519 ***0.4141 ***0.4887 ***0.5584 ***
(0.0201)(0.06555)(0.0281)(0.0294)
Lambda3.556 ***3.615 ***4.882 ***3.675 ***
(0.0938)(0.1030)(0.3848)(0.2611)
Nigeria0.386 ***
(0.0592)
Tanzania0.380 ***
(0.0590)
Inference: *** p < 0.01; ** p < 0.05; * p < 0.10. D_FDB: Dummy for Feed; D_LHB: Dummy for Local Hen; D_VTB: Dummy for Vaccination and Treatment; D_FLB: Dummy for Labor; D_LDB: Dummy for Land; D_KPB: Dummy for Capital.
Table 5. Estimated technical efficiency (TE) by quantile flock size in the three countries.
CountryTE (Pooled)TE (Country Specific)
MeanMin.Max.MeanMin.Max.
Ethiopia0.2850.0160.8500.2210.0070.835
Nigeria0.4360.0090.8600.4810.0120.887
Tanzania0.4130.0110.8660.4540.0130.859
Overall0.3810.0090.867
Table 6. Stochastic frontier analysis results on determinants of technical inefficiency.
VariablesCoefficients (S.e.)Marginal Effect (S.e.)
PLETNGTZPLETNGTZ
Breed Selection−0.57 ***−0.54 ***−1.81 **−0.77 **−0.18−0.36−0.30−0.18
(−0.16)(−0.18)(−0.79)(−0.39)(0.00)(0.00)(0.00)(0.00)
Culling−0.48 ***−0.42 ***0.20−0.75 *−0.15−0.280.03−0.18
(−0.15)(−0.15)(−0.48)(−0.41)(0.00)(0.00)(0.00)(0.00)
Length Kept−0.04 ***−0.02 ***−0.05 **−0.05 *−0.01−0.01−0.01−0.01
(−0.01)(−0.01)(−0.02)(−0.02)(0.00)(0.00)(0.00)(0.00)
Trainings−0.45 **−0.130.58−1.01 *−0.15−0.080.10−0.24
(−0.21)(−0.18)(−0.84)(−0.53)(0.00)(0.00)(0.00)(0.00)
Credit Access−0.46 **−0.54 ***−1.59−0.28−0.15−0.36−0.27−0.07
(−0.21)(−0.19)(−1.10)(−0.49)(0.00)(0.00)(0.00)(0.00)
Health Access0.42 ***−0.030.010.420.14−0.020.000.10
(−0.15)(−0.150(−0.560(−0.39)(0.00)(0.00)(0.00)(0.00)
Housing Index−0.57 *−1.44 ***1.49−0.43−0.18−0.960.25−0.10
(−0.33)(−0.42)−1.12−0.750.000.000.000.00
Management: Either−0.18−0.05(−1.09)(−0.71)(−0.06)(−0.04)(−0.18)(−0.170
(−0.30)(−0.45)(−0.69)(−0.97)(0.00)(0.00)(0.00)(0.00)
Management: Both−0.40−0.14−0.97−1.11−0.13−0.09−0.16−0.26
(−0.32)(−0.46)(−0.83)(−1.01)(0.00)(0.00)(0.00)(0.000
Distance to Road0.12 ***0.10 ***0.14 *−0.150.040.070.02−0.03
(−0.02)(−0.02)(−0.07)(−0.11)(0.00)(0.00)(0.00)(0.00)
Head Education0.00−0.030.09 *−0.0)0.00−0.020.02−0.01
(−0.02)(−0.02)(−0.05)(−0.05)(0.00)(0.00)(0.00)(0.000
Adult Equivalent−0.07 ***0.01−0.20 **−0.10−0.020.01−0.03−0.02
(−0.03)(−0.03)(−0.09)(−0.07)(0.00)(0.00)(0.00)(0.00)
Livelihood Contribution−0.29 **−0.15−0.43−0.51−0.09−0.10−0.07−0.12
(−0.14)(−0.14)(−0.48)(−0.35)(0.00)(0.00)(0.00)(0.00)
Income Sources−0.25 **−0.19 **−0.07−0.55−0.08−0.13−0.01−0.13
(−0.11)(−0.10)(−0.36)(−0.40)(0.00)(0.00)(0.00)(0.00)
Gender: Female0.31 *0.040.31.11 **0.100.030.050.26
(−0.16)(−0.17)(−0.53)(−0.46)(0.00)(0.00)(0.00)(0.00)
Women Emp. Index−0.75 *−0.44−0.61−2.23−0.24−0.29−0.10−0.53
(−0.43)(−0.39)(−1.45)(−1.62)(0.00)(0.00)(0.00)(−0.01)
Flock Size: Q2−0.76 ***−0.27 *−1.76 **−1.05 **−0.24−0.18−0.29−0.25
(−0.17)(−0.15)(−0.73)(−0.47)(0.00)(0.00)(0.00)(0.00)
Flock Size: Q3−2.23 ***−0.48 *−4.16 ***−3.03 ***−0.72−0.32−0.70−0.72
(−0.26)(−0.25)(−1.26)(−0.78)(−0.01)(0.00)(−0.01)(−0.01)
Flock Size: Q4−4.05 ***0.50−7.30 ***−5.55 ***−1.300.34−1.24−1.32
(−0.46)(−0.48)(−2.25)(−1.40)(−0.01)(0.00)(−0.01)(−0.02)
Inference: *** p < 0.01; ** p < 0.05; * p < 0.10; ET: Ethiopia; TZ: Tanzania; NG: Nigeria; PL: Pooled; S.e.: Standard error.
Publisher’s Note: MDPI stays neutral with regard to jurisdictional claims in published maps and institutional affiliations.

