Article

Prediction Models of Barite Crystallization and Inhibition Kinetics: Applications for Oil and Gas Industry

Department of Civil & Environmental Engineering, Rice University, Houston, TX 77005, USA
*
Authors to whom correspondence should be addressed.
Equal Contribution.
Sustainability 2021, 13(15), 8533; https://doi.org/10.3390/su13158533
Submission received: 19 June 2021 / Revised: 21 July 2021 / Accepted: 22 July 2021 / Published: 30 July 2021

Abstract

:
Barite is one of the most common mineral scales in the oilfield and its formation can sequester toxic strontium (Sr) and radium (Ra). Various scale inhibitors are widely used to inhibit its formation. The inhibition efficiencies of 18 common inhibitors were tested using an improved kinetic turbidity method over broad oil and gas production conditions. A theoretical and a semi-empirical barite crystallization and inhibition model were developed for the 18 most used scale inhibitors. Both models can work under a broad range of production conditions and are carefully reviewed against all available experimental data. These models have shown wide applications in industrial operations, field testing, and laboratory testing. Using the new models and testing method, a novel fast inhibitor performance testing method was proposed and validated. Furthermore, the barite crystallization and inhibition models also work well to predict the inhibition performance of mixed inhibitors. This study not only advanced barite scale inhibition in an efficiency and low-cost way during oil and gas production, but also provided new insights on understanding the fate and transport of toxic Sr and Ra.

1. Introduction

During oil and gas production, various mineral scales (e.g., sulfate, carbonate, and sulfide scales) can be formed in the pipelines [1,2,3,4,5]. The formation of mineral scales can plug the pipelines and decrease production efficiency. Barite is one of the most common scales in the oilfield with low solubility (Ksp = 10−9.97 at 25 °C) and is usually formed through the mixing of water containing high barium (Ba2+) with other water containing high sulfate (SO42−) (e.g., seawater or brackish water) [6,7]. The incorporation of toxic Sr and radioactive Ra with the formation of barite, which could be a great environmental threaten, is also very commonly found. Barite scale is hard to be dissolved in acids and it can be expensive to be removed through mechanics approaches [8,9]. Therefore, it is essential to inhibit barite scale formation before it forms [10,11,12,13]. There are two major types of scale inhibitors to treat barite scale, being small molecule phosphonate and polymer inhibitors [10,11,12,13]. Phosphonate inhibitors (e.g., diethylenetriamine-penta (methylene phosphonic) acid, DTPMP) have been widely used in the oil and gas industry and can be easily detected. Polymer inhibitors with possibly higher costs, including polycarboxylates (e.g., phosphinopoly (carboxylic acid), PPCA) and polysulfonates/polycarboxylates (e.g., polyvinyl sulfonate (PVS)) inhibitors, may have better thermal stability and calcium (Ca2+) tolerance. The mixture of two or more inhibitors with better performance have also been used to inhibit barite scales [14].
To better control scale with minimum cost and highest efficiency, it is crucial to develop reliable and efficient testing protocols and prediction models to estimate the minimum inhibitor concentration (MIC) to be applied in the oilfield. There are two major types of barite inhibition testing methods in the oil and gas industry: the dynamic loop test and kinetic turbidity test methods [15,16,17,18,19]. In the dynamic loop test, the inhibition efficiency is evaluated based on the blockage of flow loop, which could be detected by measuring the changes of ion concentrations or pressure [16,17,18,19]. The dynamic loop test method simulates the fluid flow system in the oil and gas production, however it is both time and cost consuming. In the kinetic turbidity test, the inhibition efficiency is evaluated by monitoring the solution turbidity changes during the reaction, which can be detected by a turbidimeter or a laser apparatus, even by eye observation [10,13]. The eye observation is a fast-screening method but may not be sensitive enough and is labor intensive. The turbidity measurements by turbidimeter limit the solution volume and temperature ranges. The turbidity measurement by laser apparatus is more reliable and sensitive and allows the inhibition tests over a broad temperature range up to 250 °C. Lu et al. showed that for barite scale formation and inhibition, the time it takes to observe detectable solids deposition in the reaction tubing is comparable with the induction time measured in bulk testing, for example, at barite SI of 0.90 at 70 °C and barite SI of 0.50 at 120 °C [15,19].
Based on the results from inhibition experiments, barite inhibition prediction models have been developed over broad ranges of production conditions [10,20,21,22]. Barite scale formation starts from barite nuclei or pre-nucleation clusters through nucleation processes, then grows larger through surface growth, aggregation, and/or recrystallization processes [23]. Nucleation increases the number of barite nuclei and crystal growth increases the sizes of barite nuclei, thereby the total volume/mass of barite scales increases with time [23]. The time period from the beginning of forming supersaturation solution to the point that the volume/mass of barite scales are large enough to be observed is referred to as induction time (t0). Previous studies showed that the inhibitors could prolong the induction time (tinh) of barite scale formation through adsorbing or precipitating onto barite nuclei (or pre-nucleation clusters) and crystal surface. He et al. proposed a semi-empirical equation to predict the induction time without (t0) and with inhibitors (tinh). A semi-empirical model was developed based on various field conditions (e.g., pH, SI, temperature, and ion ratio) and experimental observations [10]. Recently, Dai et al. developed a theoretical model to predict the induction time without (t0) and with inhibitors (tinh) based on classic nucleation theory (CNT) and regular solution theory [20,21,22]. Both of these two prediction models could predict the minimum inhibitor concentration (MIC) needed to inhibit barite scales for a certain protection time based on the brine chemistry and production conditions (e.g., temperature). However, to the best of our knowledge, there are no studies to unify these models by including all available data over a broad range of oil and gas production conditions.
To fill these information gaps, for the first time, this study summarized all available barite inhibition experimental data with 18 commonly used scale inhibitors and models over 20 years and further advanced and unified the prediction models. The 18 inhibitors used in this study are commercially used scale inhibitors and provided by companies. The kinetic turbidity test method with laser apparatus was mainly used and discussed in this study. The advances of barite nucleation and inhibition models were mainly in extending the applicable temperature ranges, including more common inhibitors and gaining the mechanistic understanding of barite scale inhibition. Besides, a quick approach to evaluate any new inhibitor was proposed. Furthermore, the application and values of the prediction models of this study were discussed from the aspects of field case studies, generic chemicals, and mixed inhibitors.

2. Experimental and Model Section

2.1. Kinetic Turbidity Test Method with Laser Apparatus

Barite inhibition experiments were conducted mainly using two approaches: kinetic turbidity test and dynamic scale loop methods. Kinetic turbidity measurement with laser apparatus has been proved to be an efficient, sensitive, and low-cost approach to study the kinetics of barite scales in the absence and presence of inhibitors. Kinetic turbidity test method has been initially developed by Brine Chemistry Consortium at Rice University and modified with improved measurement efficiency and accuracy recently [13]. The aluminum block was placed on the hot plate with stirrer (MR Hei-Tec) to control the temperature and mix the samples separately. Three samples can be put in the separate holes of aluminum block in parallel to allow three measurements at once. The laser light passed through the holes of the aluminum block, and the laser signals transmitted through the sample solution were detected by the Si photodiode. The intensity of the laser signal was recorded as the current in milliamps (mA) measured by the multimeter connected with Si photodiode at desired time interval (e.g., 1 s). If barite nucleation and growth happen, a significant and consistent change in laser signal could be observed. The time at this point is recorded as the induction time in the absence of inhibitors (t0) and presence of inhibitors (tinh). Using this apparatus, the testing temperature of experiments in this study varied from 4–250 °C, and the time duration was from 10 s to 1 day.
The solution of barite crystallization and inhibition experiments were prepared by mixing cationic and anionic solutions. The cationic solution contains 1 M sodium chloride (NaCl), 25 mM or 100 mM calcium chloride dihydrate (CaCl2·2H2O), 7 mM piperazine-N, N’-bis (2-ethanesulfonic) acid (PIPES) buffer, and desired amount of barium chloride dihydrate (BaCl2·2H2O). The anionic solution contains 1 M NaCl, 25 mM or 100 mM CaCl2·2H2O, 7 mM PIPES, and desired amount of sodium sulfate anhydrous (Na2SO4). Small volume of inhibitors (<500 µL) was added from 100 or 200 ppm inhibitor stock solutions to anionic solution to avoid the interactions of inhibitors with cationic solution. Before each measurement, cationic and anionic solution with the volume of 7 mL was preheated individually in the holes of aluminum block for 10 min. After preheating, cationic, and anionic solutions with and without inhibitors were mixed and reactions started immediately.
In this study, 18 common inhibitors with three major types were investigated: (1) aminophosphonates: bis-hexamethylene triamine-penta (methylene phosphonic) acid (BHPMP), diethylenetriamine-penta (methylene phosphonic) acid (DTPMP), hexamethylenedisminetetra (methylene phosphonic) acid (HDTMP), mitrolotri (methylene phosphonic) acid (NTMP), 1-hydroxyethylidene-1, 1-diphosphonic acid (HEDP), ethylenediamine tetra (methylene phosphonic) acid (EDTMP), hydroxyethyl amino bis (methylene phosphonic) acid (HEBMP), 2-phosphono 1,2,4-butane tricarboxylic acid (PBTC), phosphonated amino acid (PhnAA), polyamino polyesther methylene phosphonic acid (PAPEMP), and triethanolamine phosphate ester (PE); (2) polycarboxylates: phosphinopoly (carboxylic acid) (PPCA), carboxymethylinulin 25% substituted (CMI25), phosphorous incorporated maleic acid polymer (MAC), polyaspartatic acid (PASP); and (3) polysulfonates/polycarboxylates: polyvinyl sulfonate (PVS), sulfonated polycarboxylic acid (SPCA), and sulfonated polyacrylic acid copolymer (AA/AMPS). The detailed information about these inhibitors (i.e., type, molecular weight, and number of functional groups) was described in Supplementary Materials.

2.2. Barite Crystallization and Inhibition Theoretical Model

Based on classical nucleation theory (CNT), a theoretical crystallization and inhibition model (Equation (1)) was recently proposed by considering two crystallization phases (i.e., nucleation and crystal growth) to predict the kinetics of barite crystallization and inhibition [20,21,22].
t 0 = ( 3 2 π ) 1 4 ( V m 5 3 A v 8 3 D 4 C eq ) 1 4 ( 10 SI 2 ( 10 SI 2 1 ) 2 ) 1 4 exp ( β V m 2 δ 3 A v 4 ( RT ) 3 ( 2.303 SI ) 2 +   β V m 4 3 δ 2 A v 2 3 4 ( RT ) 2 ( 2.303 SI ) )
where, R is ideal gas constant, 8.31 J K−1 mol−1; T is temperature, K; SI is the saturation index; Vm is molar volume, m3/mol; δ is superficial interfacial energy, mJ/m2; Av is Avogadro constant, 6.02 × 10²³ mL−1; D is effective diffusion coefficient, m2s−1; Ceq is equilibrium concentration of the lattice ions, mol/L; β and β′ are shape factors, 16π/3 and π, respectively. The values of Vm, δ, and D were fitted by more than over 200 experimental data in the broad range of 4–250 °C and SI = 0.4–2.8 in our previous study. Previous studies have demonstrated that the added inhibitors can slow down the nucleation and growth processes by adsorbing on barite pre-nuclei or nuclei [24,25,26]. Our previous models proposed that [24,25,26] the Gibbs free energy (ΔG_new, Ksp_new, SI_new, Ceq_new) and molar volume (Vm) of barite could be impacted by adding inhibitors. The prolonged induction time in the presence of inhibitors (tinh) can be calculated from below Equations (2)–(7):
r = [ Inh ] / ( [ Ba 2 + ] [ SO 4 2 ] ) 1 2
Δ G _ new = Δ G   ( 1 + ra G )
K sp _ new = K sp   ( 1 + ra G )
SI _ new = SI + rlgC inh lgK sp ( ra G )
  C eq _ new = ( K sp _ new C inh ) 1 2  
  V m _ new = V m ( 1 + ra V )
where, Cinh is the inhibitor concentration, ppm; r is the ratio of inhibitor over the lattice ion, r = Cinh/([Ba2+][SO42−])1/2; [Ba2+] and [SO42−] are the ion concentrations; ΔG_new is the new Gibb free energy by considering the effects of inhibitors; Ksp_new is the solubility constant of barite in the presence of inhibitors. The values of av and aG for each inhibitor can be fitted using the barite inhibition testing results.

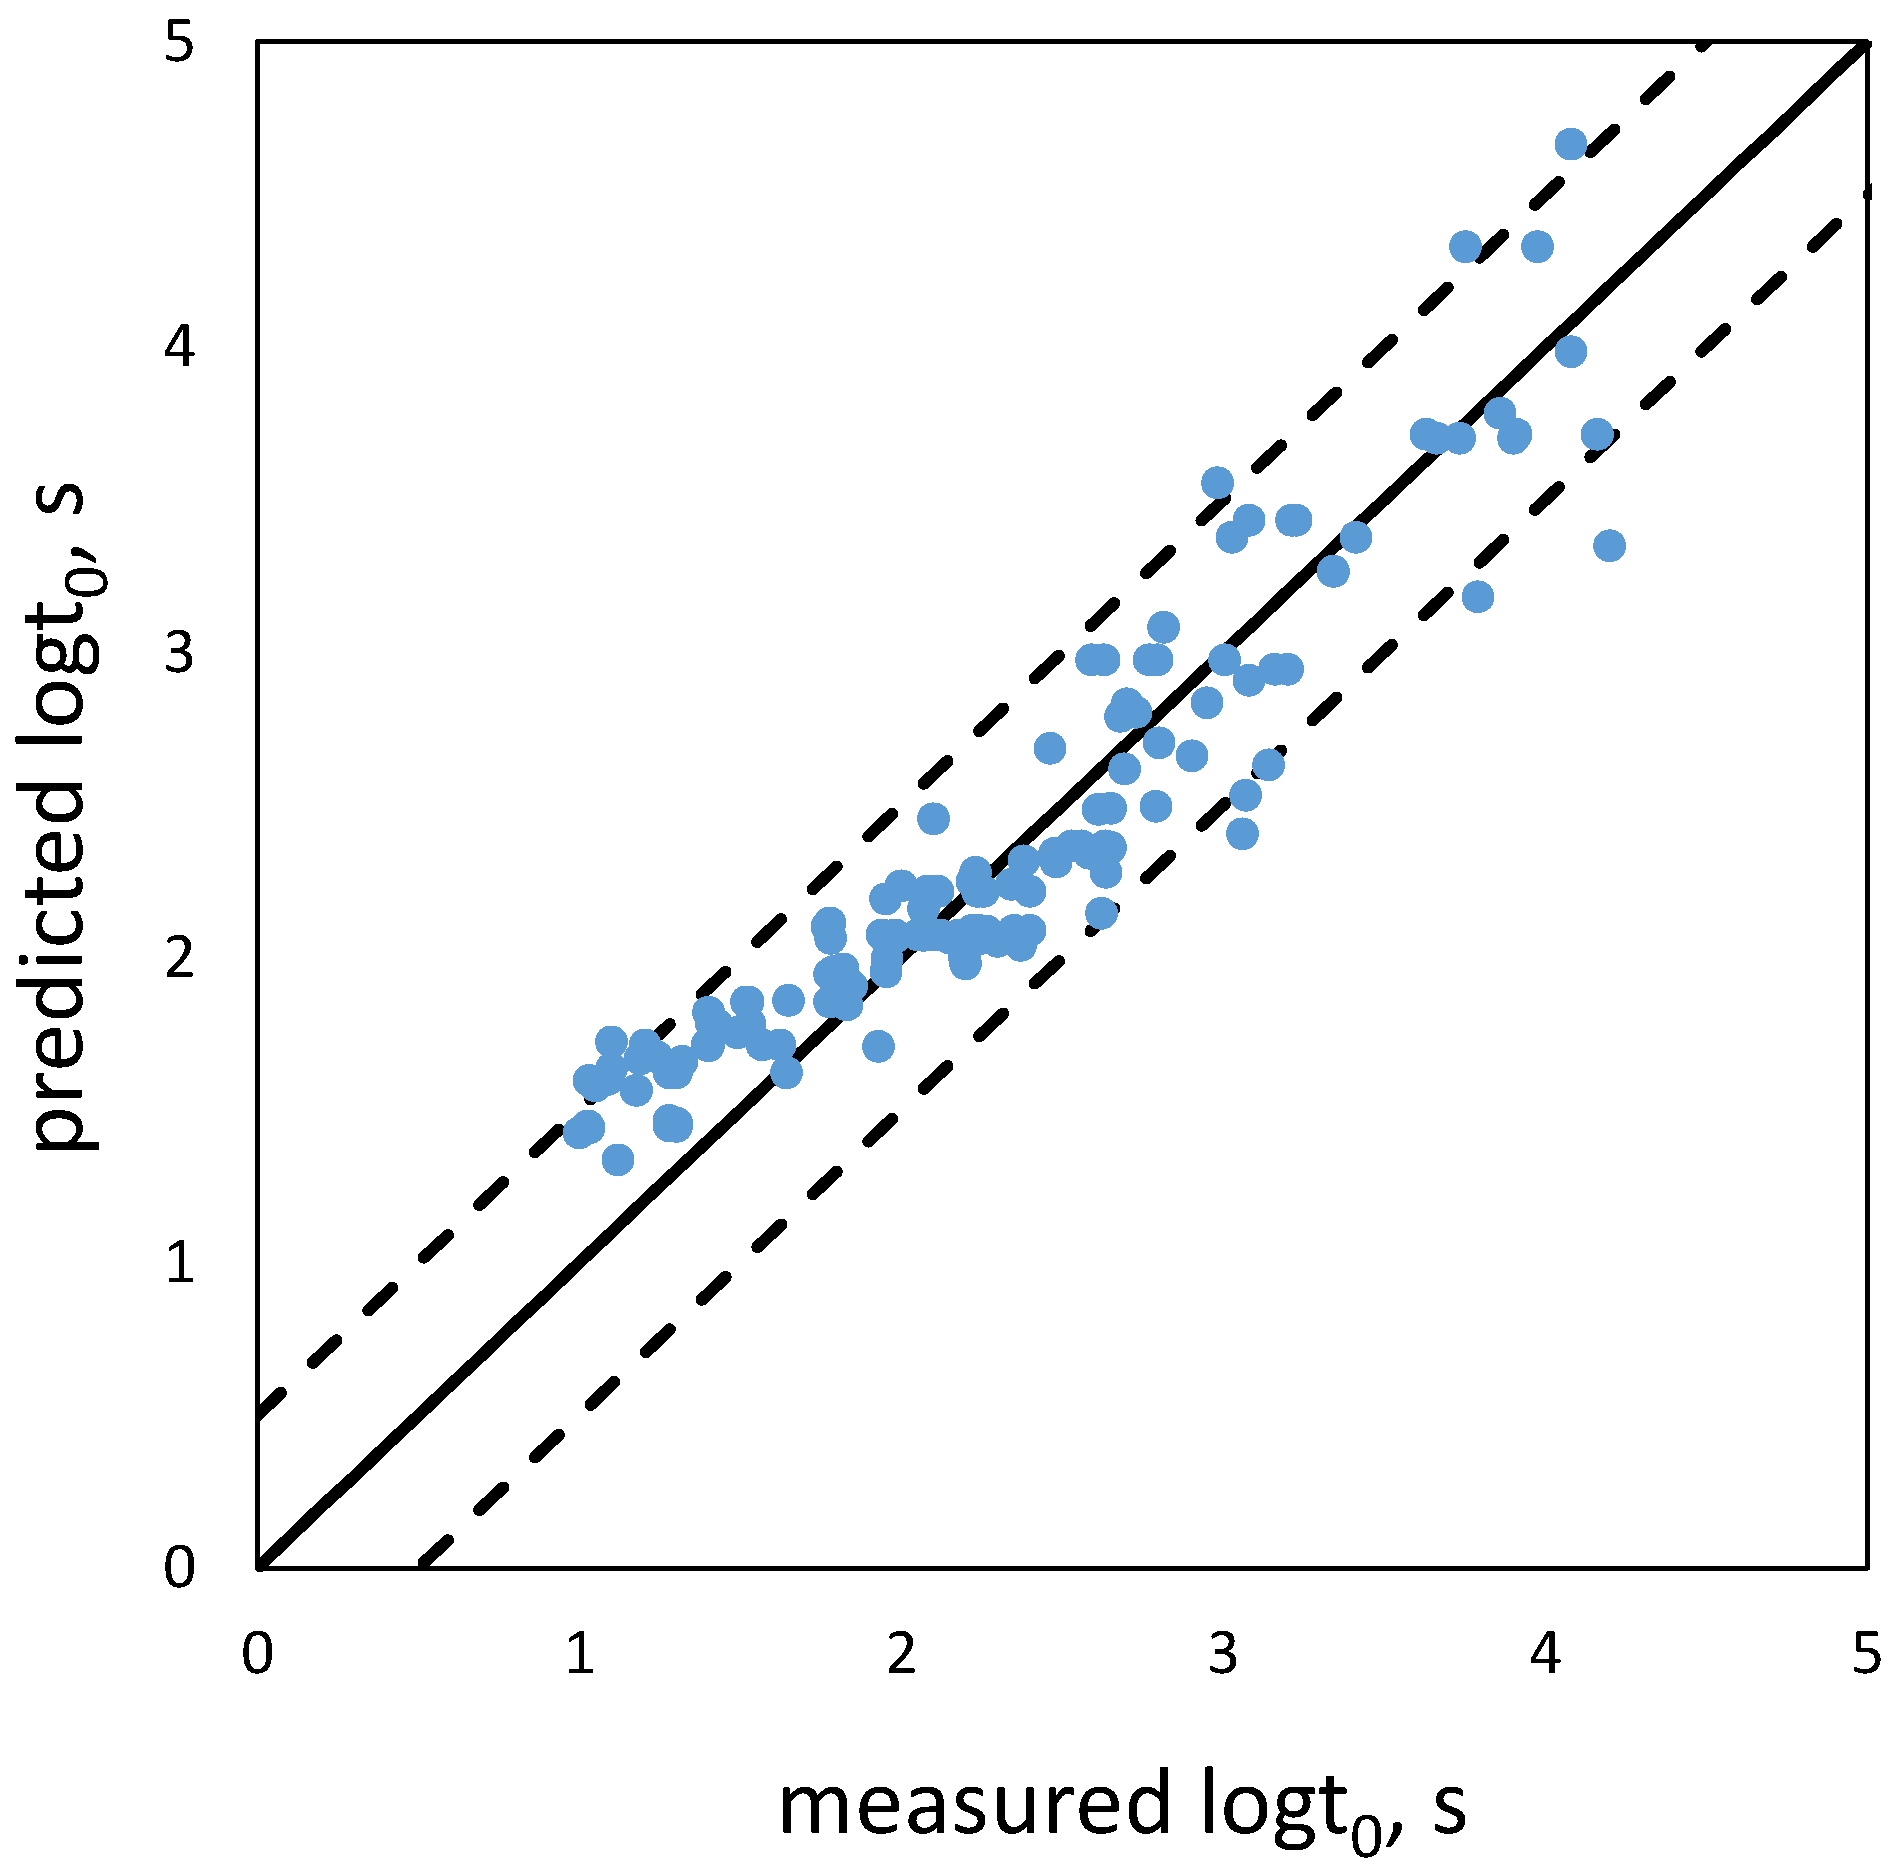
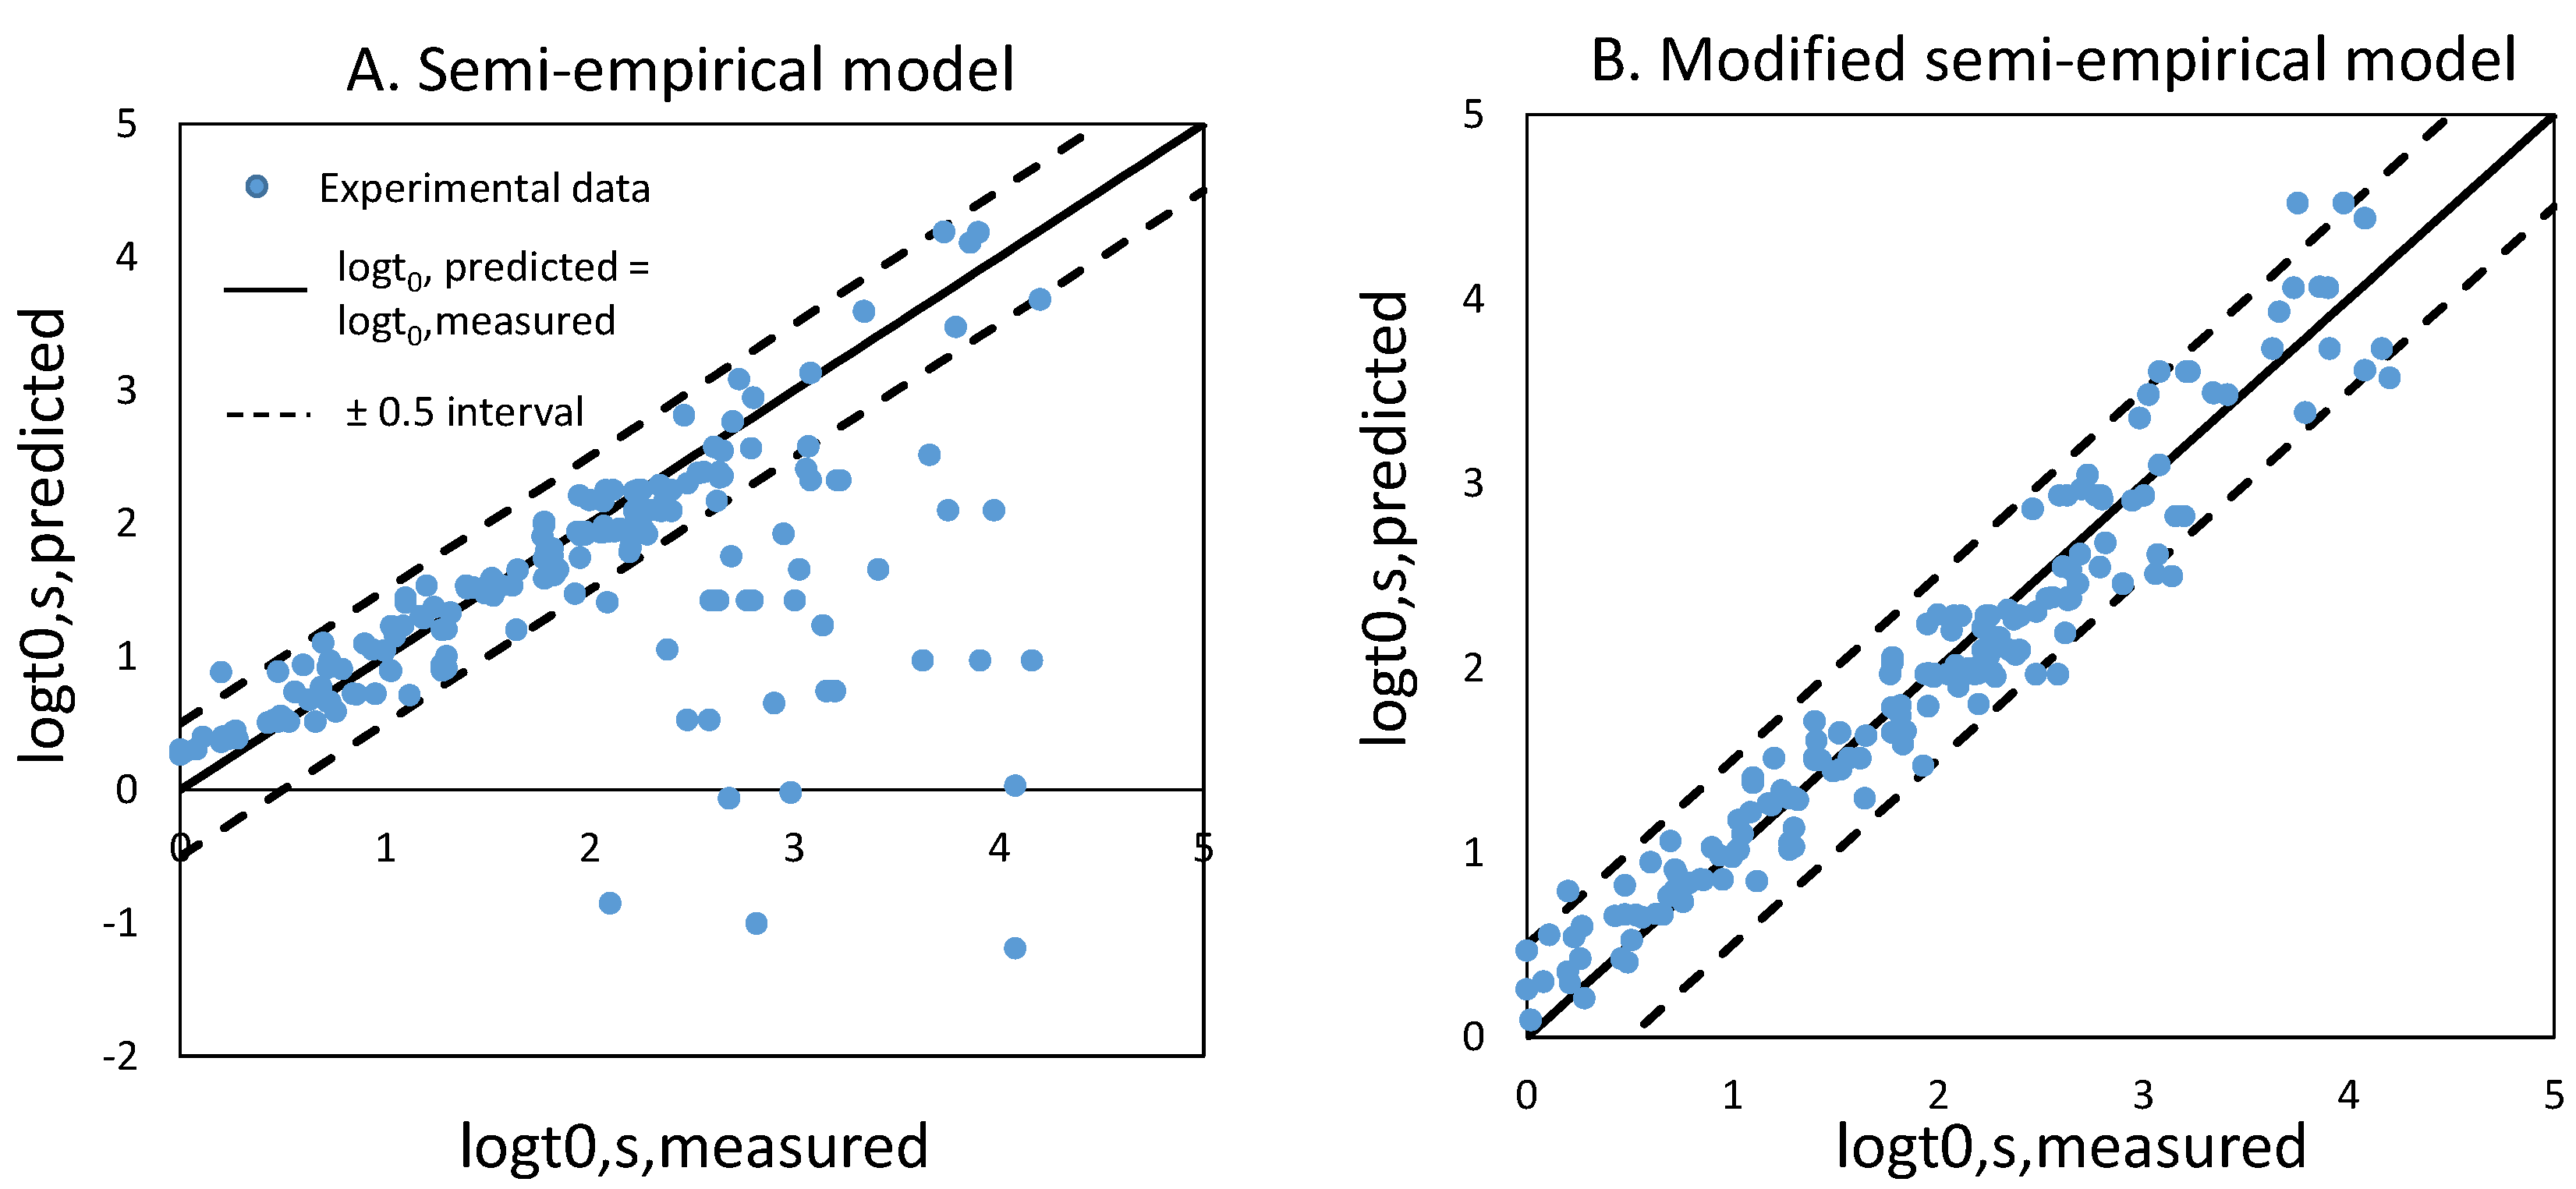
2.3. Barite Crystallization and Inhibition Semi-Empirical Model

Based on the experimental observations, a semi-empirical model was proposed to predict the kinetics of barite crystallization and inhibition [10]. The barite crystallization (Equation (8)) and inhibition models (Equations (9) and (10)) are functions of common field conditions, being temperature, SI, ion ratio (i.e., Ba2+ to SO42−), Ca2+ concentrations, and inhibitor concentrations.
logt 0 = a 1 + a 2 SI + a 3 T + a 4 SI × T + a 5 × [ Ca 2 + ] + a 6 × logR  
log ( t inh t 0 ) = b × C inh  
logb = a 7 + a 8 × SI + a 9 T + a 10 × pH + a 11 × logR  
where, t0 is the induction time without inhibitors; tinh is the induction time in the presence of inhibitors; SI is the saturation index with respect to barite; T is the temperature, K; R is the ratio of cation to anions (i.e., [Ba2+]/[SO42−]) for barite; b is the inhibition efficiency; Cinh is the active inhibitor concentration, ppm. The values of a1–a11 parameters were fitted from the barite nucleation and inhibition experimental data.

3. Results and Discussion

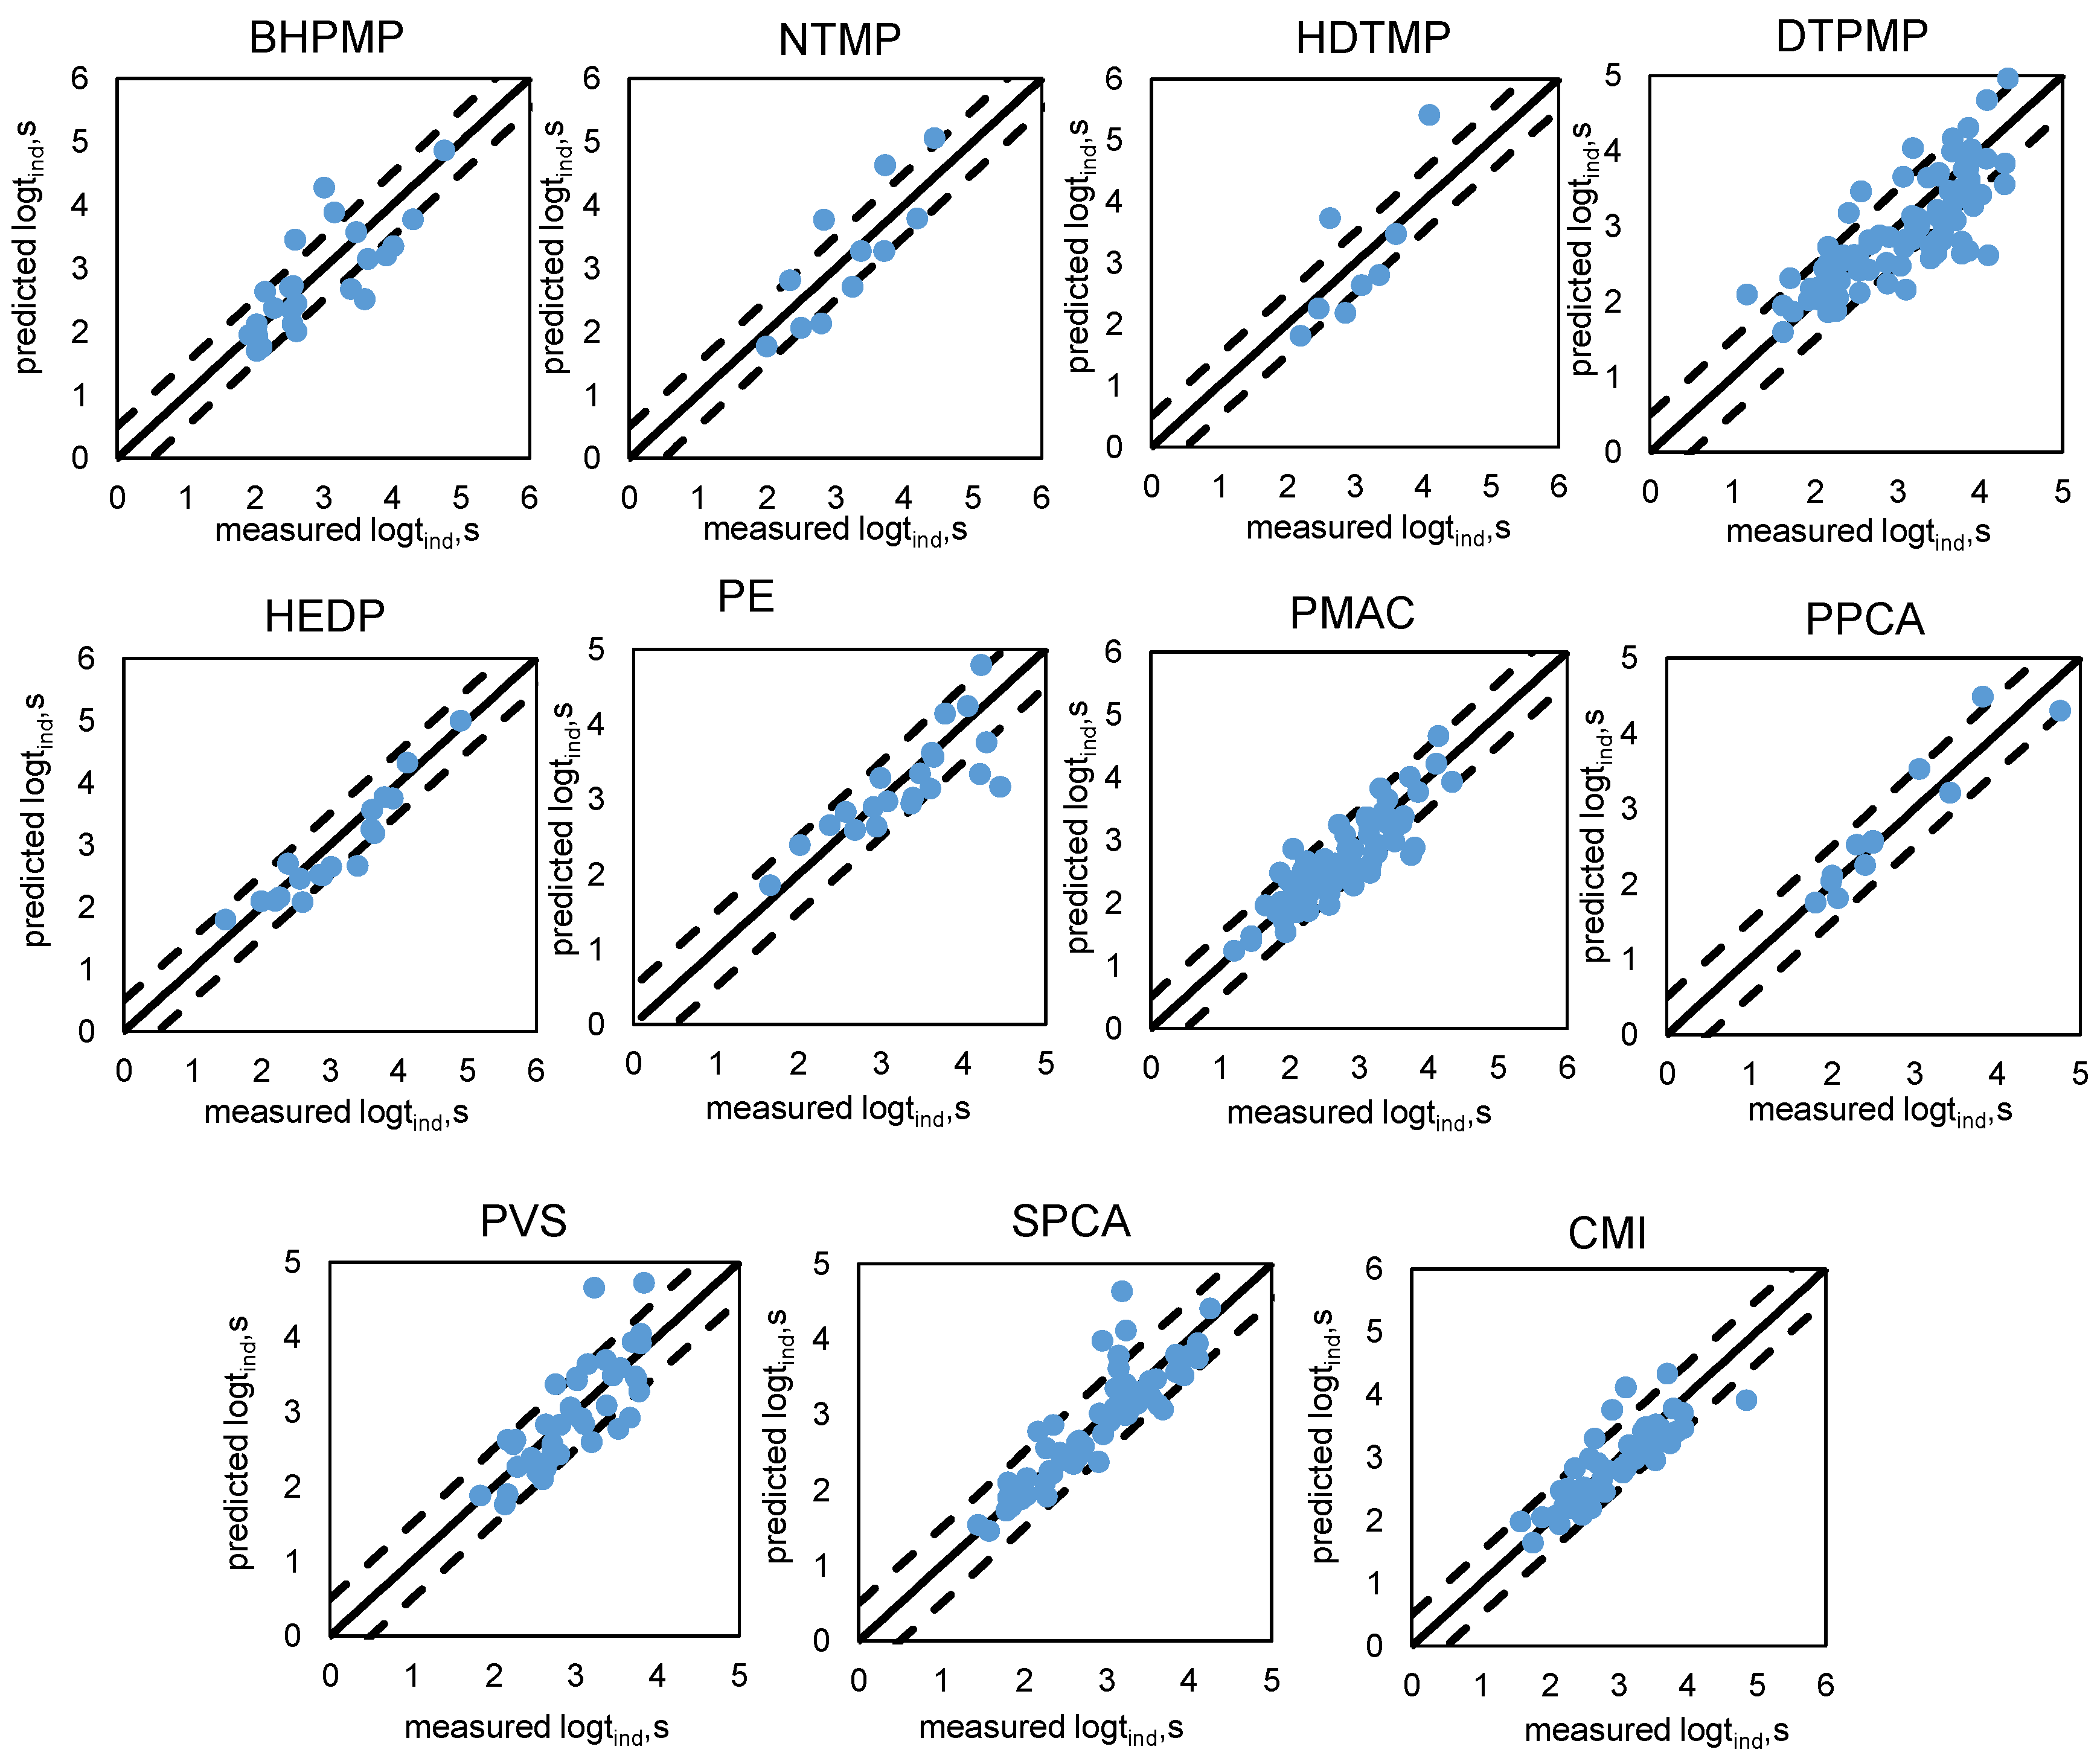
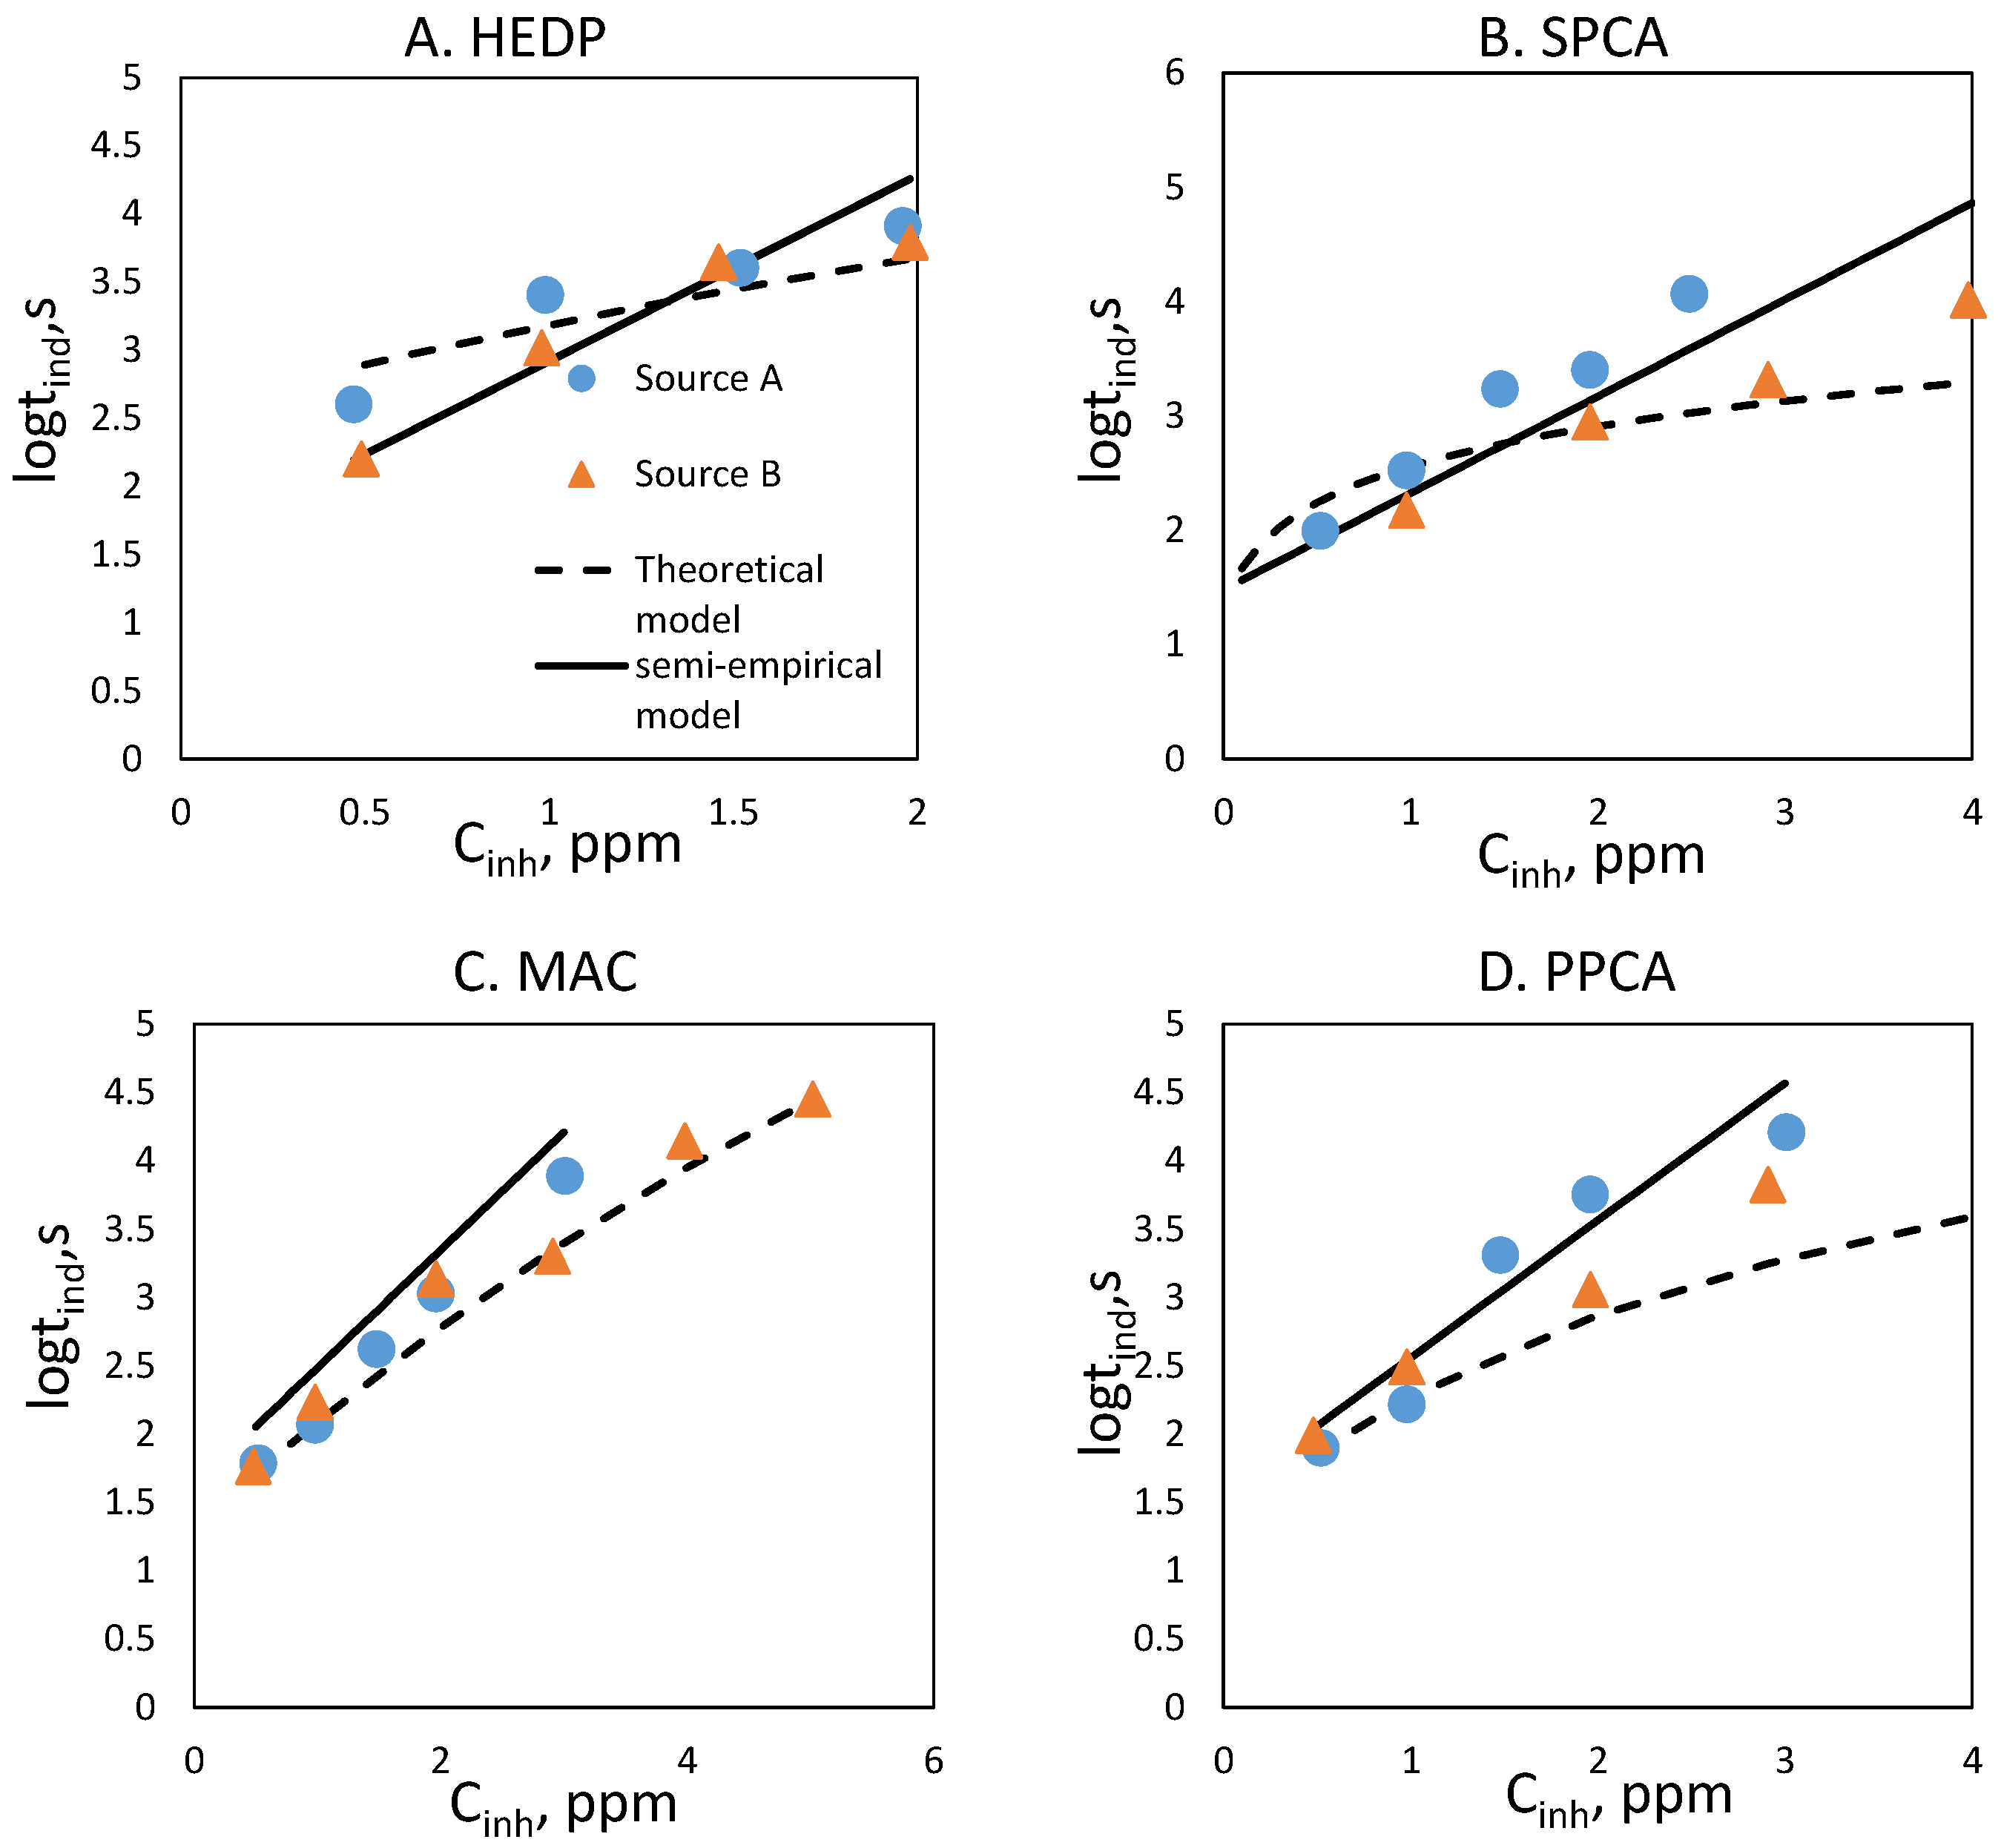
3.1. Advances in Barite Theoretical Inhibition Models

Barite crystallization experiments without adding inhibitors were conducted under conditions of 4–250 °C, SI = 0.4–2.8, and Ca2+: 0.025–0.1 M. Barite theoretical crystallization equation (Equation (1)) was fitted using these experimental data. Results showed that the values of molar volume (Vm), effective diffusion coefficient (D), and superficial interfacial energy (δ) were 4.80 × 10⁻⁵ m3/mol and 5.42 × 10⁻¹⁹ m2s−1, and 52.93 − 0.049576 × (T − 298.15) mJ/m2, respectively, in Equation (1). Figure 1 shows that the logarithm of predicted induction time (predicted logt0,s) matched well with the logarithm of measured induction time (measured logt0,s) within error of ±0.5, indicating a good fit.
Barite theoretical inhibition models were previously developed and validated for 9 inhibitors, including NTMP, BHPMP, DTPMP, HDTMP, HEDP, PPCA, MAC, CMI, and PVS [20,21,22]. The fitting results (i.e., aG and aV per functional unit) are shown in Table 1 and the fitting performance is shown in Figure 2. More barite inhibition experiments were conducted in this study for an additional 9 inhibitors, including PAPEMP, PBTC, PE, EDTMP, HEBMP, PhnAA, PASP, and AA/AMPS under condition of SI = 1.89, T = 70 °C, and Ba/SO4 = 1. Based on these inhibition experimental results, the values of aG and aV per functional unit in Equations (2)–(7) for each additional inhibitor were fitted and results are also shown in Table 1. As shown in Figure 2, the logarithm of predicted induction time (predicted logtinh,s) in the presence of additional inhibitors matched well with the logarithm of measured induction time (measured logtinh,s), indicating a good fit.

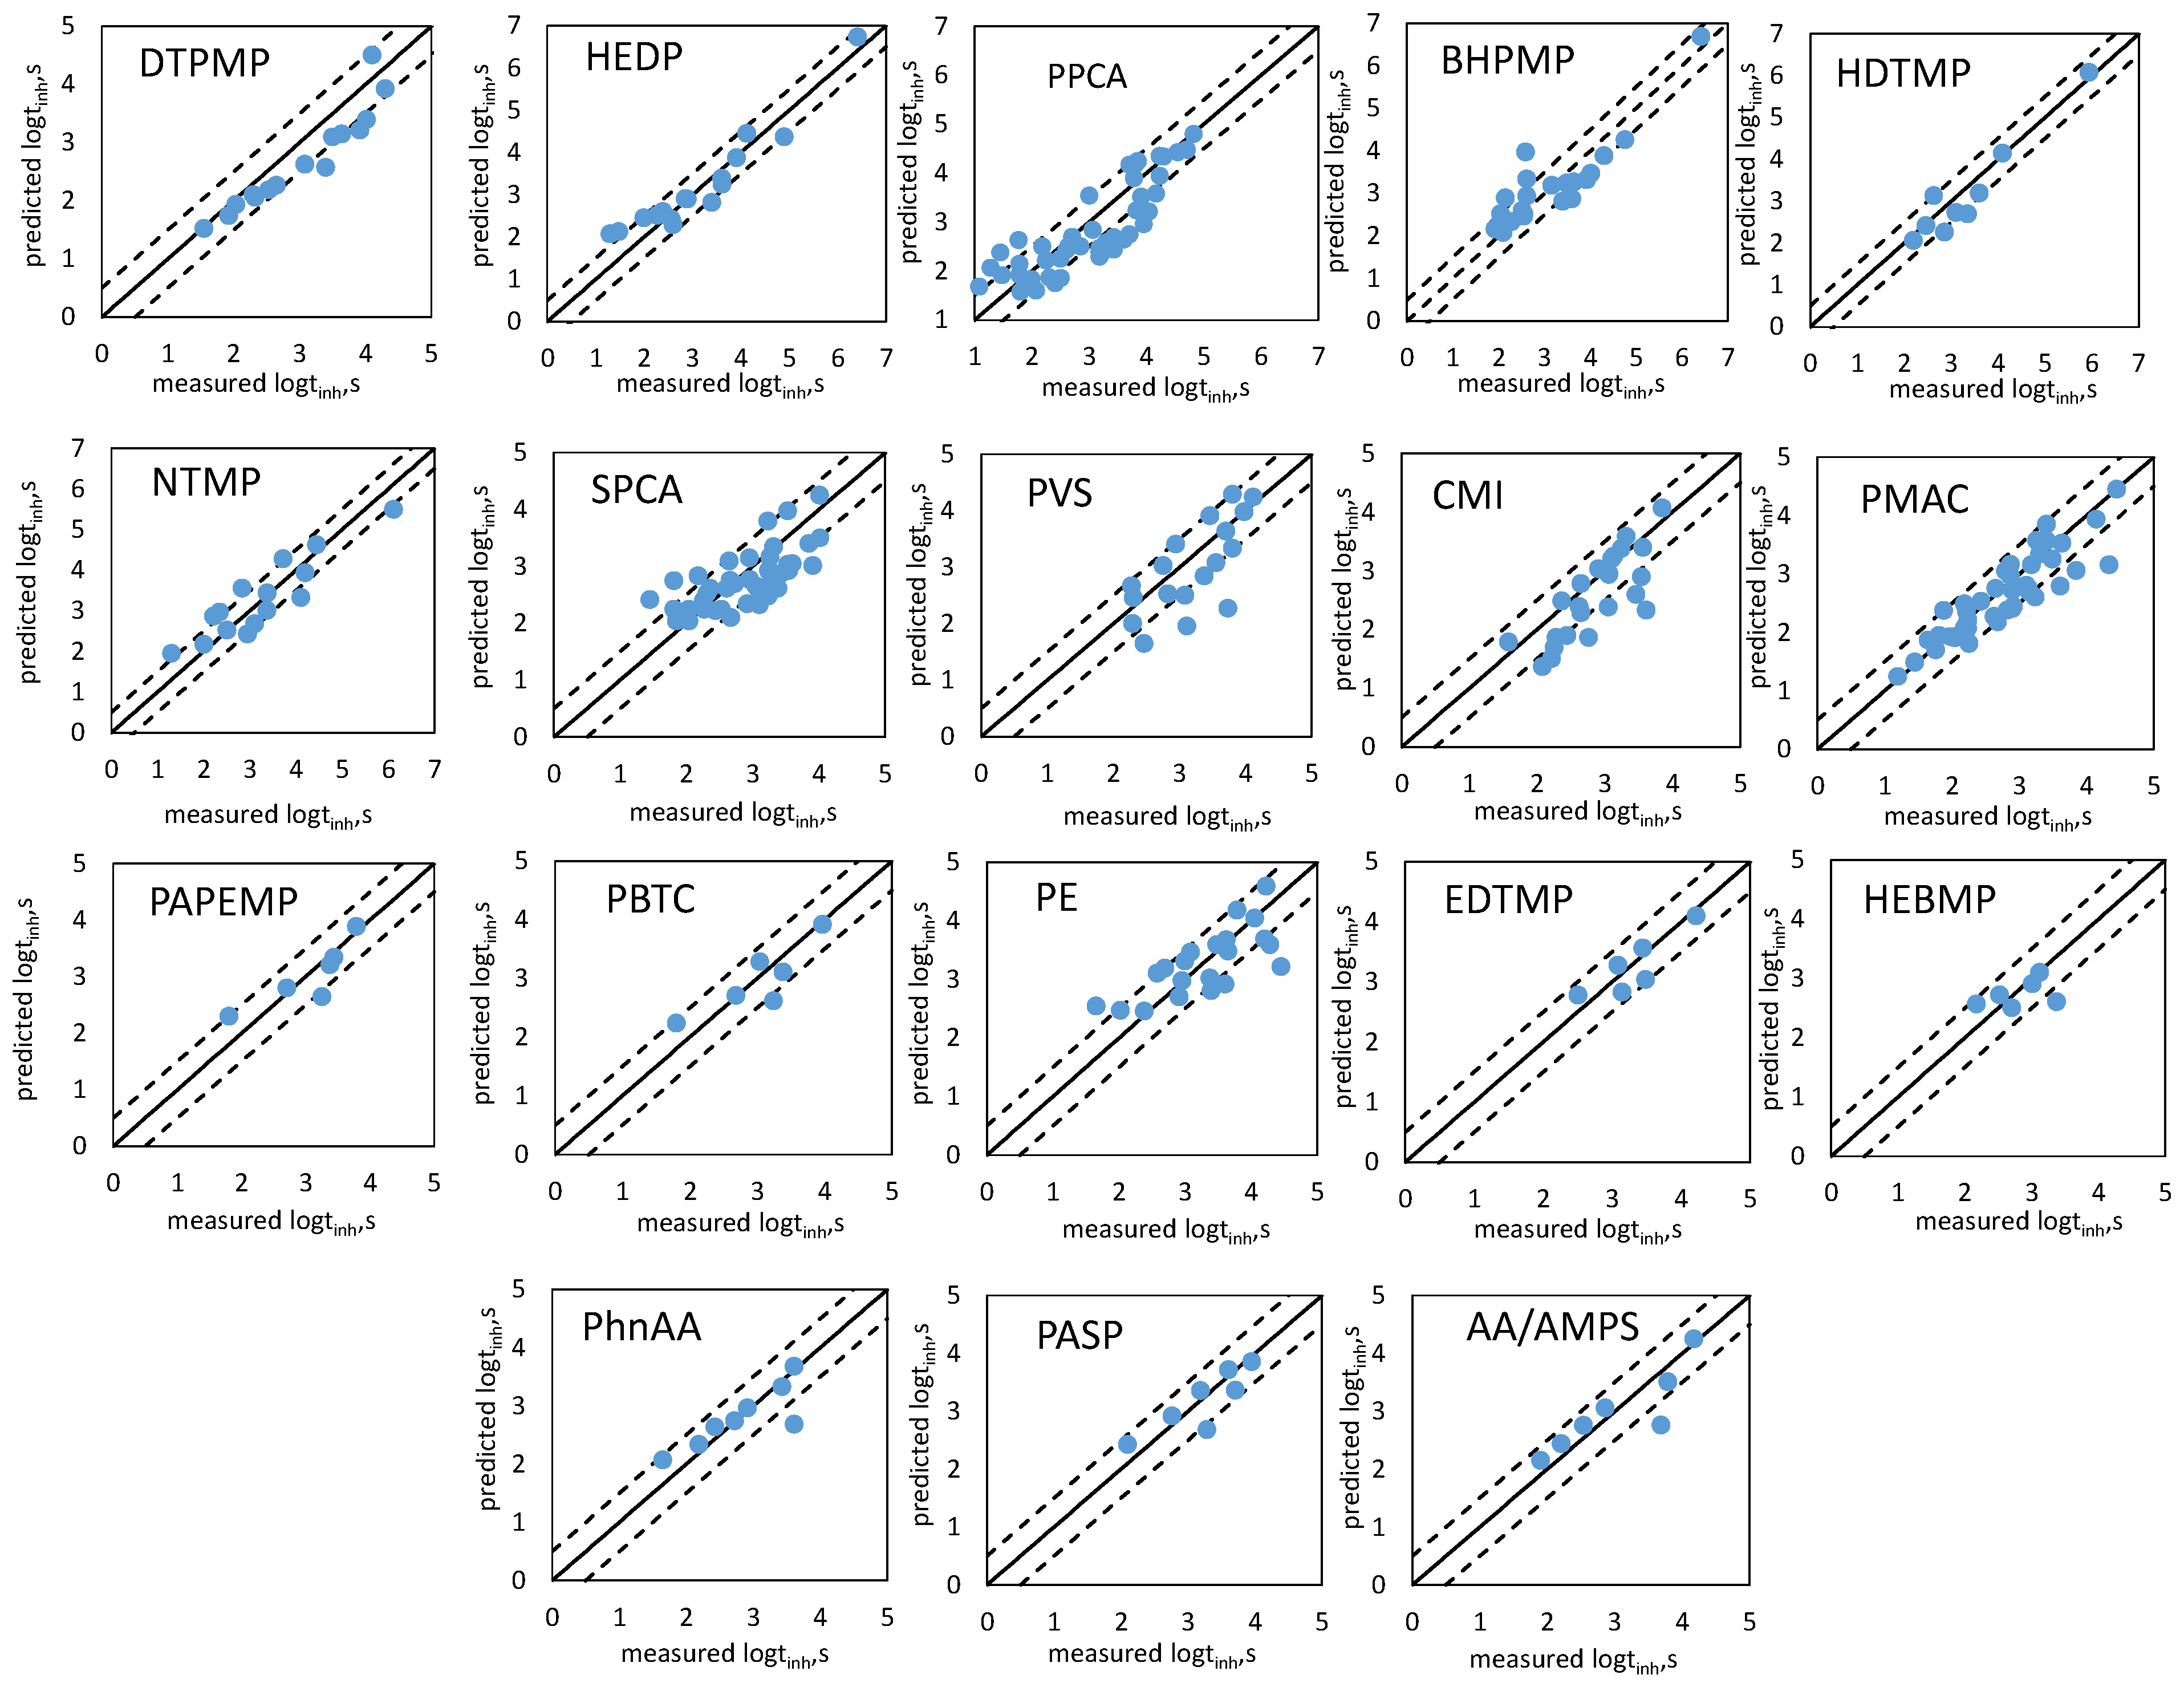
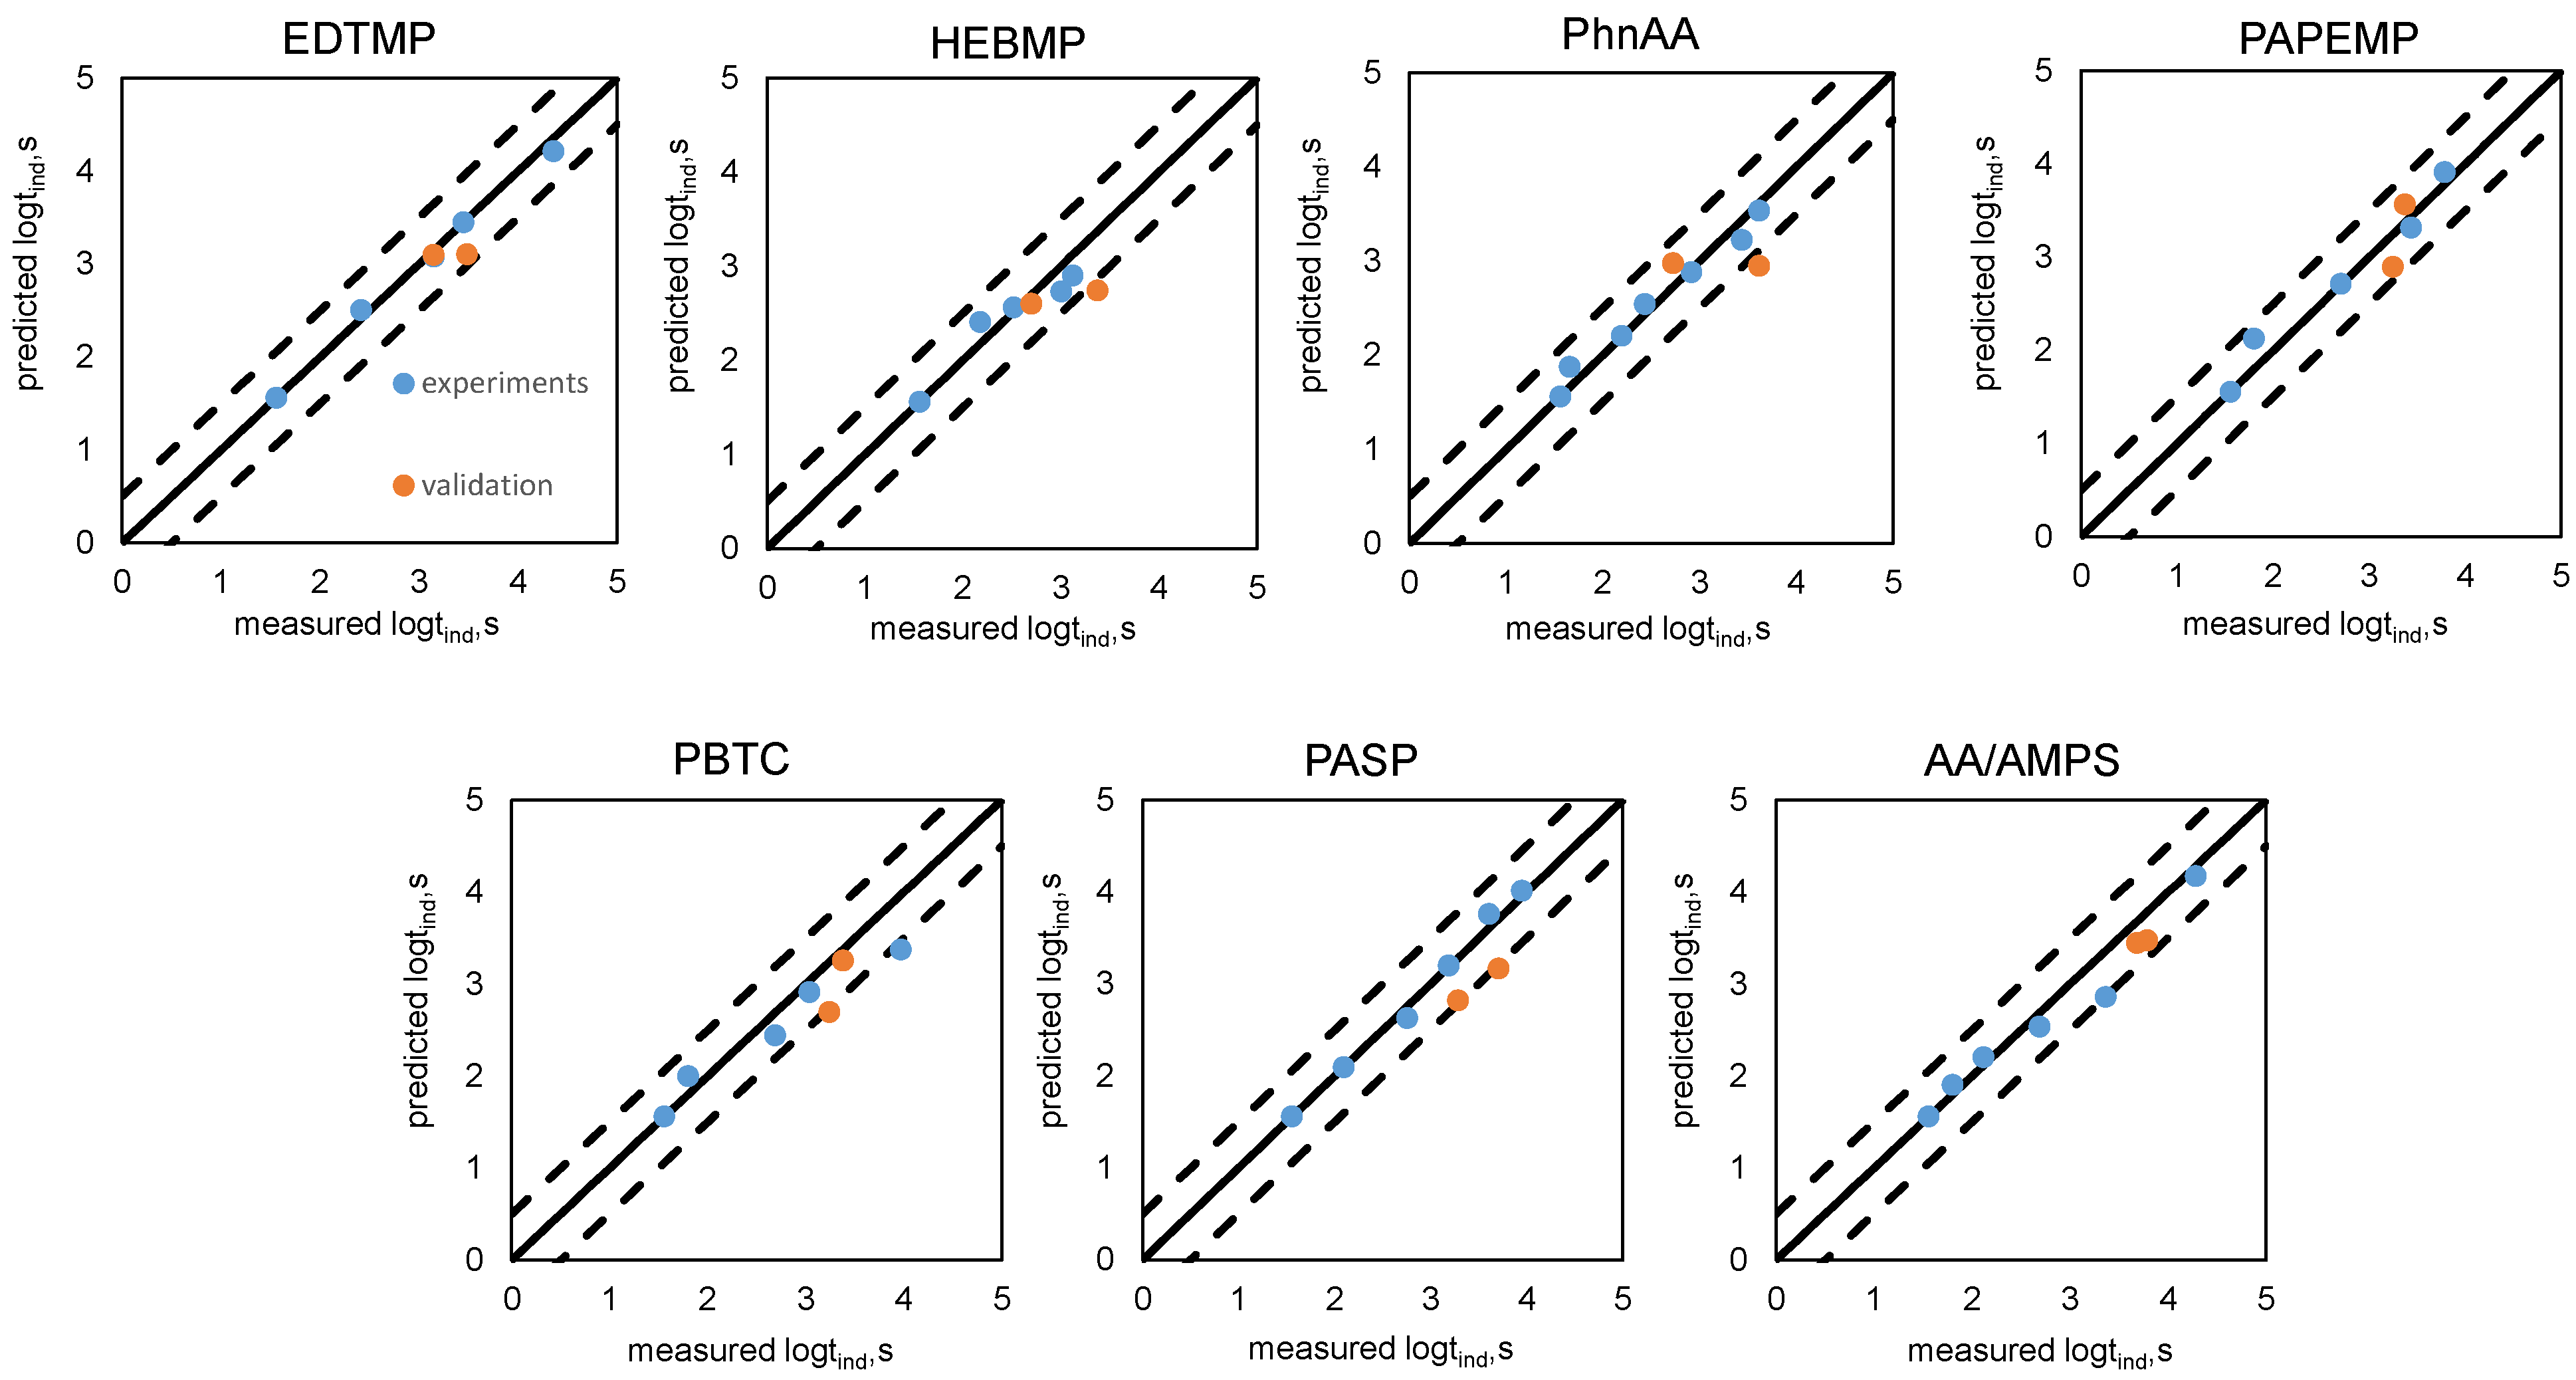
3.2. Advances in Barite Crystallization and Inhibition Semi-Empirical Models

The barite semi-empirical nucleation model has been proposed based on the experimental observations as a function of common field conditions temperature T, SI, [Ca2+] concentration, and R (i.e., the ion ratio of Ba2+ to SO42−). The values of a1–a6 parameters in Equation (8) were previously fitted based on the experimental data with the range of T = 4–90 °C, SI = 0.56–2.74, Ca2+: 0.025–0.1 M, [Ba2+]/[SO42−] = 0.01–100. Based on the experimental results, barite semi-empirical nucleation model was proposed as below Equation (11):
logt 0 = 1.5232 10.8784 SI 895.6683 T + 5476.992 SI × T                      + 0.8286 × [ Ca 2 + ] + 0.225 × logR  
Because the experiments above 100 °C could not conduct in a regular glass reactor, our previous model only included the data up to 90 °C that were available previously. Recently, Deng et al. developed an apparatus that allowed barite nucleation experiments using the kinetic turbidity test method with laser apparatus at high temperature up to 250 °C under oil and gas production conditions. A custom-designed reactor with high pressure limit that could hold the water vapor pressure above 100 °C was used. The predicted logarithm of induction time (logt0,s) from the existing barite semi-empirical nucleation model was compared with all experimental data at 4–250 °C and SI = 0.4–2.8 (Figure 3A). Results showed that the prediction model worked well for the experimental up to 90 °C. However, the predicted logarithm of induction time from existing barite semi-empirical nucleation model did not match well with the experimental data at higher temperature (90–250 °C). Therefore, it is important to advance a barite semi-empirical nucleation model that can extend the applicable temperature range up to 250 °C. By including all available data, barite semi-empirical nucleation model was modified to Equation (12) as follows:
logt 0 = 2.11 4.29 SI + 279.29 T + 3332.26 SI × T + + 0.8286 × [ Ca 2 + ] + 0.99 × logR   ( 13 )
Results showed that the predicted logarithm of induction time (logt0) from the modified barite semi-empirical nucleation model matched well with the measured induction time with the measurements of temperature up to 250 °C. This indicated that the modified barite semi-empirical model significantly improved the performance of the model, especially advancing the prediction under higher temperature (90–250 °C).
On the basis of the barite semi-empirical nucleation model, a barite semi-empirical inhibition model was also proposed based on Equations (8)–(11) as a function of temperature, SI, pH, R (i.e., ratio of Ba2+ to SO42−), and inhibitor concentrations Cinh. In our previous studies, the parameters a8-a12 in the barite semi-empirical model were fitted based on the experiments with the range of T = 4–175 °C, pH = 3–8, SI = 0.56–2.74, Ca2+: 0.025–0.1 M, [Ba2+]/[SO42−] = 0.01–100 for 11 inhibitors (i.e., NTMP, BHPMP, DTPMP, HDTMP, HEDP, PPCA, MAC, CMI, SPCA, PE, and PVS). We found that the a8-a11 parameters corresponding to the changes of SI, pH, temperature, and ion ratio were similar for each type of inhibitor. Meanwhile, based on barite theoretical inhibition models, the aV and aG values per functional unit for each type of inhibitor were similar. These indicated that the change of SI, temperature, pH, and ratio of Ba to SO4 for each type of inhibitor might be similar, and the average values of a8-a11 for each type of inhibitor can be used instead. Therefore, only the independent parameter a7 for each individual inhibitor, which can be used to differentiate the inhibition efficiency of each inhibitor, needs to be fitted based on barite inhibition experimental data. With this approach, the logarithm of predicted induction time with the presence of inhibitors (loginh) matched well with the logarithm of measured induction time for these 11 inhibitors under broad field conditions within the error of ±0.5. The successful fitting with this approach indicated that this might be used as a protocol to evaluate any new inhibitor by knowing the type of inhibitor.
Besides these 11 inhibitors, 7 additional inhibitors were selected to evaluate their performance using new protocol and further advance the barite inhibition models. Because only one parameter a5 needed to be fitted by the new approach, only one set of experiments under one condition was needed. In this study, the barite inhibition experiments for all 7 additional inhibitors were conducted under one condition of SIbarite = 1.89, T = 70 °C, pH = 6.7, and RBa/SO4 = 1, and the values of a7 were fitted for each individual inhibitor. Figure 4 shows that the logarithm of predicted induction time has good agreement with the logarithm of measured induction time, indicating a good fit. The values of a7 for 7 new inhibitors are shown in Table 2. To validate this approach, the logarithm of induction time from new prediction models was compared with logarithm of measured induction time from the experiments under other two typical conditions (i.e., SIbarite = 2.05, T = 25 °C, pH = 6.7, and RBa/SO4 = 1 and SIbarite = 1.42, T = 90 °C, pH = 6.7, and RBa/SO4 = 1). As shown in Figure 5, the new inhibition models also showed good agreement for experiments under the other two conditions, indicating the feasibility of this approach for quickly evaluating any new inhibitor on barite inhibition.
To sum up, this study advanced the prediction of barite nucleation and inhibition by improving the applicable temperature ranges and inhibitors of barite semi-empirical nucleation and inhibition models. Also, this study provided a new approach to quickly develop a barite inhibition model for any type of inhibitor by only running a few experiments.

3.3. New Insights of Inhibitors on Barite Inhibition Processes

Both the theoretical and the barite semi-empirical models suggested that the type of inhibitors may impact the inhibition efficiency of inhibitors on barite inhibition. The types of inhibitors are generally classified by the functional groups of inhibitors. Accordingly, the inhibition efficiency of inhibitors (b) may be expressed as a function of the inhibition efficiency of functional groups: logb = an individual term of each inhibitor correlated with functional groups + universal term for all inhibitors. Meanwhile, previous studies suggested that the inhibitors may adsorb onto solid/nucleus through hydrophobic repulsion. Accordingly, we hypothesized that the temperature and pressure dependence of inhibitors on barite inhibition might be similar. Therefore, to take the barite semi-empirical inhibition model one step further, in Equation (10), the values of a8–a11 was assumed to be the same for all inhibitors and the value of a7 = (the number of functional groups multiplied by the value of functional group parameter)/molecular weight of inhibitors. The information of the name and number of functional groups of all inhibitors are listed in Supplementary Materials. For example, the a7 value of HEBMP = the number of amino phosphonate groups × value of amino phosphonate group c1 + number of N-C-OH group × value of amino phosphonate group, being c3 = 2 × c1 + 1 × c3. After fitting the one-step further barite semi-empirical inhibition model, the values of c1, c2, c3, c4, c5, c6, and c7 corresponding to the functional groups of amino-phosphonate, C-phosphonate, N-C-OH, phosphate ester, C-O-C, carboxylate, and sulfonate were calculated to be −124.20, −100.71, −177.66, −130.89, −112.8, −79.93, and −126.83, respectively. The a8, a9, a10, and a11 values of all inhibitors corresponding to the change of SI, T, pH, and RBa/SO4 were the same, being −1.13, 802.23, 0.13, and 0.16, respectively. The total sum of squares of residuals with all datapoints are 66.15. As shown in Figure 6, the logarithm of predicted induction time (predicted logtinh,s) from the one-step further barite semi-empirical inhibition model matched well with the logarithm of measured induction time (measured logtinh,s), indicating that our hypothesis on the barite inhibition processes might be reasonable.
This one-step further barite inhibition model may provide new insights on the possible mechanisms of barite inhibition. The inhibitors may adsorb onto solid/nucleus through hydrophobic repulsion [27]. The inhibition efficiency of inhibitors on barite inhibition may depend on the properties of functional groups. More experimental and computational work about the mechanisms of barite inhibition at molecular level might be an interesting future direction. This one-step further barite semi-empirical inhibition model might also suggest that for any unknown inhibitor, the same values of a8–a11 could be used, and only a7 parameters in Equation (10) needs to be fitted by running a few experiments under one condition.

3.4. Application and Values of Barite Inhibition Models to Industry

Accurate prediction models could save an enormous amount of time and money on testing and application of each inhibitor under various production conditions. Both our barite inhibition models can predict minimum inhibitor concentration (MIC) to be applied in the field. Jordan et al. investigated the inhibition of barite using phosphonate inhibitors through squeeze treatment in one of the oilfields, which is in the UK sector of the North Sea, 200 miles north east of Aberdeen [28]. In this oilfield, barite scale forms through the mixing of formation water containing high Ba2+ and seawater containing high SO42− during oil and gas production. The produced water chemistry of production well was measured based on the brine chemistry and suspended solids evaluations. The formation water contains up to 220 ppm barium Ba2+. The seawater contains 11,470 ppm Na+, 395 ppm K+, 400 ppm Ca2+, 1340 ppm Mg2+, 0 ppm Ba2+, 8 ppm Sr2+, 20,510 ppm Cl, 2790 ppm SO42−, and 155 ppm alkalinity as HCO3. The produced water in Well A, B, and C was formed by mixing the formation water with 16%, 53%, and 39% seawater. The temperature of the reservoir was 100 °C. The brine compositions of these three wells are listed in Table 3. Based on the calculations, the barite SI were calculated to be 1.08, 1.40, and 1.34 for Well A, B, and C, respectively, under 100 °C. These wells were treated with phosphonate inhibitors to inhibit barite formation through squeeze treatment. The MIC values under these three scenarios were calculated from our barite inhibition models, taking DTPMP inhibitor as an example. The predicted MIC values by assuming 2 h protection time were 0.15, 0.6, and 0.5 ppm in active concentration of inhibitors (i.e., 10%–50% of the product concentration of inhibitors). The predicted minimum inhibitor concentration (MIC) values by assuming 24 h protection time were 0.3, 0.9, and 0.8 ppm in active concentration of inhibitors (i.e., 10–50% of the product concentration of inhibitors). A safety factor (e.g., SF = 3) was recommended to be multiplied by the model predicted MIC, to make sure the dosage added to the field is sufficient. In general, our reported MIC in active concentration with a safety factor of 3 is comparable with the reported MIC in product concentration (i.e., 2.5–5 ppm). This indicated that regarding to inhibit barite formation, the predicted MIC from our barite inhibition models provides a reasonable guidance to oilfield applications. Furthermore, in oilfield, some other ions (e.g., Ca2+, Mg2+, Fe2+) may affect the kinetics of barite formation and inhibition, and the consideration of their interferences in models can be an interesting future direction.
Secondly, in the market, there are numerous inhibitors with different product names, active concentrations, and molecular weights but with the same generic chemicals. It is time and cost consuming to test the efficiency of all chemicals. To save the time and cost on testing, it is worthwhile to investigate whether all chemicals with different product names need to be tested or only generic chemicals. Accordingly, barite inhibition experiments were conducted using the same generic chemical but from different sources (i.e., source A and source B in Figure 7). As shown in Figure 7, despite different product names, active concentrations, molecular weights, and/or chemical names, the experimental data from kinetic turbidity test method with laser apparatus were quite similar under condition of SIbarite = 1.89, T = 70 °C, pH = 6.7, and RBa/SO4 = 1 for the inhibitors with the same generic name. Both our theoretical and semi-empirical model could work for the inhibitors from different sources under the same generic name. Therefore, by using our apparatus and models, only the generic chemical needs to be tested by only running a few experiments under one condition.
Furthermore, mixed inhibitors were sometimes added to treat the scales in oilfield, especially the mixture of phosphonate and polymer inhibitors [14]. Previous studies showed that the effect of mixed inhibitors on calcite inhibition is strictly additive [14]. Therefore, in our models, the inhibition efficiency of the mixed inhibitors (bmixture) is calculated by bmixture = b1*fraction of inhibitor 1 + b2*fraction of inhibitor 2. Kinetic turbidity test method with laser apparatus was used in this study to evaluate the performance of mixed inhibitors (i.e., the mixture of DTPMP + PPCA and DTPMP + PVS inhibitors), and the results were compared with our model prediction for mixed inhibitors. As shown in Table 4, the measured logarithm of induction time with 0.5 ppm DTPMP + 0.5 ppm PPCA was 2.86, which is similar as the logarithm of predicted induction time of mixed inhibitors, being 2.69 s. The logarithm of measured induction time with 0.5 ppm DTPMP + 0.5 ppm PVS was 3.13 s, which is also similar as the logarithm of predicted induction time of mixed inhibitors, being 2.68 s. In general, our predicted induction time of mixed inhibitors was similar as the measured induction time of mixed inhibitors. Results also showed that slightly synthetic improvement of mixed inhibitors may be observed, but more tests and mechanistic understanding will be needed in future to confirm this slight synthetic effects. Overall, our recommended MIC values for mixed inhibitors from barite inhibition models are reasonable and a safe dosage to be applied in the oilfield.

4. Summary

During oil and gas production, the formation of barite scale can sequester toxic and radioactive Sr and Ra. Therefore, it is vital to systematically investigate the kinetics of barite formation and inhibition, which can understand the fate and transport of toxic Sr and radioactive Ra during oil and gas production. This study briefly summarized common barite inhibition test methods and emphasized on the kinetic turbidity test method with laser apparatus. Using the kinetic turbidity test method with laser apparatus, barite nucleation and inhibition experiments were conducted over broad oilfield conditions. Eighteen common inhibitors including aminophosphonates, polycarboxylates, and polysulfonates/polycarboxylates, were selected and tested in this study. This study also summarized all available data and advanced the barite semi-empirical nucleation model by extending the applicable temperature range up to 250 °C. Barite semi-empirical inhibition models were unified and advanced for 18 inhibitors to be self-consistent. A quick approach was proposed to evaluate any new inhibitors by only running a few experiments. Barite theoretical inhibition model was advanced by extending the applicable range to 18 inhibitors. Barite semi-empirical inhibition model was also proposed one step further to understand the possible processes of inhibitors on barite inhibition. Based on the statistical analysis, the RSS with theoretical model, semi-empirical model, and one-step further inhibition model was small, being 99.86, 76.32, and 66.15, respectively, indicating a good fit. The one-step further inhibition model with the smallest RSS value may suggest the best model among all different models. Finally, the application and values of barite nucleation and inhibition models to oil and gas industry were discussed. Our barite prediction models that can predict MIC of each inhibitor could provide a reasonable guidance to the dosage of each inhibitor to be added in the oilfield. We also found that the inhibition efficiency of the inhibitor with the same generic name from different sources were quite similar and can be predicted by both our barite semi-empirical and theoretical inhibition models, indicating only the generic chemical for each inhibitor needs to be tested. By comparing the experimental data with model prediction, our prediction model for mixed inhibitor could also work well. Besides MIC prediction, the properties of inhibitors, such as thermostability, biodegradability, and Ca tolerance, should also be considered. This study not only gave a comprehensive summary and advances of barite inhibition test and models, but also provided new insights on the application and values of the test methods and models to the oil and gas industry. The measurement method and prediction models can also potentially be applied in other engineered systems, as well as for other scales.

Supplementary Materials

The following are available online at https://www.mdpi.com/article/10.3390/su13158533/s1, Table S1: Detailed Information of 18 common inhibitors used in barite inhibition experiments, Table S2: The name and numbers of functional groups for 18 inhibitors.

Author Contributions

Conceptualization, C.D., Z.D., A.T.K., M.B.T.; methodology, C.D., Z.D., Y.Z., X.W., S.P., S.K., A.T.K., M.B.T.; software, C.D., Z.D.; validation, C.D., Z.D., Y.Z., X.W., A.T.K., M.B.T.; formal analysis, Y.Z., C.D., Z.D.; investigation, C.D., Z.D.; resources, A.T.K., M.B.T.; data curation, C.D., Z.D.; writing—original draft preparation, C.D.; writing—review and editing, C.D., Z.D., A.T.K., M.B.T.; visualization, C.D., Z.D.; supervision, A.T.K., M.B.T.; project administration, A.T.K., M.B.T.; funding acquisition, A.T.K., M.B.T. All authors have read and agreed to the published version of the manuscript.

Funding

This work was financially supported by Brine Chemistry Consortium companies of Rice University, including Aegis, Apache, BHGE, BWA, Chevron, ConocoPhillips, Clariant, Coastal Chemical, EOG Resources, ExxonMobil, Equinor, Flotek Industries, Halliburton, Italmatch, JACAM, Kemira, Kinder Morgan, Oxy, Chemstream, Pioneer, RSI, Saudi Aramco, Schlumberger, Shell, Solugen, SNF, Solvay, and Total.

Institutional Review Board Statement

Not applicable.

Informed Consent Statement

Not applicable.

Data Availability Statement

Not applicable.

Acknowledgments

This work was financially supported by Brine Chemistry Consortium companies of Rice University, including Aegis, Apache, BHGE, BWA, Chevron, ConocoPhillips, Clariant, Coastal Chemical, EOG Resources, ExxonMobil, Equinor, Flotek Industries, Halliburton, Italmatch, JACAM, Kemira, Kinder Morgan, Oxy, Chemstream, Pioneer, RSI, Saudi Aramco, Schlumberger, Shell, Solugen, SNF, Solvay, and Total.

Conflicts of Interest

The authors declare no conflict of interest.

References

  1. Kan, A.T.; Tomson, M.B. Scale Prediction for Oil and Gas Production. SPE J. 2012, 17, 362–378. [Google Scholar] [CrossRef]
  2. Fan, C.; Kan, A.T.; Zhang, P.; Lu, H.; Work, S.; Yu, J.; Tomson, M.B. Scale Prediction and Inhibition for Oil and Gas Production at High Temperature/High Pressure. SPE J. 2012, 17, 379–392. [Google Scholar] [CrossRef] [Green Version]
  3. Merdhah, A.B.B.; Yassin, A.A.M. Laboratory Study on precipitation of Barium Sulphate in Malaysia sandstone cores. Open Pet. Eng. J. 2009, 2, 1–11. [Google Scholar] [CrossRef] [Green Version]
  4. Gao, S.; Jin, P.; Brown, B.; Young, D.; Nesic, S.; Singer, M. Corrosion Behavior of Mild Steel in Sour Environments at Elevated Temperatures. Corrosion 2017, 73, 915–926. [Google Scholar] [CrossRef]
  5. Macadam, J.; Parsons, S.A. Calcium carbonate scale formation and control. Rev. Environ. Sci. Bio/Technol. 2004, 3, 159–169. [Google Scholar] [CrossRef]
  6. VanKeuren, A.N.P.; Hakala, J.A.; Jarvis, K.; Moore, J.E. Mineral Reactions in Shale Gas Reservoirs: Barite Scale Formation from Reusing Produced Water As Hydraulic Fracturing Fluid. Environ. Sci. Technol. 2017, 51, 9391–9402. [Google Scholar] [CrossRef] [PubMed]
  7. Yan, F.; Dai, Z.; Ruan, G.; Alsaiari, H.; Bhandari, N.; Zhang, F.; Liu, Y.; Zhang, Z.; Kan, A.; Tomson, M. Barite scale formation and inhibition in laminar and turbulent flow: A rotating cylinder approach. J. Pet. Sci. Eng. 2017, 149, 183–192. [Google Scholar] [CrossRef]
  8. Kleppan, T.; Dahle, K.O.; Tinnen, B.; Brankovic, M.; Osugo, L.; Danielsen, R. Removing Settled Barites from a Wellbore Using an Electrically Powered Well Cleanout System. In Proceedings of the SPE/ICoTA Coiled Tubing and Well Intervention Conference and Exhibition, Houston, TX, USA, 22–23 March 2016. [Google Scholar]
  9. Crabtree, M.; Eslinger, D.; Fletcher, P.; Miller, M.; Johnson, A. Fighting scale—Removal and prevention. Oilfield Rev. 1999, 11, 30–45. [Google Scholar]
  10. He, S.; Oddo, J.E.; Tomson, M.B. The inhibition of gypsum and barite nucleation in NaCl brines at temperatures from 25 to 90 °C. Appl. Geochem. 1994, 9, 561–567. [Google Scholar] [CrossRef]
  11. Pina, C.; Putnis, C.V.; Becker, U.; Biswas, S.; Carroll, E.; Bosbach, D.; Putnis, A. An atomic force microscopy and molecular simulations study of the inhibition of barite growth by phosphonates. Surf. Sci. 2004, 553, 61–74. [Google Scholar] [CrossRef] [Green Version]
  12. Tomson, M.B.; Fu, G.; Watson, M.; Kan, A.T. Mechanisms of Mineral Scale Inhibition. SPE Prod. Facil. 2003, 18, 192–199. [Google Scholar] [CrossRef]
  13. Yan, C.; Kan, A.T.; Zhang, F.; Liu, Y.; Tomson, R.C.; Tomson, M.B. Systematic Study of Barite Nucleation and Inhibition with Various Polymeric Scale Inhibitors by Novel Laser Apparatus. SPE J. 2015, 20, 642–651. [Google Scholar] [CrossRef]
  14. Matty, J.M.; Tomson, M.B. Effect of multiple precipitation inhibitors on calcium carbonate nucleation. Appl. Geochem. 1988, 3, 549–556. [Google Scholar] [CrossRef]
  15. Lu, A.Y.-T.; Harouaka, K.; Paudyal, S.; Ko, S.; Dai, C.; Gao, S.; Deng, G.; Zhao, Y.; Wang, X.; Mateen, S.; et al. Kinetics of Barium Sulfate Deposition and Crystallization Process in the Flowing Tube. Ind. Eng. Chem. Res. 2020, 59, 7299–7309. [Google Scholar] [CrossRef]
  16. Zhang, F.; Dai, Z.; Yan, C.; Bhandari, N.; Yan, F.; Liu, Y.; Zhang, Z.; Ruan, G.; Kan, A.T.; Tomson, M.B. Barite-Scaling Risk and Inhibition at High Temperature. SPE J. 2017, 22, 069–079. [Google Scholar] [CrossRef]
  17. Zhang, F.; Bhandari, N.; Kan, A.T.; Tomson, M.B.; Yan, C. Prediction of Barite Scaling Risk and Inhibition for Oil and Gas Production at High Temperature. In Proceedings of the SPE International Oilfield Scale Conference and Exhibition, Aberdeen, UK, 14–15 May 2014. [Google Scholar]
  18. Bhandari, N.; Kan, A.T.; Zhang, F.; Dai, Z.; Yan, F.; Liu, Y.; Zhang, Z.; Bolanos, V.; Wang, L.; Tomson, M.B. The Effect of Pressure and TDS on Barite Scaling Kinetics. In SPE International Symposium on Oilfield Chemistry; OnePetro: The Woodlands, TX, USA, 2015. [Google Scholar] [CrossRef]
  19. Lu, A.Y.-T.; Shi, W.; Wang, J.; Venkatesan, R.; Harouaka, K.; Paudyal, S.; Ko, S.; Dai, C.; Gao, S.; Deng, G.; et al. The Mechanism of Barium Sulfate Deposition Inhibition and the Prediction of Inhibitor Dosage. J. Chem. Eng. Data 2019, 64, 4968–4976. [Google Scholar] [CrossRef]
  20. Dai, Z.; Zhang, F.; Yan, F.; Bhandari, N.; Ruan, G.; Zhang, Z.; Liu, Y.; Alsaiari, H.A.; Lu, Y.-T.; Deng, G.; et al. A New Theoretical Model for the Induction Time and Scale Inhibitor Dosage Predictions for Calcite and Barite Over Wide Ranges of Temperature, Inhibition Concentration and Saturation Index. In Proceedings of the SPE International Conference on Oilfield Chemistry, Montgomery, TX, USA, 5 April 2017. [Google Scholar]
  21. Dai, Z.; Zhang, F.; Bhandari, N.; Deng, G.; Kan, A.T.; Yan, F.; Ruan, G.; Zhang, Z.; Liu, Y.; Lu, A.Y.-T.; et al. Development and Application of a New Theoretical Model for Additive Impacts on Mineral Crystallization. Cryst. Growth Des. 2017, 17, 4006–4014. [Google Scholar] [CrossRef]
  22. Dai, C.; Dai, Z.; Zhang, F.; Zhao, Y.; Deng, G.; Harouaka, K.; Wang, X.; Lu, Y.-T.; Paudyal, S.; Ko, S.; et al. A Unified Experimental Method and Model for Predicting Scale Inhibition. In Proceedings of the SPE International Conference on Oilfield Chemistry, Galveston, TX, USA, 8 April 2019. [Google Scholar]
  23. Dai, C.; Stack, A.G.; Koishi, A.; Fernandez-Martinez, A.; Lee, S.S.; Hu, Y. Heterogeneous Nucleation and Growth of Barium Sulfate at Organic–Water Interfaces: Interplay between Surface Hydrophobicity and Ba2+ Adsorption. Langmuir 2016, 32, 5277–5284. [Google Scholar] [CrossRef]
  24. Burton, W.K.; Cabrera, N.; Frank, F.C. The growth of crystals and the equilibrium structure of their surfaces. Philos. Trans. R. Soc. Lond. Ser. A Math. Phys. Sci. 1951, 243, 299–358. [Google Scholar] [CrossRef]
  25. Tomson, M.B. Effect of precipitation inhibitors on calcium carbonate scale formation. J. Cryst. Growth 1983, 62, 106–112. [Google Scholar] [CrossRef]
  26. Mavredaki, E.; Neville, A.; Sorbie, K. Initial Stages of Barium Sulfate Formation at Surfaces in the Presence of Inhibitors. Cryst. Growth Des. 2011, 11, 4751–4758. [Google Scholar] [CrossRef]
  27. Tomson, M.B.; Kan, A.T.; Fu, G.; Thubaiti, M. A Molecular Theory of Mineral Scale Inhibition; NACE Corrosion: Houston, TX, USA, 2004. [Google Scholar]
  28. Jordan, M.M. The Modelling, Application, and Monitoring of Scale Squeeze Treatments in Heterogeneous Reservoirs, North Sea. In Proceedings of the SPE International Symposium on Oilfield Chemistry, The Woodlands, TX, USA, 20–22 April 2009. [Google Scholar]
Figure 1. The comparison of logarithm of predicted induction time from barite nucleation model with experimental data at 4–250 °C and SI = 0.4–2.8. The blue dots are experimental data.
Sustainability 13 08533 g001
Figure 2. The comparison of logarithm of predicted induction time from barite theoretical inhibition models of 18 inhibitors with experimental data. The blue dots are experimental data. All the data were put together for fitting, and the total sum of squares of residuals is 99.86, indicating a good fit.
Sustainability 13 08533 g002
Figure 3. The comparison of logarithm of predicted induction time versus measured induction time. (A) The comparison of logarithm of predicted induction time from previous semi-empirical model with all available data at condition of 4–250 °C and SI = 0.4–2.8. (B) The comparison of logarithm of predicted induction time from modified semi-empirical model with all experimental data at 4–250 °C and SI = 0.4–2.8. Significant improvement of modified model was achieved, especially at high temperature ranges from 90–250 °C.
Sustainability 13 08533 g003
Figure 4. The evaluation of new barite inhibition models of 11 inhibitors that have been extensively studied under various conditions with the range of T = 4–175 °C, pH = 3–8, SI = 0.56–2.74, Ca2+: 0.025–0.1 M, [Ba2+]/[SO42−] = 0.01–100.
Sustainability 13 08533 g004
Figure 5. The evaluation of 7 additional inhibitors on barite inhibition using new protocol. The blue dots are the experimental data under SIbarite = 1.89, T = 70 °C, pH = 6.7, and RBa/SO4 = 1 that are used for model fitting. The orange dots are the experimental data under SIbarite = 2.05, T = 25 °C, pH = 6.7, and RBa/SO4 = 1 and SIbarite = 1.42, T = 90 °C, pH = 6.7, and RBa/SO4 = 1 that are used to validate the protocol and model.
Sustainability 13 08533 g005
Figure 6. The comparison of logarithm of predicted induction time from one-step further barite semi-empirical model of 18 inhibitors with experimental data.
Sustainability 13 08533 g006
Figure 7. The evaluation of experimental data of inhibitors with the same generic name but from different sources (AD) with the prediction from new barite inhibition model under SI = 1.89, T = 70 °C, and Ba/SO4 = 1.
Sustainability 13 08533 g007
Table 1. Parameters in barite theoretical inhibition model.
InhibitorMW per Functional UnitaG per Functional UnitaV per Functional Unit# of Functional Units
BHPMP1377.8116.75
DTPMP1156.482.65
HDTMP1237.495.54
NTMP1007.761.33
HEDP1037.792.12
PAPEMP1505.565.94
PBTC6811.950.34
EDTMP10945.2264.54
PhnAA900.003614.43
HEBMP1350.00129.92
PE13050.1250.03
PVS10751.2174.81
SPCA170711.51735.817
AA/AMPS14010.386.92
PPCA7530.6116.751
PASP11420.293.91
PMAC587.743.22
CMI27469.4295.80.75
Table 2. Parameters in barite semi-empirical inhibition model.
Inhibitora7a8a9a10a11RSS
NTMP−2.47 ± 0.07−1.411329.290.150.180.30
BHPMP−2.19 ± 0.180.33
DTPMP−2.19 ± 0.020.40
HDTMP−2.14 ± 0.100.86
EDTMPA−1.95 ± 0.010.03
HEDP−2.19 ± 0.050.19
HEBMP−3.02 ± 0.050.12
PhnAA−2.72 ± 0.050.09
PAPEMP−2.47 ± 0.090.19
PBTC−2.58 ± 0.090.39
PE−2.24 ± 0.050.29
PPCA−0.69 ± 0.03−1.281007.300.030.130.65
MAC−0.80 ± 0.010.15
PASP−0.95 ± 0.010.32
SPCA−0.19 ± 0.02−1.721229.65−0.010.200.17
PVS−0.28 ± 0.030.05
AA/AMPS−0.45 ± 0.020.02
CMI−0.06 ± 0.03−0.94510.500.030.200.17
Note: RSS is calculated based on sum of squares of residuals per data point. The total sum of squares of residuals with all datapoints are 76.32.
Table 3. Oilfield Condition.
Well #SW%Na+, mg/LK+, mg/LCa2+, ppmMg2+, ppmBa2+, ppmSr2+, ppmCl, ppmSO42−, ppmpH
A16%21,75053011003302517036,8202957.1
B53%18,7804358154101711031,4807607.5
C39%17,760310695480149028,7509857.4
Note: SW% represents seawater injection percentage.
Table 4. Induction time measurement of the mixed inhibitors.
Mixed InhibitorsLogtinh,measured, sLogtinh,predicted, s
DTPMP 0.5 ppm + PPCA 0.5 ppm2.862.69
DTPMP 0.5 ppm + PVS 0.5 ppm3.132.68
Publisher’s Note: MDPI stays neutral with regard to jurisdictional claims in published maps and institutional affiliations.

