Article

A Preliminary Geothermal Prospectivity Mapping Based on Integrated GIS, Remote-Sensing, and Geophysical Techniques around Northeastern Nigeria

1
Exploration Geophysics Section, School of Physics, Universiti Sains Malaysia, Gelugor 11800, Penang, Malaysia
2
Department of Geology, Faculty of Science, Gombe State University, Gombe PMB 0127, Nigeria
*
Author to whom correspondence should be addressed.
Sustainability 2021, 13(15), 8525; https://doi.org/10.3390/su13158525
Submission received: 3 June 2021 / Revised: 21 July 2021 / Accepted: 27 July 2021 / Published: 30 July 2021

Abstract

:
Spatial mapping of potential geothermal areas is an effective tool for a preliminary investigation and the development of a clean and renewable energy source around the globe. Specific locations within the Earth’s crust display some manifestations of sub-surface geothermal occurrences, such as hot springs, a volcanic plug, mud volcanoes, and hydrothermal alterations, that need to be investigated further. The present area of investigations also reveals some of these manifestations. However, no attempt was made to examine the prospectivity of this terrain using the efficient GIS-based multicriteria evaluation (MCE) within the scope of the Analytic hierarchy process (AHP). The integration of remote sensing, Geographic information system (GIS), and other geophysical methods (Magnetic and gravity) was performed to map the promising geothermal areas. Multiple input data sets such as aero-magnetic, aero-gravity, aero-radiometric, digital elevation model (DEM), geological map, and Landsat-8 Operational Land Imager (OLI) data were selected, processed, and use to generate five thematic layers, which include heat flow, temperature gradients, integrated lineaments, residual gravity, and lithology maps. The five thematic layers were standardized and synthesized into a geothermal prospectivity map. The respective ranks and weight of the thematic layers and their classes were assigned based on expert opinion and knowledge of the local geology. This research aims to apply an efficient method to evaluate the factors influencing the geothermal energy prospects, identify and map prospective geothermal regions, and, finally, create a geothermal prospectivity model.

1. Introduction

Geothermal energy is one of the significant energy sources contributing substantially to the global sustainable energy supply drive. Several countries globally, such as Turkey, the U.S.A, France, Indonesia, Germany, Italy, etc., derive a substantial part of their electricity from geothermal energy sources [1,2]. The use of geothermal energy for electricity generation could not be detached from the need for a global shift from environmentally harmful “fossil fuel” means of energy generation to more clean and renewable sources of energy.
For many decades, Nigeria has been unable to generate enough energy to meet its domestic and industrial needs. Nigeria’s current installed electricity generation capacity is put at 6000 MW [3]. It also has a maximum output of 4000 MW that is primarily derived from two primary sources which include: hydro (36%) and gas-fired (fossil fuel) sources with 64% contribution [3]. The fossil fuel means of energy generation that is currently being used has been negatively impacting the safety of this part of the globe. These negative impacts include air pollution, crude oil spillage problems, and gas flaring issues, etc. Hence, there is a need to explore other sources of energy that cause no harm to the environment [3,4]. There is also the need to investigate other healthier and renewable means of adding to the country’s quantum of energy for its sustainable growth and development [3,4].
Moreover, according to Energy Commission of Nigeria (ECN) [3], the overall projected renewable energy sources contribution to the Nigerian energy sector in the short, medium, and long terms are 17%, 19%, and 20%, respectively. According to Moghaddam et al. [5], 1% of geothermal energy is equivalent to 500 times the amount generated through fossil fuels energy sources. Therefore, a tiny percentage of energy generated through geothermal means is about 500% greater than the same amount obtain through the fossil fuel methods.
Several parameters which need to be considered for an optimum occurrence of geothermal resources are shallow Curie point depths, high-temperature gradients, high heat production, low regional gravity anomalies, the presence of structural lineaments, hot or warm spring locations, as well as the outcropping of younger volcanic or granitic rocks, among many others.
The faulted/fractured structural pattern enhances the permeability of rocks. It enables the easy transportation of hot fluids from the Earth’s interior to the surface [6]. Hot/warm springs indicate the occurrence of geothermal energy resources within the subsurface. Additionally, the occurrence of volcanic rocks serve as cap rocks in some known geothermal locations. The low gravity anomaly indicates the localization of volcanoes that appeared within the Earth’s sub-surface. Furthermore, the shallow CPDs and the high-temperature gradients show the high possibility of geothermal resources [6].
The majority of the global geothermal energy fields were first discovered through surface manifestations such as hot springs, volcanic rock outcrops, hydrothermal alterations, mud volcanoes, faults, fracture distributions, etc. However, the surface geothermal indicators (earlier mentioned) need to be further efficiently investigated. However, no attempt has been made in the past to use the efficient multicriteria evaluation (MCE) approach to examine the geothermal potential of this region via integrating multiple data sources such as geological, geophysical, and remote sensing data for the effective mapping of areas of high prospectivity for further detailed investigation. Geothermal prospecting is usually being carried out in phases. The first phase (Preliminary stage) involved having a first view of the areas of the high possibility of geothermal occurrence by integrating several data sources that are of regional extent, followed by the isolation and further investigation of areas of high prospectivity identified from the results of the first phase of the study [5].
Various authors have used this multicriteria evaluation (MCE) procedure and other integrated means of study in several parts of the globe as an effective tool that helped decide on selecting the most appropriate sites for further detailed geothermal exploration work. These include the studies by Coolbaugh et al. [7], who employed remote sensing data to reveal the geothermal potential of Nevada areas of the USA; the study was able to successfully map the locations of geothermal prospects using ASTER images. Abdel Zaher et al. [8] applied aeromagnetic and aerogravity data to deduce the Curie point depth (CPD) information, which subsequently helped understand the geothermal resources of Frafra Oasis of the Western Desert of Egypt. Furthermore, Abdel Zaher et al. [9] also used gravity and magnetotellurics methods to understand the origin of the Hammam Faraun hot spring around the Egyptian Sinai Peninsula. The study was able to map the Hamman Faraun hot spring structures of the Egyptian Sinai Peninsula.
Moreover, Abdel Zaher et al. [10] conducted a regional assessment of the geothermal resources of the Gulf of Suez, Egypt, using temperature measurements from numerous existing oil wells across the study area in addition to gravity and aeromagnetic data to study the sub-surface structural configuration and how it relates to the surface geothermal indicators, e.g., hot springs, etc. Abdel Zaher et al. [11] applied gravity and magnetic data to conduct a geothermal exploration around Siwa Oasis, located in the Western Desert of Egypt. The study used the spectral method to deduced CPDs, heat flow, and geothermal gradients values across the Siwa Oasis area of the Western Desert to unveil the geothermal prospects of this area.
Abdel Zaher et al. [11] further evaluated the geothermal resources potentials of Egypt using a GIS-based method. The study employed input data such as the distance to faults, the Bouguer gravity anomaly, the distance to seismic activity, the CPD, the heat flow, and the temperature variation at depth. The study further mapped areas of better prospects for geothermal occurrences. Another attempt to study the possible target areas for future geothermal exploration around Sinai Peninsular was performed by Aboud et al. [12] via the estimation of the Curie point depth (CPD) isotherm over the place. The study was also able to compute the CPD isotherm that portrays higher geothermal prospects, especially around the eastern parts of the Egyptian Gulf of Suez.
Yalcin and Kilic [13] employed a GIS-based multicriteria decision analysis to study the geothermal resource investigation of the Akarcy basin in Turkey. The study employed several thematic evidence layers and integrated them using the GIS platform to construct a favorability map for its case study area. Noroullahi et al. [14] deduced geological, temperature, and geochemically suitable regions that enabled the evaluation of geothermal favorability of the Akita and Iwate areas of Japan.
Moreover, Moghaddam et al. [5] conducted a spatial analysis and multicriteria decision for a regional-scale geothermal favorability mapping using Fry analysis and the weight of evidence technique. The study produced a prospectivity map via spatial integration of thematic data using a Boolean index overlay and Fuzzy prediction modelling.
Meng et al. [15] attempted to investigate the geothermal resource potentials around the northeastern Chinese Changbai mountain regions via integrating five thematic maps of temperature distribution, distance to fault position, distance to places of hot springs, and distance to graben’s site. A GIS-multi-criteria decision method was used to integrate these thematic maps into a geothermal favorability map for the area. The study revealed areas of high, low, and moderate favorability. Furthermore, Abuzied et al. [16] also conducted a geothermal investigation study around the Gulf of Suez coastal area of Egypt using an integration of remote sensing, GIS, and geophysical techniques. Similarly, Procesi et al. [17] performed geothermal favourability mapping using a geospatial overlay around the Tuscany area of Italy. The study employed several thematic layers and integrated them using a weighted overlay analysis technique in a GIS platform. The study was also able to map new promising areas of geothermal potentials.
Yousefi et al. [18] combined geological, geochemical, and geophysical data sets to develop a geothermal resource map of Iran. The study identified 18 promising zones of geothermal occurrences. It further helped guide decision makers on the most suitable locations for future geothermal investigation in the Iranian geological landscape. Calvin et al. [19] used a remote sensing technique to identify geothermally related minerals that help in the geothermal resources exploration of Nevada areas. The study also recommends some promising target areas for subsequent investigation.
Nishar et al. [20] demonstrated the capability to use thermal infrared to image or identify the surface geothermal features around the Wairakei-Tauhara geothermal field close to Taupo, New Zealand. The study displayed UAV as an advanced means of geothermal resources mapping.
In another study aimed at discovering new geothermal potential zones of Nevada Fish Lake valley using remote sensing data, Littlefield and Calvin [21] employed visible-, near-, and short-wavelength infrared to map geothermal-related mineral occurrences around the Fish Lake area.
Despite the manifestation of some surface geothermal indicators, such as Wikki Warm spring (32 °C), Ruwan Zafi hot spring (54 °C), Billiri Mud volcanoes, Wuyo-Gubrunde basaltic plugs, Kaltungo basaltic plugs, etc., this particular geological terrain had been neglected in terms of geothermal studies by geoscientists and other stakeholders in the energy sector. The only available studies conducted on this locality were the ones that involve the separate use of either geophysical or geological data to study the heat flow, structural pattern, and surface pattern of geological indicators of geothermal occurrences. These include the studies by Obande et al. [22], Ayuba and Nur [23], Aliyu et al. [24], Anakwuba and Chinwuka [25], Kasidi and Nur [26], and Abraham et al. [27], who used lower resolution airborne magnetic data in the study of the Curie point depths (CPDs) and the heat flow pattern of a tiny part of either the Gongola basin or the surrounding sedimentary basins. Others include Epuh et al. [28], who conducted a multivariate statistical analysis of gravity data around the Gongola basin to explore hydrocarbon. Moreover, Epuh and Joshua [29] used gravity data over the Gongloa basin to evaluate the depth of basement interphase and sedimentary thickness. Deeper depth values were found using gravity modeling conducted in the area. Seismic modeling was also done to determine the seismic velocity using the depth-normalized velocity iteration technique. Moreover, Epuh and Joshua [30] used gravity data to analyze the structural configuration in the Gongola basin for possible hydrocarbon exploration. The study revealed the presence of NE–SW and NW–SE structural trends. Bassey et al. [31] conducted an interpretation of gravity data over the same Gongola basin with the aim of understanding the hydrocarbon prospectivity of the area. the study established the structural configurations as well as revealed the areas of greater sediments thickness that could serves as an area of better prospectivity. The presence of horst and graben structural configuration over Gongola basin was established in a study by Shammang et al. [32] using gravity data.
Other studies that used geological information such as hot/warm springs, rock distributions, mud pods, and structural distributions that revealed geothermal indicators include [33,34,35], among others. An overview of the various studies carried out around this important terrain shows that the very effective multicriteria evaluation was never applied to partially integrate all the available geoscientific data that partially impact the geothermal occurrences in this area.
Hence, a GIS-based multicriteria evaluation approach for geothermal prospectivity mapping was employed in the present work to have a better decision guide on areas displaying higher geothermal prospects in this region. This approach used the Analytic hierarchy process (AHP) to better view the geothermal opportunities of this region. Hence, this study, being the first of its kind in the entire Nigerian terrain to integrate multiple geoscientific data using a GIS platform for regional-scale geothermal prospectivity mapping, thus provides or serves as a baseline study upon which a further detailed geothermal prospectivity analysis can be carried out by concentrating on the most significant areas that were reported to be “highly prospective” in the present study. It also serves as the first GIS-based Multi-criteria study that included radiogenic heat sources among its evaluation criteria. Therefore, it provided a prospectivity map that is all-encompassing and highly reliable.
The principal objective of the current research is to employ an efficient method to appraise the factors controlling the geothermal energy prospects, identify and map prospective geothermal zones, and finally construct a geothermal prospectivity map of the present area.

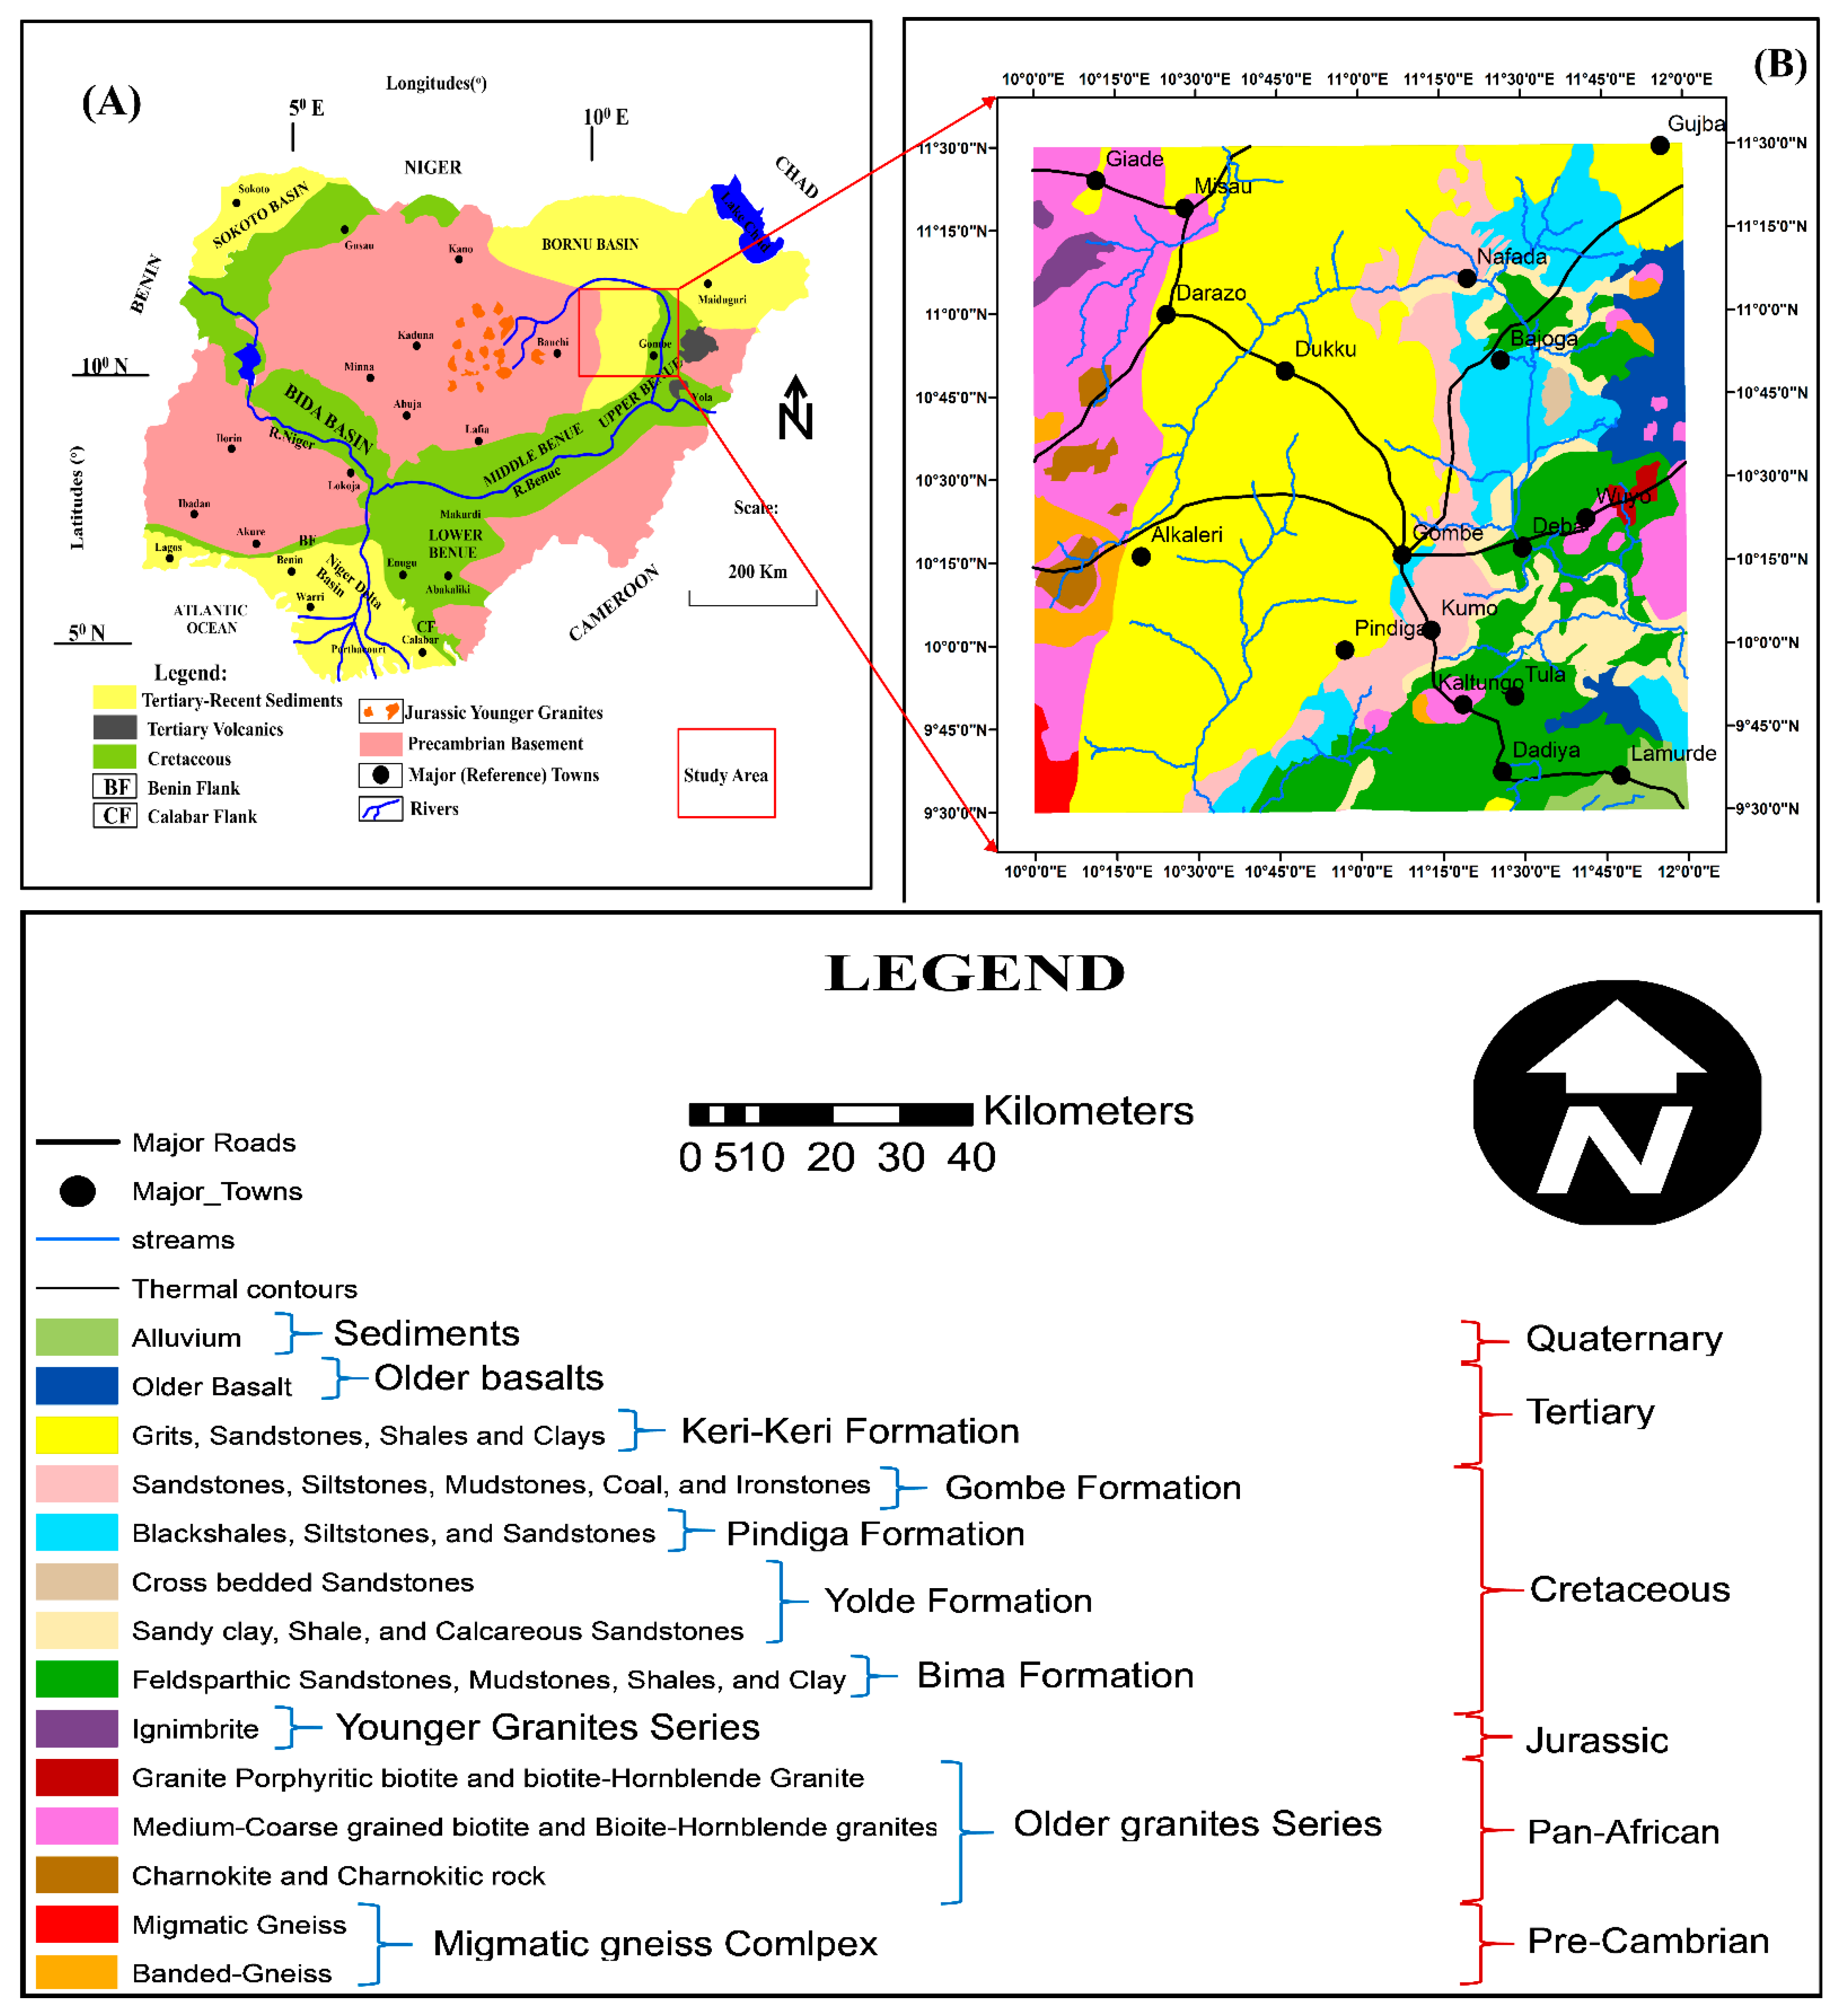
2. Description of the Study Area

The present study area spans from longitudes 10°00′ E to 12°00′ E and latitudes 9°30′ N to 11°30′ N. It lies within crystalline and sedimentary geological terrain popularly known as the Gongola sub-basin of the Benue rift (in Nigeria) and its adjoining basement and volcanic rock outcrops (Figure 1A). Gongola basin is a sub-basin forming part of the intra-continental Benue basin of Nigeria. It lies in a north–south direction covering about 15,000 km2. Surrounding the Gongola sub-basin towards its western regions are the exposures of crystalline basements (Figure 1B). Moreover, towards the east are the exposures of basements and volcanic rocks popularly called the Gubrunde horst and Biu basalt, respectively.
The present area (Northeastern Nigeria) also revealed some surface manifestations of geothermal occurrences such as Wikki warm spring, Ruwan Zafi hot spring, volcanic rock outcrops around Billiri, Kaltungo, Wuyo-Gubrunde, and Lunguda basalts, as well as the mud volcanoes around Billiri town (Figure 1B).
Sediment deposition within the Benue trough spans from the Albian to Tertiary times [36,37]. The oldest sedimentary rock found within the Gongola sub-basin is the continental (Braided/lacustrine/Alluvial fan) Bima Formation. The formation comprises sandstones, shale, mudstones, and clays. The Bima Formation was overlain by the transitional (Barrier Island/deltaic) Yolde Formation during upper Albian to Cenomanian times. It consists of cross-bedded sandstone, shale, and clay stones. It serves as a transition period within which a change from continental to marine environment was recorded.
The final transformation from the continental to marine environments resulted in the deposition of an entirely marine (offshore/estuarine) rock formation known as the Pindiga Formation [37]. Pindiga Formation’s deposition began from the upper Cenomanian to middle Santonian times [37]. The Pindiga Formation consists of black shale, sandstone, and siltstone. A major orogeny occurred during the Santonian times, and this orogeny affected the entire length and breadth of the Benue trough. It also resulted in the folding and upliftments of all the sediments pre-dating its occurrence [38]. The folding and upliftments of the sediments during the Santonian times resulted from reorganising the global tectonic plates [38]. The post-Santonian sediments deposition in the Gongola basin led to the deposition of the continental (fluvial) Gombe Formation during the Campanian to Maastrichtian times [37]. The Gombe Formation comprises sandstones, siltstones, ironstones, coal, and mudstones [37]. During the tertiary period, overlying the Gombe Formation is the continental (fluvial/lacustrine) Keri-Keri Formation [37]. The deposition of the tertiary Keri-Keri Formation occurred in a continental setting [37]. The formation consists of sandstone, shale, and clays.
The Precambrian basements rocks surrounding the western parts of the Gongola sub-basin (Figure 1B) include the Migmatites gneisses, Banded gneisses, and medium-to-coarse-grained biotite hornblende granites. Others include charnokytes and ignimbrites (Figure 1B). The following rock types are found at the eastern parts of the Gongola sub-basin: basalts and porphyritic biotite hornblende granite.
The evolution mechanism of the entire Benue trough has been a subject of debate. However, there are two models regarding the evolution process of this mega-structure (Benue trough): the rift system model and the pull-apart basins model [39]. Many models aimed at providing explanations to its formation process were presented under the rift system model. These models considered the Benue trough to be formed due to the direct consequence of the separation of African and the South American continent. This mechanism led to the formation of the Atlantic Ocean. The basin is considered one of the three arms of the triple junction that failed after initiating at a location beneath the present-day Niger-Delta area. A tensional movement mechanism was proposed as the leading cause of the occurrence of the Benue rift structure [40]. This model was supported by geological and gravitational evidence [40].
However, the existence of an RRF type triple junction below the present-day Niger-Delta basin was proposed by [41]. An RRF triple junction occurrence further shows the presence of an active spreading ridge [41]. The Benue trough was considered a failed arm of the three arms of the triple junction that failed and formed an Aulacogen [42].
The “pull-apart systemic model” proposal reveals that wrenching is the major tectonic process that led to the evolution of the Benue trough provided by [39].
This model was based on geological and geophysical studies that show transcurrent faults as the main dominant structures rather than the normal faults associated with the rift system proposed by the earlier model.

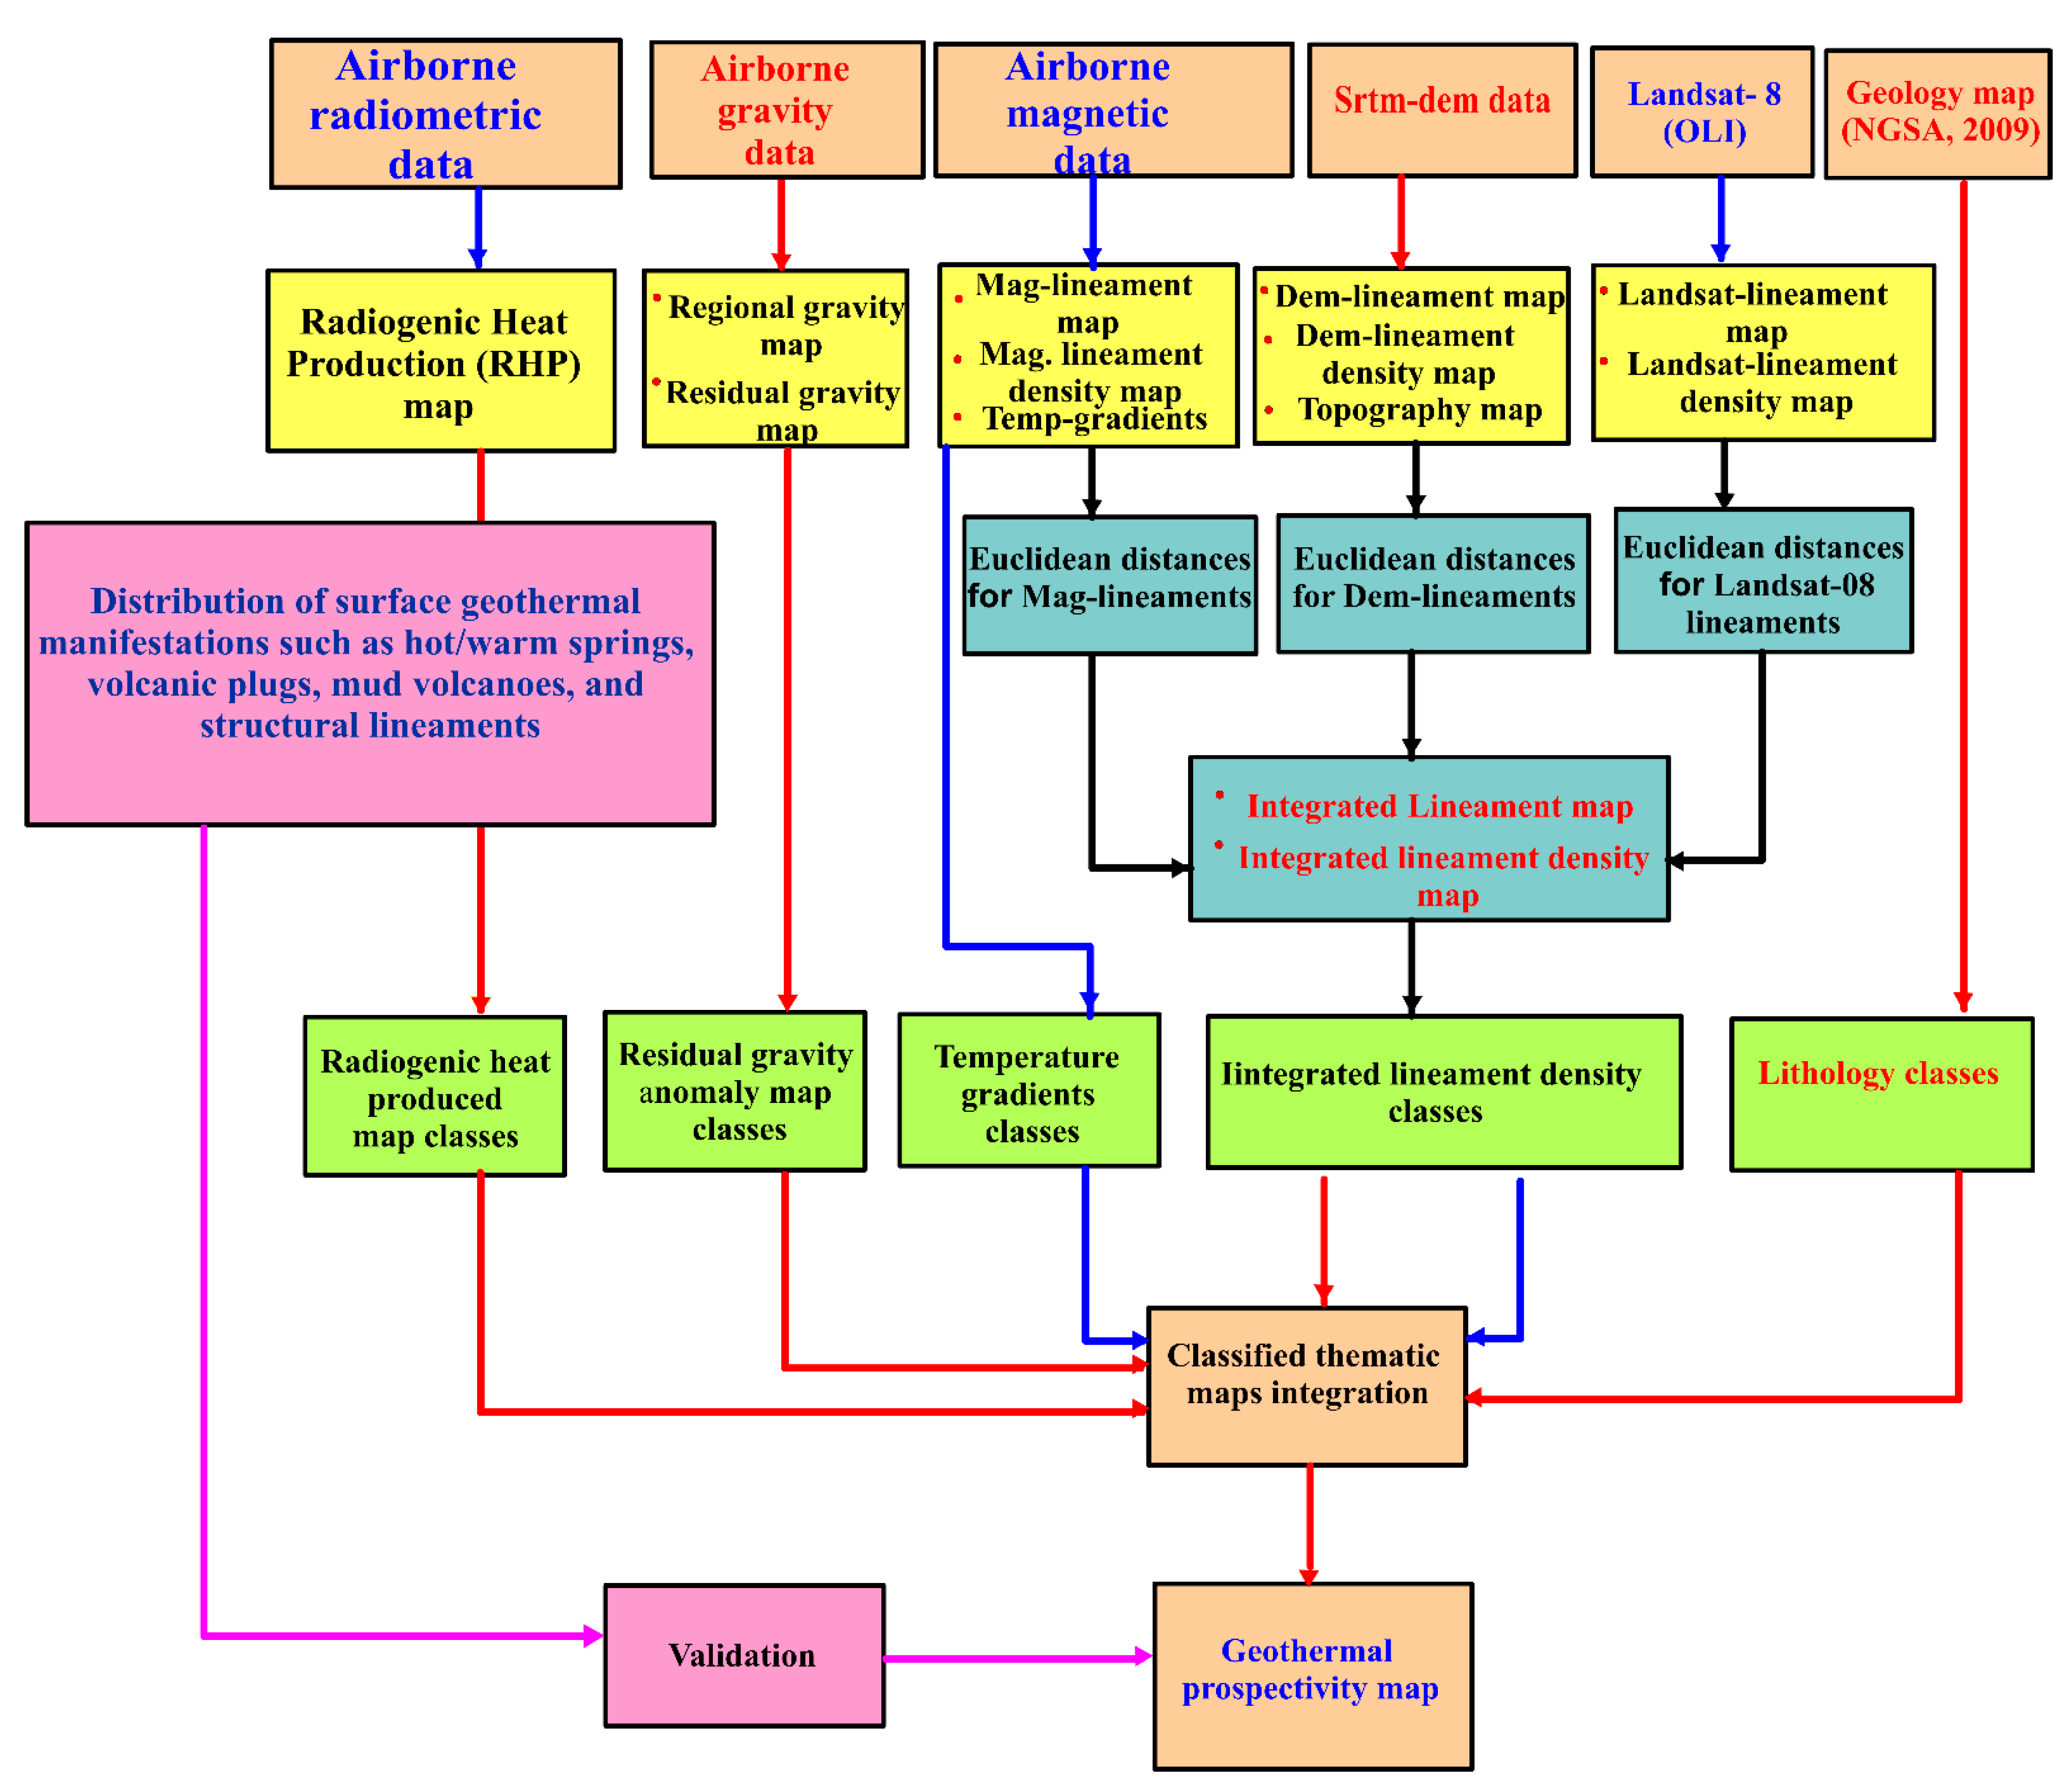
3. Materials and Methods

An integrated approach using GIS, remote sensing, and geophysical data was adopted to appraise the geothermal prospects of this part of Nigeria. The research workflow pattern is summarised in (Figure 2).

3.1. Materials

The resources (materials) used for the current study include; the airborne magnetic data of enhanced resolution, airborne radiometric and gravity data, Shuttle-Radar Topography Mission digital elevation model (SRTM-DEM), Landsat-8 (OLI) data, and geological maps.
The airborne magnetic, radiometric, and gravity data were obtained from the Nigerian Geological Survey Agency (NGSA). Fugro-air services acquired this set of data on behalf of the Nigerian Government between 2004 and 2009. The airborne magnetic, radiometric, and gravity data were obtained with flight line intervals of 500 m, flight height of 80 m, which indicates higher resolution compared to the former 1975–1978 data, whose flight heights of data acquisition is 2 km, a tie line of intervals of 2 km following an NE–SW trend. The flight line intervals of 500 m used and the 80 m flight height used against the 2 km flight height used in the 1975–1978 set of these potential field data show a significant increase in the resolution of the data.
The SRTM-DEM and the Landsat-8 data were obtained around April 2019 from www.earthexplorer.usgs.gov in smaller grids, with each grid having a resolution of 30 m. The downloaded SRTM-DEM and Landsat-8 (OLI) data were then mosaic into single larger units using ArcGIS and ENVI software. The Landsat data was subjected to several digital image processing techniques such as directional filtering methods to enhance and map structural features based on tonal, textural, and shape images.
Several corrections were effected on the aeromagnetic, radiometric, and aero-gravity data by the acquisition company; these include the international geomagnetic reference field (IGRF) correction using the year 2010 theoretical model. Other corrections, such as temporal and diurnal correction, were also affected by the company’s magnetic data before its release for usage. Other corrections applied on the magnetic data in the present study included the reduction to equator correction, which has to do with the realignment of the data on its causative source. The correction was performed to remove the impact of the bipolar effect of the earth that tends to displace the magnetic signal away from its source. Other processing applied to both magnetic and gravity data includes the horizontal derivative filtration and analytic signal computations to establish both the structural and lithologic information resulting from density and magnetic susceptibility contrast.
The radiometric data used was earlier preprocessed before its subsequent processing by Fugro-aero services. The primary purpose of conducting radiometric data preprocessing is to ensure the correction of the observed radiometric data against influences that are unrelated to geological sources. Most of these preprocessing techniques were applied by the acquisition company to ensure the quality control of the acquired data. These include merging signals from different sources, validating the measured data, and checking against missing or spurious data values.
Thus, the radiometric data was later subjected to some corrections that include: terrain clearance variation correction, general background rate correction, which is due to non-geologic sources such as atmospheric radon, instrument background, and cosmic rays were also affected. Other corrections done on the data in the field include data labeling, spectral smoothening, and height correction.
The conventional method of collecting and processing gamma radiation data is to observe 3 to 4 reasonably wide spectral windows. The Potassium (40K) decays displayed an accompanying emission of gamma radiations of 1.46 MeV. Uranium and thorium decays show a corresponding release of radiations of 1.76 MeV and 2.62 MeV, respectively. Thorium depicts high mounts compared to the other two radio-elements concentrations [43].
The gravity data were corrected against the international gravity standardization Net (IGSN, 1971). The Bouguer gravity data gotten was then subjected to regional-residual separation using the low pass and high pass filters with a cut-off distance of 200 km.

3.2. Methods

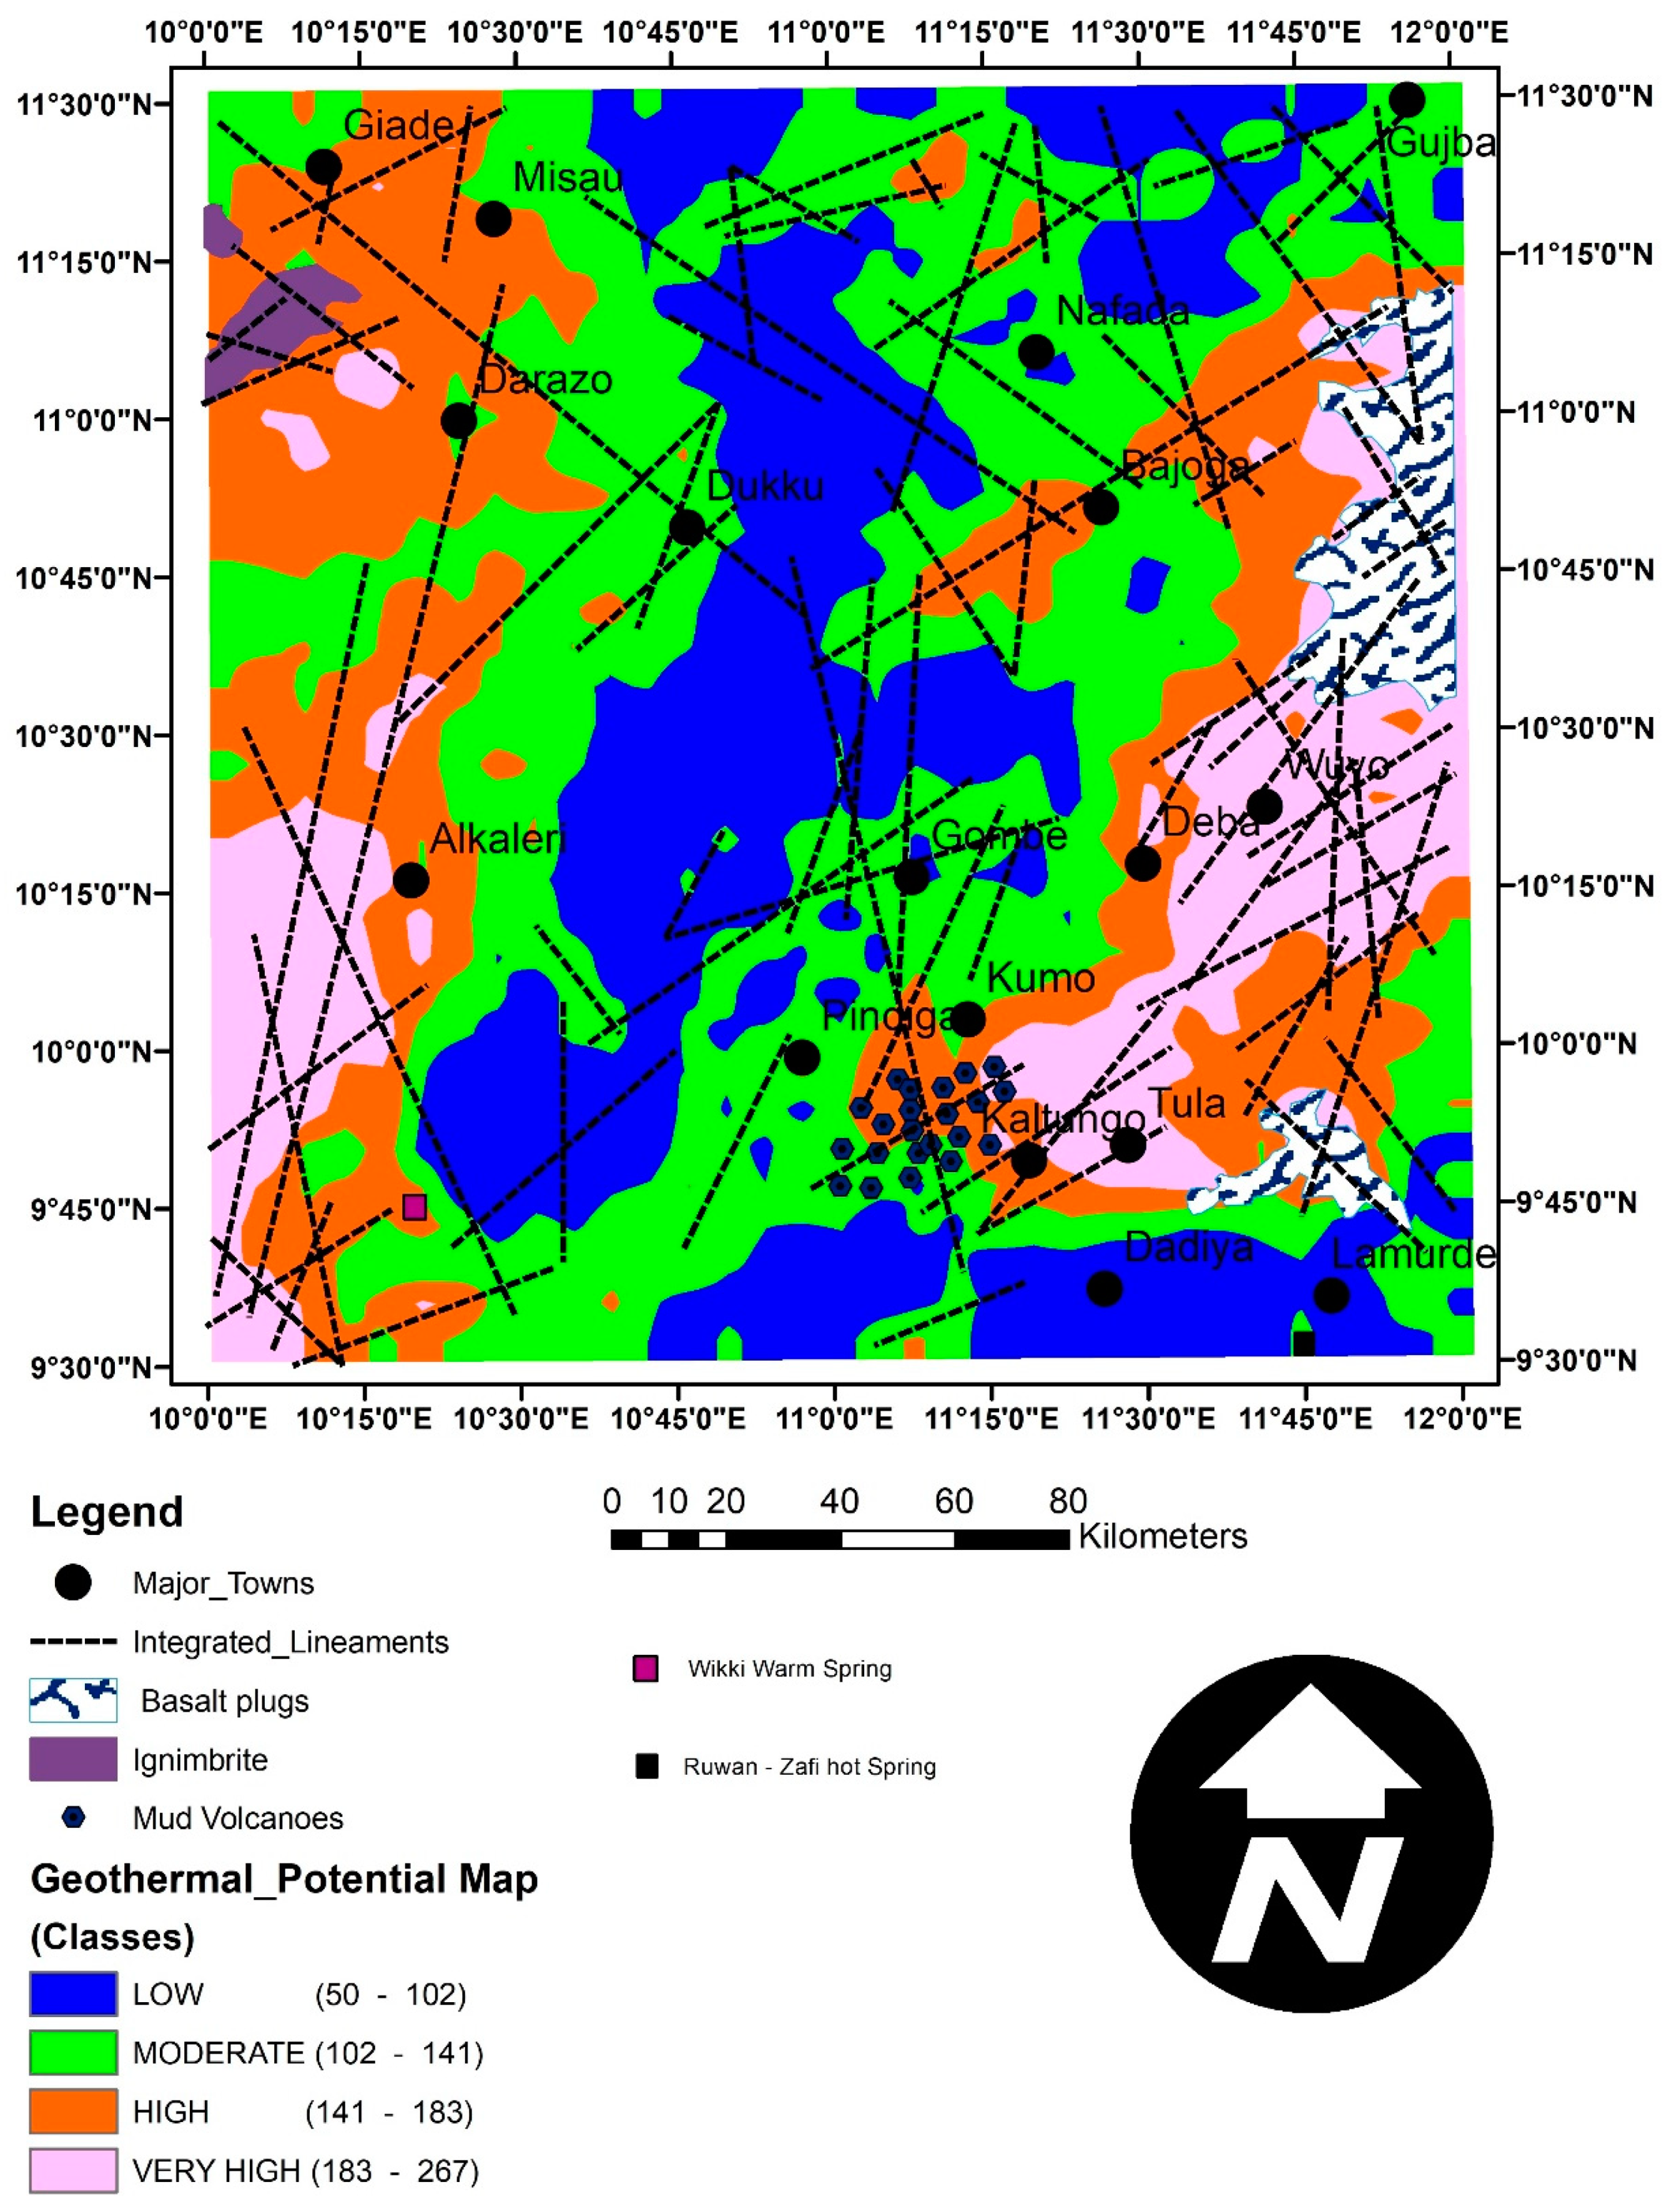
3.2.1. Structural Lineaments Mapping

Structural lineaments distribution, distribution density, and interconnectivity play a significant role in providing a passage through which hot molten rock material (magma) found within the deeper parts of the crusts are transported to the Earth’s surface [31]. Therefore, this process enables heat transmission from the magma chamber to the earth’s surface via the convection process [44]. It accounts for a high heat flow usually recorded along outcrops of younger volcanic rocks.
The surface lineament mapping was conducted on both the SRTM-DEM and the Landsat-8 data by exporting each of the images into Global mapper for lineament extraction. The linear features were then mapped manually based on variation in tone, texture, and other geomorphological appearance of the images. The extracted lineaments were exported to the ArcGIS environments where the lineaments distribution contour map and the lineaments density maps were created using the Kernel density algorithm. [45].
Similarly, the airborne magnetic data were also used in sub-surface lineament mapping. However, the total magnetic field grid that was earlier reduced to the magnetic equator was subjected to regional/residual isolation, and horizontal derivatives filtration technique using the “MAGMAP” tool of the Geosoft-Oasis montaj software. This was performed using the expression below to ensure that magnetic linear features (Faults, Fractures, etc.) are enhanced [46]. The expression is as follows:
T H = T X 2 + T Y 2
where T H is the total horizontal derivatives, T X is the derivatives concerning the x-direction, and T Y is the derivatives concerning the y-direction.
The horizontal derivatives map produced was later imported into global mapper and subsequently to ArcGIS for lineament extraction. Magnetic derived lineaments distribution density contour map, and their distribution density maps were generated following the same kernel density approach mentioned earlier on.
The composite lineaments distribution maps derived from Landsat-8, SRTM-DEM, and magnetic data were subjected to the calculation of their Euclidean distances. This is to evaluate the relationship (the proximity) between them and the surface geothermal indicators [13]. The resulting individual Euclidean distances image maps created were then merged into a single composite structural lineaments map for the study area (Figure 3A) using the spatial analyst tool of the ArcGIS environment.

3.2.2. Curie Point Depth/Geothermal Gradient Estimation

The airborne magnetic data obtained from NGSA was used in the estimation of Curie point depth (CPD) within the study area. This is because Curie point depth reveals or indicates the depth at which the dominant magnetic minerals within the crustal rocks lose their magnetism due to an increase in temperature beyond 580 °C [47,48]. Therefore, calculating this is very significant in geothermal studies, as it reveals thinner areas of the crust have high geothermal gradients and emit a large amount of heat [16]. The CPD estimation was performed on the already generated upward-continued residual magnetic anomaly map of the study area using the centroid depth method of spectral analysis by [49,50,51], as expressed below:
Z b = 2 Z o Z t
where Z b   is the depth to the bottom of magnetic sources, Z o is the depth to the central part of the magnetic sources, and Z t is the depth to the top of the magnetic sources.
The Temperature gradients ( t Z ) were computed as shown in Equation (3). It was used as another important parameter (thematic layer) for the determination of the geothermal potential of the area [16]. Equation (3) is expressed as follows:
t Z = θ Z b
where θ is the Curie temperature and is considered to be 580 °C.
The temperature gradient map (Figure 4) that was computed was then assigned evidence (thematic layer) map weight value (Table 1) that was obtained through the use of analytic hierarchy process (AHP) by employing expert opinions. The assigned weight value was given based on the appparent influence of the temperature gradients on the local geothermal occurrence of the area. The temperature gradients map generated was further classified into five layers (classes) (Table 1).

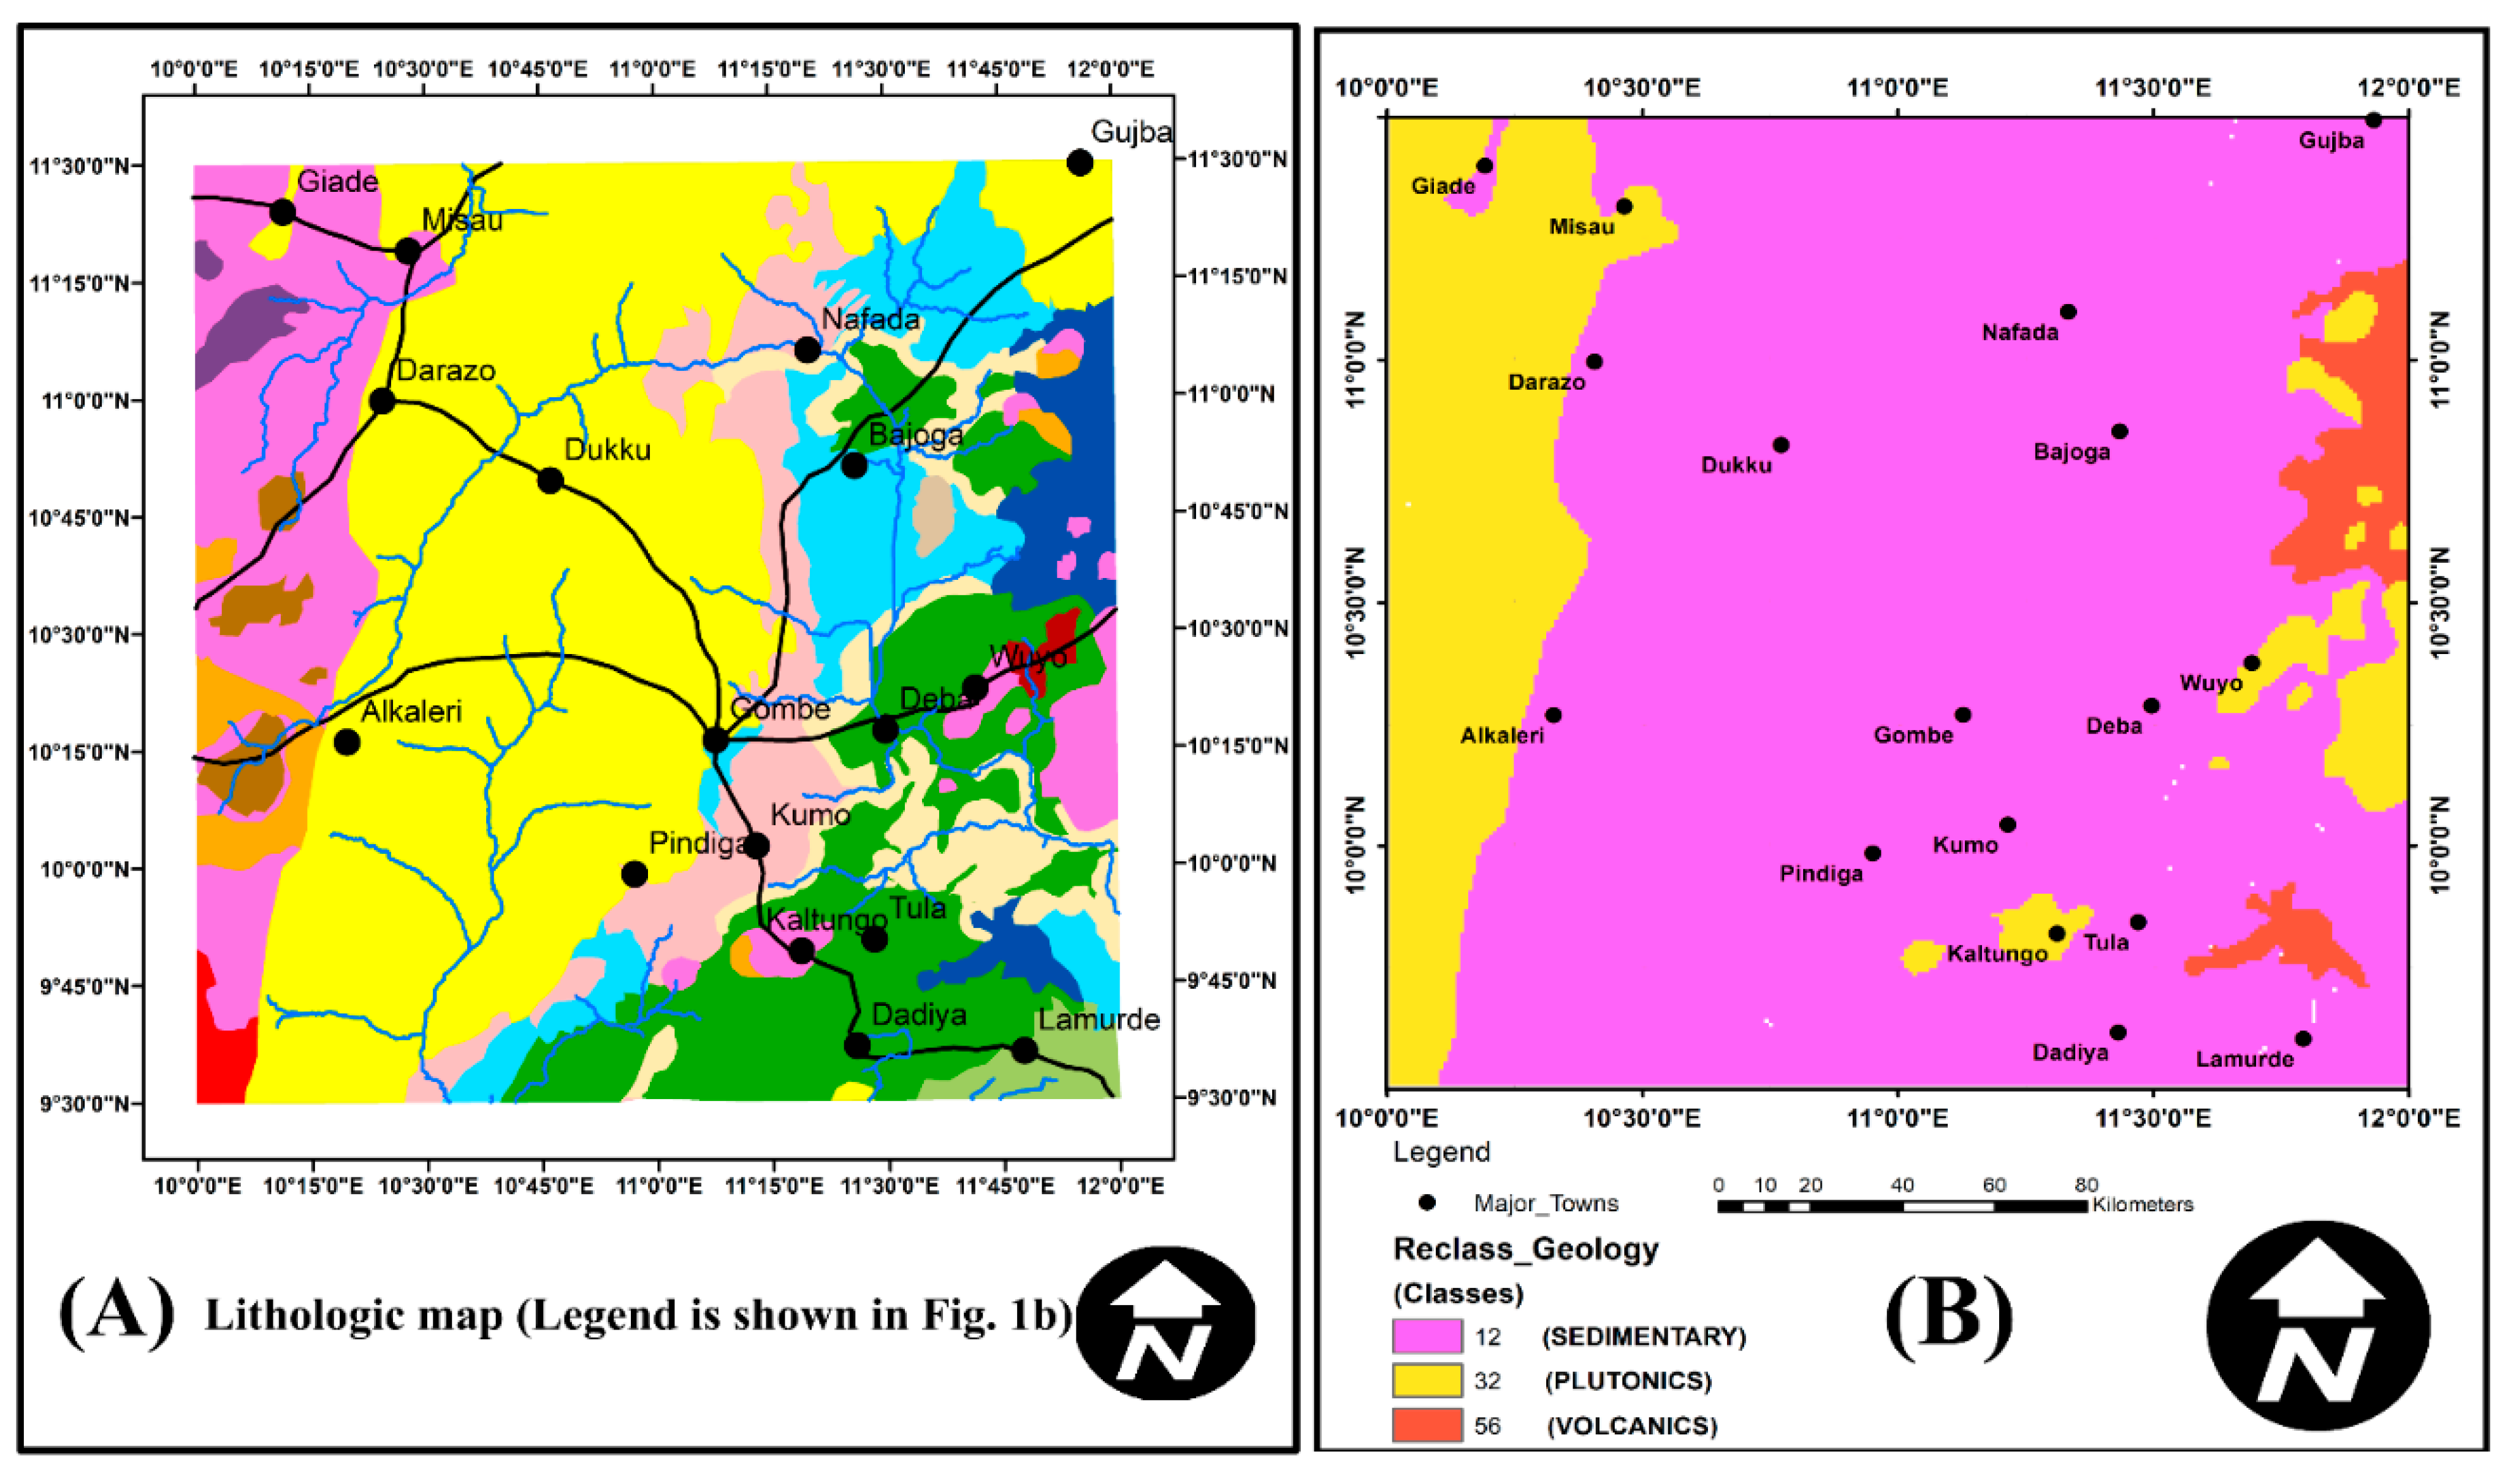
3.2.3. Geological Maps

The geological map of the study area was carved from the larger geological map of Nigeria published by NGSA in the year 2009 (Figure 5A,B). It was used to study the different rock units covering the study area. Before integrating this map with other evidence maps using GIS, it was first assigned an evidence map layer value (Table 1) that is considered proportionate to the rocks’ degree of impact on the occurrence of geothermal resources in an area. The map was then classified further into three (3) main lithology groups (Figure 5A,B) using the analytic hierarchy process (AHP) employing ArcGIS software. The layer weight value (Table 1) was assigned according to each layer’s degree of influence on geothermal resource occurrence. The lithological groups produced include plutonic, volcanic, and sedimentary rock groups. The rocks arranged in order of their degree of impact on the geothermal occurrences from high to low are volcanic, plutonic, and sedimentary rock groups (Table 1).

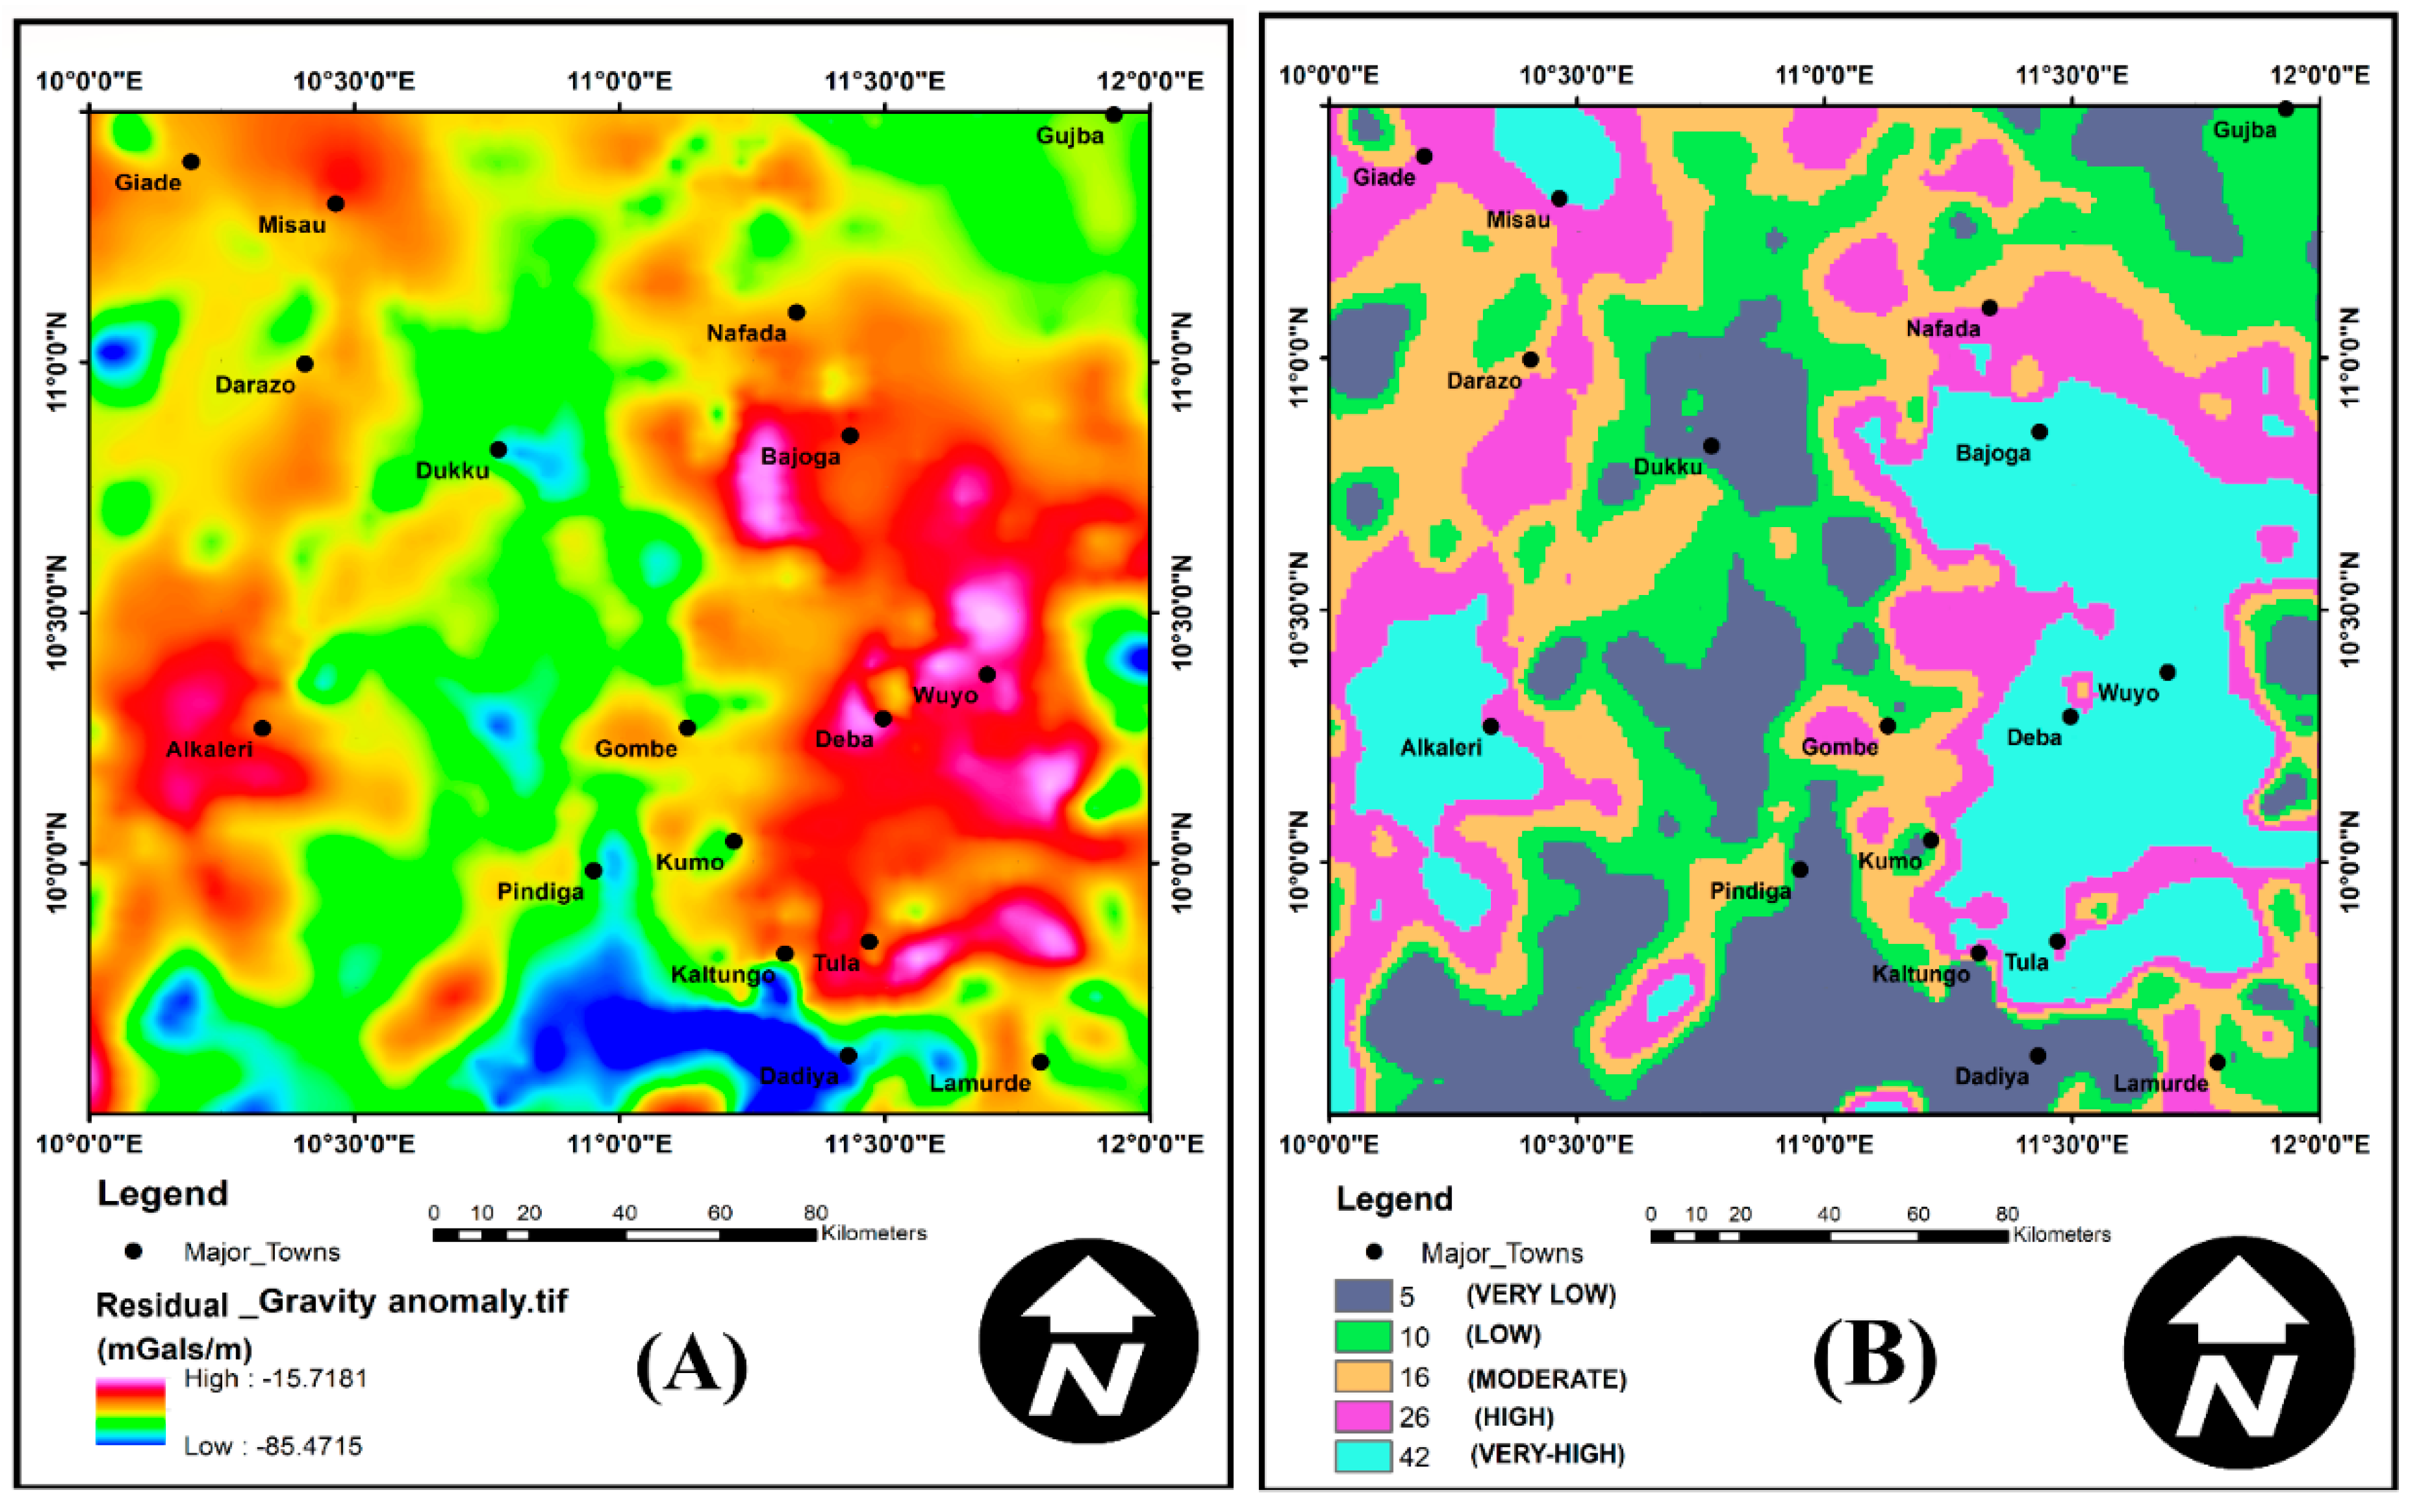
3.2.4. Gravity Data Processing

The airborne gravity data acquired from the geological survey agency of Nigeria (NGSA) was used in generating the Bouguer gravity anomaly map for the current study area. It was further used in the computation of the analytic signal map and the residual gravity anomaly map. The Bouguer gravity anomaly map generated helped reveal the subsurface rock blocks based on their density contrast with the country rocks. Other information disclosed by the Bouguer gravity anomaly map includes estimated thickness of the sedimentary piles and the displayed extent and geometry of a basin [52].
The residual gravity anomaly map produced was also given a weight value corresponding to its considered level of influence on geothermal occurrence using the pair-wise comparison technique in the AHP. The fact that gravity data can significantly help reveal the subsurface lithology, such as hidden plutons and structures that serve as an area of geothermal interest, serves as a zone of weakness that enables the transmission of hot molten magma to the Earth’s surface [4,53]. Similarly, the gravity sub-classes derived from the reclassification of the gravity anomaly map (Figure 6A,B) were also assigned evidence layer weight value (Table 1) based on their assumed level of impact on the geothermal occurrences following a pair-wise comparison method [15].

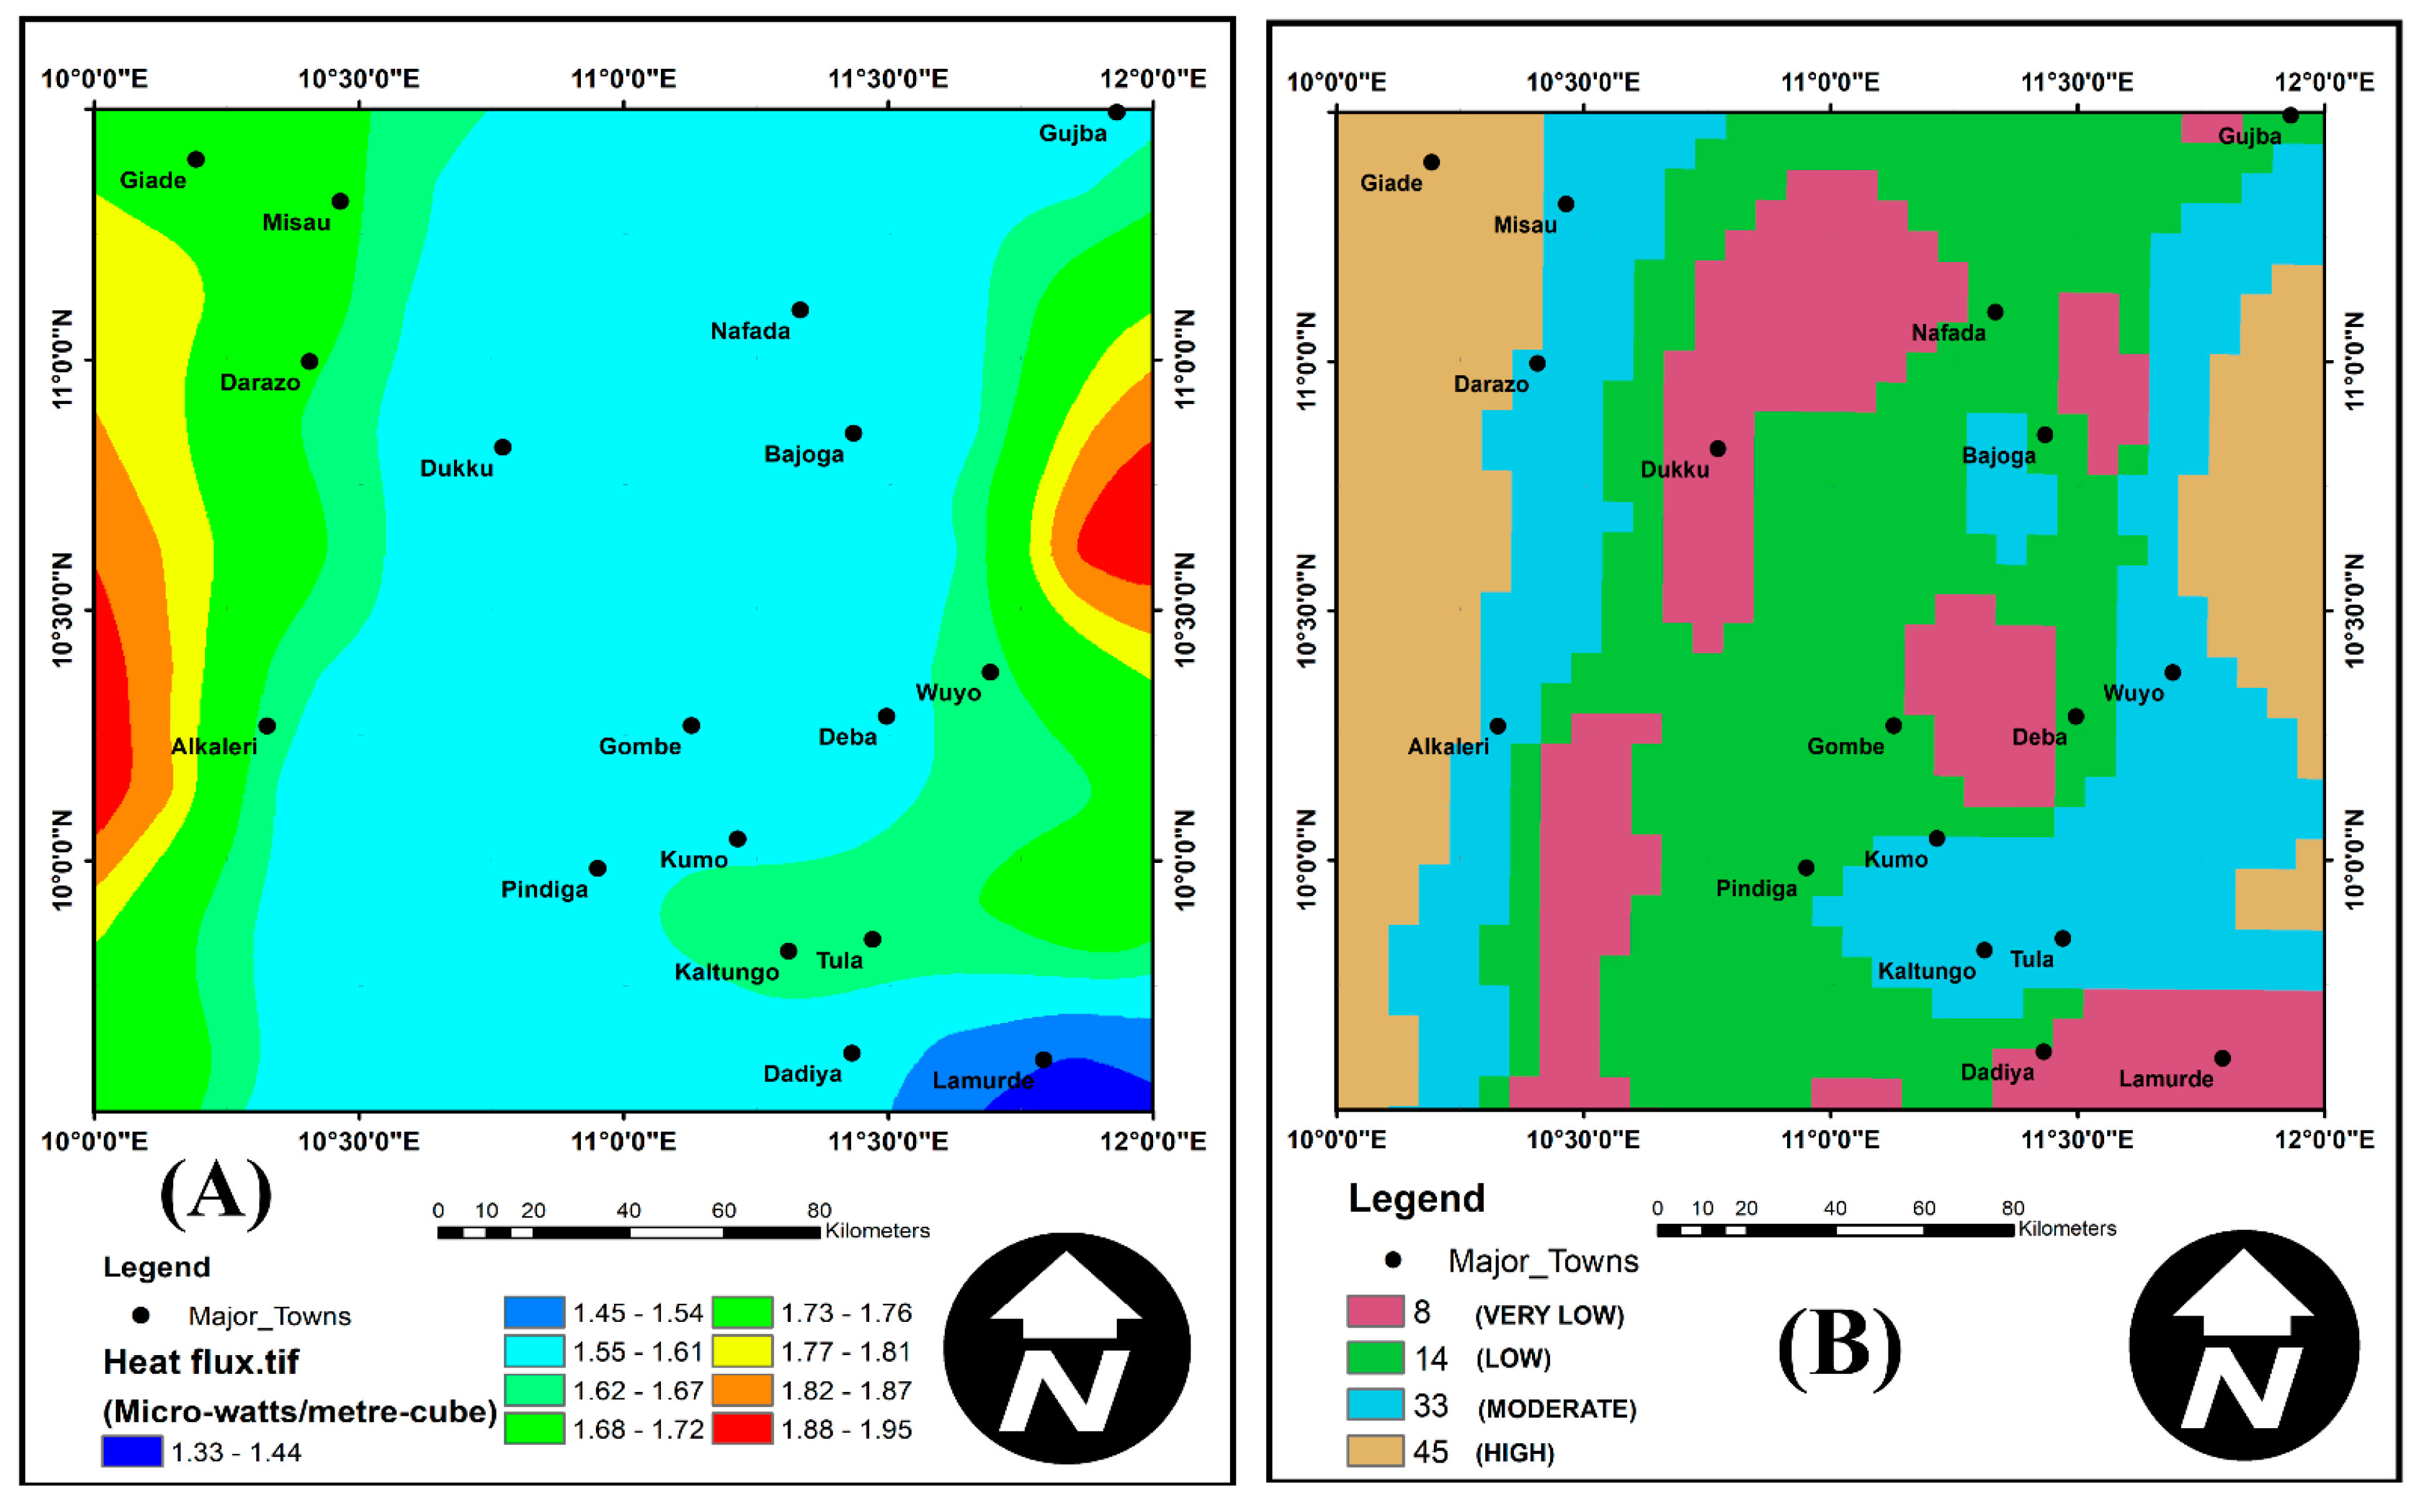
3.2.5. Radiogenic Heat Production

As stated earlier, the airborne radiometric data used for the present study was obtained from NGSA. It actually comprises of equivalent-Uranium (eU), equivalent-thorium (eTh) and percentage-potassium (%K) radio-elements grids. These data grids were earlier subjected to basic filtering and processing by the acquisition company before its release for research purposes.
The primary purpose of using the radiometric data in the current study is to estimate the amount of radiogenic heat production in the present area of focus. It was achieved via the use of the relation provided by [54]. The relation is as expressed below:
RHP   µ W / m 3 = ρ 0.0952   C u + 0.0256   C T h   + 0.0348   C k
where C u is the uranium concentration derived from the equivalent uranium concentration map, C T h refers to the thorium concentration obtained from the equivalent thorium concentration map, %K is the percentage potassium derived from the percentage potassium map, and ρ is the average rock density of the rocks within each block of the study area.
The RHP stands for the total radiogenic heat production for an area, derived from the individual contribution by the three mentioned radio elements as captured in the above equation by [54]. The radiogenic heat derived from each block covering the study was combined using Geosoft, and a total radiogenic heat map for the study area (Figure 7A) was generated. The RHP map (data) was considered in light of the perceived influence it has on the occurrence of geothermal resources.
Similar to the other previously mentioned evidence maps, the RHP map computed also apportioned an evidence map rank value based on its considered relative level of control on geothermal occurrence. This map was further divided into five sub-classes based on the same principle of its degree of impact on geothermal resources occurrence (Table 1). The assigned weight values for each of the evidence layers were obtained using the pair-wise comparison method.

3.2.6. Data Standardization

Processing of the various data type before its integration using the weighted overlay (W.O.) method is essential, as these data types are in different formats such as lines (e.g., faults and fractures) and raster formats (e.g., maps of the computed, temperature gradient, gravity, and heat flow, data) and therefore need to be in a consistent form [15]. Hence, they were converted, homogenized, and reclassified using a uniform scale of reference. The minimum and maximum data standardization methods were adopted as it was considered more appropriate to this kind of study objective. The standardized pixel value of (xij) was fixed between “0” and “1”. For instance, shallow sub-surface temperature gradient requires maximum values while the distance to structural lineaments (proximity to faults and fractures) requires a minimum value. The maximum values needed are as shown below:
X ij = X ij X j min / X ij max X j min
However, the required minimum value for the thematic layers such as distance to lineaments (faults and fractures, etc.) are as provided below:
X ij = 1 X ij X j min / X ij max X j min

3.2.7. Weighting

There are several methods of assigning weight to thematic map layers. These include the ranking method, the rating method, the trade-off analysis method, and the pair-wise comparison method [13]. The pair-wise comparison method was used in assigning relative weight values to the different criteria (thematic layer classes) used in the present study. Comparing two or more evaluation indexes can be performed to establish its relative significance, as explained by [15]. Table 2 below shows an example of the AHP grading pattern (After [15]).
A model created to compute the relative importance weight for each of the individual indices was used. The weighting process was also subjected to a consistency test, where a comparison within the same thematic layers was performed via a judgments matrix created using the scale shown below [15,55]:
A = d 11 d 12 d 1 n d 21 d 22 d 2 n dn 1 dn 2 dnn
However, dij (i,j = 1, 2, 3 …n) denotes the ratio of significance of i to j. Then, the weight is computed via a square root method [15].
The pair-wise method was adopted because the results obtained are controlled by an associated consistency ratio (C.R.) that guides the weighting process. The relation for the computation of the consistency test index is given as:
C I   =   ( λ   max     n ) / ( n     1 )
where n denotes a judgment matrix order, and ʎ max represents the greatest eigenvalue of A, the consistency ratio C.R. = CI/RI. If the C.R. found after the layers comparison is less than 0.1, then a high degree of reliability is obtained; as such, a reliable comparison is achieved [15]. However, if the C.R. is greater than 0.1, then an unreliable (unacceptable) level of consistency is obtained; as such, it needs to be revisited (re-compared). Table 1 shows the selected thematic layers classes, their assigned weight, and the consistency ratio (C.R.).

3.2.8. Weighted Overlay (W.O.) Technique

This technique was applied in the spatial integration of the multiple data sources (input data) to generate a geothermal prospectivity map of the current area of research. This method is performed in a series of ordered operations on the ESRI ArcGIS environments’ input data. Moreover, applying a standard scale of values across all the different input data is essential for effective integration. The following stages were followed while performing the weighted overlay analysis:
(a)
Identification and selection of layers (input data) with varying geothermal influences;
(b)
Preparation of the data into a grid format and subsequent reclassification using a uniform scale of reference;
(c)
Allocating weight to each of the reclassified data grids;
(d)
The allocated weight value for each of the reclassified grid layers (Rec_GRID) is then multiplied by the allocated data type influence, which gives the significance of the layer in the generated model [17]. The individual values of the cell obtained were then summed up to get the final resultant (output) grid (Res_GRID) using the equation below:
Res _ GRID = i = 1 n Cell   Weight Rec _ GRID i   .   Influence data _ type . i
All of the above-mentioned thematic (evidence) maps (structural-lineaments, geology, temperature gradients, heat flow, gravity data) and their associated sub-divisions (classes) that were earlier assigned a layer weight value were subsequently integrated into the geothermal prospectivity (favorability) map. The computed geothermal potential map was also validated by the field distributions of surface evidence of geothermal occurrences such as hot springs, basaltic plugs, and mud volcanoes reported in the work of [34].

4. Results

After integrating the multiple data sources (magnetic, gravity, radiometric, DEM, Landsat-08, and lithology data) using GIS techniques. The results are presented in the form of map plots.

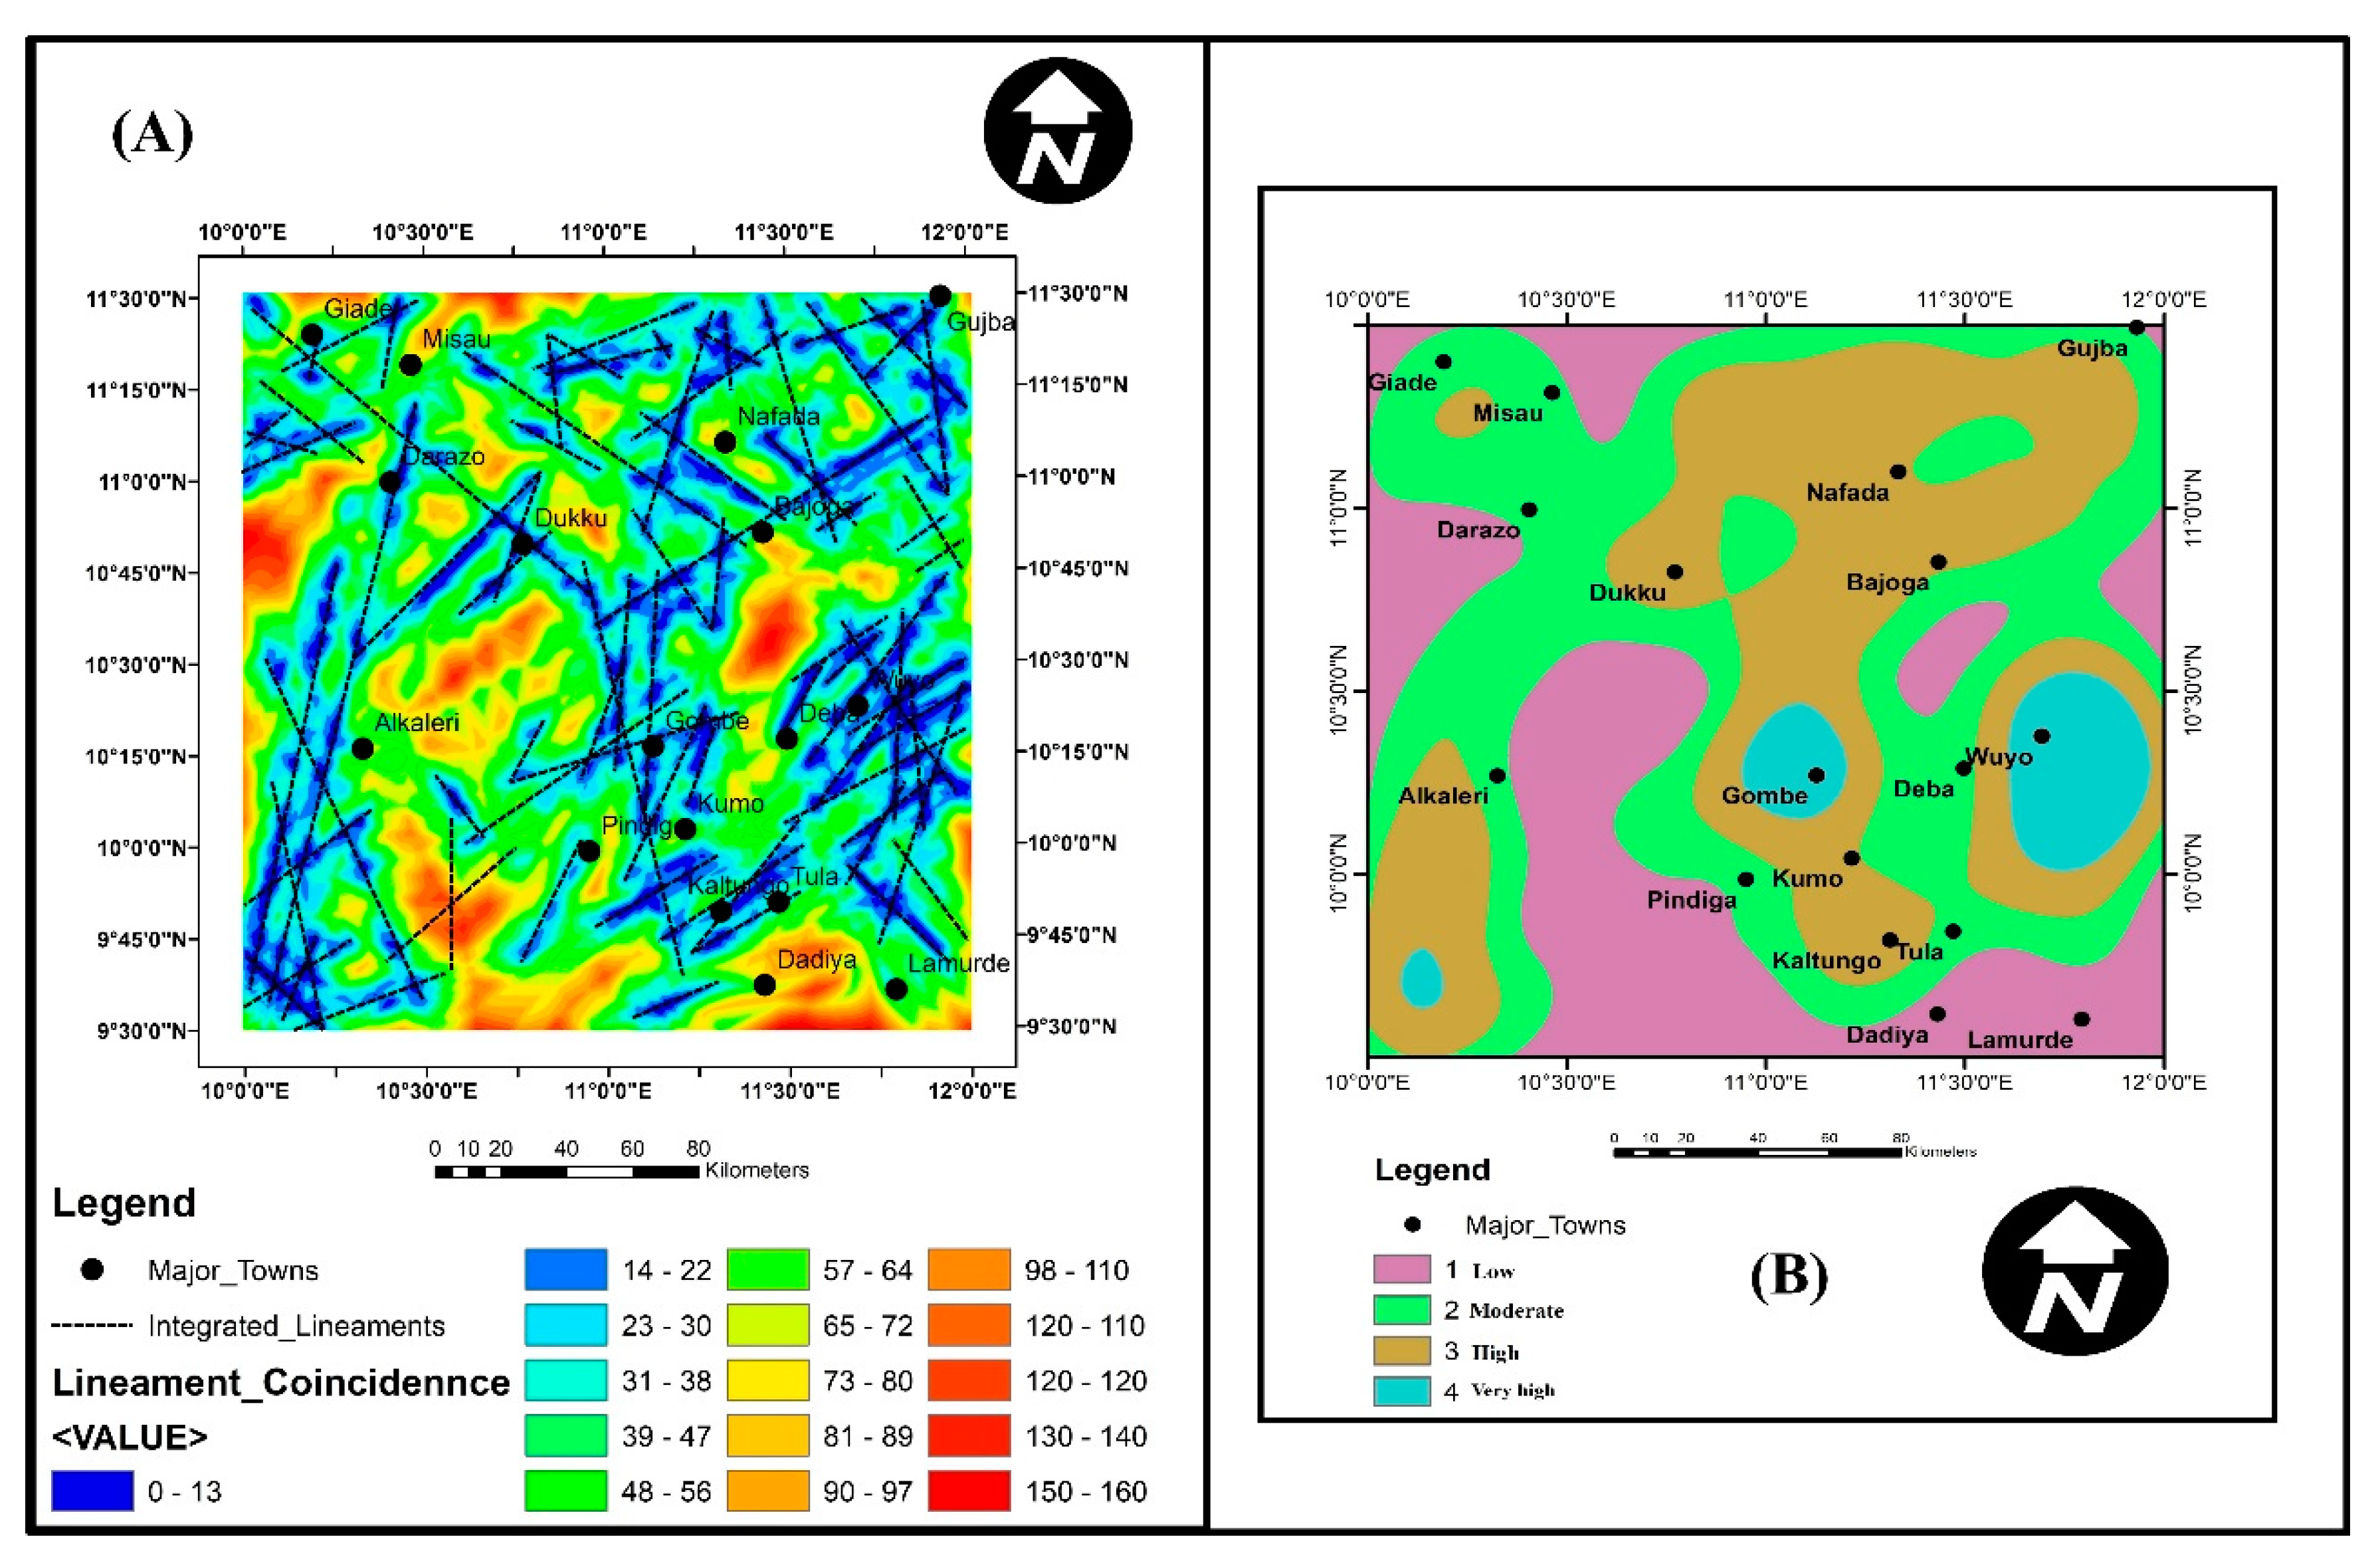
4.1. Integrated Structural Lineaments Map

The visual inspection (study) of the integrated structural lineaments map of the study area (Figure 3A,B) shows the distribution of the structures to be in either N–S, NE–SW, NW–SE, or E–W patterns. However, field studies revealed the distribution of most of the surface geothermal occurrences (manifestations) such as warm springs (Wikki warm spring and Ruwan Zafi warm spring), mud volcanoes, and volcanic rock outcrops to be situated along with a NE–SW structural pattern. It shows the influence of these NE–SW structural lineaments on the emplacements and manifestation of these surface geothermal indicators. Hence, attention was given to the NE–SW structural lineaments pattern to evaluate their Euclidean distances. Moreover, the density of the lineaments distribution, as revealed in Figure 3B, shows the high concentration (density) of the lineaments around the granitic and volcanic rock exposures found around Wuyo, Deba, Kaltungo, Gombe, Bajoga, Dukku, and the southwestern parts of Alkaleri town (Figure 3B). The numerous NE–SW lineament distribution patterns and areas associated with the surface manifestation of geothermal occurrences could be the channel through which heat within the Earth’s crust is transmitted to the surface [53,56].

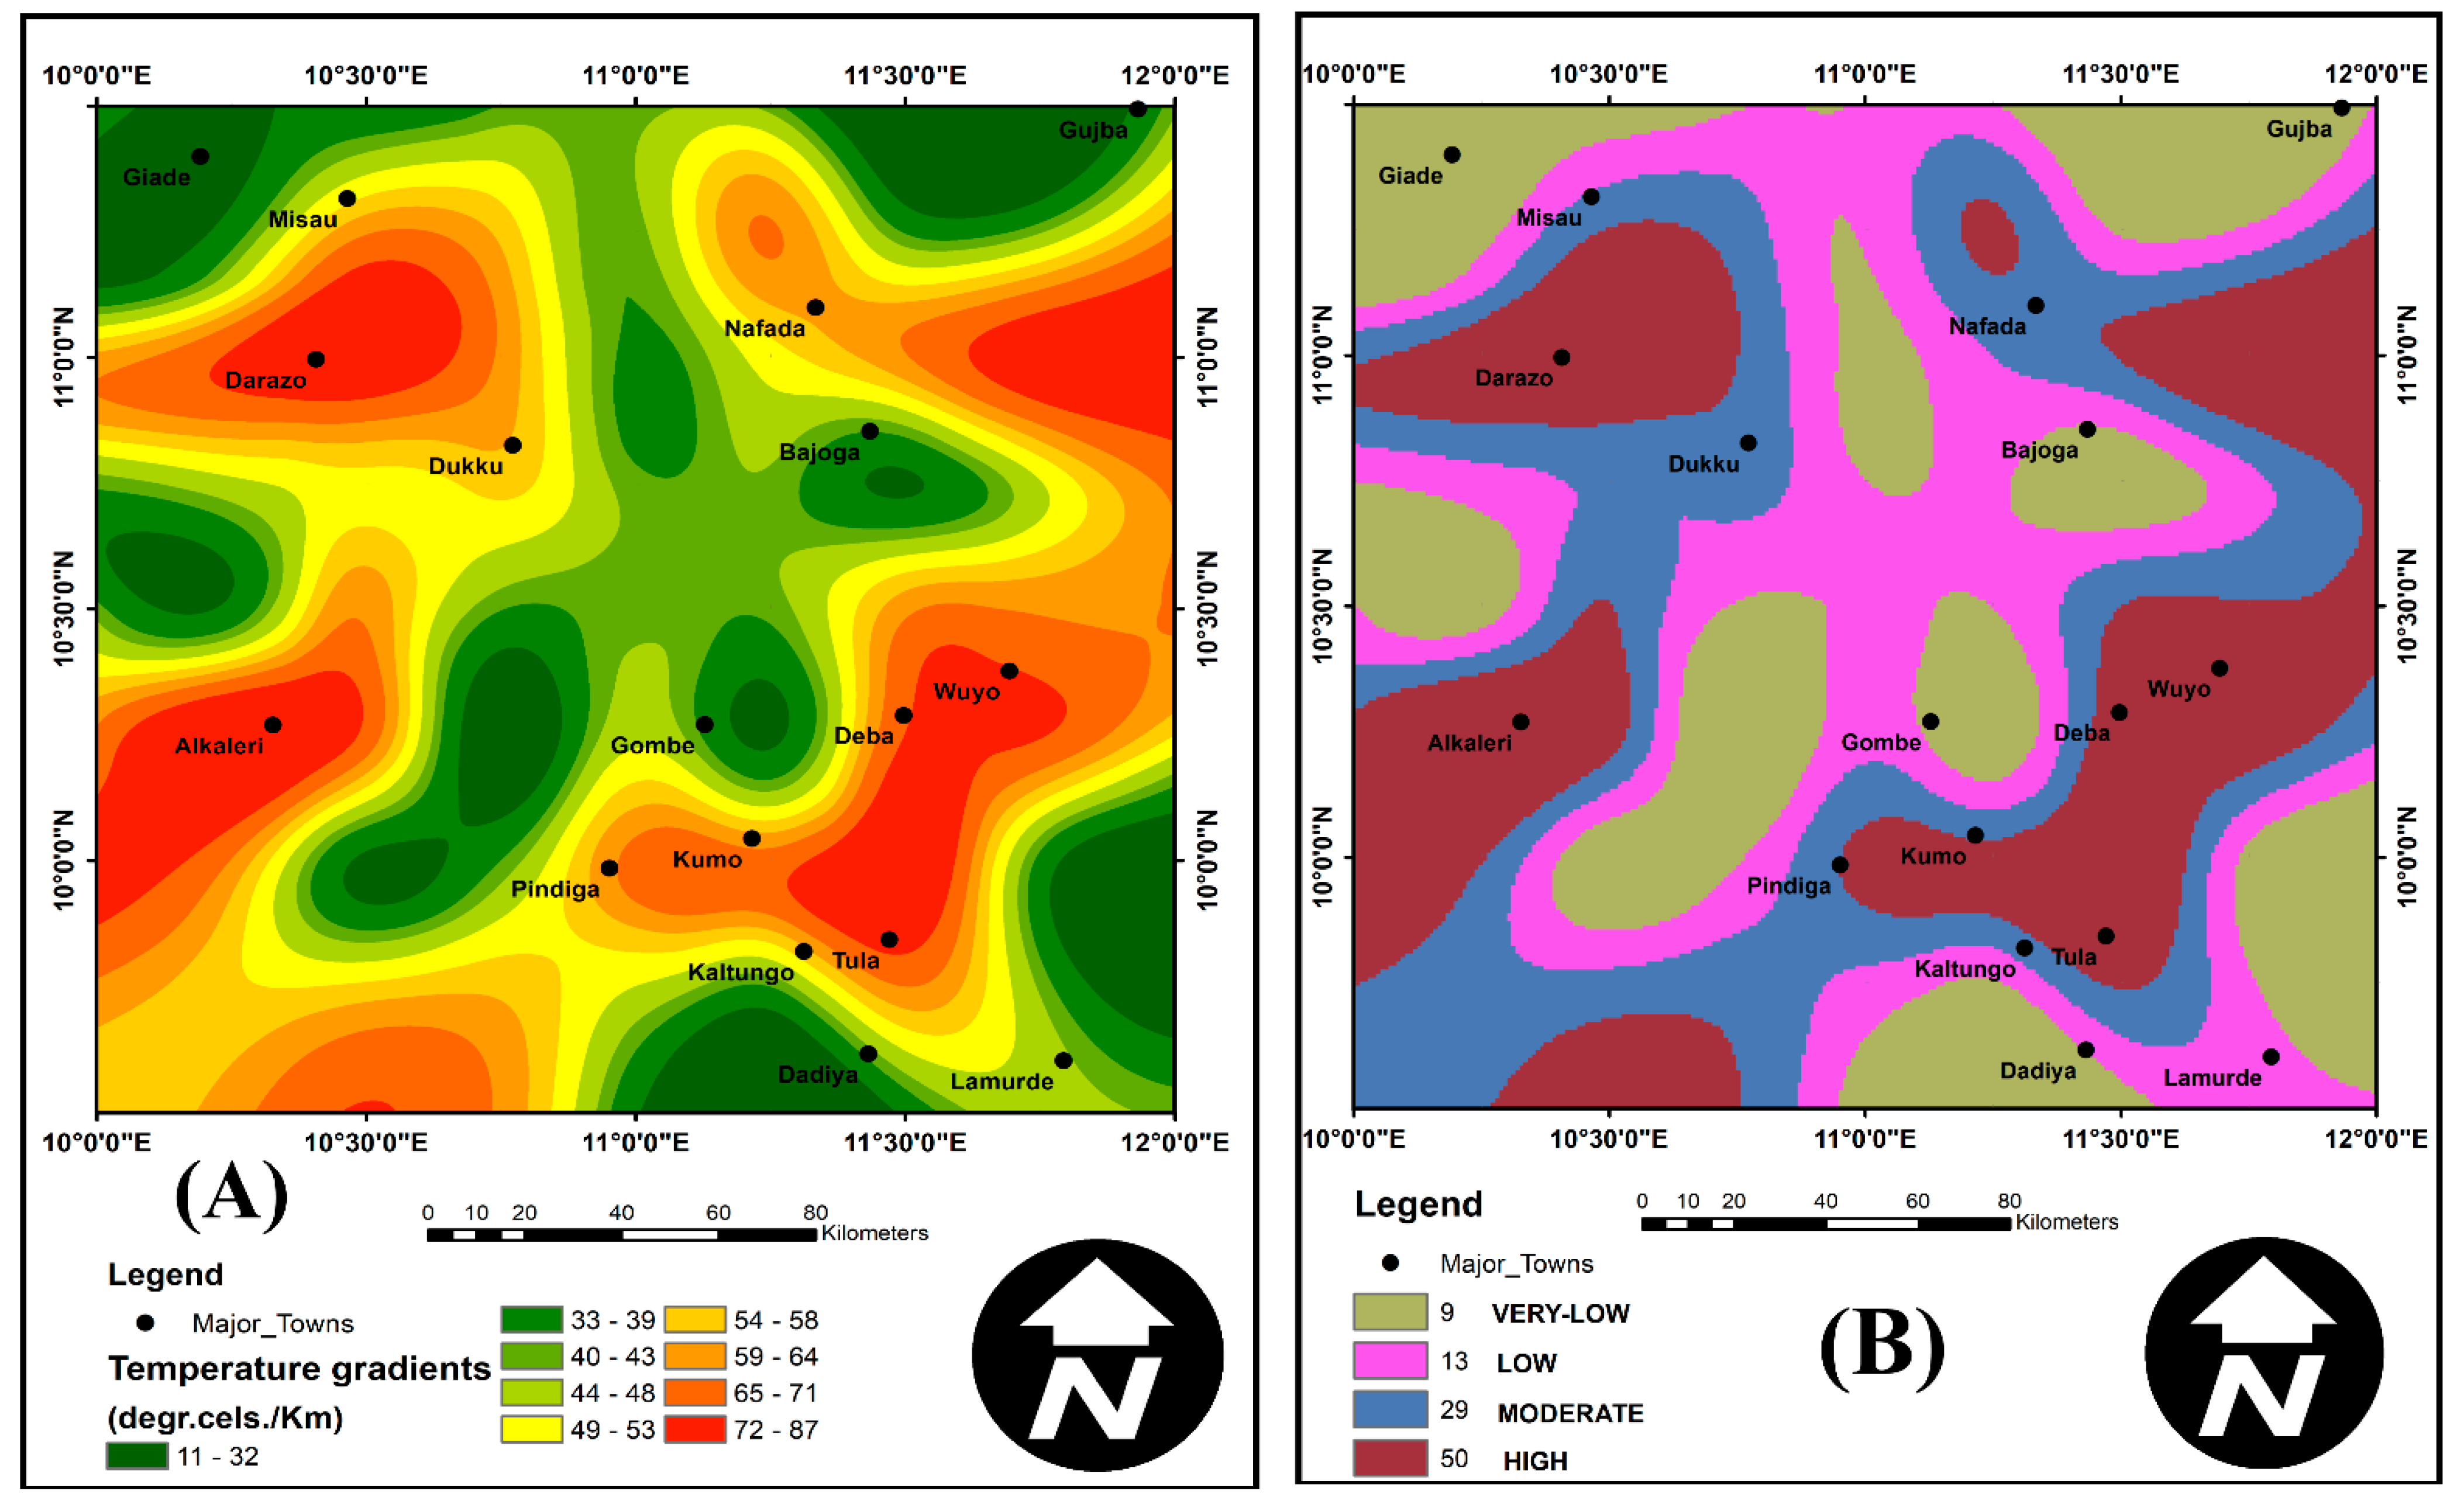
4.2. Temperature Gradients

The temperature gradient information (map) for the study area was derived from the CPD values calculated. Many authors provided the relationship between the Curie point depth (CPD) and the temperature gradient/heat flow parameters were provided by many authors, e.g., [11,12,22,49,50,51,57,58,59], among several others.
The relationship between the two parameters was found to be inversely proportionate in form. It implies that shallow CPD areas usually transmit high heat flow as well as record high-temperature gradients. Therefore, estimating the temperature gradient of a place provides very vital information on the possibility of high geothermal occurrence [60]. The temperature gradient map of the study area (Figure 4A,B) reveals places with shallow, low, moderate, and high values. Very low-temperature gradient values are recorded around the extreme northwest, northeast, southeast, and extreme southern parts of the study area (Figure 4A,B). Other low-temperature gradient zones are found around the western and central parts of the map (near Nafada, Bajoga, Gombe, western Pindiga town). Areas portraying low-temperature gradients (Pinkish colored parts) are found around the central, western, northeastern, and southeastern regions. The moderate- to high-temperature gradient zones represented by the blue- and brown-colored anomalies are found around Darazo, Wuyo, Deba, Kumo, Kaltungo, Tula, Alkaleri, and locations around the north and eastern parts of Nafada town (Figure 4A,B). The high-temperature gradient areas show some relative degree of conformity with the lithological outcrops of the study area, as they are mostly found to be around the granitic, basaltic, and (in some instances) sedimentary rocks. The high-temperature gradient values recorded also agree with the locations of structural lineaments oriented in a NE–SW pattern. As such, the high-temperature gradient could be attributed to the fractural lineaments pattern that could be the channels for the transmission of heat from the deeper parts of the Earth’s surface.

4.3. Residual Gravity Anomaly and Lithology Maps

The careful study of the lithology map (Figure 5A,B) and the residual gravity anomaly map (Figure 6B) shows the distribution of sub-surface plutons as well as their volcanic exposures. These rocks’ outcrops were distinguished as a result of their different density contrasts. It enables the mapping of lithology based on variations in density. Other features revealed by the gravity anomaly map are the structural patterns, which also help show the areas of high geothermal prospectivity.
An analysis of these two maps (Figure 6A,B) shows the occurrence of high to very high prospects for geothermal events around Wuyo, Deba, Bajoga, Kaltungo, Tula, Northern Misau, and an area around Alkaleri town (Figure 6B). The very high geothermal prospects recorded along the above-cited locations could be attributed to the occurrence of very dense granitic and volcanic rocks found around these areas. For instance, the exceptionally high geothermal prospects class that spans from Bajoga down to Tula areas (Figure 6B) in an N–S, NE–SW pattern are found along with the exposures of med-coarse grained biotite hornblende granites, tertiary basalts, porphyritic biotite hornblende granites, banded gneiss, the Bima Formation, and Yolde and Gombe Formations
Other regions that portray high to very high prospects based on density contrasts derived from the residual gravity anomaly map are locations around Alkaleri and Misau towns found around the western and the northern parts, respectively (Figure 6B). The two high density (highly prospective) zones coincide with the exposures of medium-coarse-grained biotite hornblende granites, charnokytes, migmatic gneiss, and banded gneisses.

4.4. Radiogenic Heat Flow

The radiogenically derived heat production (RHP) map (Figure 7A) of the study area is one of the essential decision criteria employed to evaluate the geothermal prospects of the current location of study. As stated earlier, the radiogenic heat-produced map was derived using Equation (1) provided by [54].
A visual study of this map shows two prominent areas of higher RHP values. These areas include the Wuyo-Gubrunde horst located at the eastern part of the study area and the Alkaleri basement complex, rock areas which are situated at the western parts of the study area (Figure 7A). Moreover, earlier geological and geochemical studies of rocks around the northeastern part of Nigeria by [61,62,63,64,65,66,67] reported anomalous uranium concentrations around the Wuyo Gubrunde horst of Northeastern Nigeria. Therefore, the high radiogenic heat production recorded by the present work also conforms to the earlier uranium enrichment findings reported by the previous authors using geochemical methods.

5. Discussion

Multicriteria evaluation (MCE) is an active tool used to solve decision-making problems/matters through multiple-input data integration [68]. The main goal of using the MCE technique is to help examine selected probabilities based on multiple evidence layers. Hence, the use of MCE in a GIS platform helped in the classification, examination, and reorganization of the available data concerning the choice probability for planning. The analytic hierarchy process (AHP) is a multiple criteria decision method that can assist a decision maker in making a decision when confronted by numerous, complex, conflicting, and subjective layers [68]. The five thematic layers of temperature gradients, radiogenic heat, gravity, lithology, and structural lineaments were generated, processed, and integrated to obtain a favourability map of the research area.
Moreover, the multicriteria evaluation (MCE) used in the present study has several advantages that include the processing of extensive data that spans a large area of land, the investigation of present and prospective geothermal fields, and attaining a more organized as well as a more precise outcome through constricting the target zone.
The geothermal favorability map (Figure 8) generated after integrating the various input layers (thematic layers) shows areas of variable degrees of favorability. Four main classes of favorability were delineated; these include the low, moderate, high, and very high categories. The low potential class (50–102) is represented by the blue-colored anomalies that extend from the southwest to the north/northeastern parts of the study area. This anomaly was observed to be located mainly within the cretaceous sedimentary sections of the research area. Another prominent geothermal low potential anomaly class was around the extreme southeastern part near the Dadiya and Lamurde anticlinal areas.
The intermediate geothermal potential class is represented by pale green-colored anomalies that ranged from 102–141 in the geothermal favorability map (Figure 8). These anomalies could be found mainly around the central parts of the map (Figure 8).
It could also be seen occupying locations near the eastern and the western parts of the map with yellow-colored anomalies. These anomalies are found around the towns of Giade, Misau, Darazo, Bajoga, Deba, Kumo, Kaltungo, and the northern part of Nafada town. A very high potential geothermal prospects class (183–267) is found at the map’s extreme western and eastern sections.
The field information from these two locations reveals the separate exposures of granitic and basaltic plugs around the areas of Alkaleri, Wuyo-Gubrunde, Billiri, and Kaltungo. Moreover, the basaltic plugs found between the Wuyo and Gubrunde regions tend to be oriented along with the study area’s dominant NE–SW structural trend, suggesting its structural control [33].
The high to very high geothermal potential class (Orange-Pinkish colored anomalies) also agrees (conformed) with the field distribution of the following geothermal indicators viz; Wikki warm spring (32 °C), Ruwan—Zafi Hot spring (54 °C), mud volcanoes around Billiri and Kaltungo areas, and the distribution of the volcanic rocks near Billiri-Kaltungo areas. The distribution of the surface geothermal indicators within the moderate to very high potential class helps validate the prospectivity map created.
The current geothermal prospectivity map shows the regions of greater possibility for geothermal energy occurrences, indicating that the Wuyo–Gubrunde areas and the Billiri–Kaltungo areas, displayed a very high potential for geothermal occurrences, as represented by an extensive NE–SW oriented anomaly which coincides with a lot of regional structural lineaments patterns [69]. The anomaly spans numerous towns such as the Billiri–Kaltungo area, Tula, Deba, Wuyo, and the eastern part of Bajoga shows multiple field exposures of granites, basalts, and mud volcanoes. The distribution of these surface manifestations along regional tectonic stress areas shows the relationship between the formation mechanism of the Benue rift itself. Furthermore, the expression of another high geothermal potential anomaly near Alkaleri and the western parts of Darazo town, whose lithologic outcrops show the presence of older and younger granitic rocks as well as the location of Wikki warm spring which prove the correlation between the geology, tectonic structural features, and the areas of shallower CPD anomalies/high-temperature gradients [70].
Hence, the sections of the study area displaying shallow CPDs/high-temperature gradients are ascribed to crustal thinning, magmatic rising, and fracturing and faulting methods that ensued throughout the development mechanism of the Benue basin in the Jurassic periods [36].
The majority of the parts portraying moderate to high temperature gradients agree wholly or partially with the study area’s basement/volcanic rocks exposures. For instance, anomalies close to Alkaleri coincides with migmatite gneiss, banded gneiss, and rock outcrops. Furthermore, anomalies found near parts of Darazo also conform with rock outcrops of biotites hornblende granites, ignimbrites, and the fringe of the Keri-Keri Formation. Wuyo town and its environs are characterized by exposures of basalts, banded gneiss, biotite hornblende granites, and porphyritic biotite hornblende granites and also conform to moderate to high temperature gradient anomalies. The areas of Nafada, Deba, and fragments of Tula demonstrated a moderate level of conformity with their respective lithological outcrops. Nevertheless, a significant section of the regions showing low to very low temperature gradients agree to the sedimentary rock exposures of Pindiga, Gombe, and portions of the Keri-Keri Formations of the Gongola basin and are found to be less conductive.
An earlier study by [71], which used bottom hole temperature data from the nearby Bornu basin, shows temperature gradients that range from 30 to 40 °C/km. It also has an average value of 34 °C/km. This value is lower than the average value of 50.2 °C/km reported in the current research. The high-temperature gradients obtained from the present study compared with the [22,35,71] could be attributed to the localization of the bottom hole temperature data used in those studies against the present study that used magnetic data is more expansive extensive in coverage.
The principal result of this study is the generation of the very first ever produced geothermal prospectivity map of the present area of focus which highlights new promising regions of geothermal potential. This result guided stakeholders and investors in the power sector towards selecting the best sites for siting an exploratory well.

6. Conclusions

A preliminary (reconnaissance) study of the geothermal prospectivity using a Multicriteria evaluation approach on a case study of Northeastern Nigeria was conducted successfully, and it is a global contribution towards renewable energy exploration.
The study reveals information that can assist in deciding on locations with better geothermal prospects that can be subjected to further detailed investigation in the future.
The new areas of promising geothermal potentials identified include Wuyo, Nafada, Bajoga, Tula, Darazo, and Alkaleri and are found to be distributed at or closer to zones where the outcropping lithologies have high lineament densities, high heat flows, high-temperature gradients, and are closer to granitic or basaltic rocks outcrops. Hence, these surface geothermal indicators validate the accuracy of the potential geothermal map created.
This research has demonstrated the capability of the GIS as a vital tool that can integrate multiple and dissimilar data sources into a significant geothermal prospectivity map. It also provided the first set of information to geoscientists and other stakeholders in the sustainable and renewable energy sector about the possible geothermal prospects of this part of the globe. Therefore, this contributes to the global sustainable energy drive via exploration for new areas of higher geothermal prospects.

Author Contributions

A.Y. conducted data processing and integration and wrote the first draft of the manuscript. L.H.S. checked the data, analysed it, and secured funding; I.A.A. analysed the data and made corrections on the first draft of the manuscript. All authors have read and agreed to the published version of the manuscript.

Funding

This research received financial support from the Nigerian Tertiary Education Trust Fund (TETFUND) and “RUI Grant, Burning in the Southeast Asian Maritime Continent: Solving Smoke Direct and Semi-Direct Radiative forcing through Aero Net and MPLNET constraints, 1001/PFIZK/8011079”. We also received funds that covered publication costs from the Universiti Sains Malaysia.

Institutional Review Board Statement

Not applicable.

Informed Consent Statement

Not applicable.

Data Availability Statement

Not applicable.

Acknowledgments

The authors wish to thank the School of Physics Universiti Sains Malaysia for providing them with the various software used to process the magnetic data. We also acknowledged the financial support rendered by the “Tertiary education Trust Fund (TETFund)” and “RUI Grant, Burning in the Southeast Asian Maritime Continent: Solving Smoke Direct and Semi-Direct Radiative forcing through Aero Net and MPLNET constraints, 1001/PFIZK/8011079”.

Conflicts of Interest

The authors declare no conflict of interest.

References

  1. Guo, Q.; Wang, Y. Geochemistry of hot springs in the Tengchong hydrothermal areas, Southwestern China. J. Volcanol. Geotherm. Res. 2012, 215–216, 61–73. [Google Scholar] [CrossRef]
  2. Baioumy, H.; Nawawi, M.; Wagner, K.; Arifin, M.H. Geochemistry and geothermometry of non-volcanic hot springs in West Malaysia. J. Volcanol. Geotherm. Res. 2015, 290, 12–22. [Google Scholar] [CrossRef]
  3. Energy Commission of Nigeria, Federal Republic of Nigeria. National Energy Masterplan; Energy Commission of Nigeria: Abuja, Nigeria, 2014. [Google Scholar]
  4. Abraham, E.M.; Edet, E. Review of Geothermal Energy Research in Nigeria: The Geoscience Front. J. Earth Sci. Geophys. 2017, 3, 1–10. [Google Scholar] [CrossRef]
  5. Kiavarz, M.; Noorollahi, Y.; Samadzadegan, F.; Ali, M.; Itoi, R. Spatial data analysis for exploration of regional scale geothermal resources. J. Volcanol. Geotherm. Res. 2013, 266, 69–83. [Google Scholar] [CrossRef]
  6. Wibowo, H. Spatial Data Analysis and Integration for Regional-Scale Geothermal Prospectivity Mapping, West Java, Indonesia. Master’s Thesis, International Institute for Geo-Information Science and Earth Observation, Enschede, The Netherlands, 2006. [Google Scholar]
  7. Coolbaugh, M.F.; Kratt, C.; Fallacaro, A.; Calvin, W.M.; Taranik, J. V Detection of geothermal anomalies using Advanced Spaceborne Thermal Emission and Reflection Radiometer (ASTER) thermal infrared images at Bradys Hot Springs, Nevada, USA. Remote Sens. Environ. 2007, 106, 350–359. [Google Scholar] [CrossRef]
  8. Zaher, M.A. Exploration of Geothermal Resources in Farafra Oasis, Western Desert, Egypt. In Proceedings of the 44th Workshop on Geothermal Reservoir Engineering, Stanford, CA, USA, 11–13 February 2019; pp. 1–4. [Google Scholar]
  9. Abdelzaher, M.; Nishijima, J.; El-Qady, G.; Aboud, E.; Masoud, O.; Soliman, M.; Ehara, S. Gravity and Magnetotelluric Investigations to Elicit the Origin of Hammam Faraun Hot Spring, Sinai Peninsula, Egypt. Acta Geophys. 2011, 59, 633–656. [Google Scholar] [CrossRef]
  10. Abdel, M.; Saibi, H.; El, M.; Ghamry, E.; Ehara, S. A preliminary regional geothermal assessment of the Gulf of Suez, Egypt. J. Afr. Earth Sci. 2011, 60, 117–132. [Google Scholar] [CrossRef]
  11. Abdel Zaher, M.; Saibi, H.; Mansour, K.; Khalil, A.; Soliman, M. Geothermal exploration using airborne gravity and magnetic data at Siwa Oasis, Western Desert, Egypt. Renew. Sustain. Energy Rev. 2017, 82, 3824–3832. [Google Scholar] [CrossRef]
  12. Aboud, E.; Salem, A.; Mekkawi, M. Curie depth map for Sinai Peninsula, Egypt deduced from the analysis of magnetic data. Tectonophysics 2011, 506, 46–54. [Google Scholar] [CrossRef]
  13. Yalcin, M.; Kilic, F. A GIS-based multi criteria decision analysis approach for exploring geothermal resources: Akarcay basin (Afyonkarahisar). Geothermics 2017, 67, 18–28. [Google Scholar] [CrossRef]
  14. Noorollahi, Y.; Ghasempour, R.; Jalilinasrabady, S. GIS integration model for geothermal exploration and well siting. Geothermics 2008, 37, 107–131. [Google Scholar] [CrossRef]
  15. Meng, F.; Liang, X.; Xiao, C.; Wang, G. Geothermal resource potential assessment utilizing GIS—Based multi criteria decision analysis method. Geothermics 2021, 89, 101969. [Google Scholar] [CrossRef]
  16. Abuzied, S.M.; Kaiser, M.F.; Shendi, E.H.; Abdel-fattah, M.I. Multi-criteria decision support for geothermal resources exploration based on remote sensing, GIS and geophysical techniques along the Gulf of Suez coastal area, Egypt. Geothermics 2020, 88, 101893. [Google Scholar] [CrossRef]
  17. Procesi, M.; Buttinelli, M.; Pignone, M. Geothermal favourability mapping by advanced geospatial overlay analysis: Tuscany case study (Italy). Energy 2015, 90, 1377–1387. [Google Scholar] [CrossRef]
  18. Yousefi, H.; Noorollahi, Y.; Ehara, S.; Itoi, R.; Yousefi, A. Developing the geothermal resources map of Iran. Geothermics 2010, 39, 140–151. [Google Scholar] [CrossRef]
  19. Calvin, W.M.; Littlefield, E.F.; Kratt, C. Remote sensing of geothermal-related minerals for resource exploration in Nevada. Geothermics 2015, 53, 517–526. [Google Scholar] [CrossRef] [Green Version]
  20. Nishar, A.; Richards, S.; Breen, D.; Robertson, J.; Breen, B. Thermal infrared imaging of geothermal environments and by an unmanned aerial vehicle (UAV): A case study of the Wairakei e Tauhara geothermal fi eld, Taupo, New Zealand. Renew. Energy 2016, 86, 1256–1264. [Google Scholar] [CrossRef]
  21. Littlefield, E.F.; Calvin, W.M. Geothermal exploration using imaging spectrometer data over Fish Lake Valley, Nevada. Remote Sens. Environ. 2014, 140, 509–518. [Google Scholar] [CrossRef] [Green Version]
  22. Obande, G.E.; Lawal, K.M.; Ahmed, L.A. Spectral analysis of aeromagnetic data for geothermal investigation of Wikki Warm Spring, north-east Nigeria. Geothermics 2014, 50, 85–90. [Google Scholar] [CrossRef]
  23. Ayuba, R.A.; Nur, A. Determination of Curie Depth Isotherm and Geothermal Studies over Parts of Nasarawa and Environs, North Central Nigeria. Int. J. Energy Environ. Sci. 2018, 3, 69–81. [Google Scholar] [CrossRef]
  24. Aliyu, A.; Salako, K.A.; Adewumi, T.; Mohammed, A. Interpretation of High Resolution Aeromagnetic Data to Estimate the Curie Point Depth Isotherm of Parts of Middle Benue Trough, North-East, Nigeria. Phys. Sci. Int. J. 2018, 17, 1–9. [Google Scholar] [CrossRef]
  25. Anakwuba, E.K.; Chinwuko, A.I. One Dimensional Spectral Analysis and Curie Depth Isotherm of Eastern Chad Basin, Nigeria. J. Nat. Sci. Res. 2015, 5, 14–22. [Google Scholar]
  26. Kasidi, S.; Nur, A. Curie depth isotherm deduced from spectral analysis of Magnetic data over sarti and environs of North-Eastern Nigeria. Sch. J. Biotechnol. 2012, 1, 49–56. [Google Scholar]
  27. Abraham, E.M.; Obande, E.G.; Chukwu, M.; Chukwu, C.G. Estimating depth to the bottom of magnetic sources at Wikki Warm Spring region, northeastern Nigeria, using fractal distribution of sources approach. Turk. J. Earth Sci. 2015, 24, 494–512. [Google Scholar] [CrossRef]
  28. Epuh, E.; Nwilo, P.C.; Olorode, D.; Ezeigbo, C. Multivariate Statistical Analysis of Gongola Basin Residual Gravity Anomalies for Hydrocarbon Exploration. J. Comput. Model. 2012, 2, 53–76. [Google Scholar]
  29. Epuh, E.E.; Joshua, E.O. Basement Depth and Sedimentary Velocity Structure in Gongola Basin. J. Geol. Geophys. 2017, 6, 2–9. [Google Scholar] [CrossRef] [Green Version]
  30. Epuh, E.; Joshua, E.O. Gongola Basin Crust-Mantle Structural Analysis For Hydrocarbon Investigation Using Isostatic Residual Gravity Anomalies. Niger. J. Basic Appl. Sci. 2017, 25, 51–65. [Google Scholar] [CrossRef] [Green Version]
  31. Bassey, N.E.; Barka, J.; Musa, H.; Takana, A. Hydrocarbon Prospect o f Nigeria ’ s Gongola Basin Based on Gravity Data Interpretation. J. Appl. Geol. Geophys. 2017, 5, 68–77. [Google Scholar] [CrossRef]
  32. Shemang, E.; Jacoby, W.; Ajayi, C. Gravity Anomalies Over The Gongola Arm, Upper Benue Trough, Nigeria. Glob. J. Geol. Sci. 2005, 3, 61–69. [Google Scholar] [CrossRef] [Green Version]
  33. Abdullahi, B.U.; Rai, J.K.; Olaitan, O.M.; Musa, Y.A. A Review of the Correlation between Geology and Geothermal Energy in North-Eastern Nigeria. IOSR J. Appl. Geol. Geophys. 2014, 2, 74–83. [Google Scholar] [CrossRef]
  34. Musa, O.K.; Kurowska, E.E.; Schoeneich, K.; Alagbe, S.A.; Ayok, J. Tectonic control on the distribution of onshore mud volcanoes in parts of the Upper Benue Trough, northeastern Nigeria. Contemp. Trends Geosci. 2016, 5, 28–45. [Google Scholar] [CrossRef]
  35. Kurowska, E.; Schoeneich, K. Geothermal Exploration in Nigeria. In Proceedings of the World Geothermal Congress, Bali, Indonesia, 25–29 April 2010; pp. 25–29. [Google Scholar]
  36. Obaje, N.G. Geology and Mineral Resources of Nigeria; Springer: Berlin/Heidelberg, Germany, 2009. [Google Scholar]
  37. Shettima, B.; Buba, I.Y.; Sidi, M.W.; Abdulganiyu, Y.; Hamidu, H.; Abubakar, U. Reservoir Potentials of the Cretaceous Gombe Sandstone, Gongola Basin, Upper Benue Trough, North Eastern Nigeria. J. Appl. Geol. Geophys. 2016, 4, 66–77. [Google Scholar] [CrossRef]
  38. Giraud, R.; Bosworth, W. Senonian basin inversion and rejuvenation of rifting in Africa and Arabia: Synthesis and implications to plate-scale tectonics. Tectonophysics 1997, 282, 39–82. [Google Scholar] [CrossRef]
  39. Guiraud, R.; Maurin, J.C. Early Cretaceous rifts of Western and Central Africa: An overview. Tectonophysics 1992, 213, 153–168. [Google Scholar] [CrossRef]
  40. Cratchley, C.R.; Louis, P.; Ajakaiye, D.E. Geophysical and geological evidence for the Benue-Chad Basin Cretaceous rift valley system and its tectonic implications. J. Afr. Earth Sci. 1984, 2, 141–150. [Google Scholar] [CrossRef]
  41. Burke, K.C.; Dessauvagie, T.F.J.; Whiteman, A. Opening of the Gulf of Guinea and geological history of the Benue depression and Niger delta. Nat. Phys. Sci. 1971, 233, 51–55. [Google Scholar] [CrossRef]
  42. Olade, M.A. Evolution of Nigeria’s Benue Trough (Aulacogen): A tectonic model. Geol. Mag. 1975, 112, 575–583. [Google Scholar] [CrossRef]
  43. Erdi-Krausz, G.; Matolin, M.; Minty, B.; Nicolet, J.P.; Reford, W.S.; Schetselaar, E.M. Guidelines for radioelement mapping using gamma ray spectrometry data. In Geophysics; International Atomic Energy Agency: Vienna, Austria, 2003; pp. 1–152. [Google Scholar]
  44. Hanano, M. Two different roles of fractures in geothermal development. In Proceedings of the World Geothermal Congress, Kyushu-Tohoku, Japan, 28 May–10 June 2000; pp. 1–3. [Google Scholar]
  45. Silverman, B.W. Density Estimation for Statistics and Data Analysis; Publication of Monographs on Statistics and Applied Probability; Chapman Hall: London, UK, 1986; pp. 1–22. [Google Scholar]
  46. Cordell, L.; Grauch, V.J. Mapping basement magnetization zones from Aeromagnetic Data in the San Juan basin, New Mexico. SEG 1982, 181–197. [Google Scholar] [CrossRef]
  47. Dunlop, D.J.; Özdemir, Ö. Rock Magnetism Fundamentals and Frontiers; Cambridge University Press: Cambridge, UK, 2001. [Google Scholar]
  48. Hsieh, H.; Chen, C.; Lin, P.; Yen, H. Curie point depth from spectral analysis of magnetic data in Taiwan. J. Asian Earth Sci. 2014, 90, 26–33. [Google Scholar] [CrossRef] [Green Version]
  49. Okubo, Y.; Graf, R.J.; Hansen, R.O.; Ogawa, K.; Tsu, H. Curie point depths of the Island of Kyushu and surrounding areas, Japan. Geophysics 1985, 53, 481–494. [Google Scholar] [CrossRef]
  50. Tanaka, A.Ł.; Okubo, Y.; Matsubayashi, O. Curie point depth based on spectrum analysis of the magnetic anomaly data in East and Southeast Asia. Tectonophysics 1999, 306, 461–470. [Google Scholar] [CrossRef]
  51. Elbarbary, S.; Zaher, M.A.; Mesbah, H.; El-shahat, A.; Embaby, A. Curie point depth, heat fl ow and geothermal gradient maps of Egypt deduced from aeromagnetic data. Renew. Sustain. Energy Rev. 2018, 91, 620–629. [Google Scholar] [CrossRef]
  52. Salem, A.; Furuya, S.; Aboud, E.; Elawadi, E.; Jotaki, H.; Ushijima, K. Subsurface Structural Mapping Using Gravity Data of Hohi Geothermal Area, Central Kyushu, Japan. In Proceedings of the World Geothermal Congress, Antalya, Turkey, 24–29 April 2005; pp. 24–29. [Google Scholar]
  53. Kohrn, S.B.; Bonet, C.; DiFrancesco, D.; Gibson, H. Geothermal exploration using gravity gradiometry—A Salton Sea example. Trans. Geotherm. Resour. Counc. 2011, 35, 1699–1702. [Google Scholar]
  54. Rybach, B.L. Radioactive Heat Production in Rocks and its Relation to other Petrophysical Parameters 1). Pure Appl. Geophys. 1976, 114, 309–317. [Google Scholar] [CrossRef]
  55. Saaty, R.W. The analytic hierarchy process-what it is and how it is used. Math. Model. 1987, 9, 161–176. [Google Scholar] [CrossRef] [Green Version]
  56. Kiavarz, M.; Samadzadegan, F.; Noorollahi, Y. Geothermics Spatial analysis and multi-criteria decision making for regional-scale geothermal favorability map. Geothermics 2014, 50, 189–201. [Google Scholar]
  57. Saleh, S.; Salk, M.; Pamukçu, O. Estimating Curie Point Depth and Heat Flow Map for Northern Red Sea Rift of Egypt and Its Surroundings, from Aeromagnetic Data. Pure Appl. Geophys. 2013, 170, 863–885. [Google Scholar] [CrossRef]
  58. Saada, S.A. Curie point depth and heat flow from spectral analysis of aeromagnetic data over the northern part of Western Desert, Egypt. J. Appl. Geophys. 2016, 134, 100–111. [Google Scholar] [CrossRef]
  59. Mono, J.A.; Ndougsa-Mbarga, T.; Tarek, Y.; Ngoh, J.D.; Owono Amougou, O.U.I. Estimation of Curie-point depths, geothermal gradients and near-surface heat flow from spectral analysis of aeromagnetic data in the Loum—Minta area (Centre-East Cameroon). Egypt. J. Pet. 2018, 27, 1291–1299. [Google Scholar] [CrossRef]
  60. Zaher, M.A.; Elbarbary, S.; El-shahat, A.; Mesbah, H.; Embaby, A. Geothermal resources in Egypt integrated with GIS-based analysis. J. Volcanol. Geotherm. Res. 2018. [Google Scholar] [CrossRef]
  61. Oshin, I.O.; Rahaman, M.A. Uranium favourability study in Nigeria. J. Afr. Earth Sci. 1986, 5, 167–175. [Google Scholar] [CrossRef]
  62. Suh, C.E.; Dada, S.S. Mesostructural and Microstructural Evidences for a Two Stage Tectono-Metallogenetic Model for the Uranium Deposit at Mika, Northeastern Nigeria: A Research Note. Nonrenewable Resour. 1998, 7, 75–83. [Google Scholar] [CrossRef]
  63. Suh, C.E.; Dada, S.S.; Ajayi, T.R.; Matheis, G. Integrated structural and mineral alteration study of the Zona uranium anomaly, northeast Nigeria. J. Afr. Earth Sci. 1998, 27, 129–140. [Google Scholar] [CrossRef]
  64. Haruna, I.V.; Ahmed, H.A.; Ahmed, A.S. Geology and tectono-sedimentary disposition of the Bima sandstone of the Upper Benue Trough (Nigeria): Implications for sandstone-hosted Uranium deposits. J. Geol. Min. Res. 2012, 4, 168–173. [Google Scholar] [CrossRef]
  65. Bute, S.I. Uranium Ore Deposits in Northeastern Nigeria: Geology And Prospect. Cont. J. Earth Sci. 2013, 8, 21–28. [Google Scholar] [CrossRef]
  66. Bute, S.I. Petrography, geochemistry and Alteration Studies of Kanawa Uranium. J. Geol. Geophys. 2017, 6, 4–11. [Google Scholar] [CrossRef] [Green Version]
  67. Bolarinwa, A.T.; Ibrahim, S.B. Petrochemical and Tectonogenesis of Granitoids in the Wuyo-Gubrunde Petrochemical and Tectonogenesis of Granitoids in the Wuyo-Gubrunde Horst, Northeastern Nigeria: Implication for Uranium Enrichment. Nat. Resour. Res. 2016, 25, 197–210. [Google Scholar] [CrossRef]
  68. Mostafaeipour, A.; Jalaladdin, S.; Dehshiri, H.; Shahabaddin, S.; Dehshiri, H.; Jahangiri, M.; Techato, K. A Thorough Analysis of Potential Geothermal Project Locations in Afghanistan. Sustainabiltiy 2020, 12, 8397. [Google Scholar] [CrossRef]
  69. Abdullahi, M.; Singh, U.K.; Roshan, R. Mapping magnetic lineaments and subsurface basement beneath parts of Lower Benue Trough (LBT), Nigeria: Insights from integrating gravity, magnetic and geologic data. J. Earth Syst. Sci. 2019, 128, 12040. [Google Scholar] [CrossRef] [Green Version]
  70. Ross, H.E.; Blakely, R.J.; Zoback, M.D. Testing the use of aeromagnetic data for the determination of Curie depth in California. Geophysics 2006, 71, 51–59. [Google Scholar] [CrossRef]
  71. Nwankwo, C.N.; Ekine, A.S. Geothermal gradients in the Chad Basin, Nigeria, from bottom hole temperature logs. Int. J. Phys. Sci. 2009, 4, 777–783. [Google Scholar]
Figure 1. (A): Geological map of Nigeria showing the study area represented by a hollowed Square. (B). Enlarged view of the geological map of the study area showing the rock distribution (Modified from [36]).
Sustainability 13 08525 g001
Figure 2. Illustration of the current research workflow pattern.
Sustainability 13 08525 g002
Figure 3. (A) Integrated lineaments distribution map; (B) classified integrated lineaments distribution density map.
Sustainability 13 08525 g003
Figure 4. (A) Temperature gradients map of the study area; (B) Reclassified temperature gradients map of the study area.
Sustainability 13 08525 g004
Figure 5. (A) Lithology map; (B) reclassified lithology map showing lithology classes according to the perceived level of influence on the occurrence of geothermal energy.
Sustainability 13 08525 g005
Figure 6. (A) Residual gravity anomaly map of the study area showing areas of density contrasts; (B) Reclassified residual gravity anomaly map of the study area.
Sustainability 13 08525 g006
Figure 7. (A) radiogenic heat flow map of the research area; (B) reclassified radiogenic heat produced map of the research area.
Sustainability 13 08525 g007
Figure 8. The geothermal prospectivity map of the research area with surface geothermal manifestations overlaid.
Sustainability 13 08525 g008
Table 1. Thematic layers, ranks, classes, and their associated weights.
Thematic LayerClass RangesDegreeClass RankClass Weight Value (Wt)Consistency Ratio (C.R.)
Lineament density map0–3163.00Low190.03
3163.0–7275.92Moderate218
7275.92–13,128.285High327
13,128.285–40,333.89Very High446
Heat flow1.330–1.587 0Low180.04
1.5870–1.6099Moderate214
1.6068–1.6990High333
1.6990–1.9489Very High445
Temperature gradients10.62–40.230Low490.02
40.23–50.696Moderate313
50.696–62.062High229
62.062–86.886Very High150
Gravity−85.47–−56.75 Very low160.03
−56.75–−46.63low210
−46.63–−39.24Moderate316
−39.24–−31.037High426
−31.037–−15.72Very high542
LithologyVolcanicVery High3560.02
PlutonicHigh232
Sedimentarylow112
Table 2. AHP grading scale.
ScaleMeanings
1Zi is as significant as Zj
3Zi is slightly more important than Zj
5Zi is obviously more important than Zj
7Zi is more important than Xj
9Zi is extremely important compared to Zj
2, 4, 6, 8….n are the median figures 1/2, 1/3, 1/5 ……1/9. This means the degree of importance is reciprocal to the above ranks.
Publisher’s Note: MDPI stays neutral with regard to jurisdictional claims in published maps and institutional affiliations.

