
How Perceived Adequacy of Open Public Space Is Related to Objective Green Space and Individuals’ Opinions of Area-Level Quality


1
Economic and Social Research Institute, Whitaker Square, Sir John Rogerson’s Quay, D02 K138 Dublin 2, Ireland
2
Department of Economics, Trinity College Dublin, D02 K138 Dublin 2, Ireland
*
Author to whom correspondence should be addressed.
†
These authors contributed equally to this work.
Sustainability 2021, 13(15), 8516; https://doi.org/10.3390/su13158516
Submission received: 17 May 2021
/
Revised: 1 July 2021
/
Accepted: 26 July 2021
/
Published: 30 July 2021
(This article belongs to the Special Issue Greening Cities for Improved Health)
Abstract
:There is substantial evidence of links between green spaces and better health status. However, the ways in which green space are measured are varied, including both objective and subjective measures. This paper examines factors associated with individuals’ perceiving a lack of open public space, including the objective quantity of green space and wider problems in the area. This is analysed using a combination of principal component analysis and logistic regression. We use data from the Healthy Ireland Survey 2016, a cross sectional survey of over 7000 adults in Ireland. The results suggest that objective green space has a significant negative association with whether an individual perceives a problem with lack of open public space. The analysis also reveals that area safety, area cleanliness, and area service provision are important factors explaining perceived adequacy of open public space. The findings of this analysis have implications for the methods by which researchers and policymakers measure and analyse green space in an area.
1. Introduction
The positive effect of green space on the mental and physical health of those who interact with it has received considerable attention amongst researchers and policymakers in recent years. The importance of urban green space to health has been recognised on an international level by the World Health Organization (WHO). It stated that “availability, accessibility, quality and security of public green spaces” is an important factor for an individual’s access to healthy environments [1]. In Ireland, the Environmental Protection Agency (EPA) has recognised that “people gain physical, mental, cognitive, physiological, emotional, tangible and aesthetic benefits from nature and green spaces” ([2] p. 42). Therefore, provision of adequate green space for urban dwellers and the appropriate design of urban spaces remain important priorities for public health policymakers internationally.
However, debate continues in the literature about how best to measure the quality, quantity, and accessibility of green space. This paper seeks to explore the relationships between objective and subjective metrics for assessing urban green space, as well as their relationships with other area-level characteristics. The present paper uses data from the Healthy Ireland survey in 2016, a cross-sectional dataset that captures a nationally representative sample of adults in Ireland. Green space may promote better health for individuals exposed to it through several mechanisms [3]. Some mechanisms, such as stress reduction and increased physical activity, require an individual to perceive green space in a positive way for it to be effective. Others may confer benefits even where the affected individual does not perceive their exposure to green space in a positive way, e.g., local green space may improve local air quality.
1.1. Literature Review
1.1.1. Objective and Perceived Green Space
Studies of the Dutch national survey of general practice and the English census show that those living within a certain proximity of green space experience a significant benefit to their perceived general health [4,5]. This has been attributed to a number of factors including the capacity of green space to buffer against stress and air pollution [6], as well as the facilitation of physical activity [7]. One channel through which green space can benefit health is highlighted by its negative relationship with obesity, as shown in a systematic review [8]. However, while these studies have demonstrated the importance of the presence of green space, further study has indicated that the quality of green space may also affect its value to residents [9].
This literature establishes a generalised positive relationship between green space and health. However, some studies suggest that the association is more complex than that. For example, research on older adults in Ireland ([10]) finds that those in urban areas with the highest and lowest densities of green space are both more likely to be obese than those living in areas with intermediate green space. This suggests that other factors influence the relationship between green space and health.
The link between perceived and objective green space also presents a more nuanced picture. Previous analysis from Warnambool, Australia suggests that there is low agreement between perceived and objective green space [11] and objective and perceived green space are indicative of different neighbourhood characteristics. In particular, they find that perceived green space is more closely associated with the behavioural effect of green space. A study in Auckland, New Zealand suggests that alterations in perceived green space can alter behavioural intentions around physical activity [12].
A study of perceived and objective distance to local parks in Glasgow in Scotland finds little consistency between the two metrics [13]. A paper analysing perceptions of green space in Ontario, Canada found that only 18% of residents correctly estimated the distance to their nearest public park which indicated a low correlation between perceived and objective distance to green space [14]. Thus, these papers analysing the correlation between perceived green and objective green space find that these two measures do not fully corroborate one another.
This mismatch in perceived and objective measures of facilities for physical activity is also evident in an analysis of four diverse urban settings in the US [15] and in Melbourne, Australia [16].
However, when individuals from Bari, Italy were asked for their views about green space in their area, they were more likely to report that there are problems when they lived in areas with less green space [17]. Two further studies from Scania in Sweden revealed that immediate access to natural environments with recreational possibilities was low but was associated with greater neighbourhood satisfaction and increased physical activity [18,19]. Different perceived and objective characteristics of neighbourhoods can have different impacts on the physical activity of individuals, as shown in a study comparing St. Louis, Missouri and Savannah, Georgia [20]. These findings indicate that though individuals may not perceive green space accurately, the availability of green space and recreational facilities in the neighbourhood does influence people’s general perceptions of the area. Therefore, there could be benefit to understanding more fully what effect objective green space may have on perceptions of green space.
1.1.2. Area Quality and Green Space
The possible importance of multiple deprivation as a factor which affects the presence and perceptions of green space has also attracted significant attention within the literature. A study of Sheffield in the UK found that, although 64% of Sheffield households fail to meet the recommended distance to green space, older people and those from more deprived groups were more likely to have access to green space [21]. A study on Vienna, Austria found that green spaces were perceived to have lower quality if they became overcrowded, and it concluded that monitoring perceptions of green space is important for sustainable management of such spaces [22]. In a study of nine cities in Sweden, perceived green space has been shown to alleviate stress [23]. Perceptions were found to be more important than objective biodiversity measures as indicators of subjective well-being in a study of three metropolitan areas in South Australia [24]. A study of 9325 individuals in 40 Chinese cities found that green space perceptions interact in significant ways with health, well-being, and respondents’ attributes. The authors also found significant gender differences in perceptions of green space and in the associations between green space and health [25]. A study of salivary cortisol levels (an objective indicator of stress) in deprived communities from UK urban areas finds a negative correlation with green space [26]. However, while individuals in more deprived areas often live closer to green space, they have also been shown to perceive green space as less accessible with less safety and less frequent use [27]. Moreover, there is evidence that area-level deprivation and area safety act as mediating factors for green space’s impact on psychological distress based on data from Sydney, Australia [28].
There is also evidence that green space may have differing effects in deprived and non-deprived areas. The stress reduction resulting from green space has been shown to be particularly large for deprived communities [29]. A model of accessibility of recreational facilities in southern California finds that areas with greater diversity and lower household incomes had poorer access to opportunities for physical recreation [30]. Reference [31] demonstrated that facilities catering for physical activity nearer a person’s house were used more and that those from poorer socio-economic backgrounds were more likely to exercise as part of their commutes but less likely to engage in vigorous physical activity.
Another pathway by which objective green space may affect an individual’s perceptions may include the temperature and microclimactic conditions of the area in which the individual resides [32]. The presence of urban vegetation and green space has been shown to improve thermal comfort [33]. In particular, it has been found that increasing shaded areas during summer can lead to improved thermal comfort, while the presence of meadows causing improved airflow and reduced heat storage at night performed best [34]. A study of this environmental effect has revealed that the optimal thermal conditions can be created through combining low-albedo pavements with trees with wide crowns and high trunks [35]. Thus, effects of green space on individuals’ thermal comfort offer another channel to influence perceptions.
The general conclusion of this strand of the literature has been that perceptions of green space depend on the quality and the usability of that green space, as well as its quantity. However, perceptions also depend on individual characteristics. Identifying the mix of determinants is important as perceived green space is associated with lower stress and improved health.
1.1.3. Walkability and Green Space
The scope for the built environment to facilitate physical activity and related aspects of public health has been considered extensively in previous research. A key dimension is walkability. This literature points to the importance of living in an ordered and safe environment to encourage local residents to walk in their neighbourhoods [36,37]. Green space has itself been linked to a feeling of social safety in communities [38], as well as physical activity [39]. However, a study of the Los Angeles metropolitan area found that the green space in the vicinity of minority communities was more congested than the green space which was closer to white communities [40].
Area safety can affect individuals’ perceptions of access to green space. A systematic review has suggested that the safety associated with areas of urban woodland vegetation is determined by a number of social and environmental factors [41]. Perceived safety has been found to be significantly related to area-level disorder and crime particularly among older and vulnerable populations [42,43]. However, based on a systematic review of literature in the US, there is too little evidence to confidently identify a causal relationship between urban green space, violence, and crime [44].
A study of the role of neighbourhood safety in determining physical activity examined the discrepancy between physical activity in inner city areas and suburban areas [45]. The authors found that those in the inner-city have higher levels of anxiety about neighbourhood safety and that this contributed to lower levels of physical activity in these areas. A systematic review of the relationship between outdoor physical activity and perceived neighbourhood safety has found strong evidence that safety is an important correlate with physical activity [46].
A systematic review of the literature finds a consistent association between physical environment and physical activity behaviour [47]. Based on a study of English adults’ environmental perceptions and walking habits, it was found that women are more concerned about the safety and utility derived from walking than men [48]. In relation to walkability, there has been overall agreement between perceived and objective walkability of a neighbourhood based on a study of Adelaide, Australia [49]. Analysis of the Japanese General Social Survey has indicated that increased perceived walkability is associated with increased leisure time physical activity [50].
The literature is consistent in demonstrating significant positive benefits of increased walkability. However, the perceptions around walkability and green spaces depend on the priorities of individuals which are themselves affected by individual characteristics. Unlike green space, there tends to be agreement between metrics of objective and perceived walkability.
This literature indicates a significant correlation between green space, perceptions around one’s environment and an individual’s overall health. However, there is a gap in the literature concerning the relationship between objective green space and perceived adequacy of open public space for individuals in an area. Moreover, there is also a lack of understanding of the surrounding area-level factors that might affect perceptions of green space. This paper seeks to cast light on both the importance of objective green space in influencing perceptions and on what other factors might influence perceptions of green space among individuals.
The current paper is motivated by a desire to gain a better understanding of the relationship between two types of proxies for the accessibility and quality of green space in one’s area. In essence, what factors might explain agreement between objective green space and perceptions? A systematic review of studies concerning “walkable neighbourhoods” defined them as a “safe, well-serviced neighbourhood, imbued with qualities that make walking a positive experience” ([51] p. 43). Area safety, area cleanliness, and service provision in an area each have been found to have an important impact on the how an individual might feel while walking in an area [52]. We test whether such factors affect individuals’ perceptions of whether the amount of open public space in their area is adequate, given the actual amount of actual green space in the area. Understanding the role of these factors is important for policymakers tasked with the design of public green spaces.
This paper uses data from the second wave of the Healthy Ireland survey which has been linked with objective urban green space data from five distinct urban areas. This provides the analysis with a variety of socio-economic and area-level controls with which one can analyse the factors associated with whether an individual perceives problems involving lack of open public space.
We, therefore, seek to investigate two hypotheses in this paper. First, we wish to examine whether there is a relationship between objective green space and perceived lack of open public space. We also intend to examine whether the perceived characteristics of an area affect the likelihood that individuals will perceive a lack of open public space.
As expected, the results of our analysis suggest that perceived lack of open public space in a respondent’s local area is positively associated with a lack of objectively measured green space. Perceived adequacy of open public space is also significantly associated with the visual cleanliness, safety of the community and the access to wider services in that area.
The following section describes the methods and data used in the paper. We then describe the results from our empirical analysis. We then discuss the policy implications of the results and draw conclusions from our analysis.
2. Materials and Methods
2.1. Data
The data used in this analysis come from the Healthy Ireland (HI) survey in 2016. This survey was carried out by IPSOS MRBI on behalf of Ireland’s Department of Health using face to face interviews between September 2015 and May 2016. It includes a range of demographic variables and questions pertinent to the perceived quality of each respondent’s built and natural environment. It also includes data on the material deprivation score of the Census Small Area in which the respondent resides. The survey questionnaire is available https://assets.gov.ie/7639/11e01008b0324cb3b886e1279f4f507e.pdf, accessed on 27 June 2021.
The random sample was selected by selecting 20 addresses from each of the Electoral Divisions in an Irish database containing all residential addresses (the An Post Geodirectory). There was a 59.9% response rate from those surveyed, resulting in a total sample size of 7498. Of these individual interviews, 7347 answered the questions posed in the study [53].
2.1.1. Dependent Variable
The dependent variable used in this study is derived from a question that asks the respondent whether there is a problem involving a lack of open public spaces in their area. The respondent can indicate that there is ’no problem’, ’a bit of a problem’, or ’a big problem’. For the purpose of this analysis, we combine those reporting a bit of a problem or a big problem with lack of open public spaces into a single group that perceives a problem with lack of open public space in their area.
2.1.2. Area-Level Factors
- Objective urban green space: Objective urban green space is measured using GIS data on green space from the European Environment Agency (EEA) Urban Atlas. Individuals are divided into five quintiles depending on the quantity of green space within 1.6 km (20-min walking distance) of their residence. This buffer zone is a standard measure for the extent of an individual’s neighbourhood surroundings. A distance of 1.6km has been used by numerous papers in the past, e.g., [54,55]. Those living outside of the five cities captured in the Urban Atlas dataset are placed in a separate “non-city” category;
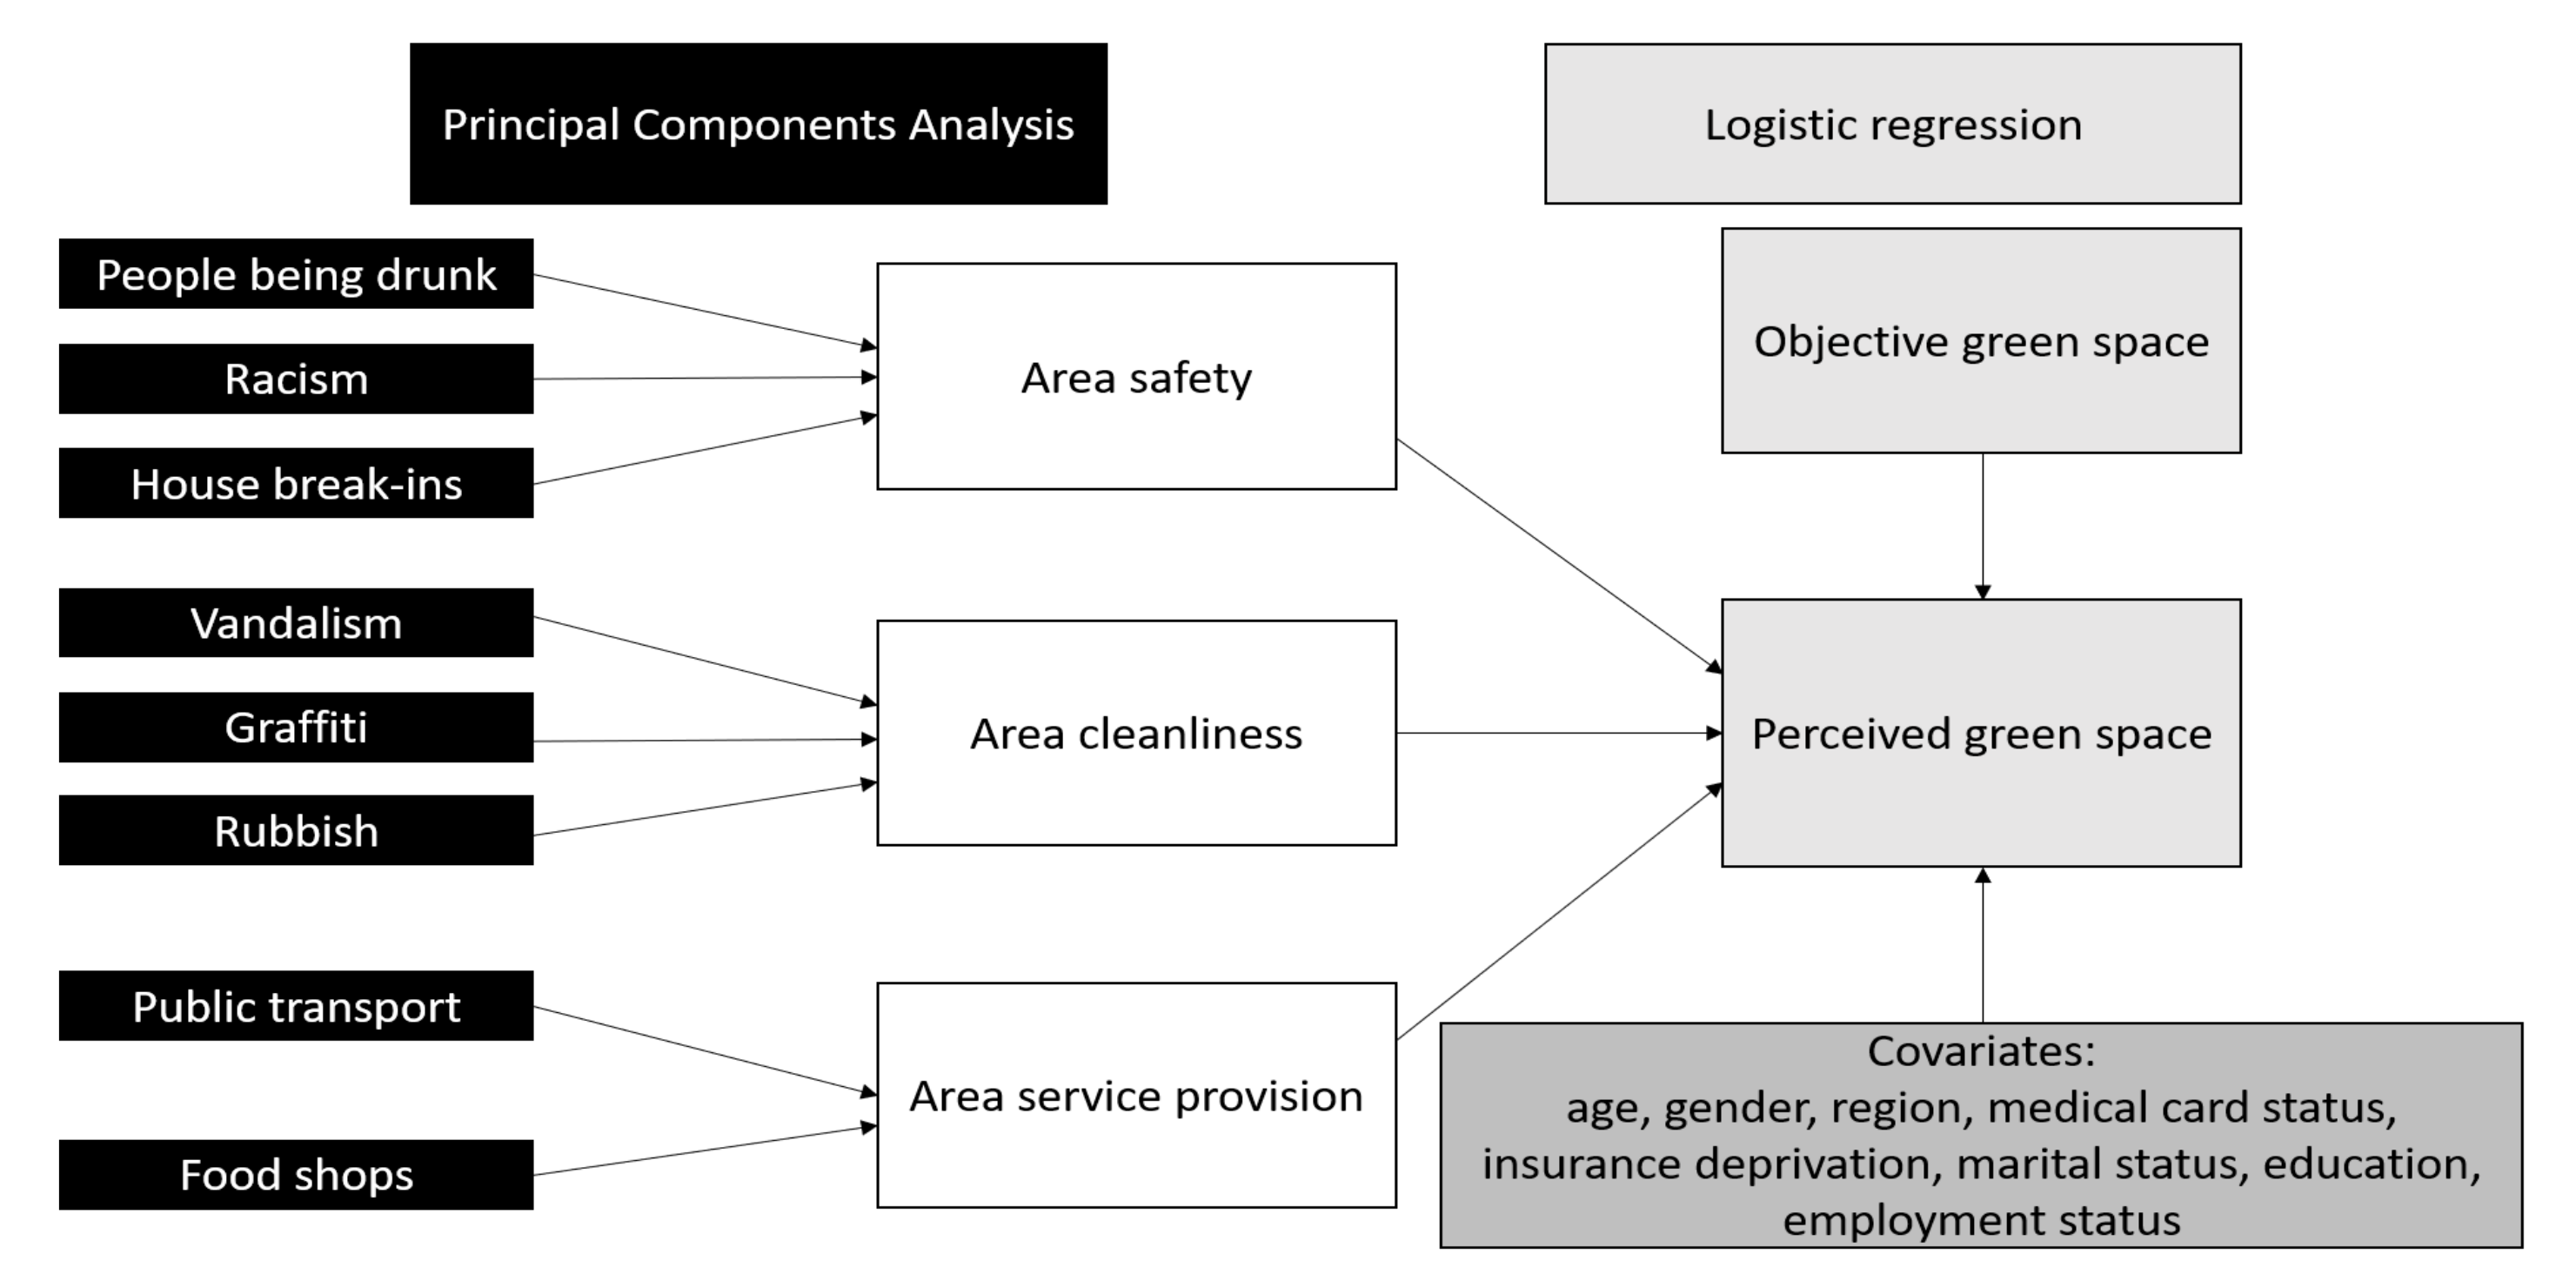
- Perceived area-level factors: Respondents to the HI survey were asked to report on a range of possible problems in their areas. These questions ask individuals to classify possible problems as ’not a problem’, ’a bit of a problem’, or ’a big problem’. In our study, these variables are first used separately as controls in regressions, then in aggregated form using both an incremental scale and a scale derived using a principal component analysis. Finally, the variables are divided into three distinct categories to create composite indicators for perceived area-level problems with public services, public safety, and visual cleanliness.
The variables indicating area safety include perceived problems with people being drunk (PBD), racism, and house break-ins in the area. The area-cleanliness indicator includes perceived problems with rubbish, graffiti, and vandalism in the area. Finally, shortcomings in service provision is indicated by problems with public transport and with food shops in the area.
2.1.3. Demographic Factors
Healthy Ireland provides a wide variety of socio-economic variables to supplement our analysis of the relationship between the quantity of objective green space and perceived lack of open public space. These variables include age, gender, private health insurance, marital status, education level, smoking status, employment status and medical card status. Ireland’s “medical card” is a means-tested benefit providing access to medical services, prescription medicines and hospital care for free. There is also a more limited version, the GP visit card, that provides only GP care for free. Table S1 in the Supplementary Materials shows the share of respondents reporting lack of open public space in each category of the other variables used in the paper.
2.2. Statistical Methods
2.2.1. Logistic Regression
To analyse the association between other factors in the model and perceived lack of open public space, we use a logistic regression. A logistic regression takes the following functional form.
In this case, indicates the probability that the individual reports a problem involving lack of open public space given the levels of the independent variables. This is expressed as a function of a constant term , the effect of objective green space , the effect of other area-level perceived quality variables and the effect of the individual’s socio-economic status .
This provides an estimate of the marginal effects of these variables on the likelihood of perceiving a problem with open public space in one’s area. The marginal effect indicates the average percentage increase in the likelihood of perceiving a lack of open public space if the variable increases in value by 1.
2.2.2. Principal Component Analysis
There are many variables in the HI data that may capture aspects of an area’s quality across several domains. No one variable may be adequate to characterise each domain, and variables in a domain may be correlated with one another. We employ principal component analysis (PCA) to construct proxies for each individual’s area safety, area cleanliness, and area service provision. This technique aims to reduce the number of indicators required to characterise the data, while incorporating as much of the variance as possible. The technique generates a set of linear combinations of the variables, partitioning the total variance into orthogonal components that capture decreasing shares of the variance [56].
In this case, we seek to reduce the number of area-level variables by creating three metrics capturing distinct factors. The variables available to us facilitate an examination of the area’s cleanliness, the area’s safety and the provision of services in the area. The approach used to create these indicators describing each area’s quality are discussed in Section 4.2.
The relationships under examinations are outlined in the flowchart below in Figure 1.
3. Results
3.1. Summary Statistics
Summary statistics describing the Healthy Ireland sample are provided in Table 1. They indicate that most of the Irish population was unlikely to report a lack of open public space.
Table 2 provides descriptive statistics related to the perceived area-level problems that are included in the survey. Responses indicated a large proportion of people have problems with public transport but fewer have problems with issues like racism, graffiti, or rubbish in their area.
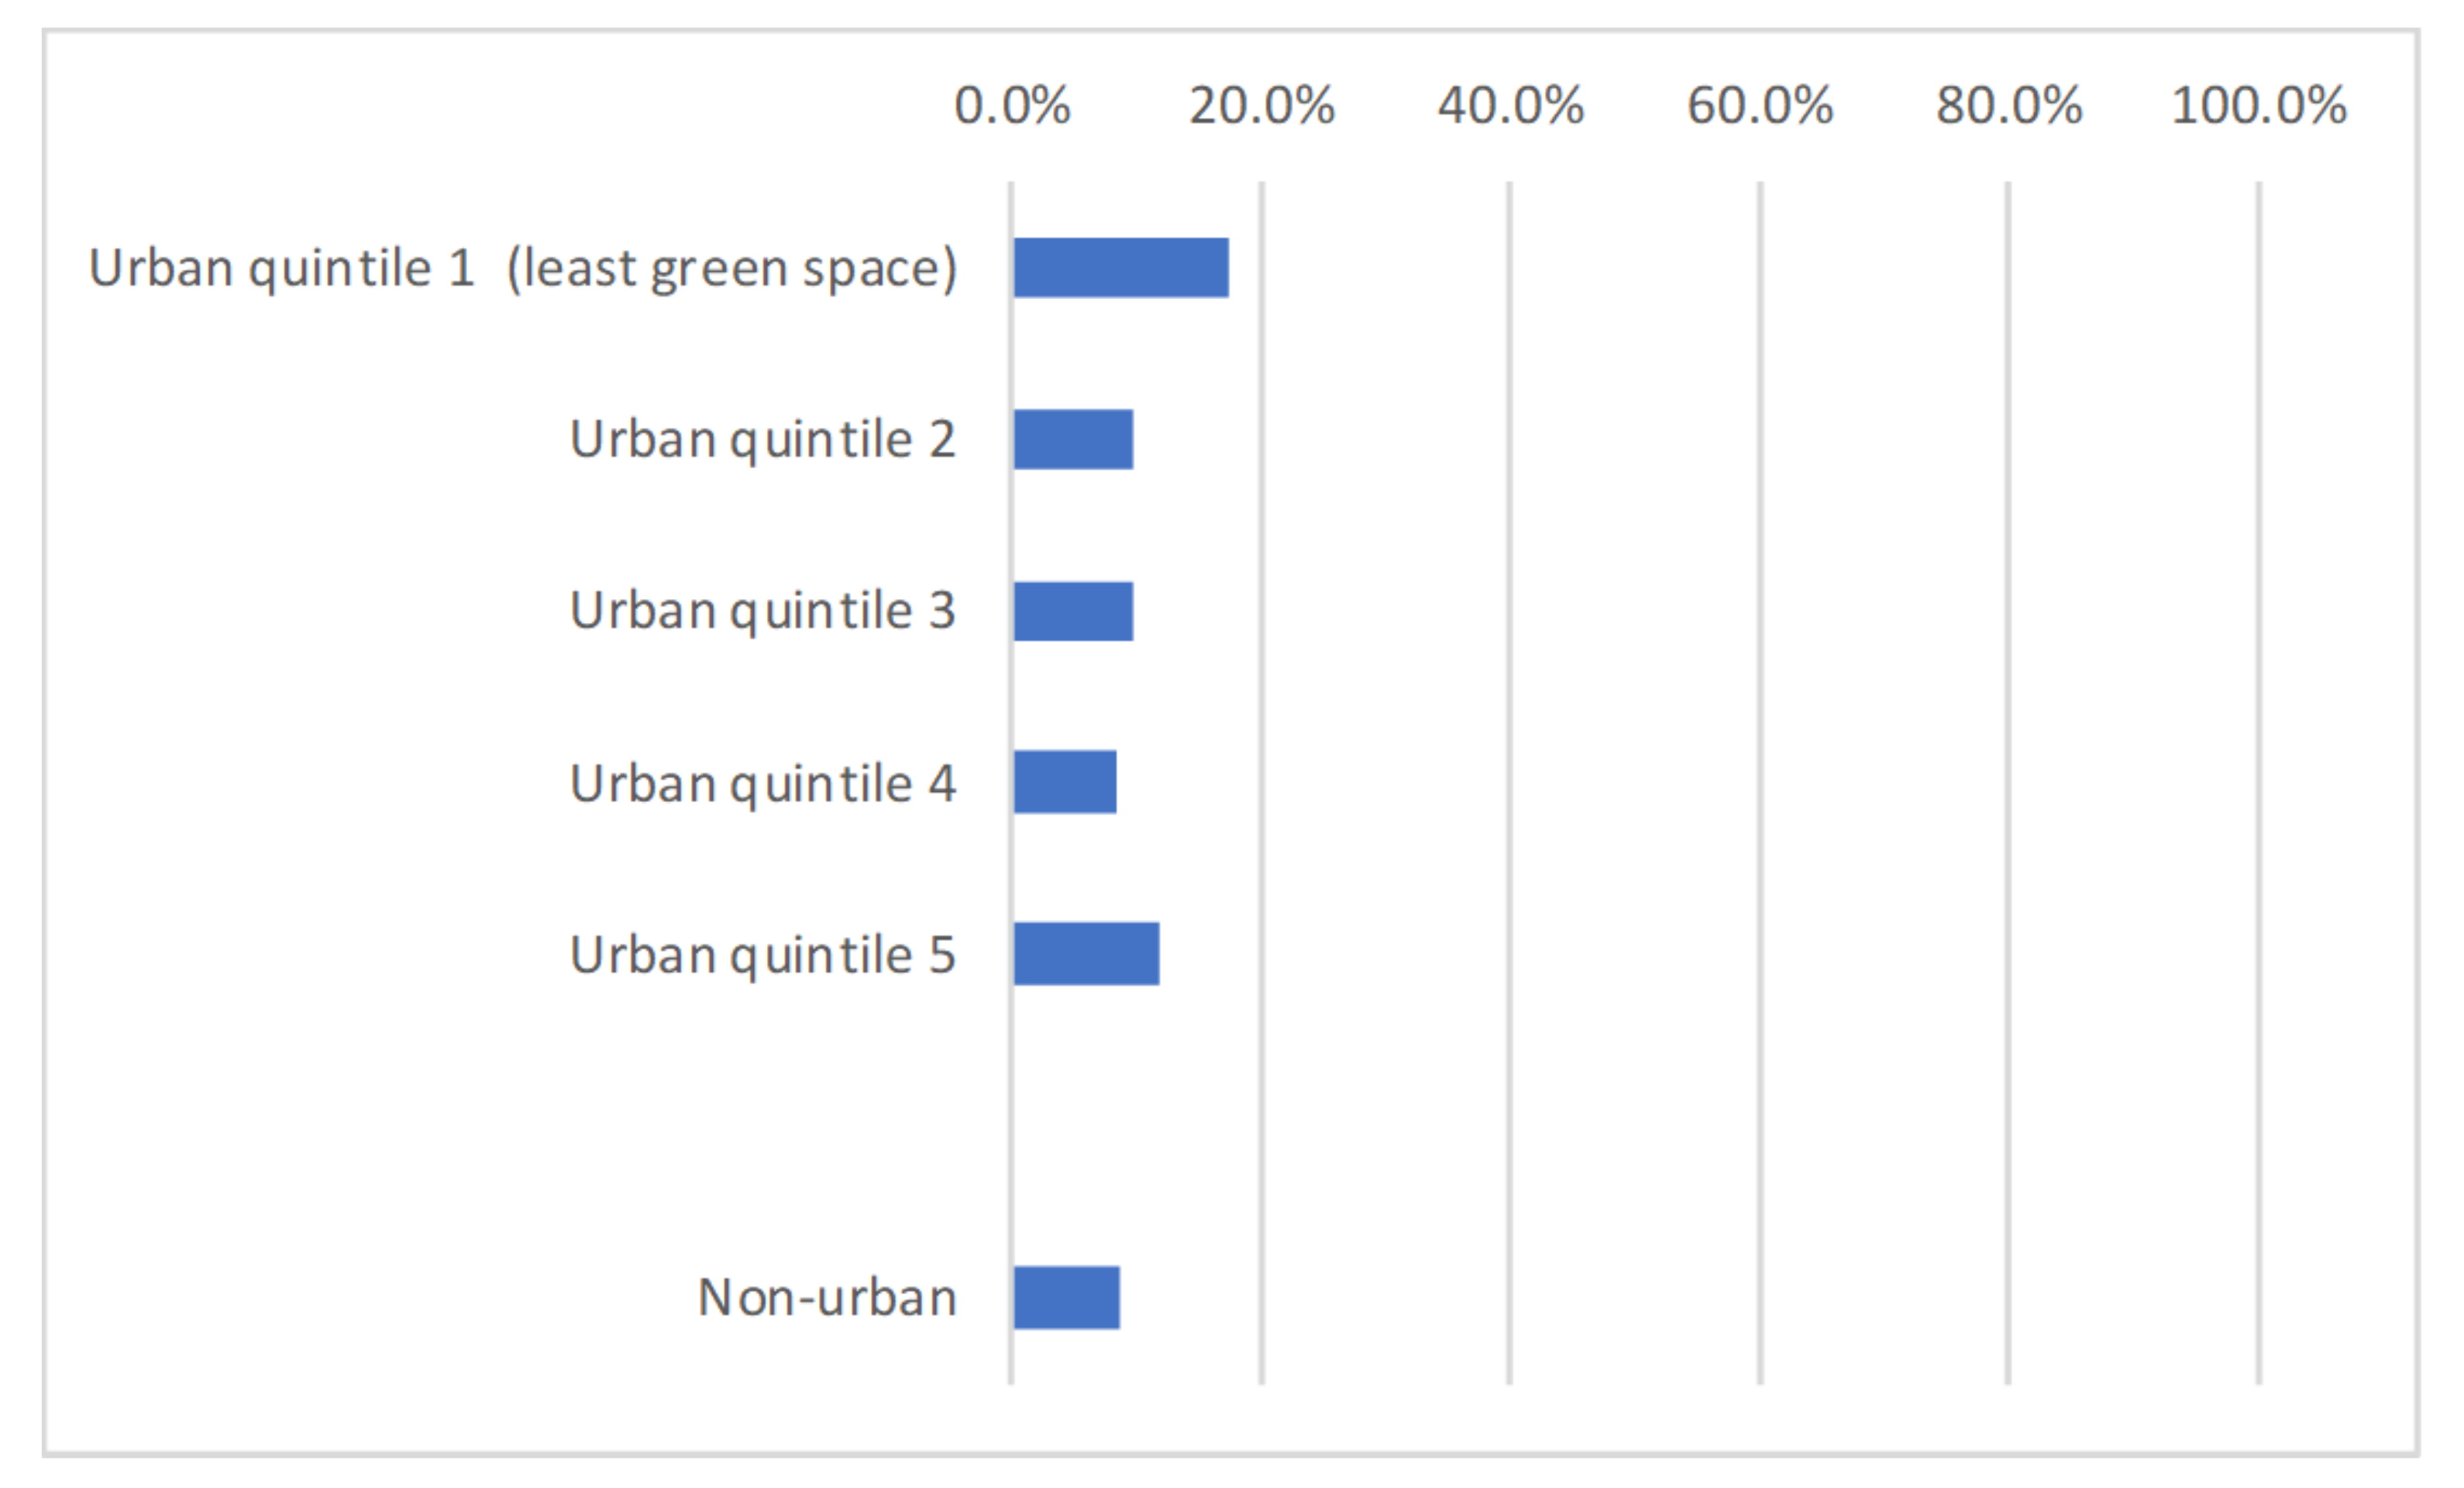
Figure 2 illustrates the variation in perception of a lack of open public space by the individual’s level of objective green space. It indicates a higher than average level perception of inadequate open public space in the quintile exposed to the lowest level of green space. However, there does not seem to be a consistent declining pattern across the other quintiles.
A relatively small proportion (9.28%) of the population indicates that there is a problem with green space (Table 2). This is similar in proportion to the other area-level problems illustrated in the table. The reporting of perceived area-level problems is relatively low in the sample generally with the exception of a problem with public transport, for which over 30% reported either a bit of a problem or a big problem.
3.2. Principal Component Analysis
For the purpose of the PCA, the eight area-level problem variables set out in Table 1 were used to generate numeric variables whereby 1 was a respondent suggesting they had a big problem and 0 suggested that a respondent perceived no problem with the area. These were then used to derive proxies for area-cleanliness, area-safety, and area-service provision.
Table 3 illustrates the correlation between the variables derived from the principal components analysis and the variables on which it is based. It demonstrates that the first principal component is negatively correlated with the variables around area-level safety. The variables associated with service provision are also negatively correlated with the service provision variables. However, the variable designed to estimate the effect of area-level cleanliness is positively correlated with the area-level variables.
Table S2 in the Supplementary File provides the summary statistics for the variables generated through aggregation. Each of the variables has mean 0 and is generally low in magnitude in the sample, which is consistent with the mean levels reported in Table 2 showing that individuals generally do not perceive there to be a problem in each of these domains.
3.3. Regression Results for Models of Perceived Problems Involving Lack of Open Public Space
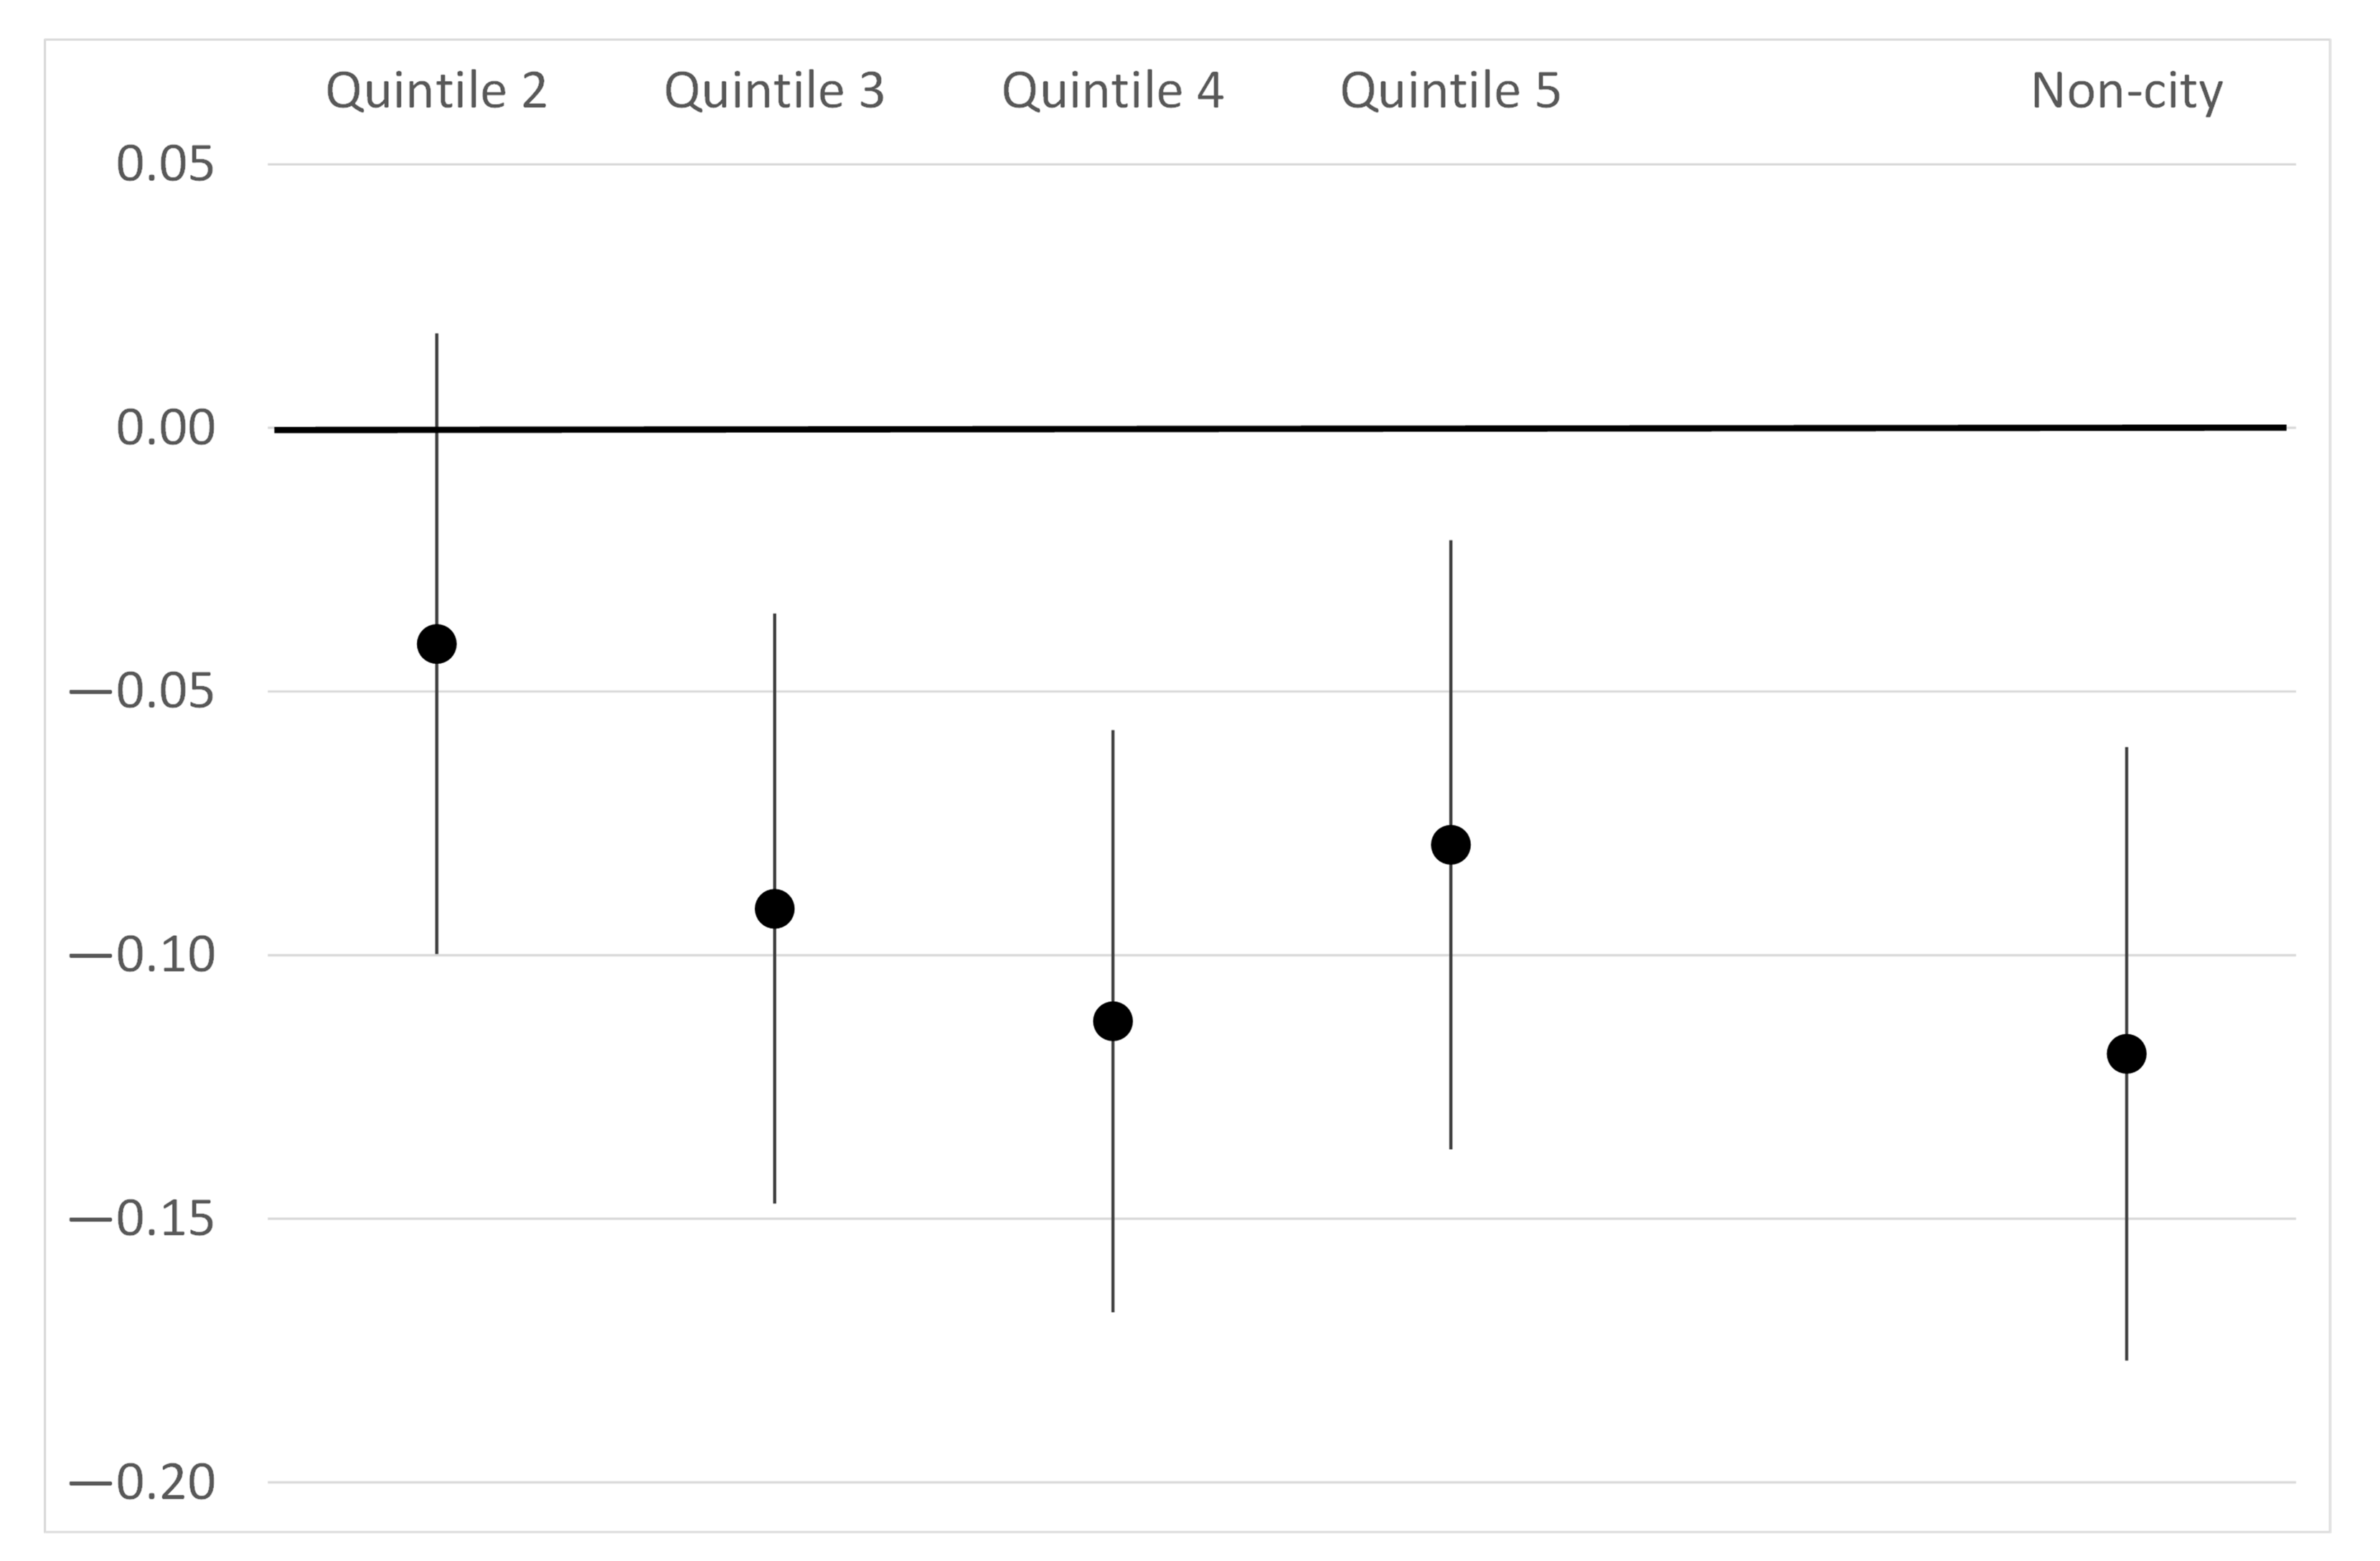
The green space results from the regression analyses are shown in Table 4, and the full regression results are provided in Table S3 in the Supplementary Materials. Holding other factors constant, living in areas with more green space than the lowest quintile is associated with a 5–12 percentage point lower likelihood of recording a problem inadequate open public space. On this metric, the relatively poor performance of areas in the lowest green space quintile is consistently significant across the models. However, the negative association between objectively measured green space and perceived problems with open public space does not change systematically as we move through quintiles with progressively larger amounts of green space. Indeed, the coefficients on other quintiles are generally not significantly different from one another. Figure 3 illustrates the pattern of green space marginal effects using Model 3 with all controls.
Results for respondents living in non-city areas are qualitatively similar to those for urban respondents in areas with relatively large amounts of green space. It is also noteworthy that the relative marginal effect of being in the lowest quintile of green space is larger when demographic factors are included in the analysis, and information criterion tests support inclusion of a wider range of controls. Indeed, the pseudo-R2 statistic is substantially higher when area-level controls are included.
Other perceived problems in an area can be significant in explaining whether an individual reports a problem with open public space. For a decrease of 1 in the relevant principal component, cleanliness problems have a marginal effect of 2.6 percentage points on the likelihood of perceiving a problem with open public space, service provision problems are associated with decrease of 0.9 percentage points and area-level safety issues are associated with a decrease of 3.1 percentage points.
3.4. Robustness Checks
We estimated some additional regressions to check the robustness of our findings. Table S4 in the Supplementary Materials shows the effect of switching the green space reference category from the quintile with the least green space to the one with the most. Table S5 in the Supplementary Materials provides results from two models: one estimated with OLS rather than logit and one in which the non-urban observations in the sample are dropped. The results of all these models are qualitatively similar to what has been described above.
4. Discussion
In this paper, we investigated two hypotheses. Our analysis suggests there is a significant positive relationship between the objective presence of green space and the perception of green space, but the presence of objective green space does not explain all of the perception of respondents. Our investigation of the importance of area-level factors indicates that area safety, area service provision, and area cleanliness are also significantly associated with perceptions of the adequacy of open public space.
It may be that perceptions of green space and area-level problems should be seen as not only as measures of the these local attributes themselves, but also as proxies for a wider construct related to the quality of the area. This would imply that perceived green space is an unreliable measure of objective green space if it is not considered in the context of the quality of the area in which the individual resides.
The findings related to the effect of perceived area-level problems on perceived adequacy of open public space suggest that the quality of an area may be related to the efficacy of green space in that area. Although providing green space may be generally beneficial, cleanliness, safety, and wider service provision should be considered when examining people’s perceptions of local adequacy of open public space.
4.1. Comparisons to Previous Research
Our results agree with prior literature that the quantity of green space has an impact on the perceived greenness of a neighbourhood. However, it is also in line with previous findings that there is imperfect agreement between perceived and objective green space [11]. Although objective green space and perceived green space are significantly correlated, perceptions around open public space are influenced significantly by other perceived area-level factors as well, in particular the safety and quality of that green space [57].
The results relating to other area-level factors are generally supportive of the wider literature in this area. Our findings provide further evidence that the perception of problems with lack of open public space are affected by the perceived level of crime in an area [58]. The significance of these surrounding factors supports the conclusion within the literature that the quality of green space is important in determining how individuals perceive the green space [59]. This implies that perceived adequacy of open public space in a neighbourhood depends not only on the quantity of open public space in the neighbourhood but also on the utility and the quality of that space.
The results of models that include area-level perception variables also suggest that area-level deprivation has little role in determining perceptions around green space in an area (see the results for Model 3 in Table S3 in the Supplementary Materials). This may imply that the perceived lack of open public space in deprived areas is explicable by other perceived area-level problems, such as those outlined by [60]. Therefore, it is likely to be area safety, crime, and service provision that primarily affect an area’s impact on a person’s perceptions of open public space. This is of particular importance in the context of findings around the importance of green space for lowering stress in deprived areas [29].
4.2. Strengths and Limitations
The study benefits from a large nationally-representative dataset with an extensive set of socio-economic variables. The study also includes a set of area-level variables characterising how individuals perceive their neighbourhoods.
However, the study is also subject to some limitations. These include having access to only cross-sectional data, which implies that causal relationships cannot be identified, and not having data on respondents’ incomes or on the walkability of their local areas. It is also noteworthy that with the exception of the data on area-level deprivation, many of the variables are self-reported. They may be subject to reporting bias in face-to-face interviews such as those conducted for this survey. The data on perceived area-level problems also relies on individuals’ perceptions, which may be affected by numerous omitted variables.
5. Conclusions
Compared to those living in the lowest quintile of urban green space, respondents in areas with more green space were 5–12 percentage points less likely to perceive a lack of open public space in their area. Area-level factors, including proxies for perceived area cleanliness, service provision, and safety, showed consistently significant associations with perceived problems with open public space.
This result is consistent with the expectation that the presence of green space has a positive impact on individuals’ perceived adequacy of open public space. However, while availability of green space is important, it is clearly also important that these spaces should be of high quality. Policymakers should take these other characteristics of green space into account when using perceived green space as a proxy for the adequacy of green space in an area.
Supplementary Materials
The following are available online at https://www.mdpi.com/article/10.3390/su13158516/s1, Table S1: Average perceived problems with open space by category of the other variables used in the paper, Table S2: Summary statistics for area-level quality proxy variables, Table S3: Full regression results for models in Table 4, Table S4: Marginal effects from models with the green space reference category switched to the highest urban green space quintile, and Table S5: Marginal effects for green space variables in two alternative models.
Author Contributions
The authors contributed equally to this work. All authors have read and agreed to the published version of the manuscript.
Funding
This work was supported by the Economic and Social Research Institute’s Environment Research Programme, which is funded by Ireland’s Environmental Protection Agency.
Institutional Review Board Statement
Not applicable.
Informed Consent Statement
Not applicable.
Data Availability Statement
Data may be obtained from a third party and are not publicly available. Documents concerning the Healthy Ireland Survey, including the Microdata File Application Form, are available from Ireland’s Department of Health (https://www.gov.ie/en/collection/231c02-healthy-ireland-survey-wave/, accessed on 27 June 2021). An unlinked version of the dataset can be accessed from the Irish Social Science Data Archive (https://www.ucd.ie/issda/data/healthyireland/, accessed on 27 June 2021).
Acknowledgments
Although every effort has been made to ensure the accuracy of the material contained in this paper, complete accuracy cannot be guaranteed. Neither the Environmental Protection Agency nor the authors accept any responsibility whatsoever for loss or damage occasioned or claimed to have been occasioned, in part or in full, as a consequence of any person acting, or refraining from acting, as a result of a matter contained in this paper.
Conflicts of Interest
The authors declare no conflict of interest.
Abbreviations
The following abbreviations are used in this manuscript:
| EEA | European Environment Agency |
| EPA | Environmental Protection Agency |
| HI | Healthy Ireland |
| PCA | Principal component analysis |
| WHO | World Health Organization |
References
- WHO. Health Indicators of Sustainable Cities in the Context of the Rio+20 UN Conference on Sustainable Development; Technical Report; World Health Organization: Geneva, Switzerland, 2012. [Google Scholar]
- Carlin, C.; Cormican, C.; Gormally, M. Health Benefits from Biodiversity and Green Infastructure; Technical Report; Environmental Protection Agency: Wexford, Ireland, 2016.
- Kuo, M. How might contact with nature promote human health? Promising mechanisms and a possible central pathway. Front. Psychol. 2015, 6, 1093. [Google Scholar] [CrossRef] [PubMed]
- Maas, J.; Verheij, R.A.; Groenewegen, P.P.; de Vries, S.; Spreeuwenberg, P. Green space, urbanity, and health: How strong is the relation? J. Epidemiol. Community Health 2006, 60, 587–592. [Google Scholar] [CrossRef] [Green Version]
- Mitchell, R.; Popham, F. Greenspace, urbanity and health: Relationships in England. J. Epidemiol. Community Health 2007, 61, 681–683. [Google Scholar] [CrossRef] [Green Version]
- van den Berg, A.E.; Maas, J.; Verheij, R.A.; Groenewegen, P.P. Green space as a buffer between stressful life events and health. Soc. Sci. Med. 2010, 70, 1203–1210. [Google Scholar] [CrossRef] [Green Version]
- Mytton, O.T.; Townsend, N.; Rutter, H.; Foster, C. Green space and physical activity: An observational study using Health Survey for England data. Health Place 2012, 18, 1034–1041. [Google Scholar] [CrossRef] [Green Version]
- Lachowycz, K.; Jones, A.P. Greenspace and obesity: A systematic review of the evidence. Obes. Rev. 2011, 12, e183–e189. [Google Scholar] [CrossRef]
- Hillsdon, M.; Panter, J.; Foster, C.; Jones, A. The relationship between access and quality of urban green space with population physical activity. Public Health 2006, 120, 1127–1132. [Google Scholar] [CrossRef] [PubMed]
- Dempsey, S.; Lyons, S.; Nolan, A. Urban green space and obesity in older adults: Evidence from Ireland. SSM Popul. Health 2018, 4, 206–215. [Google Scholar] [CrossRef] [PubMed]
- Leslie, E.; Sugiyama, T.; Ierodiaconou, D.; Kremer, P. Perceived and objectively measured greenness of neighbourhoods: Are they measuring the same thing? Landsc. Urban Plan. 2010, 95, 28–33. [Google Scholar] [CrossRef]
- Maddison, R.; Hoorn, S.; Jiang, Y.; Mhurchu, C.; Exeter, D.; Dorey, E.; Bullen, C.; Utter, J.; Schaaf, D.; Turley, M. The environment and physical activity: The influence of psychosocial, perceived and built environmental factors. Int. J. Behav. Nutr. Phys. Act. 2009, 6, 19. [Google Scholar] [CrossRef] [PubMed] [Green Version]
- Macintyre, S.; Macdonald, L.; Ellaway, A. Lack of agreement between measured and self-reported distance from public green parks in Glasgow, Scotland. Int. J. Behav. Nutr. Phys. Act. 2008, 5, 26. [Google Scholar] [CrossRef] [Green Version]
- Lackey, K.J.; Kaczynski, A.T. Correspondence of perceived vs. objective proximity to parks and their relationship to park-based physical activity. J. Behav. Nutr. Phys. Act. 2009, 6, 56. [Google Scholar] [CrossRef] [PubMed] [Green Version]
- Boehmer, T.K.; Lovegreen, S.L.; Haire-Joshu, D.; Brownson, R.C. What Constitutes an Obesogenic Environment in Rural Communities? Am. J. Health Promot. 2006, 20, 411–421. [Google Scholar] [CrossRef] [PubMed]
- Ball, K.; Jeffery, R.W.; Crawford, D.A.; Roberts, R.J.; Salmon, J.; Timperio, A.F. Mismatch between perceived and objective measures of physical activity environments. Prev. Med. 2008, 47, 294–298. [Google Scholar] [CrossRef]
- Sanesi, G.; Chiarello, F. Residents and urban green spaces: The case of Bari. Urban For. Urban Green. 2006, 4, 125–134. [Google Scholar] [CrossRef]
- Bjork, J.; Albin, M.; Grahn, P.; Jacobsson, H.; Ardo, J.; Wadbro, J.; Ostergren, P.O.; Skarback, E. Recreational values of the natural environment in relation to neighbourhood satisfaction, physical activity, obesity and wellbeing. J. Epidemiol. Community Health 2008, 62, e2. [Google Scholar] [CrossRef]
- de Jong, K.; Albin, M.; Skärbäck, E.; Grahn, P.; Björk, J. Perceived green qualities were associated with neighborhood satisfaction, physical activity, and general health: Results from a cross-sectional study in suburban and rural Scania, southern Sweden. Health Place 2012, 18, 1374–1380. [Google Scholar] [CrossRef] [PubMed]
- Hoehner, C.M.; Ivy, A.; Ramirez, L.B.; Meriwether, B.; Brownson, R.C. How Reliably Do Community Members Audit the Neighborhood Environment for Its Support of Physical Activity? Implications for Participatory Research. J. Public Health Manag. Pract. 2006, 12, 270–277. [Google Scholar] [CrossRef]
- Barbosa, O.; Tratalos, J.A.; Armsworth, P.R.; Davies, R.G.; Fuller, R.A.; Johnson, P.; Gaston, K.J. Who benefits from access to green space? A case study from Sheffield, UK. Landsc. Urban Plan. 2007, 83, 187–195. [Google Scholar] [CrossRef]
- Arnberger, A. Urban Densification and Recreational Quality of Public Urban Green Spaces—A Viennese Case Study. Sustainability 2012, 4, 703–720. [Google Scholar] [CrossRef] [Green Version]
- Grahn, P.; Stigsdotter, U.K. The relation between perceived sensory dimensions of urban green space and stress restoration. Landsc. Urban Plan. 2010, 94, 264–275. [Google Scholar] [CrossRef]
- Schebella, M.; Weber, D.; Schultz, L.; Weinstein, P. The Wellbeing Benefits Associated with Perceived and Measured Biodiversity in Australian Urban Green Spaces. Sustainability 2019, 11, 802. [Google Scholar] [CrossRef] [Green Version]
- Li, X.; Liu, L.; Zhang, Z.; Zhang, W.; Liu, D.; Feng, Y. Gender Disparity in Perceived Urban Green Space and Subjective Health and Well-Being in China: Implications for Sustainable Urban Greening. Sustainability 2020, 12, 10538. [Google Scholar] [CrossRef]
- Thompson, C.W.; Roe, J.; Aspinall, P.; Mitchell, R.; Clow, A.; Miller, D. More green space is linked to less stress in deprived communities: Evidence from salivary cortisol patterns. Landsc. Urban Plan. 2012, 105, 221–229. [Google Scholar] [CrossRef] [Green Version]
- Jones, A.; Hillsdon, M.; Coombes, E. Greenspace access, use, and physical activity: Understanding the effects of area deprivation. Prev. Med. 2009, 49, 500–505. [Google Scholar] [CrossRef] [PubMed] [Green Version]
- Chong, S.; Lobb, E.; Khan, R.; Abu-Rayya, H.; Byun, R.; Jalaludin, B. Neighbourhood safety and area deprivation modify the associations between parkland and psychological distress in Sydney, Australia. BMC Public Health 2013, 13, 422. [Google Scholar] [CrossRef] [PubMed] [Green Version]
- Roe, J.; Thompson, C.; Aspinall, P.; Brewer, M.; Duff, E.; Miller, D.; Mitchell, R.; Clow, A. Green Space and Stress: Evidence from Cortisol Measures in Deprived Urban Communities. Int. J. Environ. Res. Public Health 2013, 10, 4086–4103. [Google Scholar] [CrossRef] [Green Version]
- Dahmann, N.; Wolch, J.; Joassart-Marcelli, P.; Reynolds, K.; Jerrett, M. The active city? Disparities in provision of urban public recreation resources. Health Place 2010, 16, 431–445. [Google Scholar] [CrossRef]
- Giles-Corti, B.; Donovan, R.J. The relative influence of individual, social and physical environment determinants of physical activity. Soc. Sci. Med. 2002, 54, 1793–1812. [Google Scholar] [CrossRef]
- Charalampopoulos, I.; Tsiros, I.; Chronopoulou-Sereli, A.; Matzarakis, A. Analysis of thermal bioclimate in various urban configurations in Athens, Greece. Urban Ecosyst. 2012, 16, 217–233. [Google Scholar] [CrossRef]
- Lobaccaro, G.; Acero, J.A.; Sanchez Martinez, G.; Padro, A.; Laburu, T.; Fernandez, G. Effects of Orientations, Aspect Ratios, Pavement Materials and Vegetation Elements on Thermal Stress inside Typical Urban Canyons. Int. J. Environ. Res. Public Health 2019, 16, 3574. [Google Scholar] [CrossRef] [Green Version]
- Zölch, T.; Rahman, M.A.; Pfleiderer, E.; Wagner, G.; Pauleit, S. Designing public squares with green infrastructure to optimize human thermal comfort. Build. Environ. 2019, 149, 640–654. [Google Scholar] [CrossRef]
- Karimi, A.; Sanaieian, H.; Farhadi, H.; Norouzian-Maleki, S. Evaluation of the thermal indices and thermal comfort improvement by different vegetation species and materials in a medium-sized urban park. Energy Rep. 2020, 6, 1670–1684. [Google Scholar] [CrossRef]
- Ross, C.E.; Mirowsky, J. Neighborhood Disadvantage, Disorder, and Health. J. Health Soc. Behav. 2001, 42, 258–276. [Google Scholar] [CrossRef] [PubMed] [Green Version]
- Lovasi, G.S.; Schwartz-Soicher, O.; Quinn, J.W.; Berger, D.K.; Neckerman, K.M.; Jaslow, R.; Lee, K.K.; Rundle, A. Neighborhood safety and green space as predictors of obesity among preschool children from low-income families in New York City. Prev. Med. 2013, 57, 189–193. [Google Scholar] [CrossRef] [Green Version]
- Maas, J.; Spreeuwenberg, P.; van Winsum-Westra, M.; Verheij, R.A.; Vries, S.; Groenewegen, P.P. Is Green Space in the Living Environment Associated with People’s Feelings of Social Safety? Environ. Plan. A Econ. Space 2009, 41, 1763–1777. [Google Scholar] [CrossRef] [Green Version]
- Ward, J.S.; Duncan, J.S.; Jarden, A.; Stewart, T. The impact of children’s exposure to greenspace on physical activity, cognitive development, emotional wellbeing, and ability to appraise risk. Health Place 2016, 40, 44–50. [Google Scholar] [CrossRef]
- Sister, C.; Wolch, J.; Wilson, J. Got green? addressing environmental justice in park provision. GeoJournal 2009, 75, 229–248. [Google Scholar] [CrossRef]
- Jansson, M.; Fors, H.; Lindgren, T.; Wiström, B. Perceived personal safety in relation to urban woodland vegetation—A review. Urban For. Urban Green. 2013, 12, 127–133. [Google Scholar] [CrossRef] [Green Version]
- Wyant, B.R. Multilevel Impacts of Perceived Incivilities and Perceptions of Crime Risk on Fear of Crime. J. Res. Crime Delinq. 2008, 45, 39–64. [Google Scholar] [CrossRef]
- Franklin, T.W.; Franklin, C.A.; Fearn, N.E. A Multilevel Analysis of the Vulnerability, Disorder, and Social Integration Models of Fear of Crime. Soc. Justice Res. 2008, 21, 204–227. [Google Scholar] [CrossRef]
- Bogar, S.; Beyer, K.M. Green Space, Violence, and Crime. Trauma Violence Abus. 2015, 17, 160–171. [Google Scholar] [CrossRef]
- Weir, L.A.; Etelson, D.; Brand, D.A. Parents’ perceptions of neighborhood safety and children’s physical activity. Prev. Med. 2006, 43, 212–217. [Google Scholar] [CrossRef]
- Carver, A.; Timperio, A.; Crawford, D. Playing it safe: The influence of neighbourhood safety on children’s physical activity—A review. Health Place 2008, 14, 217–227. [Google Scholar] [CrossRef] [PubMed]
- Humpel, N. Environmental factors associated with adults’ participation in physical activity A review. Am. J. Prev. Med. 2002, 22, 188–199. [Google Scholar] [CrossRef]
- Foster, C. Environmental perceptions and walking in English adults. J. Epidemiol. Community Health 2004, 58, 924–928. [Google Scholar] [CrossRef] [Green Version]
- Gebel, K.; Bauman, A.; Owen, N. Correlates of non-concordance between perceived and objective measures of walkability. Ann. Behav. Med. 2009, 37, 228–238. [Google Scholar] [CrossRef] [PubMed]
- Hanibuchi, T.; Yonejima, M.; Nakaya, T.; Kaori, H. Perceived and Objective Measures of Neighborhood Walkability and Physical Activity among Adults in Japan: A Multilevel Analysis of a Nationally Representative Sample. Int. J. Environ. Res. Public Health 2015, 12, 13350–13364. [Google Scholar] [CrossRef] [Green Version]
- Talen, E.; Koschinsky, J. The Walkable Neighborhood: A Literature Review. Int. J. Sustain. Land Use Urban Plan. 2013, 1. [Google Scholar] [CrossRef]
- Suarez-Balcazar, Y. Meaningful Engagement in Research: Community Residents as Co-creators of Knowledge. Am. J. Community Psychol. 2020, 65, 261–271. [Google Scholar] [CrossRef]
- Ipsos-MRBI. Healthy Ireland Survey 2016—Technical Report; Ipsos-MRBI: Dublin, Ireland, 2017. [Google Scholar]
- Smith, G.; Gidlow, C.; Davey, R.; Foster, C. What is my walking neighbourhood? A pilot study of English adults’ definitions of their local walking neighbourhoods. Int. J. Behav. Nutr. Phys. Act. 2010, 7, 34. [Google Scholar] [CrossRef] [PubMed] [Green Version]
- Sugiyama, T.; Francis, J.; Middleton, N.J.; Owen, N.; Giles-Corti, B. Associations Between Recreational Walking and Attractiveness, Size, and Proximity of Neighborhood Open Spaces. Am. J. Public Health 2010, 100, 1752–1757. [Google Scholar] [CrossRef] [PubMed]
- Wold, S.; Esbensen, K.; Geladi, P. Principal component analysis. Chemom. Intell. Lab. Syst. 1987, 2, 37–52. [Google Scholar] [CrossRef]
- Li, F.; Fisher, K.J.; Brownson, R.C.; Bosworth, M. Multilevel modelling of built environment characteristics related to neighbourhood walking activity in older adults. J. Epidemiol. Community Health 2005, 59, 558–564. [Google Scholar] [CrossRef] [Green Version]
- Fleming, C.M.; Manning, M.; Ambrey, C.L. Crime, greenspace and life satisfaction: An evaluation of the New Zealand experience. Landsc. Urban Plan. 2016, 149, 1–10. [Google Scholar] [CrossRef]
- van Dillen, S.M.E.; de Vries, S.; Groenewegen, P.P.; Spreeuwenberg, P. Greenspace in urban neighbourhoods and residents’ health: Adding quality to quantity. J. Epidemiol. Community Health 2011, 66, e8. [Google Scholar] [CrossRef] [Green Version]
- Gidlow, C.J.; Ellis, N.J. Neighbourhood green space in deprived urban communities: Issues and barriers to use. Local Environ. 2011, 16, 989–1002. [Google Scholar] [CrossRef]
Figure 1.
Flowchart of methodology used and relationships examined.

Figure 2.
Share of respondents reporting a problem with lack of open public space by green space category.
Figure 2.
Share of respondents reporting a problem with lack of open public space by green space category.

Figure 3.
Marginal effects from Model 3 for green space categories compared to urban quintile 1 (least green space). Vertical lines show 95% confidence intervals.
Figure 3.
Marginal effects from Model 3 for green space categories compared to urban quintile 1 (least green space). Vertical lines show 95% confidence intervals.


Table 1.
Summary statistics for variables in Healthy Ireland wave 2.
| Variable Name | Category | Percentage of Sample |
|---|---|---|
| Perceived green space problem | No problem | |
| Problem | ||
| Green space quintile | 0. Rural (no data) | |
| 1. Least green space | ||
| 2. | ||
| 3. | ||
| 4. | ||
| 5. | ||
| Gender | Female | |
| Male | ||
| Deprivation quintile | 1. Most deprived | |
| 2. | ||
| 3. | ||
| 4. | ||
| 5. least deprived | ||
| Region | Dublin | |
| Munster | ||
| Rest of Leinster | ||
| Connaught/Ulster | ||
| Medical card status | No medical card | |
| GP visit card | ||
| Full medical card | ||
| Private Health Insurance | No | |
| Yes | ||
| Immigrant | No | |
| Yes | ||
| Married | No | |
| Yes | ||
| Education level | Primary | |
| Secondary | ||
| Tertiary | ||
| Unemployed | No | |
| Yes |
Table 2.
Summary statistics for area-level perception variables in Healthy Ireland wave 2.
| Variable Name | Category | Percentage of Sample |
|---|---|---|
| Problem with public transport | No problem | |
| A bit of a problem | ||
| A big problem | ||
| Problem with food shops | No problem | |
| A bit of a problem | ||
| A big problem | ||
| Problem with racism | No problem | |
| A bit of a problem | ||
| A big problem | ||
| Problem with people being drunk | No problem | |
| A bit of a problem | ||
| A big problem | ||
| Problem with graffiti | No problem | |
| A bit of a problem | ||
| A big problem | ||
| Problem with rubbish | No problem | |
| A bit of a problem | ||
| A big problem | ||
| Problem with vandalism | No problem | |
| A bit of a problem | ||
| A big problem | ||
| Problem with break ins | No problem | |
| A bit of a problem | ||
| A big problem |
Table 3.
Rotation matrices of principal components.
| Principal Component Correlation | |
|---|---|
| Area-level Safety | |
| People being drunk (PBD) | −0.261 |
| Racism | −0.173 |
| House break-ins | −0.950 |
| Eigenvalue | 0.400 |
| Area-level service provision | |
| Problem with public transport | −0.913 |
| Problem with food shops | −0.408 |
| Eigenvalue | 0.708 |
| Area-level cleanliness | |
| Vandalism | 0.455 |
| Rubbish | 0.795 |
| Graffiti | 0.401 |
| Eigenvalue | 0.469 |
Table 4.
Marginal effects of objective green space quintiles on perceiving an problem with open public space.
Table 4.
Marginal effects of objective green space quintiles on perceiving an problem with open public space.
| Dependent Variable: Perceive a Problem with Lack of Open Public Space = 1 | |||
|---|---|---|---|
| Basic Model | Model with Social Controls | Model with All Controls | |
| (1) | (2) | (3) | |
| Green space quintile 1 (least green space) | REF | REF | REF |
| Green space quintile 2 | −0.061 ** | −0.090 *** | −0.041 |
| (0.025) | (0.030) | (0.030) | |
| Green space quintile 3 | −0.061 ** | −0.099 *** | −0.091 *** |
| (0.024) | (0.031) | (0.029) | |
| Green space quintile 4 | −0.081 *** | −0.123 *** | −0.113 *** |
| (0.024) | (0.031) | (0.028) | |
| Green space quintile 5 (most green space) | −0.049 ** | −0.076 ** | −0.079 *** |
| (0.025) | (0.033) | (0.029) | |
| Non-city. | −0.072 *** | −0.137 *** | −0.119 *** |
| (0.021) | (0.032) | (0.030) | |
| Area-level service provision PC | −0.009 *** | ||
| (0.004) | |||
| Area-level safety PC | −0.031 *** | ||
| (0.005) | |||
| Area-level cleanliness PC | −0.026 *** | ||
| (0.004) | |||
| Observations | 7347 | 7347 | 7347 |
| Log Likelihood | −2211 | −2161 | −1828 |
| Pseudo-R2 | 0.026 | 0.048 | 0.195 |
| AIC | 4441 | 4372 | 3711 |
| BIC | 4510 | 4544 | 3904 |
Note: ** p < 0.05; *** p < 0.01; Table S3 in the Supplementary Material provides the full regression results for these models. AIC reports the Akaike Information Criterion test and BIC reports the Bayesian Information Criterion test.
Publisher’s Note: MDPI stays neutral with regard to jurisdictional claims in published maps and institutional affiliations. |
© 2021 by the authors. Licensee MDPI, Basel, Switzerland. This article is an open access article distributed under the terms and conditions of the Creative Commons Attribution (CC BY) license (https://creativecommons.org/licenses/by/4.0/).
Share and Cite
MDPI and ACS Style
Barlow, P.; Lyons, S.; Nolan, A. How Perceived Adequacy of Open Public Space Is Related to Objective Green Space and Individuals’ Opinions of Area-Level Quality. Sustainability 2021, 13, 8516. https://doi.org/10.3390/su13158516
AMA Style
Barlow P, Lyons S, Nolan A. How Perceived Adequacy of Open Public Space Is Related to Objective Green Space and Individuals’ Opinions of Area-Level Quality. Sustainability. 2021; 13(15):8516. https://doi.org/10.3390/su13158516
Chicago/Turabian StyleBarlow, Peter, Sean Lyons, and Anne Nolan. 2021. "How Perceived Adequacy of Open Public Space Is Related to Objective Green Space and Individuals’ Opinions of Area-Level Quality" Sustainability 13, no. 15: 8516. https://doi.org/10.3390/su13158516
Note that from the first issue of 2016, this journal uses article numbers instead of page numbers. See further details here.