
Assessing the Impact of Extreme Temperature Conditions on Social Vulnerability


1
Hungarian Department of Geography, Research Center for Sustainable Development, Babes-Bolyai University, 400006 Cluj-Napoca, Romania
2
Department of Physical and Technical Geography, Research Center for Sustainable Development, Babes-Bolyai University, 400006 Cluj-Napoca, Romania
3
Department of Regional Geography and Territorial Planning, Research Center for Regional Geography, Babes-Bolyai University, 400006 Cluj-Napoca, Romania
*
Author to whom correspondence should be addressed.
Sustainability 2021, 13(15), 8510; https://doi.org/10.3390/su13158510
Submission received: 29 June 2021
/
Revised: 26 July 2021
/
Accepted: 27 July 2021
/
Published: 30 July 2021
Abstract
:This research aims to improve the existing methodology by quantifying the effects of climate change on social vulnerability by developing a set of vulnerability indicators. It delimits for the first time in Romania the most vulnerable areas from this point of view and facilitates the decision-making processes and planning efforts targeting the increase of resilience and adaptive capacity of local communities. We selected 35 variables and constructed four aggregated indexes by applying the principal component analysis, and then the Climate-Related Social Vulnerability index (CleSoVI) index was derived. It pointed out that the most significant impact on the vulnerability of settlements in the test region (Cluj County) can be attributed to the lack of adaptive capacity and increased poverty. The most vulnerable areas are located in the northern and south-eastern parts of the county. From a socio-economic point of view, local authorities’ efforts should reduce the vulnerability of these regions and prepare them to cope with and adapt to the impact of climate change.
1. Introduction
Research on social vulnerability has largely evolved in the last decades due to the increasing occurrence of extreme weather events resulting from climate change. Nevertheless, the adoption of the 2030 Agenda with its 17 Sustainable Development Goals has globally committed to taking urgent action to combat climate change and its impact (goal 13) [1]. There is a broad agreement that vulnerability is a complex phenomenon influenced by social, economic, environmental, or demographic characteristics.
The Intergovernmental Panel on Climate Change defines vulnerability to climate change as the “degree to which geophysical, biological, and socio-economic systems are susceptible to and unable to cope with adverse impacts of climate change” [2]. This vulnerability depends on climate change intensity and is influenced by the sensitivity and adaptability of the exposed system [3].
Over the last decades, different approaches for analyzing vulnerability have been developed and widely accepted, emphasizing the importance of socio-economic, political, or cultural factors on a society’s exposure, impact, and capacity to recover after an unexpected hazard event [4,5,6]. Social factors include many variables, such as gender, ethnicity, age, education, poverty, and thus they can be regarded as the partial outcome of social inequalities [7,8]. Under these conditions, marginalized groups of society are more susceptible and exposed to environmental hazards. According to Birkmann [9], vulnerability encompasses physical, social, economic, environmental, and institutional features, giving an integrated perspective to vulnerability studies [10]. Not all places are affected by natural hazards in the same manner: e.g., biophysical vulnerability differs from site to site. Tschakert et al. [11] conducted a climate-related comparative systematic analysis on more than 100 published case studies worldwide. They have revealed that the same natural hazards can produce different impacts from almost no destruction to irremediable damage across numerous dimensions irrespective of the country’s general level of development. In the last decades, the effects of global climate change could be observed in the frequency of extreme heat events, with more severe heat-related health effects, especially in urban areas [12,13,14]. There has also been significant progress in understanding the relationship between extreme heat and human health and identifying population characteristics associated with these effects [15,16]. Besides the social and economic disparities, living conditions, language, and occupational barriers, Hansen et al. [17] have revealed that ethnicity also represents a risk factor for heat-related mortality. Several studies conducted in North America have confirmed morbidity and mortality rates associated with extreme weather are usually higher among African-American groups. The same authors have stated that disparities between heat-associated health outcome rates in different ethnicities deserve further investigation [17].
The concept of vulnerability to climate change has been studied by several authors as well [4,18,19,20]. Most studies have proved that social, economic, and cultural elements are of utmost importance, similarly to the biophysical factors [7,21,22,23,24]. Consequently, in the last few years, indicator-based methods have represented the most employed tools for vulnerability assessment [3,25,26,27]. These studies have been elaborated for different scales (countries or cities) and applied to numerous regions worldwide. In Romania, several authors have focused previously on research on social vulnerability. However, none of them has included the impact of climate conditions in their work [28,29,30,31,32].
Spatially based local vulnerability assessment can support the decision-making process to identify areas and communities that are most affected by natural hazards with resource allocation and project prioritization more objectively [9]. Their identification is important because some of the targeted policies formulated at the national level are not always relevant to the most vulnerable settlements. Moreover, interventions for economic development, like poverty reduction, food security, and sustainable livelihoods, could be formulated at least at the meso-level. Still, the different adaptation practices for increasing the resilience of communities are in the hands of local communities. Therefore, the spatial scale of any vulnerability analysis is a crucial factor. Formetta and Feyen [33] have analyzed the socio-economic vulnerability to climate-related hazards between 1980 and 2016, stating that there is still a significant climate hazard vulnerability gap between less-developed and well-developed countries. Hence, the need to collect and construct disaster-related databases, especially at the local level, should become a priority. It could facilitate the implementation of the disaster risk reduction targets of the sustainable development goals.
Besides the different approaches used to conceptualize social vulnerability, there are also several techniques for measuring it. One of the most widely used and accepted methods is the Social Vulnerability Index (SoVI®) developed by Cutter [5] and tested by Fekete [34], Holand [35], Chen et al. [36], and Rufat et al. [37]. Among the weak points of this method is that it attributes an equal impact to all considered factors. Therefore, recent studies have focused on using different weighting techniques [32,34,35,36,37,38,39,40] or developing entirely new models [31,41].
This paper aims to provide a methodological contribution for assessing vulnerability at the local level and promote the integration of climate change into sectoral and local/regional policies to increase the communities’ climate resilience. We adopted the concept of social-environmental vulnerability, which integrates both biophysical (mainly climate-related) and social factors and their effects on the human population (“place vulnerability”). This approach can be replicated in different regions of the world. The following parts of the study are as follows: Section 2 presents our case study area and data collection methods, and Section 3 gives an overview of the methodology. Finally, results and discussions about climate influence on social vulnerability are provided in Section 4 and Section 5. Conclusions are given in Section 6.
2. Study Area and Data
2.1. The Study Area
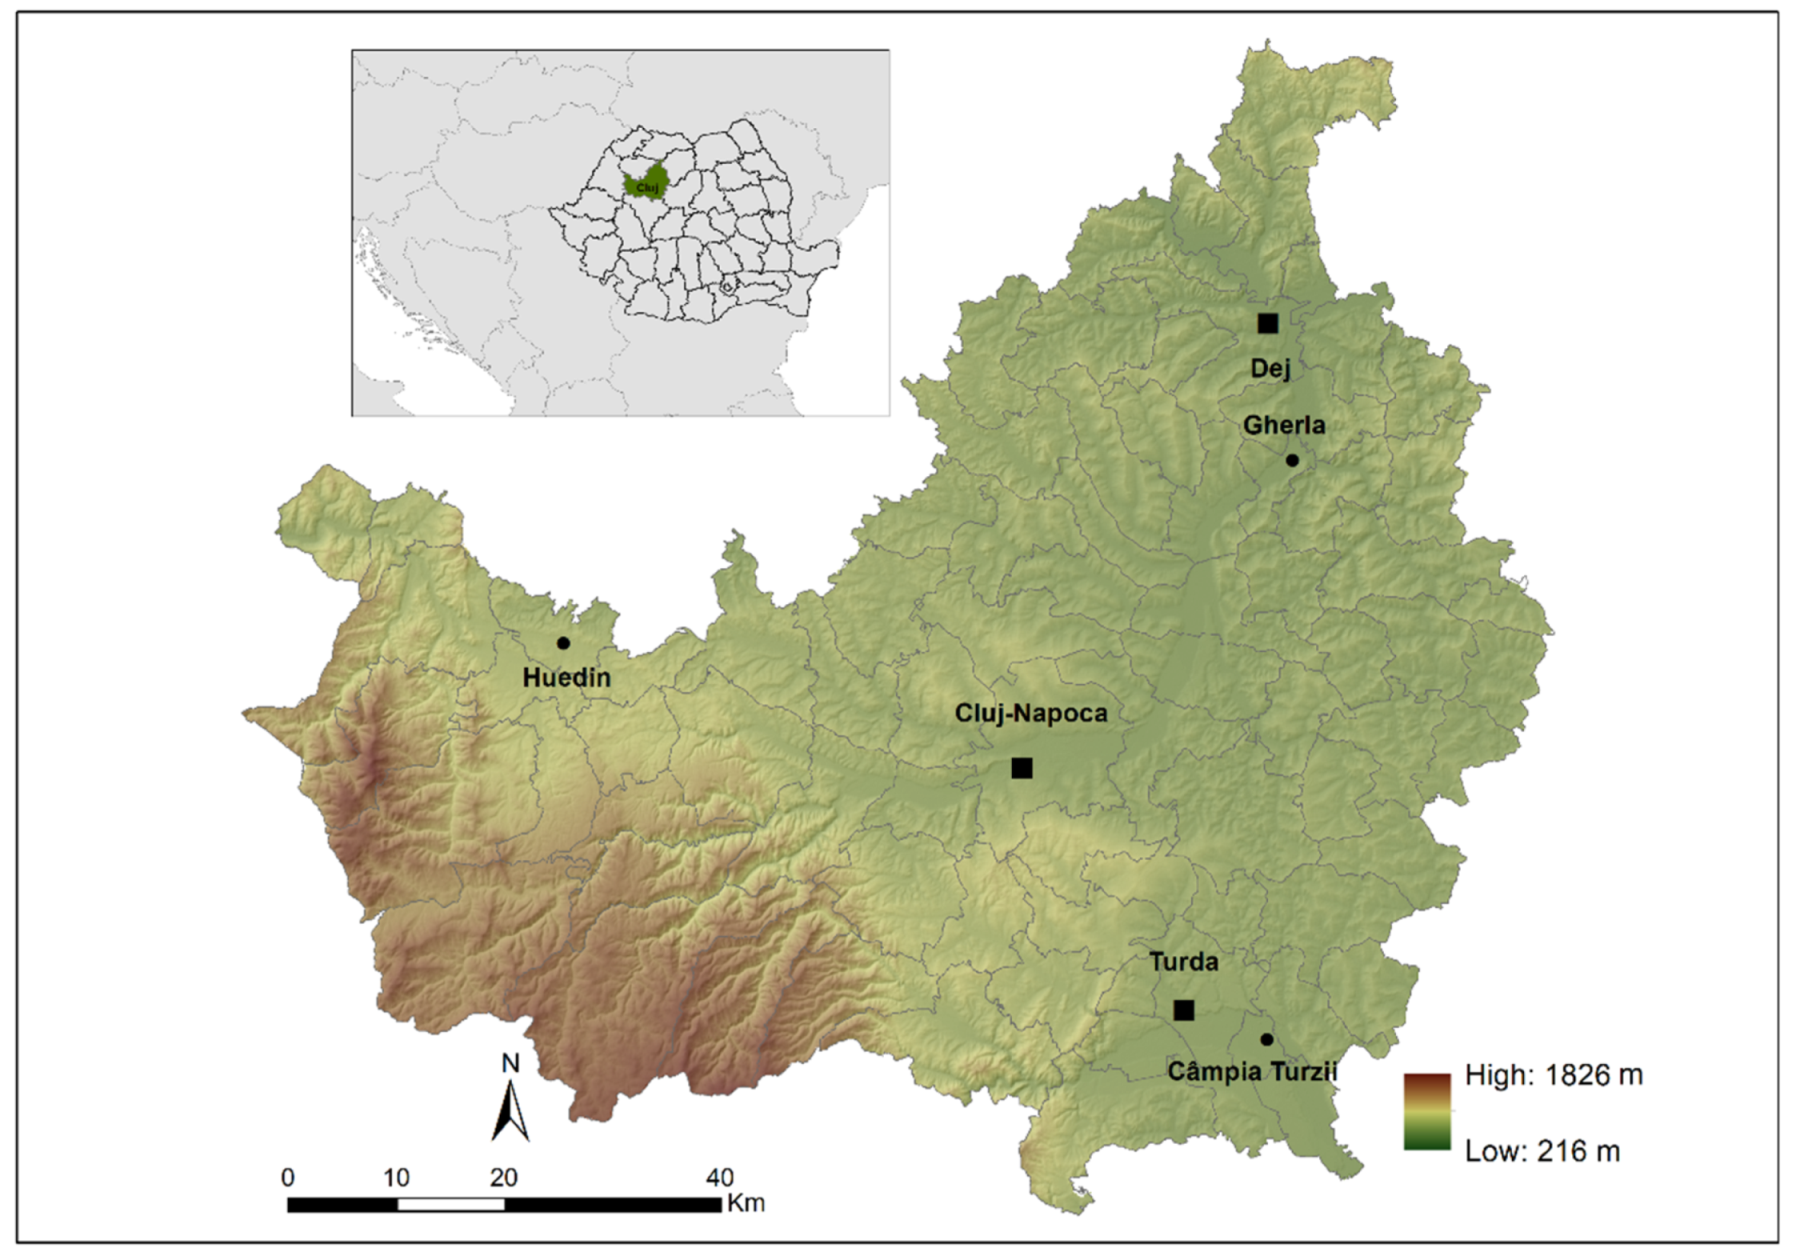
The focus area, Cluj County, is located in the northwestern part of Romania. With an area of 6674 km2, it is the 12th largest county of Romania, and it includes five towns and 81 rural settlements, totalizing 420 villages. In 2020, the county’s population was 736,945, out of which 480,241 (65.2%) were living in urban areas. The largest city is Cluj-Napoca, an important historical, cultural, educational, and healthcare center and one of the most developed Romanian cities in terms of the economy [42].
The topography is very complex, dominated by hills belonging to the Someș Plateau and, to a much lesser extent, by the northeastern Apuseni Mountains (part of Western Carpathians), covering about 30% of the county. The county has very few plains, but it has numerous riversides, suitable for agriculture and settlements’ locations. The eastern part of the county partially overlaps over some gas-condensate domes. The altitude varies from less than 300 m to more than 1800 m (Figure 1).
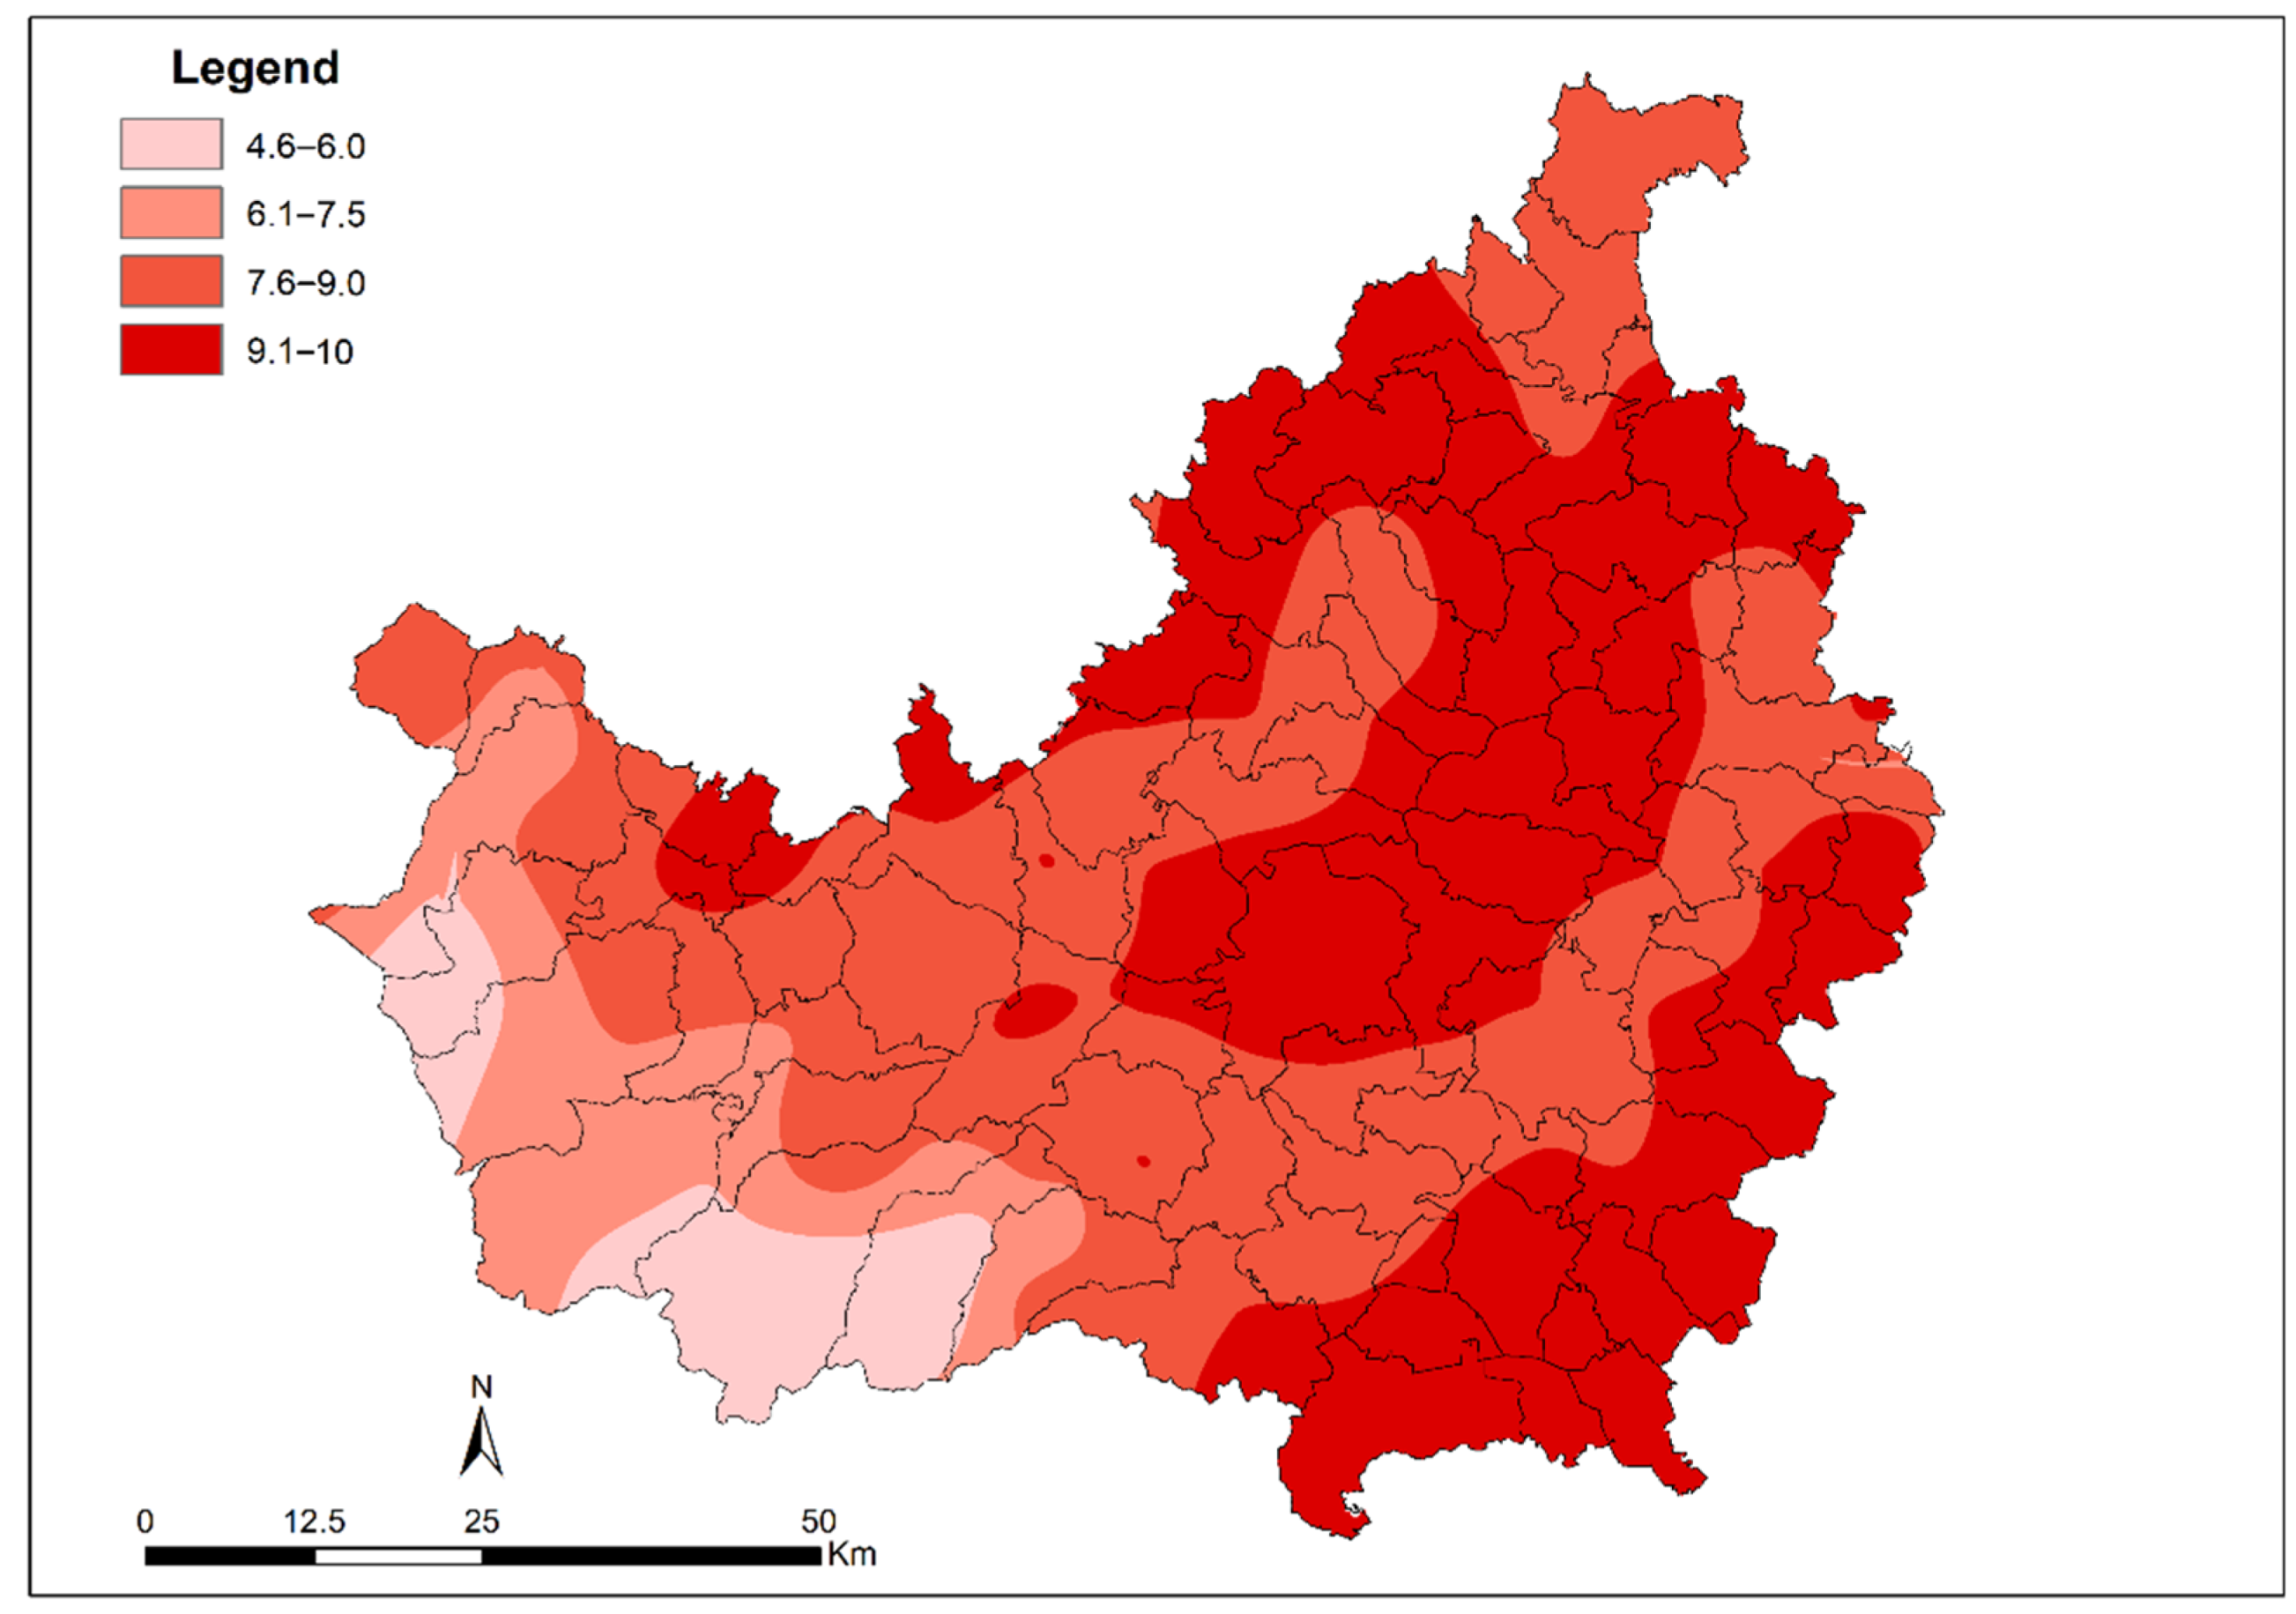
The climate of the analyzed area is moderate, temperate-continental, the altitude greatly influencing the average temperatures and precipitation. In the mountain areas, the average annual temperature is between 4.5 and 6.5 °C, and in the lowlands, it varies from 7.5 to less than 10.0 °C (Figure 2). Effective precipitation (cumulated in days with an amount equal to or greater than 1.0 mm) ranges from less than 500–600 mm/year., on the eastern lee mountain slopes and most of the lowlands, to more than 1100 mm/year., in the mountain region. The historical highs are at least 20% above, ranging from 600 to more than 1500 mm/year. It is of utmost importance to mention that significant changes have been detected over the last decades, mainly in temperature. An increase has been registered in maximum and minimum temperatures, with a steeper slope for the maximum values [43]. For precipitation, no significant changes have been identified during the last five decades [44,45].
According to the International Disaster Database, the most severe coldwaves and winter conditions in the last two decades occurred in 2000, 2002, 2005, 2008, and 2009, when outside temperatures fell below −34 °C, resulting in the death of 146 people [47]. By contrast, in the eastern part of the analyzed region, where agriculture represents the dominant economic activity, the duration, and frequency of heatwave events, usually associated with persistent drought or convective storm, make people and places more vulnerable. The same database revealed that the most severe weather conditions in the analyzed county had been recorded in 2004 when outside temperatures reached 38 °C leading to 27 deaths, and in 2017 when a convective storm led to 9 fatalities and total damage of $7,300,000 [47]. A sharp decrease in crop production was recorded during the same years: 21.4%, in 2004, and 11.9%, in 2017 [42]. Moreover, in the two years mentioned before (2004 and 2017), 53.9% of the registered illnesses in the analyzed county have been strongly related to cardiovascular diseases, with a direct contribution from the effects of extreme temperatures. For example, in Cluj-Napoca, an approximately 14% increase in general mortality was registered during heatwaves. Such events tend to become a threat since they have constantly increased in frequency, duration, and intensity over the last decades in Romania [48].
2.2. Selection of Variables
The most commonly used indicators in assessing social vulnerability to climate change include person-specific factors like ethnicity, age, gender, state of health, and location-specific factors related to socio-economic status and housing conditions [49,50,51]. After a detailed review of the related literature, 35 simple indicators were selected and tailored to fit the specificity of Cluj County. When choosing the indicators, the most crucial issue was ensuring that the chosen variables address the purpose of the research: to identify those vulnerable areas exposed to different climate conditions/effects. The database includes 6 exposure indicators, 15 sensitivity indicators, and 14 indicators for adaptive capacity (Table 1).
Demographic, social and economic indicators, including the 2011 Population and Dwelling Census, are freely available from the National Institute of Statistics, the Tempo online web database, and the Territorial Observatory. The datasets contain data from 1990 onwards, both at regional and local levels [42]. To have an integrated and comparable database for all variables, we have considered the values for 2018 because some data were not available for more recent years.
The second data source, which included public revenues and public expenses by category, was provided by the Ministry of Regional Development and Public Administration [52].
Climate indicators, representing the third data source, were derived from daily extreme (maximum and minimum) temperature-gridded data for the entire county at a spatial resolution of 0.1° (latitude and longitude). The gridded data over a 53-year period (1961–2013) were made available by the Romanian National Meteorological Administration through the ROCADA database [45]. It covers the entire territory of Romania, is freely available on the World Data Center PANGAEA portal, and was developed based on the highest spatial density of quality-controlled weather station measurement data in Romania. ROCADA-derived data have the best spatial resolution and accuracy when compared to other available gridded databases at present, such as the European climate database (E-OBS) [53] or that developed for the Carpathian region (CarpatClim) [54]. From a total number of 26 extreme temperature indices calculated for the entire county [55], we have chosen for this study only those that showed a statistically significant change over the considered period. Their mean multiannual spatial distribution is presented in Appendix A.
3. Methodology
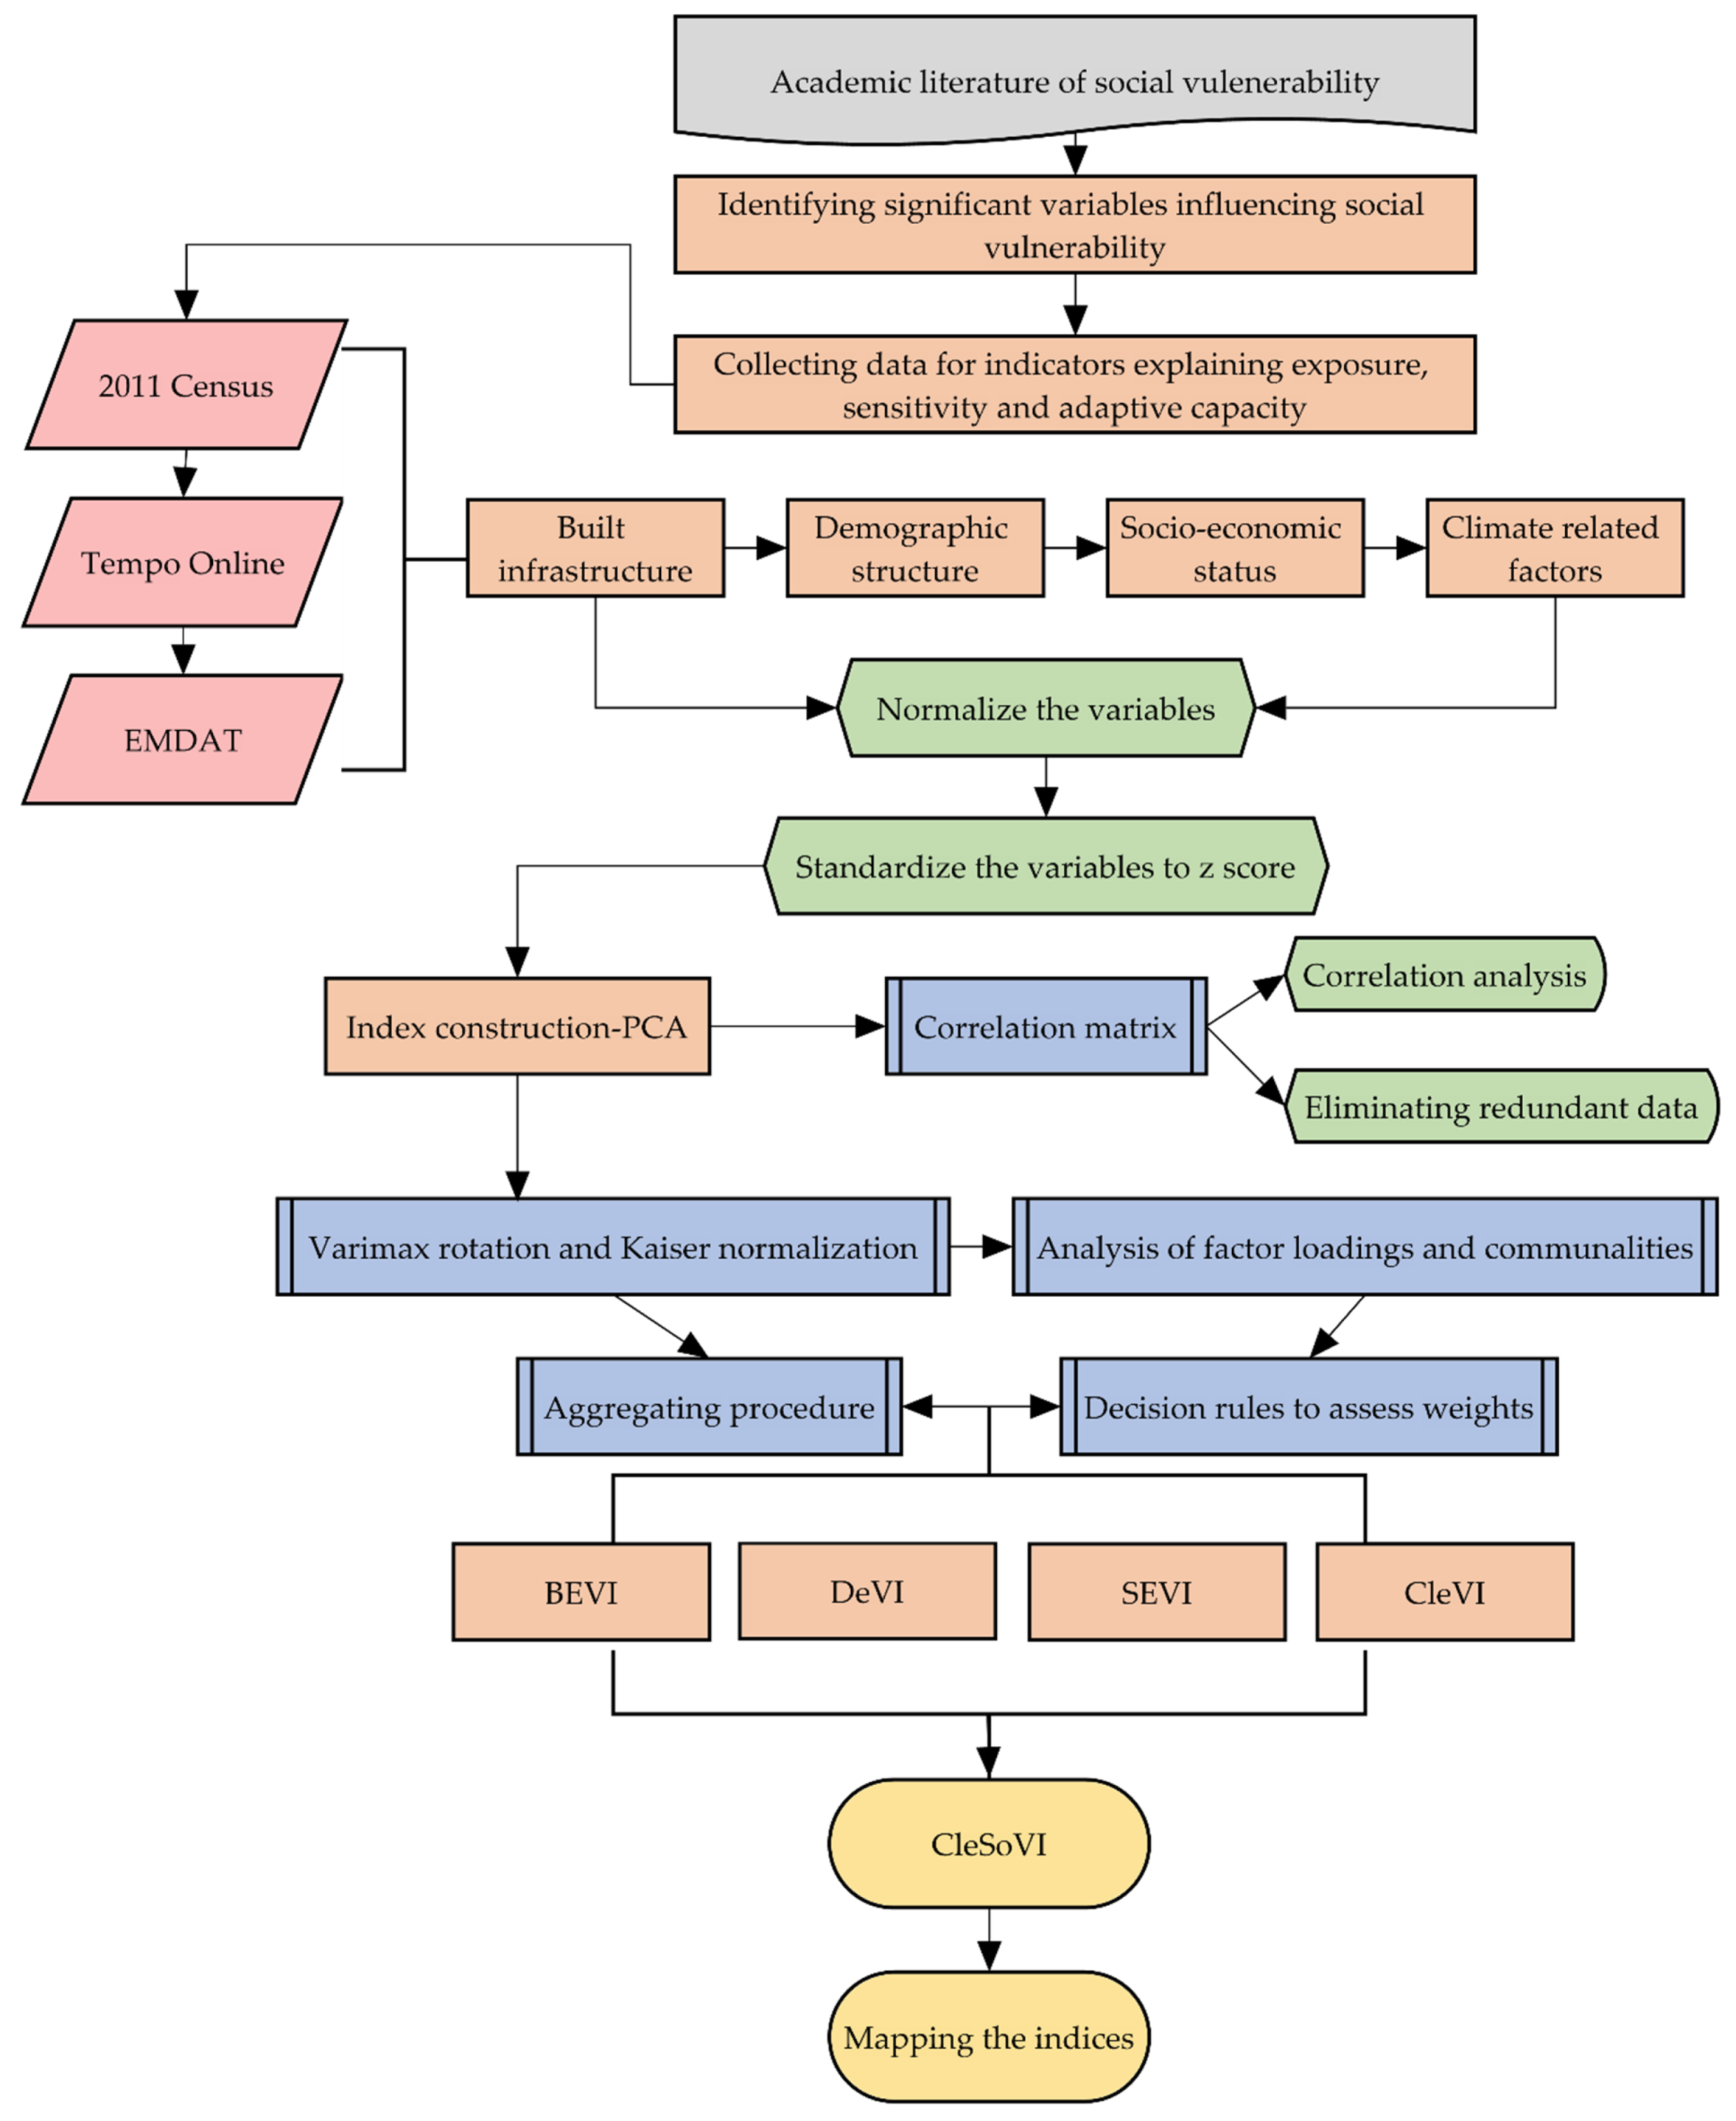
To assess the general vulnerability and calculate the Climate-related Social Vulnerability Index (CleSoVI), we followed the hazard-of-place model [5] by performing a dimension reduction method named a Principal Component Analysis (PCA). The PCA is a statistical process that helps reduce several independent variables into factors that still contain most of the information from the original data set. To ensure that all the variables are adequate for the analysis, we ran a collinearity diagnostic and two statistical tests: the Kaiser–Meyer–Olkin (KMO) and Bartlett’s test of sphericity. In all cases, the value of KMO was above 0.7, while Bartlett’s test was also significant. The communalities (proportion of each variable’s variance that the factors can explain) exceeded 0.500, further confirming the adequacy of the selected variables. The detailed CleSoVI construction procedure is presented as a flowchart in Figure 3.
3.1. Indices Calculation
For constructing the BEVI, we selected 13 variables (see Table 2). After performing the PCA analysis, we got four main components, which were named after the variables which make up these components. For example, we called the first component “Housing facilities”, as the share of households with access to piped water and sewage networks, those with a central heating system, with a kitchen area, and with a fixed bath have all shown exceptionally high values in this component.
All the data were derived from those collected during the 2011 Census (which is the most recent one conducted in Romania) as information regarding housing conditions, in general (such as year of building or housing facilities), and infrastructural development can be found in census databases only [42]. In constructing the index, first, we included all relevant variables strongly related to the built environment. Still, finally, after performing the correlation analysis, we kept only those indicating a statistically significant correlation (α ≤ 0.05).
To construct the Demographic Vulnerability Index (DeVI), we selected variables available at the local level for all county settlements (mainly for 2018). After running the correlation analysis, we retained only seven highly correlated indices, grouped in three main categories: family structure, demographic vitality, and gender and mobility.
To develop the Socio-Economic Vulnerability Index (SEVI), we employed nine variables considering education and occupation, health and accessibility, and general well-being.
As the most relevant and accelerated change in Romania was detected for extreme temperatures [44,48], to develop the Climate impact Vulnerability Index (CliVI), a set of 6 extreme temperature indices was chosen. They were selected from the core list established by the Expert Team for Climate Change Detection, Monitoring, and Indices (ETCCDMI) and by the Commission for Climatology Expert Team on Sector-Specific Climate Indices (ET-SCI) of the World Meteorological Organization. From a multitude of indices [56], we retained for this study only those indicating statistically significant changes at the scale of the entire county [56]. The method used for trend detection was the least-square method, and the statistical significance was established at a level of 0.05. The indices datasets for the 53-year. period (1961–2013) was obtained using the R version of the ClimPACT2 application [56].
3.2. General Vulnerability Assessment
Unlike in the original SoVI model [5], in this study, we applied a weighting method developed by Török [33] based on the percentage variance of each principal component to ensure that components with a higher variance have a stronger influence on the overall vulnerability (Equation (1). In the model, we further integrated the climate-related variables to capture both the physical and social components of vulnerability, which enabled us to have a broader insight into the vulnerability of people and places.
In the first step, the PCA was run for the built environment indicators resulting in the BEVI, then for the demographic dimension leading to the DeVI, for the socio-economic indices (SEVI), and the climate impact factors by proposing the CliVI (Equation (2)).
where, n—the number of territorial units; Fi—the resulting number of factors; vi—the number of variables included in each factor; wi—the assigned weight for each factor.
In the second step, the (CleSoVI) for all Cluj County settlements was calculated using Equation (3). All the values used in this equation are found in Table 2.
Using a weighting methodology according to the variance explained by each factor, the composite CleSoVI scores were divided into five categories presenting the level of vulnerability. The calculation was based on the standard deviation from the mean, where negative values revealed a low social vulnerability while positive values indicated a high degree of vulnerability.
For this research, we performed geospatial and geostatistical analyses by employing ArcGIS v10.7.1. We applied the Inverse Distance Weighted (IDW) interpolation method to a regular grid-shaped point dataset to create maps of extreme temperature indices for Cluj County. IDW method is a deterministic spatial interpolation approach. The essence of this method is that the attribute values of any given pair of points are related to each other, but their similarity is inversely related to the distance between the two locations [57]. The IDW technique computes an average value for each unsampled location using values from nearby weighted locations.
For this paper, the input data were projected in Stereo 1970 (Romania’s National Projection System).
3.3. Spatial Patterns of Social Vulnerability
The social vulnerability has spatial implications, accompanied by the similarity or randomness of the territorial distribution. To determine patterns of similarity in the clustering of social vulnerability, we used the Exploratory Spatial Analysis (ESDA) techniques. First, we examined spatial dependence with the Global Moran’s I statistic, indicating the average pattern of social vulnerability of the analyzed settlements (Equation (4)).
where,
- -
- I is the global Moran’s I statistics;
- -
- xi represents the observed value of the analyzed variable at location i;
- -
- xj is the observed value of the studied variable in unit j;
- -
- is the arithmetic average of the xi over the n locations;
- -
- wij is the spatial weight measure of contiguity and is defined as 1 if location i is contiguous to location j and 0 otherwise [58].
For the contiguity matrix, we used the first-order queen contiguity weights to express neighborhood relations. Further on, to describe local tendencies, correlations, and spatial patterns, the Local Moran’s I statistic was applied, making it possible to quantify the degree of spatial autocorrelation in every location and identify spatial outliers [59] (Equation (5)).
Local Moran’s I is suitable for identifying settlements that are similar to/different from their neighbors. The higher the value of the Local Moran’s I, the more relevant the spatial similarity. In the case of a negative value, however, we can say that we have identified spatial outliers, including high-low and low-high clusters (high values surrounded by low values and vice versa).
4. Results
4.1. Measuring Climate-Related Social Vulnerability Components
According to PCA, from the initially selected 35 variables, we got 12 latent factors grouped into four categories, which explained above 80% of the variance. The description of the twelve components with component loadings and their effect on social vulnerability is presented in Table 2.
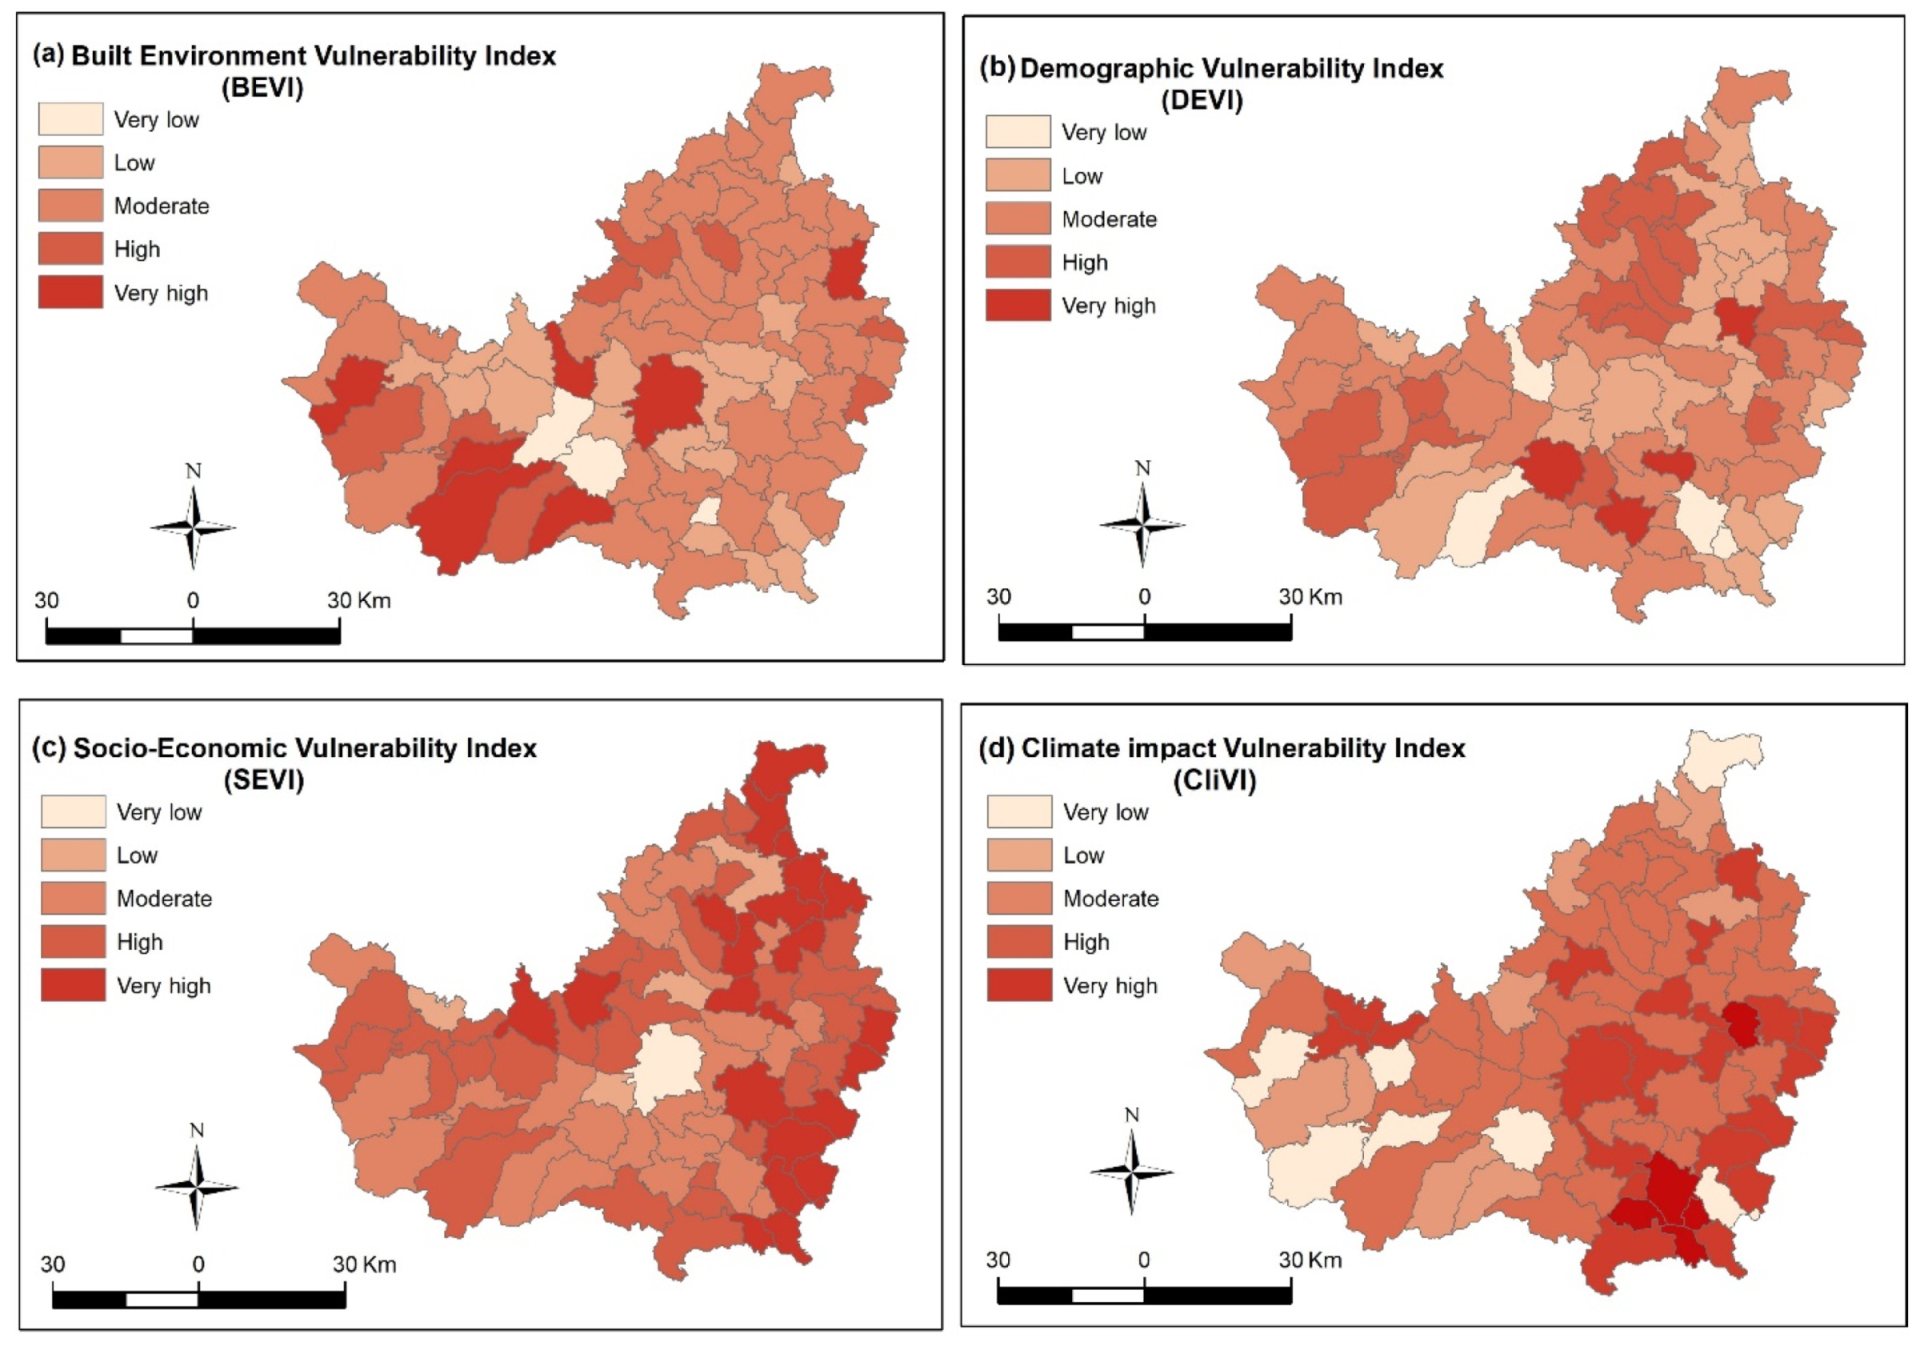
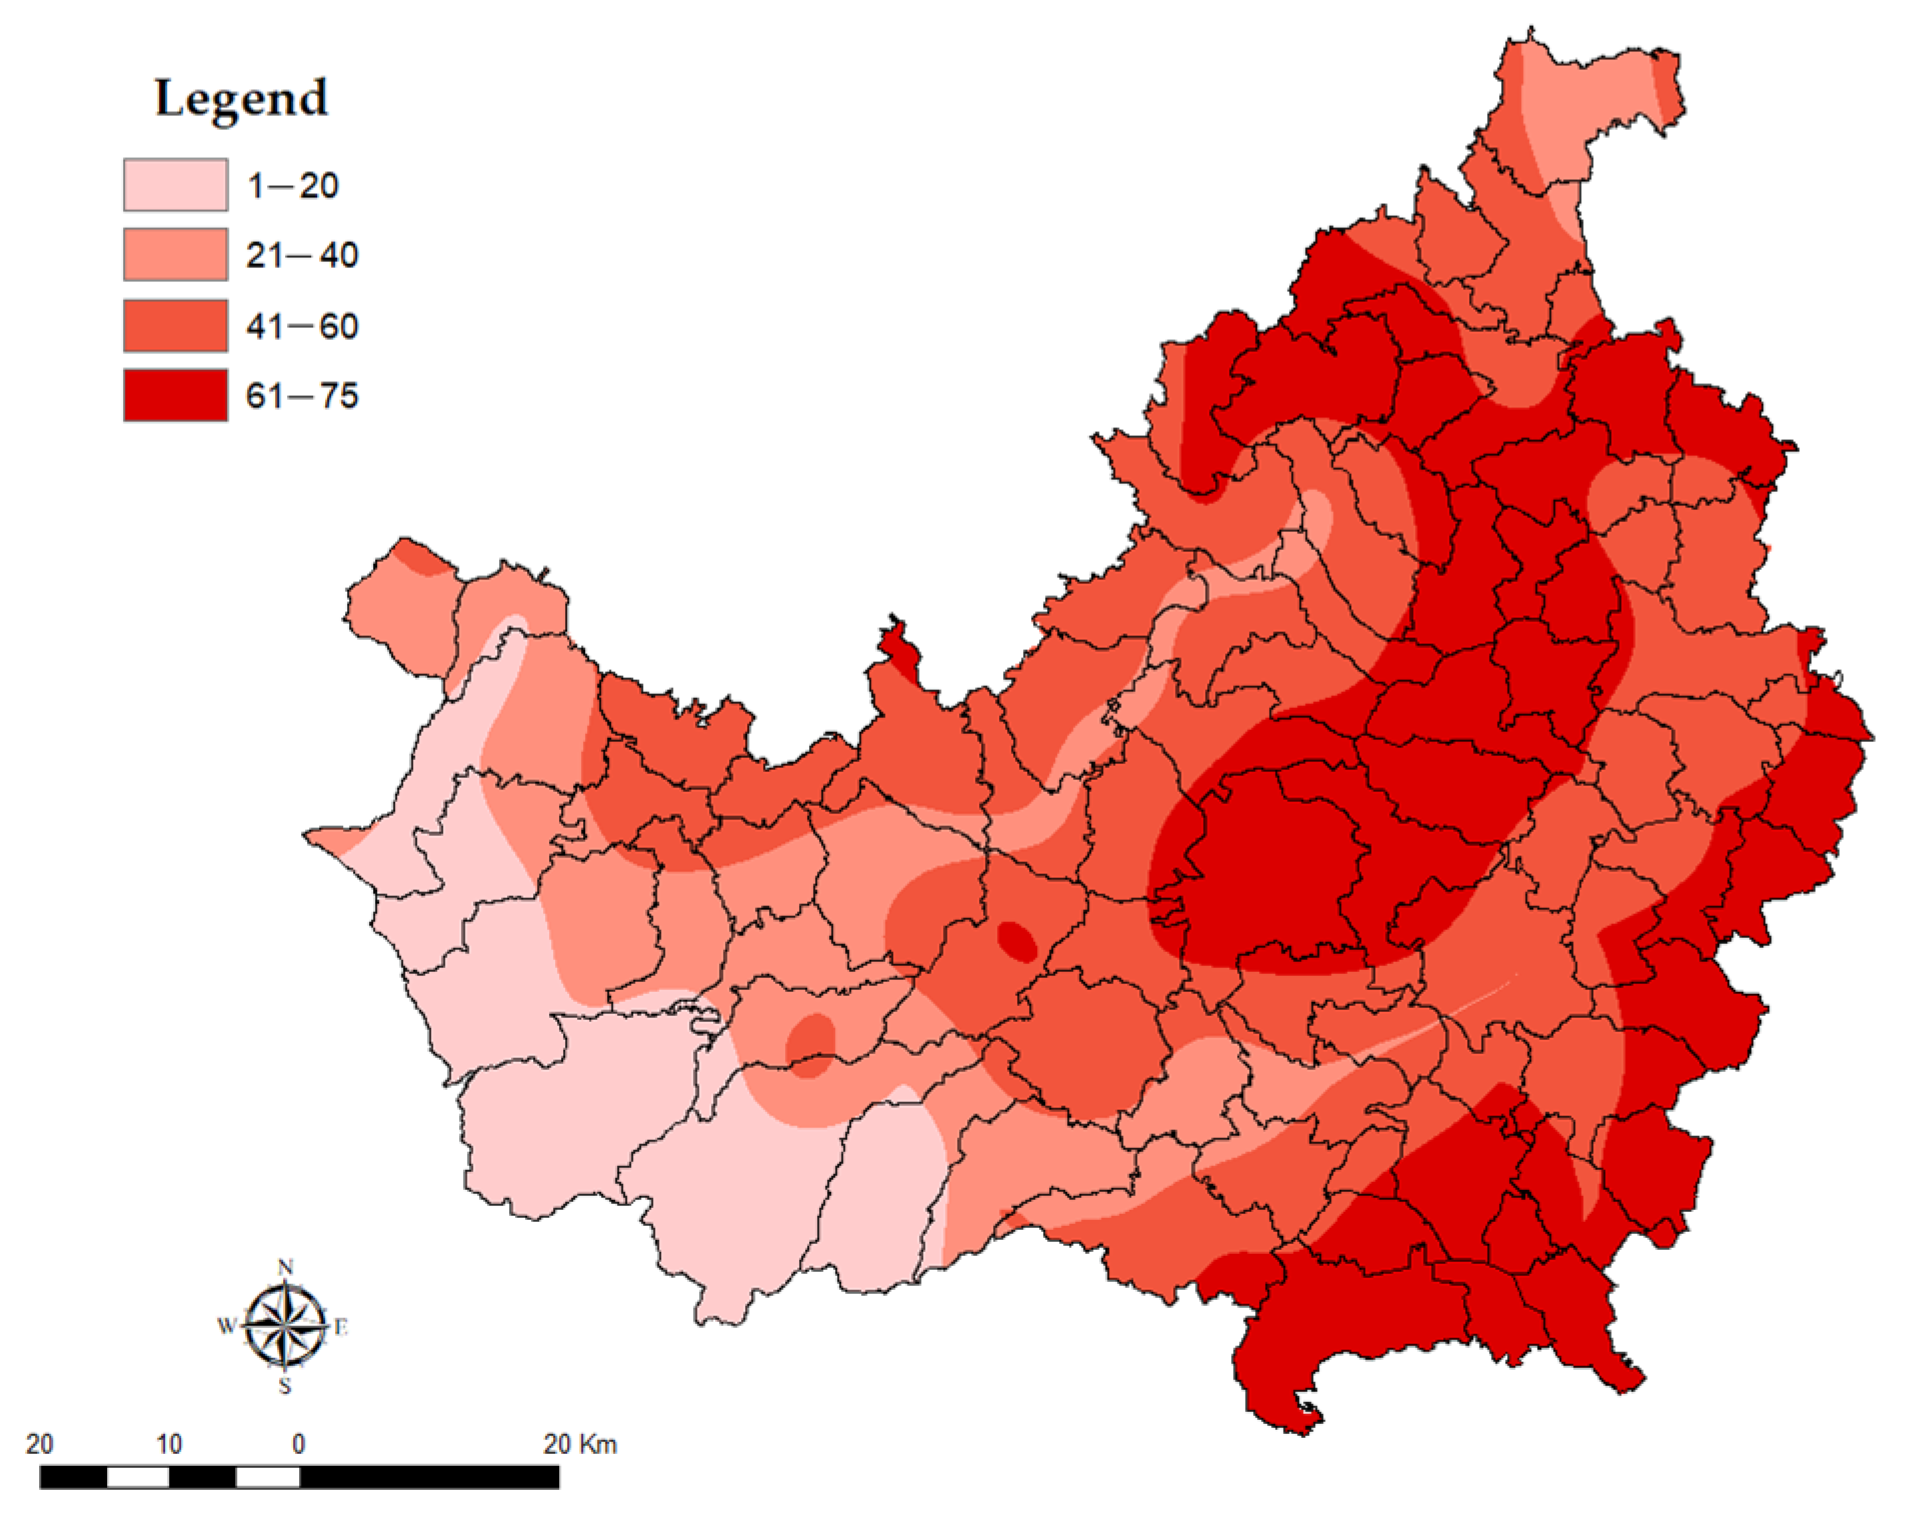
The first index, BEVI, has four main components, and the total variance explained was 83.953%. This dimension significantly impacts the settlements’ accessibility to different services, incorporating elements describing the overall quality of living and housing quality. On the one hand, limited access to essential services like access to piped water and sewage network, the share of wooden houses make people more vulnerable, especially those from rural areas and highly isolated mountainous regions (southwestern and northeastern parts of the county). It is a specific characteristic of the focus area since most rural households have their wells, most affected by drought. It must be mentioned that the eastern part of the analyzed county has a geological structure mainly characterized by salty soil with much clay, which does not favor the good quality of drinking water or agricultural farming. On the other hand, high population and housing density contributed to anthropogenic excess heat in the urban areas. The modified urban climate can further impact people’s health by producing heat islands (Figure 4a).
According to the PCA, the most vulnerable communities have a high rate of elderly and widows/widowers, followed by those with a demographic dependency ratio above the county average. All variables mentioned above are positively loading on DEVI. Communities with a high rate of elderly are especially vulnerable not only that they are physically frail and thus much more exposed to risk, but they might be much less able to help themselves when faced with extreme weather conditions. Recent analyses across 18 comparable studies revealed that old age is one of the most important internal factors for heat-related mortality [60]. In the analyzed area, where the share of older adults is constantly growing at the expense of the young population, the phenomenon raised even more issues related to vulnerability. The county’s southwestern and partially northwestern areas are characterized by a relatively unbalanced age structure due to the high demographic dependency ratio (Figure 4b).
Some of the most vulnerable population groups are strongly related to socio-economic factors, including education and occupation, health and accessibility, and general well-being (SEVI). Individuals with a low level of education have access to fewer employment options, and they usually have a low standard of living. Consequently, they have limited access to warning information and a reduced ability to understand the true impact of disasters [7,61]. In general, different occupations require different education levels and skills, leading to different income levels. The unqualified workforce and people working in primary activities are the most vulnerable because of their dependency on natural resources [36]. These categories are also highly vulnerable to natural disasters due to the lack of adequate income levels and material resources, which considerably decrease their ability to recover afterward. Except for the central part of the analyzed area, which is the most developed one, the rest of the county is characterized by a strong peripheralization due to their dependence on agriculture, low income, and low education (Figure 4c).
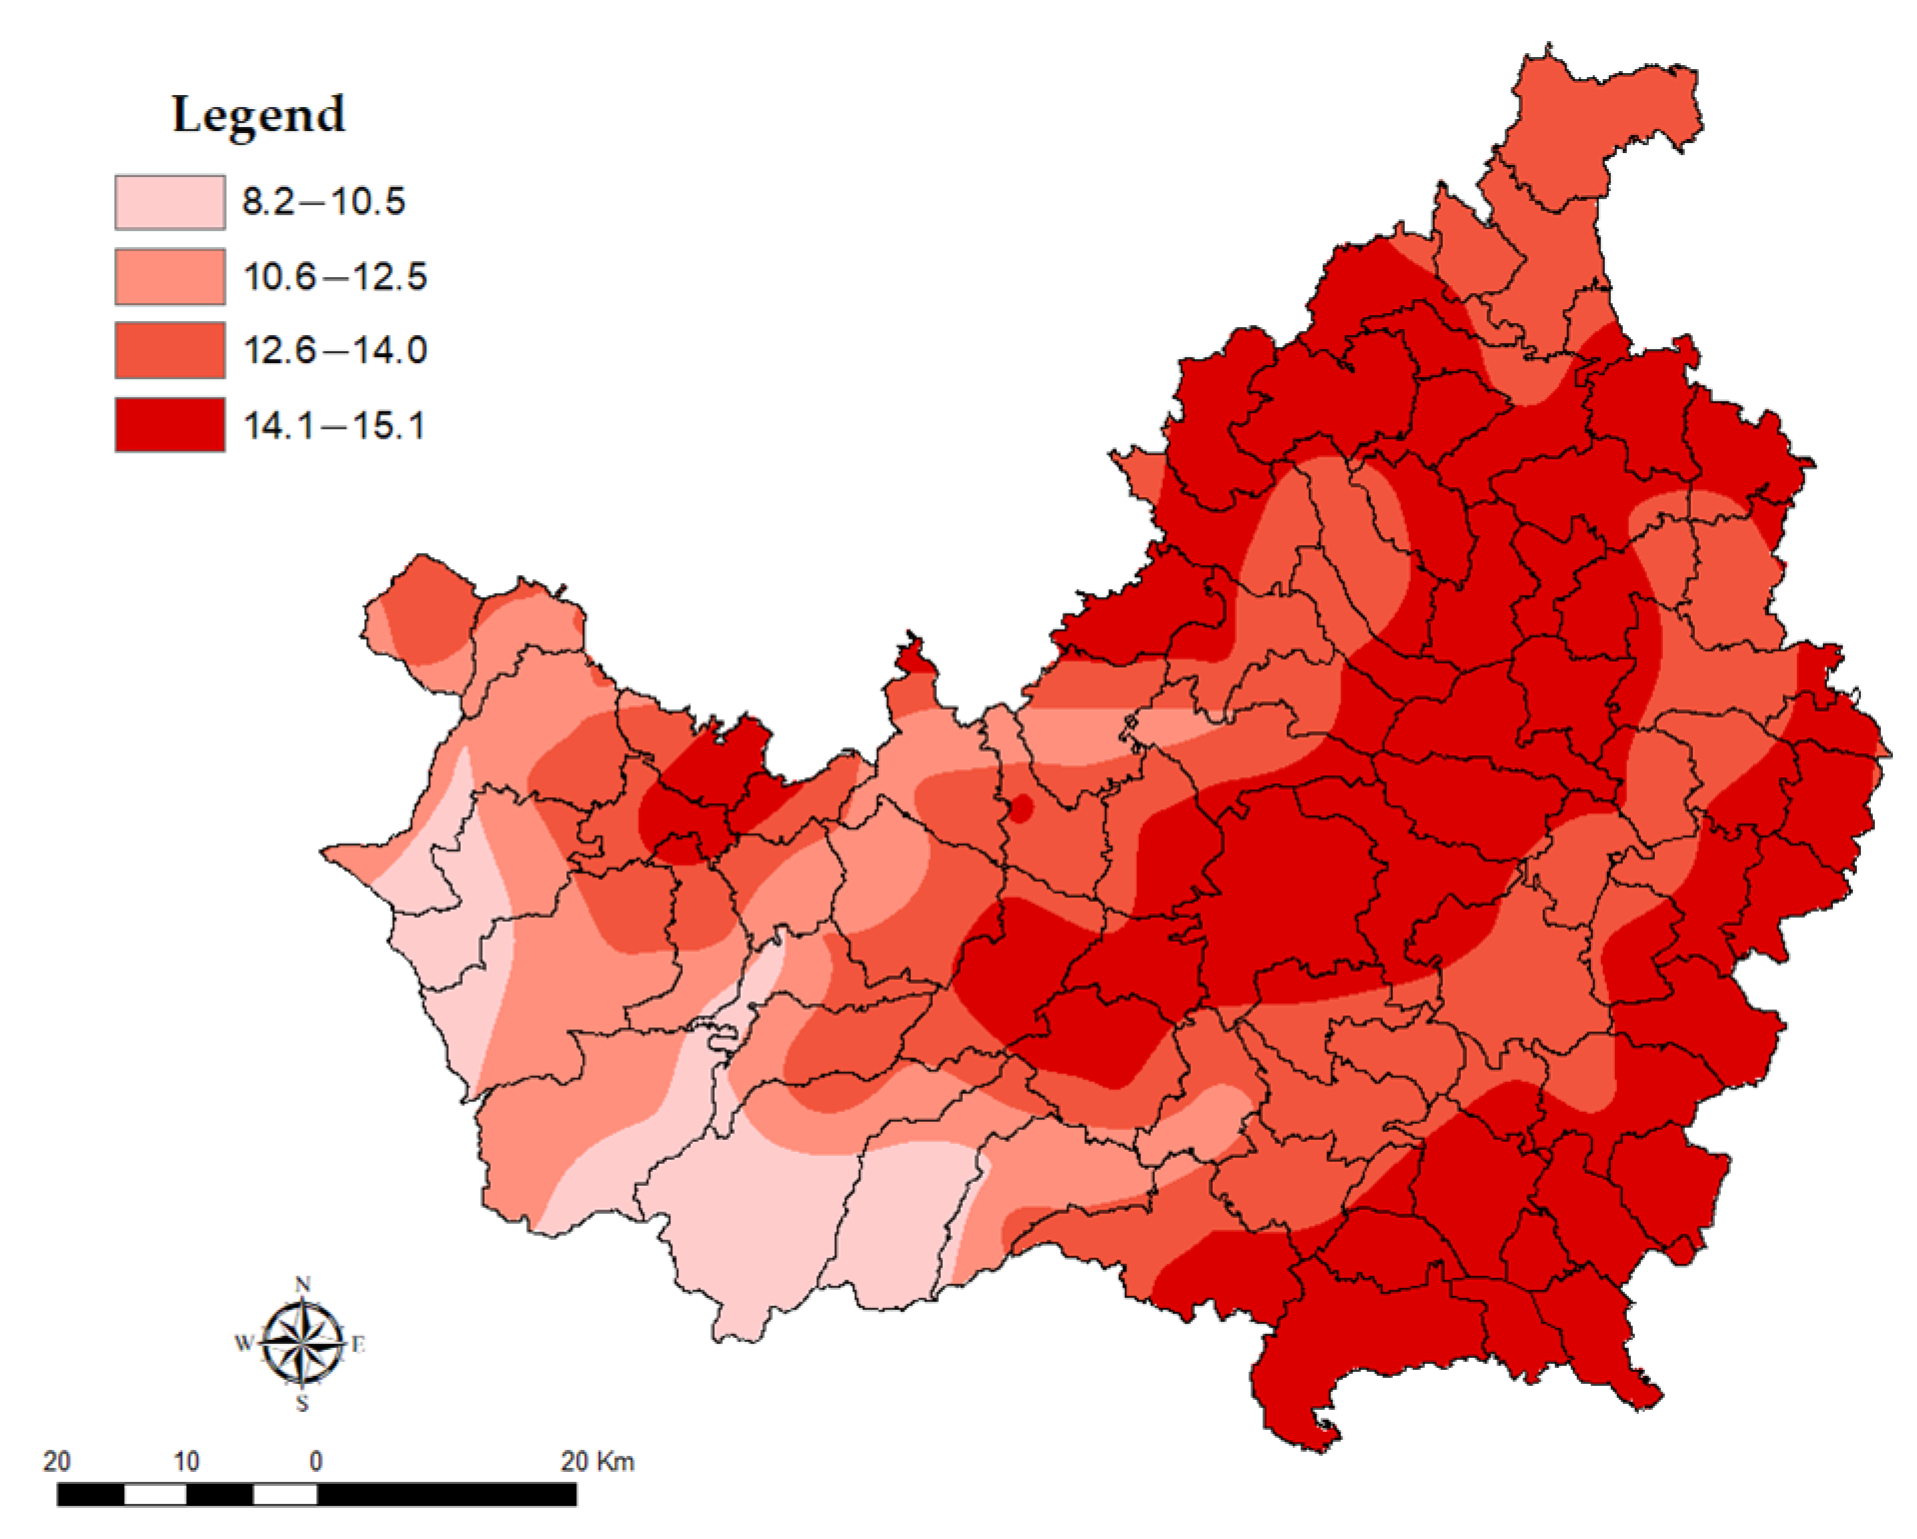
The CliVI encompasses six variables with a high explanation power (cumulative variance explained was 77.6%). The western part is dominated partly by mountains and high hills. Lower temperatures and the intensity (magnitude) of coldwaves had an important negative impact on people’s vulnerability, aggravated by the low accessibility (Figure 4d).
4.2. Assessing Highly Vulnerable Areas
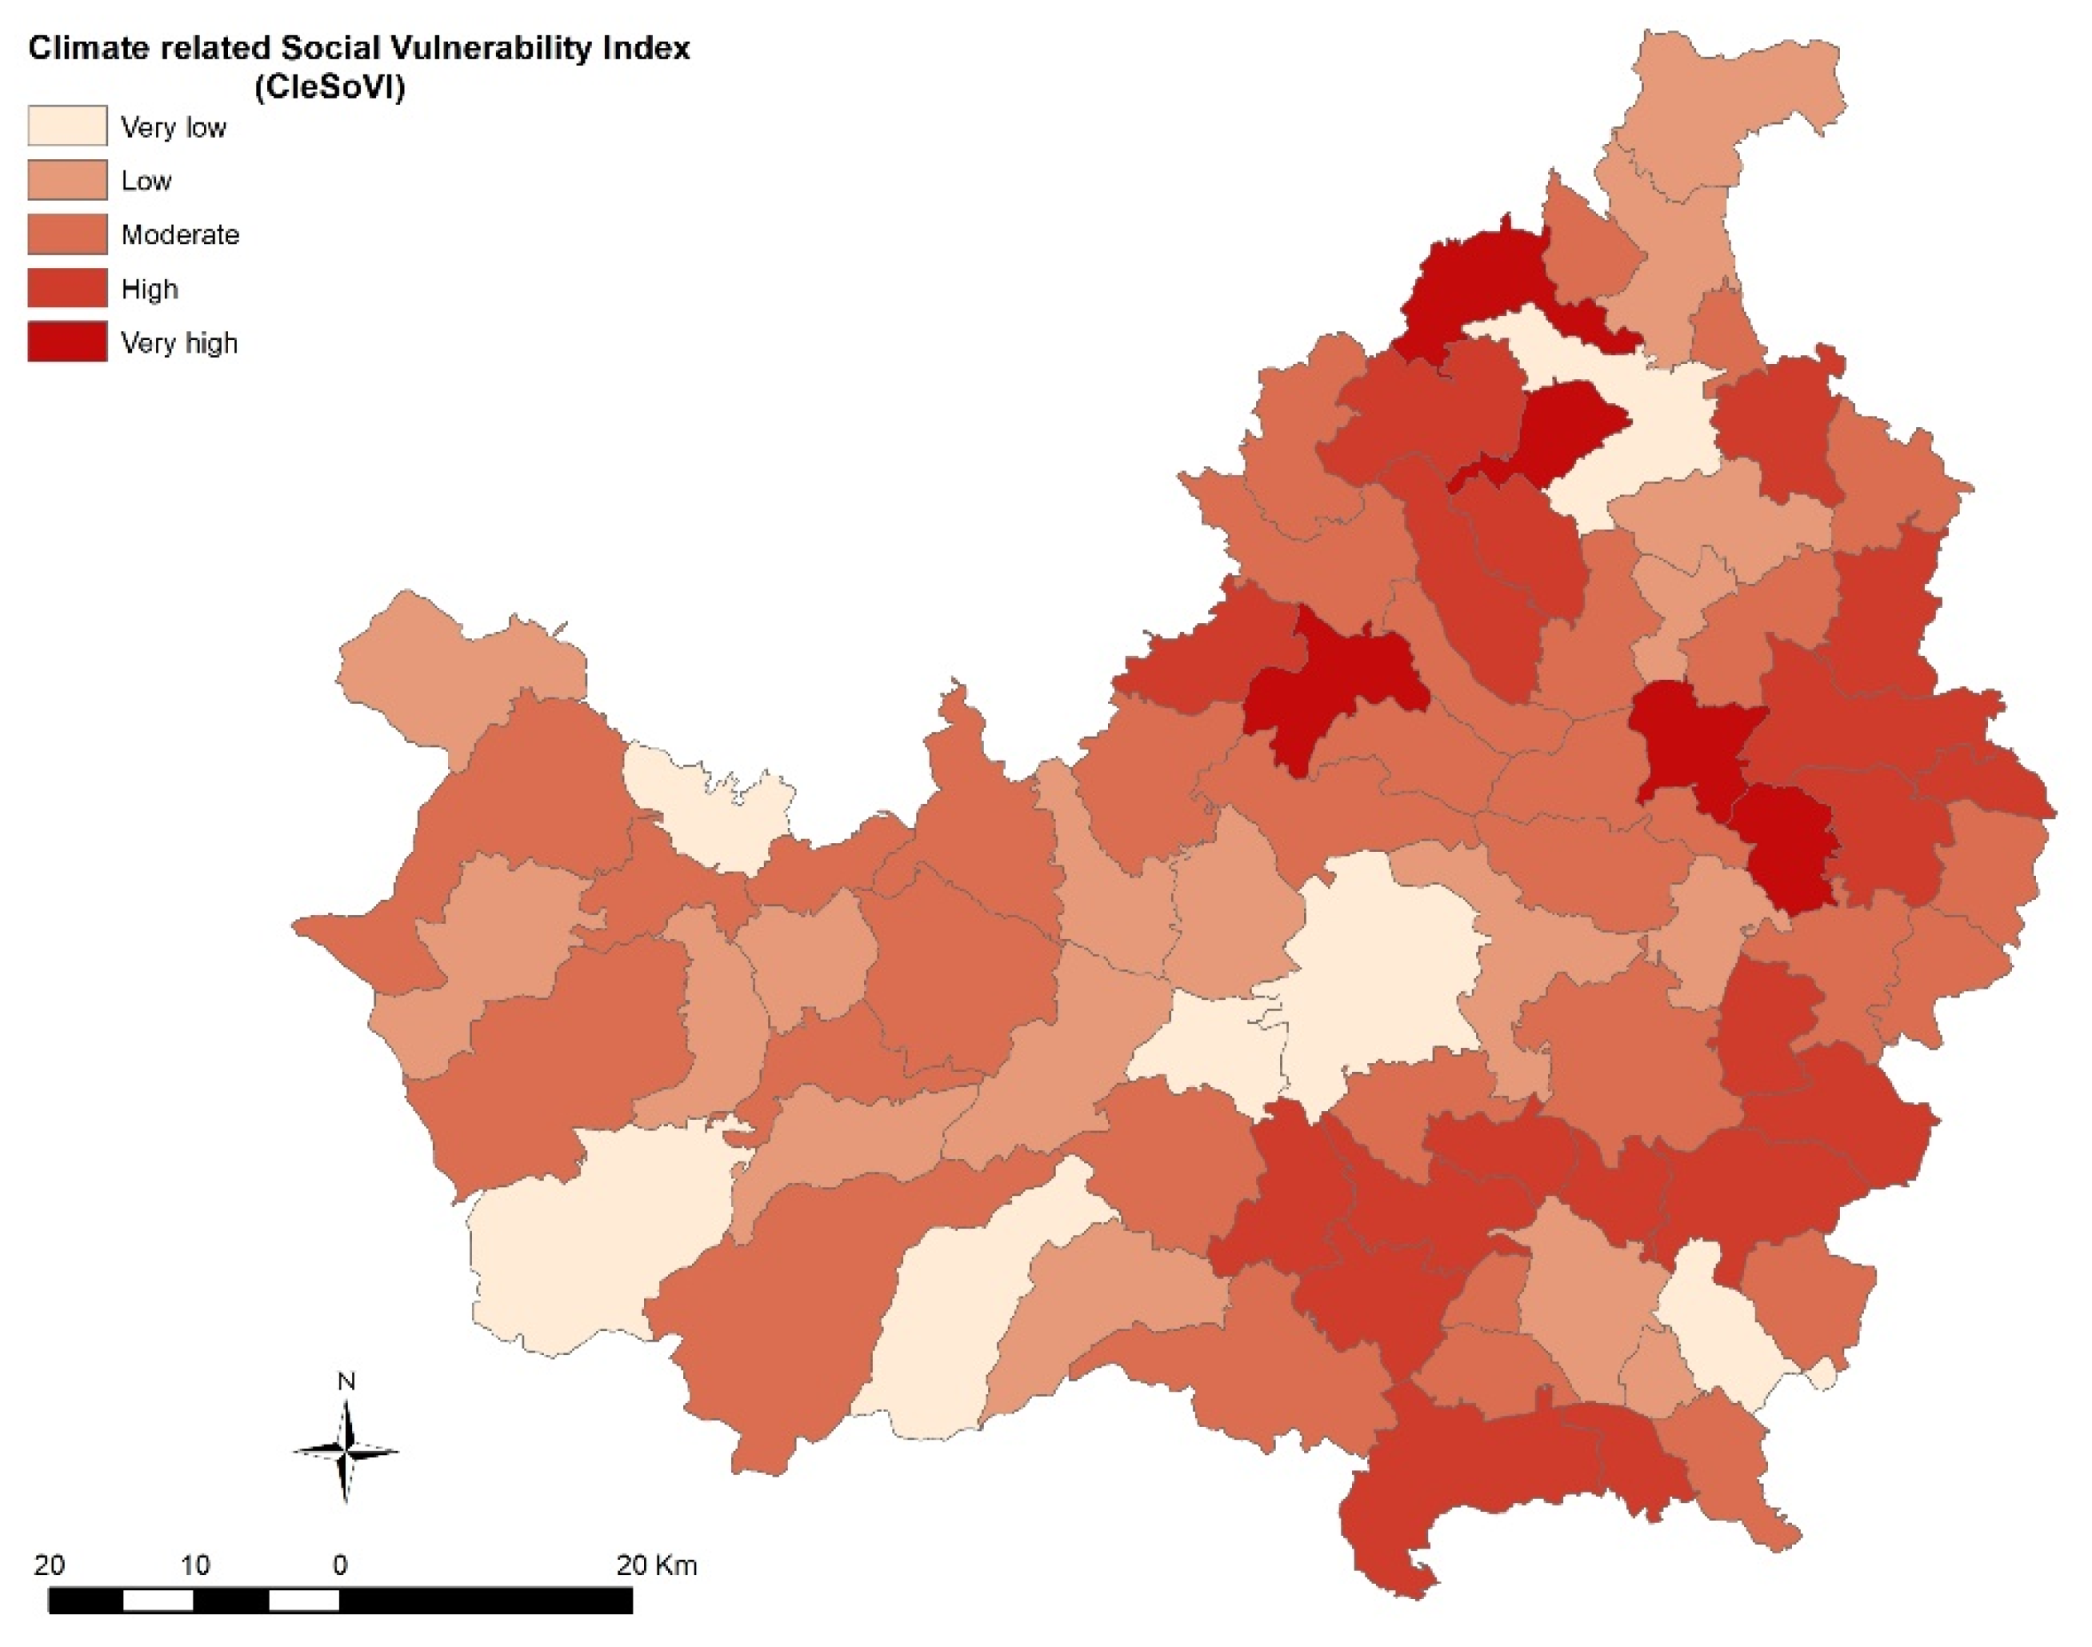
The resulting CleSoVI factors show that 19.8% of the settlements fell into low and very low vulnerability classes (−1.5 to −0.5 Std Dev), whereas 32.1% of settlements are characterized by high and very high social vulnerability (0.5–1.5 Std Dev) (Figure 5).
According to the obtained factor scores, we identified the northern and south-eastern parts of the county as the most vulnerable areas. The settlements are outmost exposed to extreme temperature events, and they are fragile from demographic and partially socio-economic points of view. Within those settlements, social vulnerability is mainly influenced by high emigration, demographic aging, low level of education, and the economic structure, subsistence farming being the most important occupation of the population living here. While agriculture is highly exposed to environmental factors, the relatively low wages represent the cradle of rural poverty. The average and extreme temperature-related conditions can impact the vulnerability of the population. Among them, persistent heatwaves seem to have the most severe consequences. By contrast, the lowest vulnerability can be found in urban areas and suburban localities (mainly near big cities). Even though the population and housing density are higher than in other settlements, there is an increased adaptive capacity in urban areas due to the overall socio-economic conditions and demographic characteristics.
4.3. Identifying Spatial Patterns of Climate-Related Social Vulnerability Index
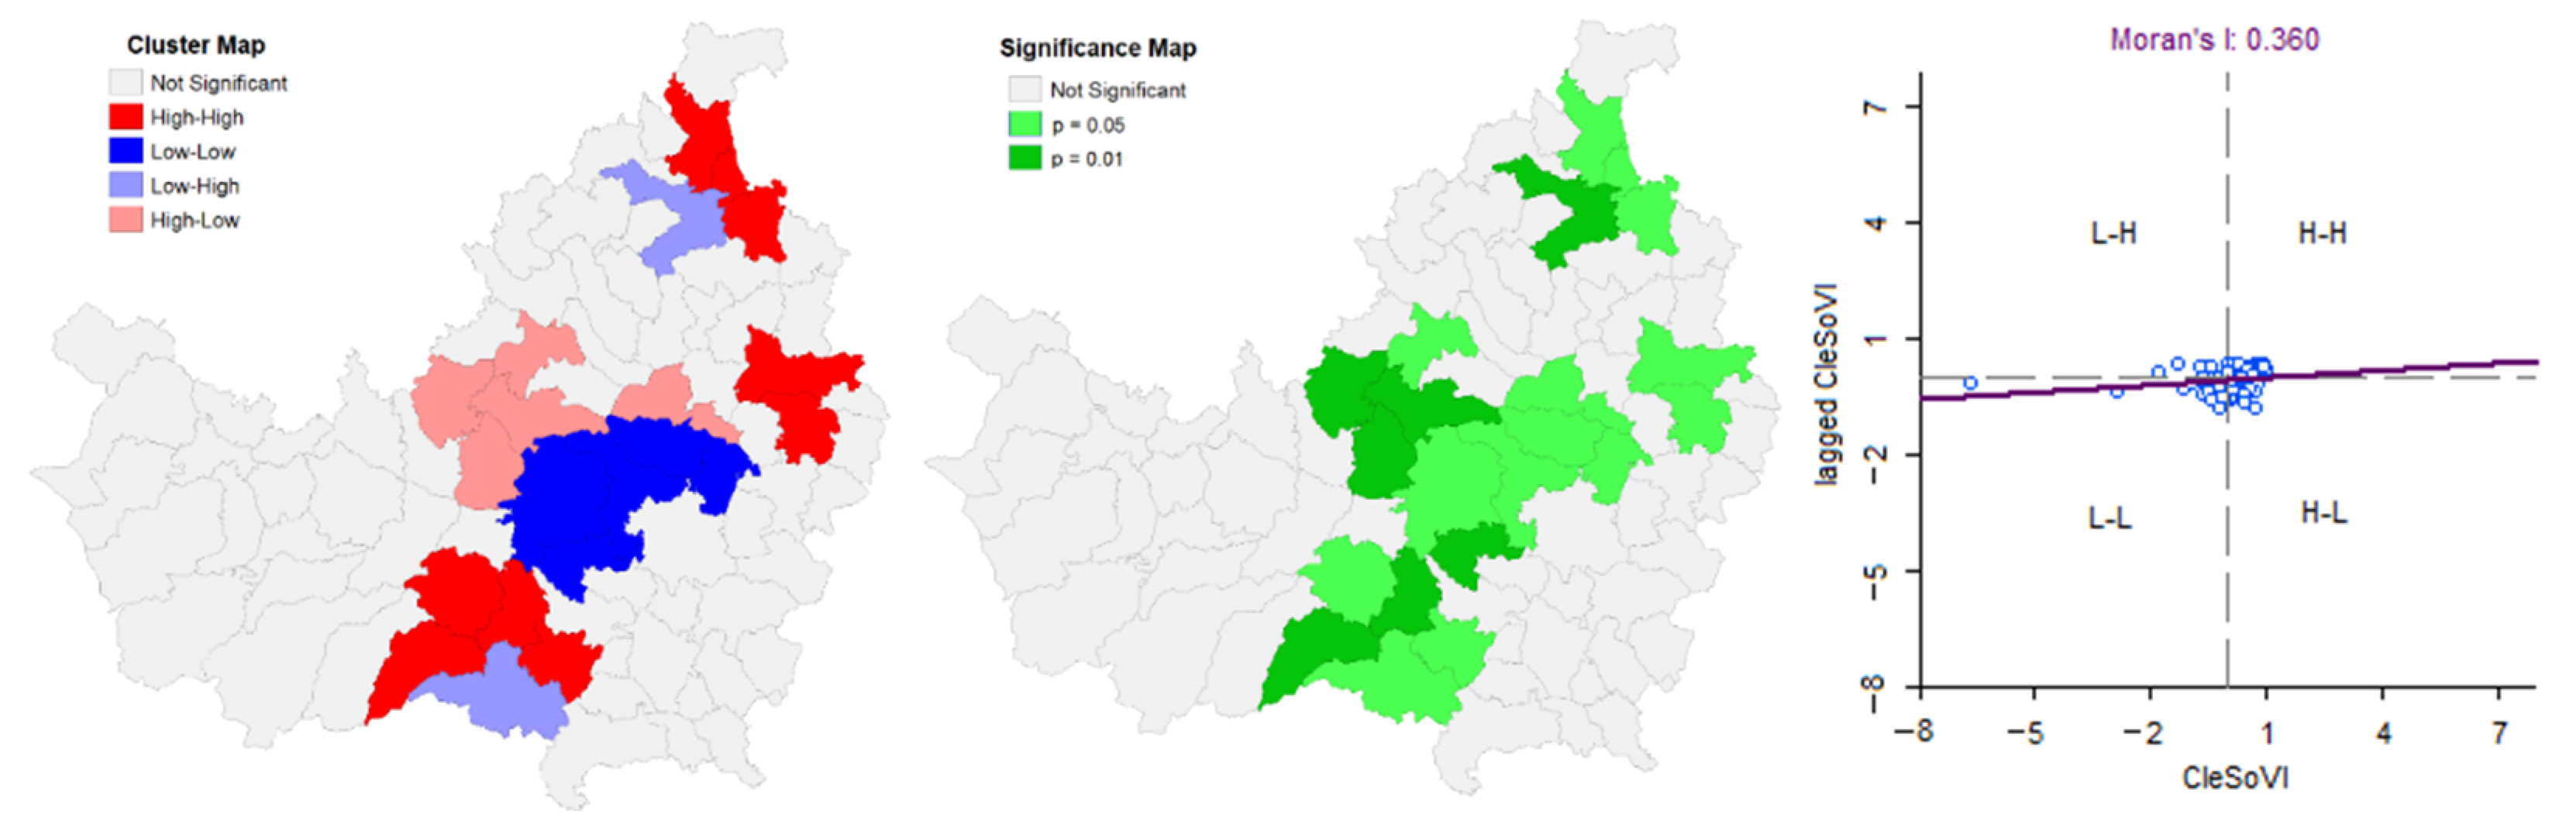
One of the fundamental questions of spatial analyses is whether any regularity can be detected in the spatial distribution of the studied phenomenon or the spatial distribution of the data is random. To detect spatial clustering in the CleSoVI index, we used the ESDA techniques, focusing both on the Global and the Local Moran’s I statistics. The latter allowed us to identify clusters of spatial outliers, i.e., statistical hotspots and coldspots, further employed to delimit areas characterized by the highest and lowest levels of vulnerability. The high value of Moran’s I (r = 0.360) suggested a positive spatial autocorrelation at a significance level of 0.05 > p > 0.01, reflecting a strong clustering process.
Thus, we identified four main groups:
- Communes with the lowest level of vulnerability (L-L cluster) located near the most extensive urban centers (Cluj-Napoca);
- Settlements with a relatively high level of vulnerability as compared to the central regions (H-L cluster), located immediately near the previous ones;
- Settlements with the highest level of social vulnerability (H-H cluster), located in the northern, eastern, and southern parts of the county, where extreme temperatures regularly negatively affect agricultural yields, thus influencing the overall socio-economic development;
- The fourth cluster (L-H) includes some rural and small-size urban settlements, indicating a lower level of social vulnerability than the surrounding areas (Figure 6).
5. Discussion
Hedlund et al. [62], using the Notre Dame Global Adaptation Index (ND-GAIN, 2012), highlighted that even though climate risks show a strong correlation with economic development and geographical position, there is a need to support a strong adaptation planning. It can be developed mainly in the framework of international cooperation to reduce them in global systems. Over the last years, due to the pressure of global warming, adaptation to climate change represented an essential step on the Romanian political agenda. The National Strategy for Climate Change in Romania was approved in 2013, focusing on the reduction of vulnerability in specific sectors like agriculture, energy, water resources, transport, industry, construction, urban planning, insurance, biodiversity, human health, tourism, forestry, infrastructure and recreational activities [63]. According to the experts’ long-term estimates (2041–2070 and 2071–2100), the temperature continues to increase alongside the reduction of average precipitation during the warm season [63]. Under these circumstances, it is essential to consider the effect of long-term climate change on people’s vulnerability, exposure, and adaptive capacity.
One of the main consequences of climate change is visible in the agriculture sector. The weak adaptation capacity of the analyzed society is linked to the aforementioned demographic problems (high demographic aging and the decline of the rural population), economic problems (low competitiveness of small farms, increased fragmentation of agricultural areas), as well as social problems (massive youth migration from rural areas, intense peripheralization process). However, the changes in agro-climatic conditions (GDDgrow index) revealed a consistent improvement of thermal conditions for crop growing. It is essential, especially for the eastern part of the analyzed region, where the main livelihood opportunity is related to agriculture. The population should be aware that recent and more productive hybrids or varieties of different crops could be successfully cultivated under new climate conditions [64]. Under these circumstances, a proactive policy could facilitate the sustainable transition to a more diverse agro-ecosystem, avoiding the path dependency associated with a monoculture production approach [65]. As the ESDA technique has already revealed, it is of utmost importance that the most vulnerable areas are those where agriculture represents the primary source of income.
The second issue is strongly related to water resources due to climate change, and the frequency of extreme weather phenomena: warmer and shorter winters led to snowcaps’ decrease and the early melting of snow [63]. This situation mainly affects the southern and southwestern parts of the county where well-known ski resorts are located and where winter tourism accounts for a significant share of income. In addition, decreasing water resources in both quantity and quality [66] combines with the increase of water demand generated by extremely high temperatures associated with dry periods during summer. The settlements are prone to a particular anthropogenic and natural vulnerability because the geological structure in the eastern part of the county significantly impacts the quality of water resources. As a result, landslides and sheet flows characterize the landscape. Under these circumstances, the sensitivity of local communities to any climatic hazards has risen, while adaptation strategies have failed to keep pace.
A pressing problem, which most urban areas face, is the effect of persistent heatwaves under climate change conditions. Their impacts are more intense in densely populated urban areas due to their added heat stress overlapping with the urban heat islands [67]. Analyzing how individuals or households respond to the local impact of global climate change is an essential issue for policymakers to elaborate strategies for exposure reduction and adaptation capacity improvement. Therefore, vulnerability assessment is an important part of adaptation planning. The CleSoVI index developed in the current paper could represent the first step, offering the possibility to be tested and applied in other regions. At a national level, an integrated Local Social Vulnerability Index was developed and successfully used to measure the population’s vulnerability to flooding hazards in Romania [32]. We consider that it is necessary to carry out similar analyses for smaller territorial units, considering different factors of natural disasters. It would be essential to identify the socio-economic and demographic characteristics, which increase the capacity of the population to resist, cope with, and recover from disasters [68,69]. By pinpointing the areas with the greatest need for vulnerability reduction, the developed index could help policymakers prioritize development measures.
The importance of community-based adaptation to climate-related vulnerability, capacity building, and choices about different information channels seem to be crucial [70]. At present, there are only three cities in Romania that have already elaborated a local strategy for climate change adaptation. Not surprisingly, no rural settlement in Romania has such a strategy. The present analysis serves as a helpful tool for local and regional authorities to recognize the natural and socio-economic dysfunctions that make these communities more vulnerable and elaborate local development strategies to increase the coping capacities of the population living in those areas. The European Green Deal is a roadmap for making the EU’s economy and society sustainable and more resilient to climate change by turning climate and environmental challenges into opportunities. It is planned to cover all policy areas and make the transition just and inclusive for all local communities and authorities to benefit from adaptation support [71].
The impact of internationally financed climate change adaptation projects on local communities indicated that a better approach for strengthening the limited capacity of a community is to promote bottom-up adaptation projects [72]. However, the problems resulting from the lack of cooperation between local authorities and communities are still present, making it difficult to share responsibilities for mitigating actions, which could help overcome the negative impact of climate change. CleSoVI can help local policymakers, civil societies, and communities to further examine the roots of risk and vulnerability to make the right decision for mitigation measures, preparedness, and response planning as well as recovery [32].
6. Conclusions
The present paper aims to develop an in-depth analysis based on socio-economic variables to understand what makes a community more vulnerable compared to another. To better assess the social vulnerability of the analyzed region, the results of this research were obtained by combining physical, social, and demographic aspects. This study represents a first attempt to understand the spatial relationship between social vulnerability and climate change, offering the possibility to be tested in other regions. As the analysis revealed, the most vulnerable communities are those in the northern and south-eastern peripheral rural areas, further affected by climate-induced negative impacts. Usually, multiple social and economic disadvantages characterize those settlements and make it difficult to cope with the effects of any natural hazards. Among the most appropriate and effective long-term solutions are those implemented in formal education to increase awareness and instruct children to develop adaptive behavior for extreme events associated with climate change. For the elderly, understanding that monitoring their health status to increase preparedness is of utmost importance since they are the most exposed to climate-induced heat stress [32]. The present analysis represents an important step towards developing more adequate response strategies and helping local decision-makers plan better to adapt and cope with the impact of climate change, taking advantage of the opportunities and support attributed to the European Green Deal [71].
The study presents some limitations. Even though the analysis can offer a holistic approach by combining various social, economic, demographic, and climate-related indicators, some are not up to date since they are derived only from the data collected in the 2011 Census. It makes it difficult to give a clear and timely picture of the analyzed territories. The second limitation is strongly related to the static character of the analysis. Comparing different periods could further help identify the changes in vulnerability as well as the ability of the people to cope with- and adapt to disasters. The third limitation is the small territorial unit of analysis. As we have already mentioned, several of the datasets are not complete for the whole country or are not freely available for the wider public. However, the territorial complexity of the focus region from a natural landscape perspective and a socio-economic one qualifies it as a test area.
Overall, our paper has extensive applicability: the method proposed can be employed to assess vulnerability to any local community, with some adjustments to capture the local/regional specificity of the considered focus area.
Author Contributions
Conceptualization, I.T. and A.-E.C.; methodology, I.T. and A.-E.C.; software, I.T. and T.-C.M.; validation, I.T. and A.-E.C.; writing—original draft preparation, I.T., A.-E.C., and T.-C.M.; writing—review and editing, I.T. and A.-E.C. All authors have read and agreed to the published version of the manuscript.
Funding
The publication of this article was supported by the 2020 Development Fund of Babeș-Bolyai University.
Institutional Review Board Statement
Not applicable.
Informed Consent Statement
Not applicable.
Data Availability Statement
Row climatic data for extreme temperature calculation are freely available as presented in ROCADA: a gridded daily climatic dataset over Romania (1961–2013) for nine meteorological variables [46]. Raw social and economic data are available on https://insse.ro/cms/ro/content/sdds-plus-0 (accessed on 1 April 2021) and http://www.recensamantromania.ro/ (accessed on 25 March 2021).
Conflicts of Interest
The authors declare no conflict of interest.
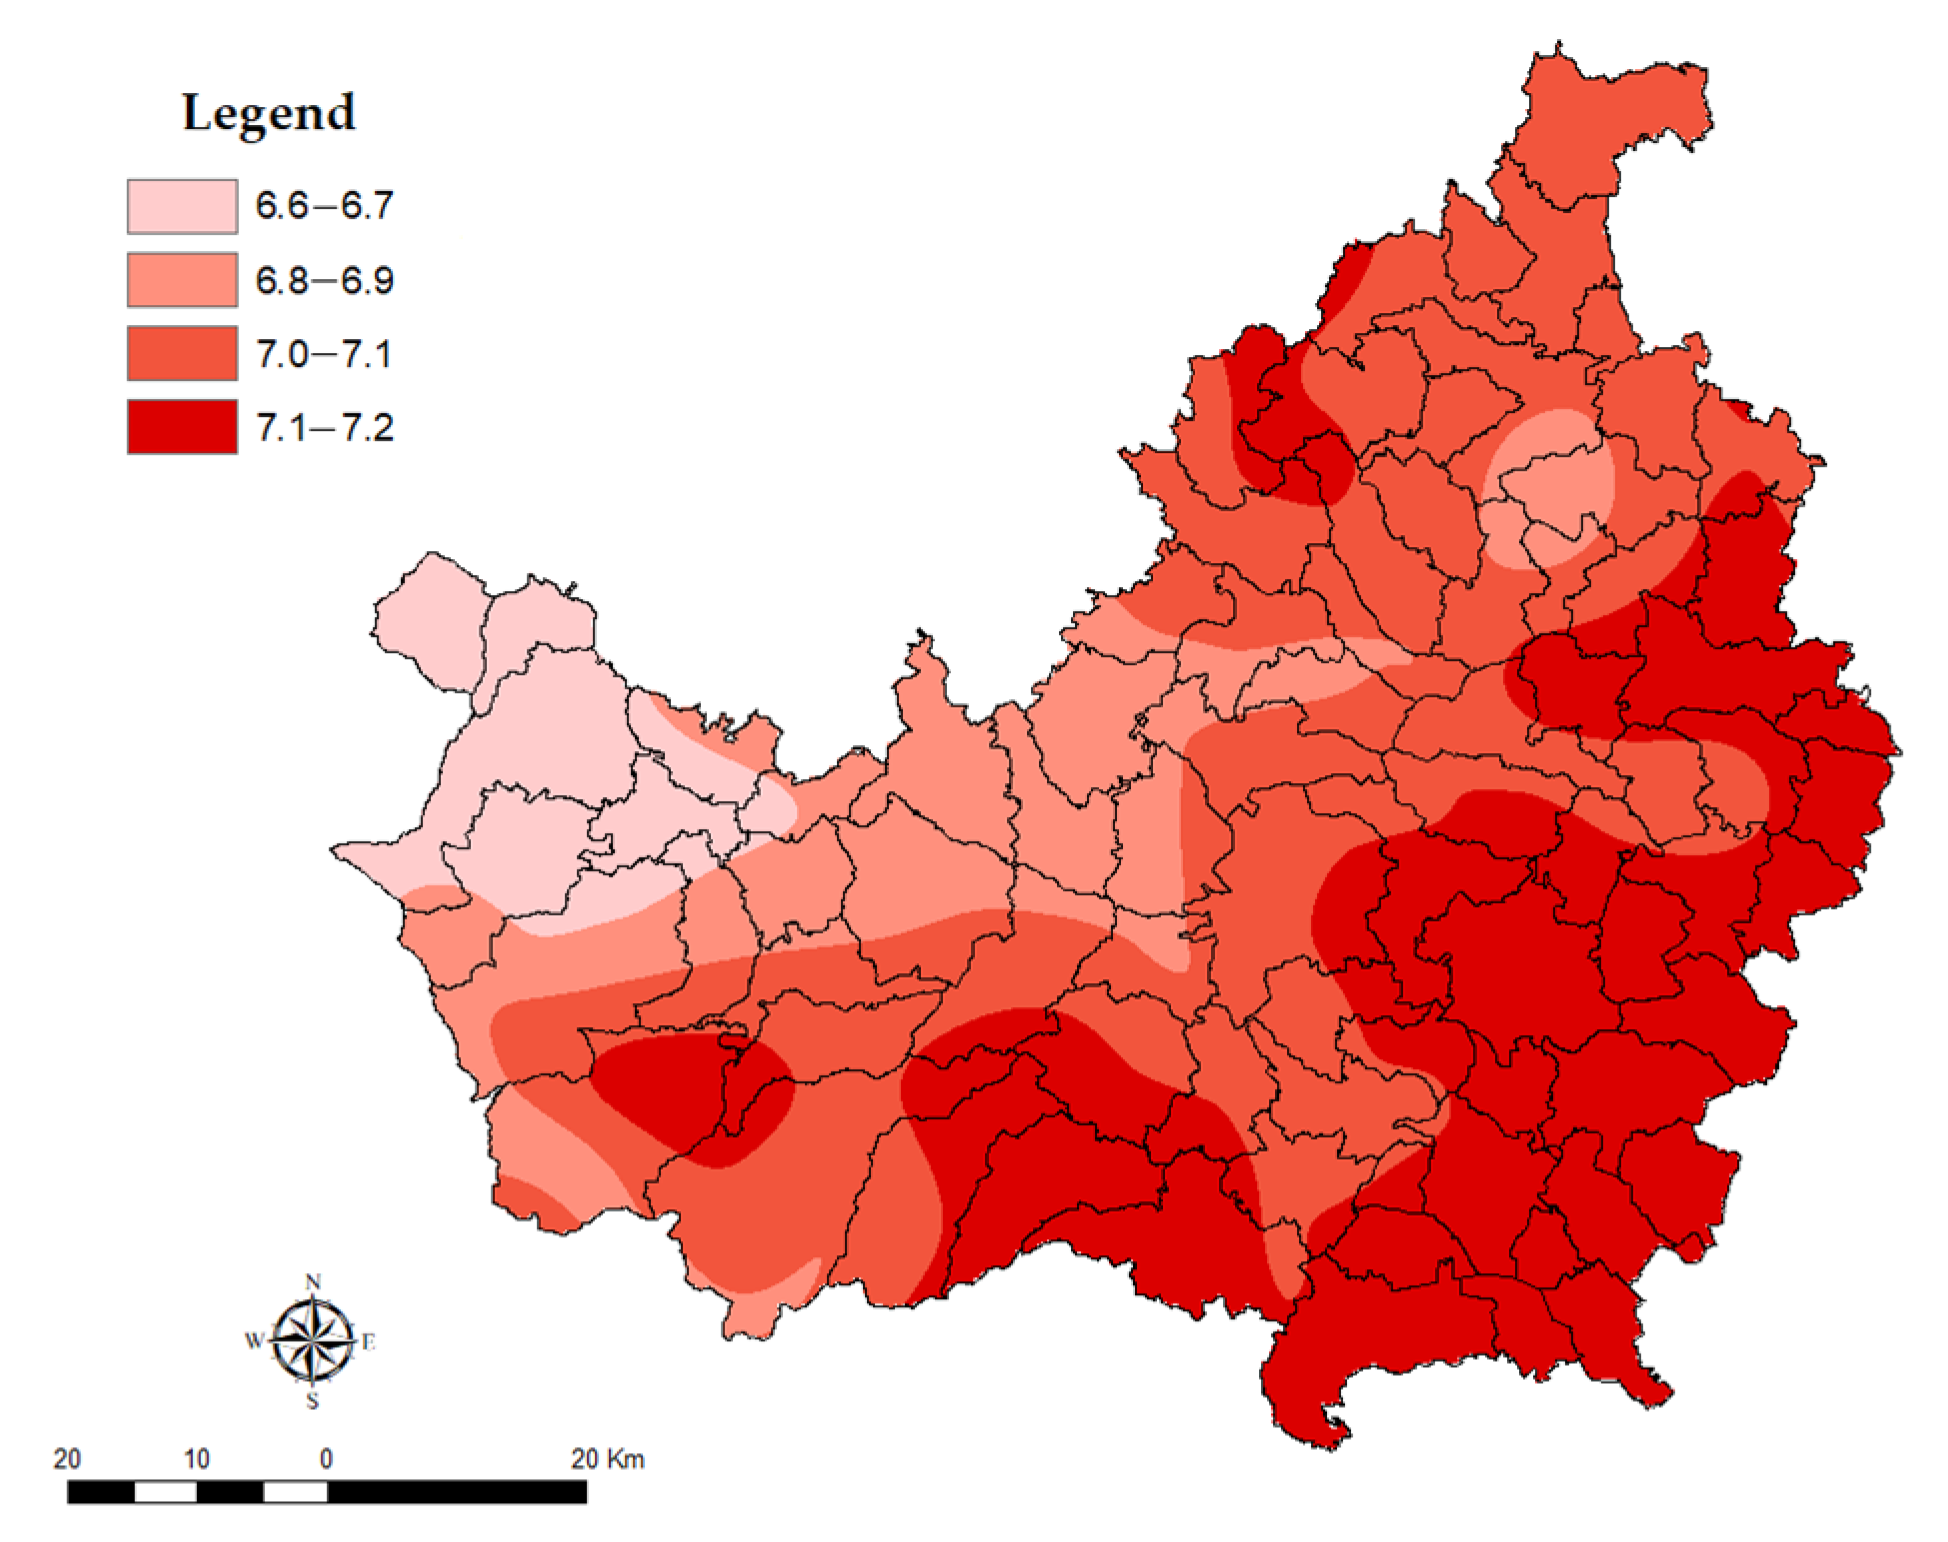
Appendix A. Spatial Distribution of Extreme Temperature Indices in Cluj County
Figure A1.
Mean value of daily maximum temperature (°C).

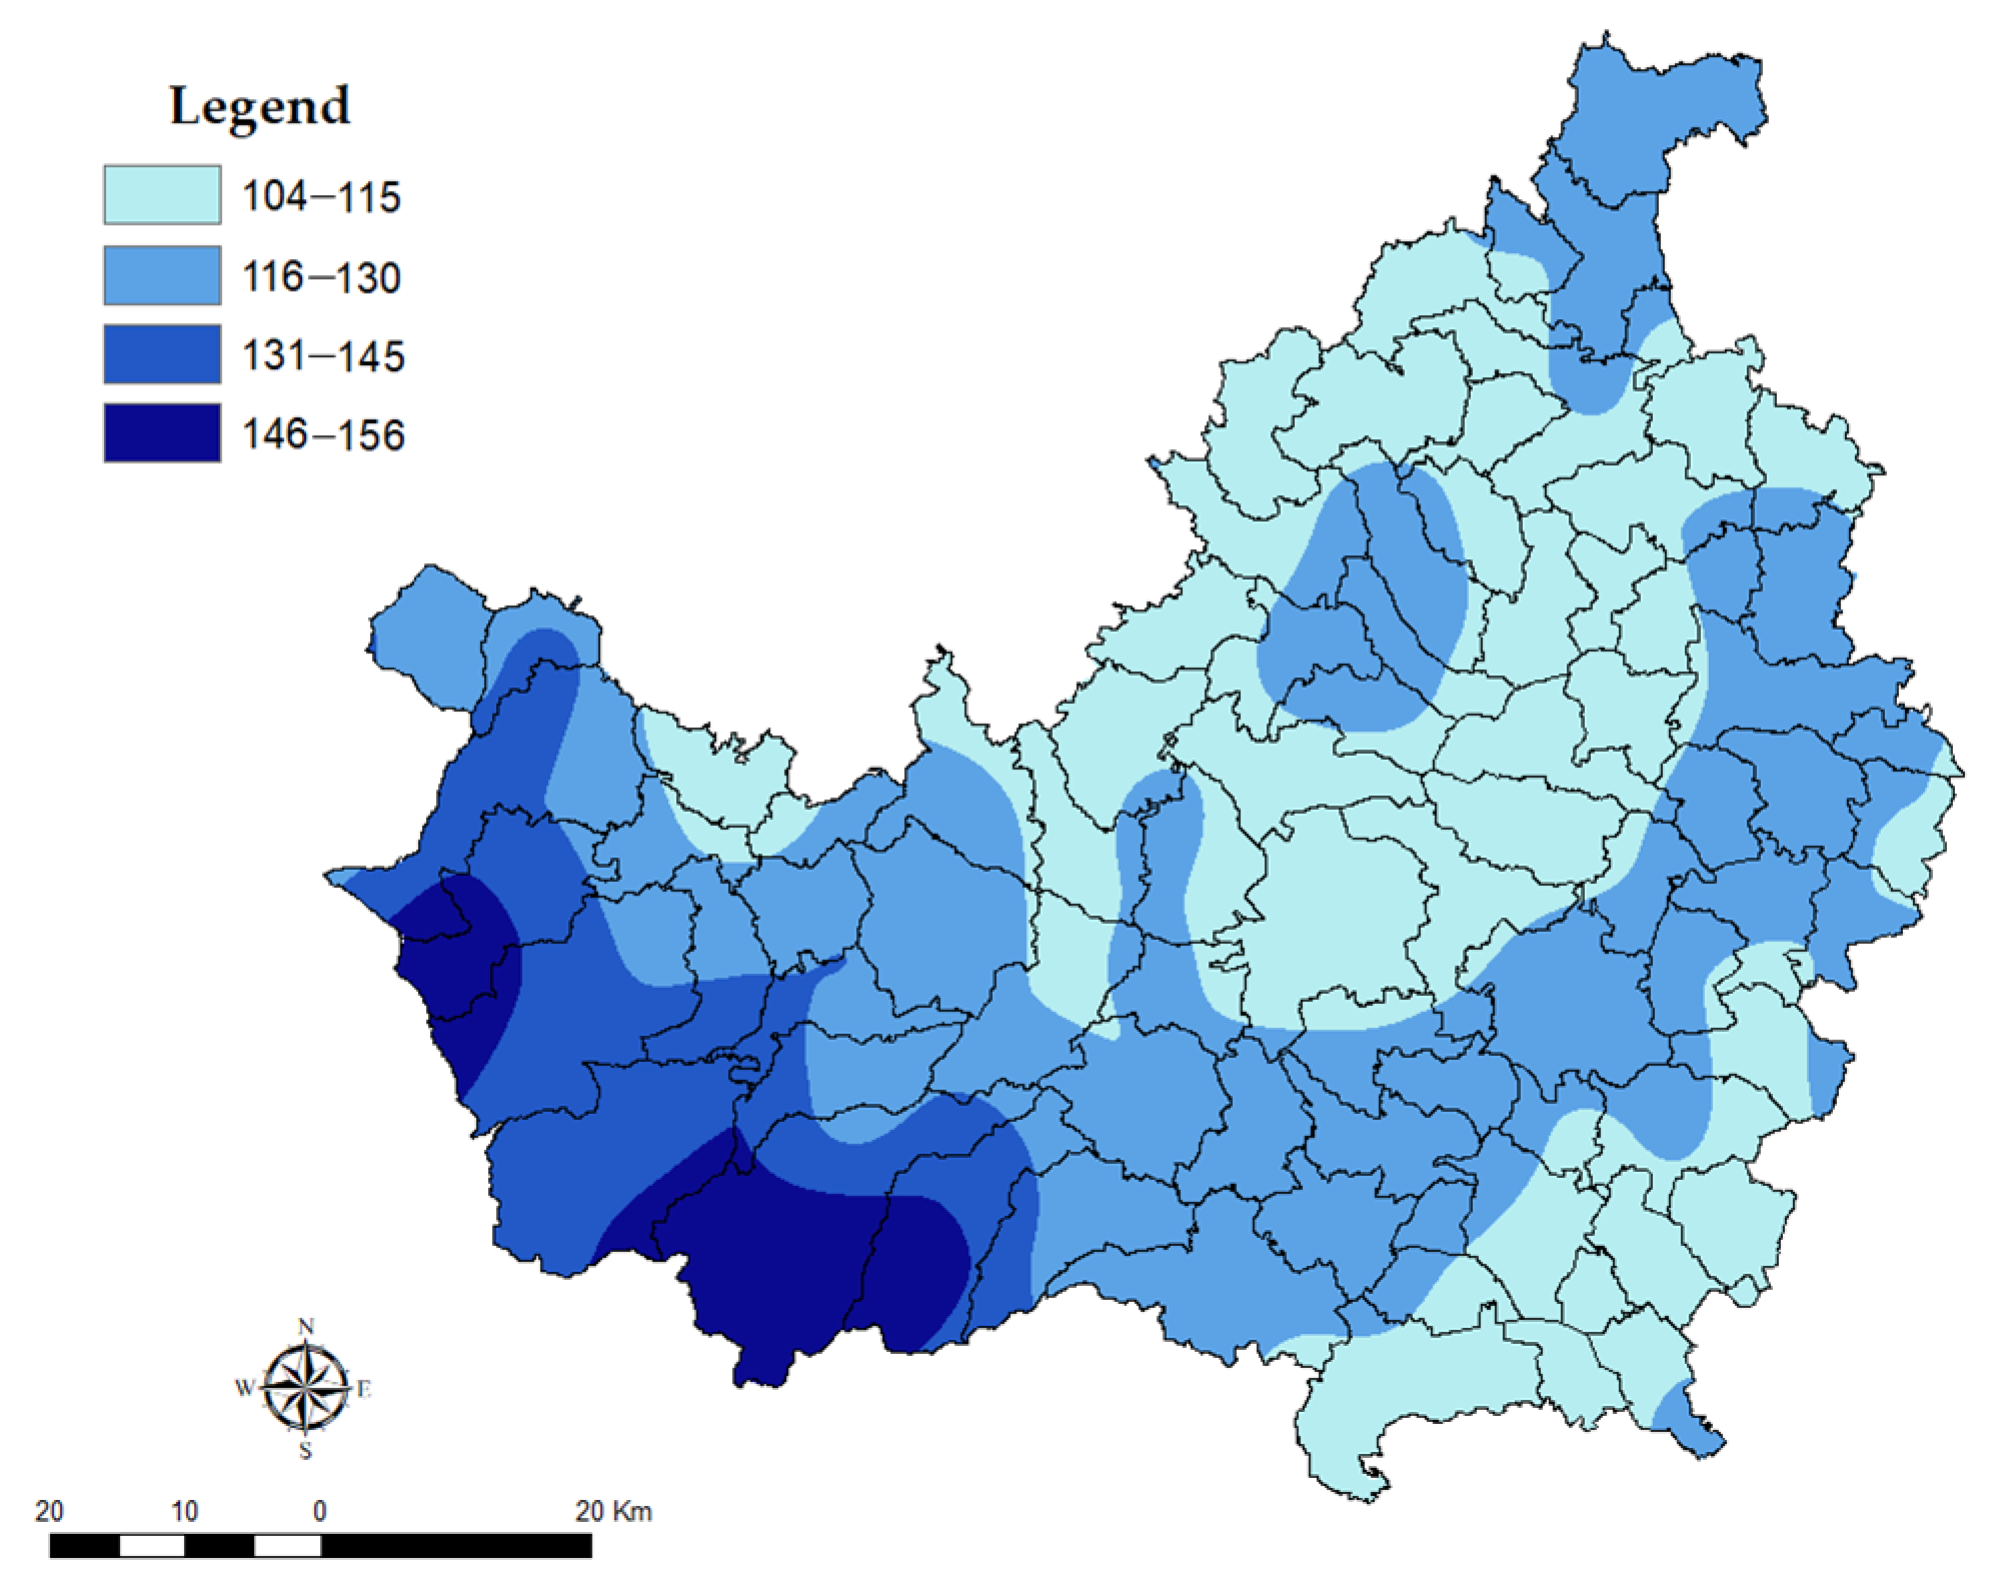
Figure A2.
Mean annual number of summer days.

Figure A3.
Mean duration of a heatwave event (days).

Figure A4.
Mean annual number of frost days.

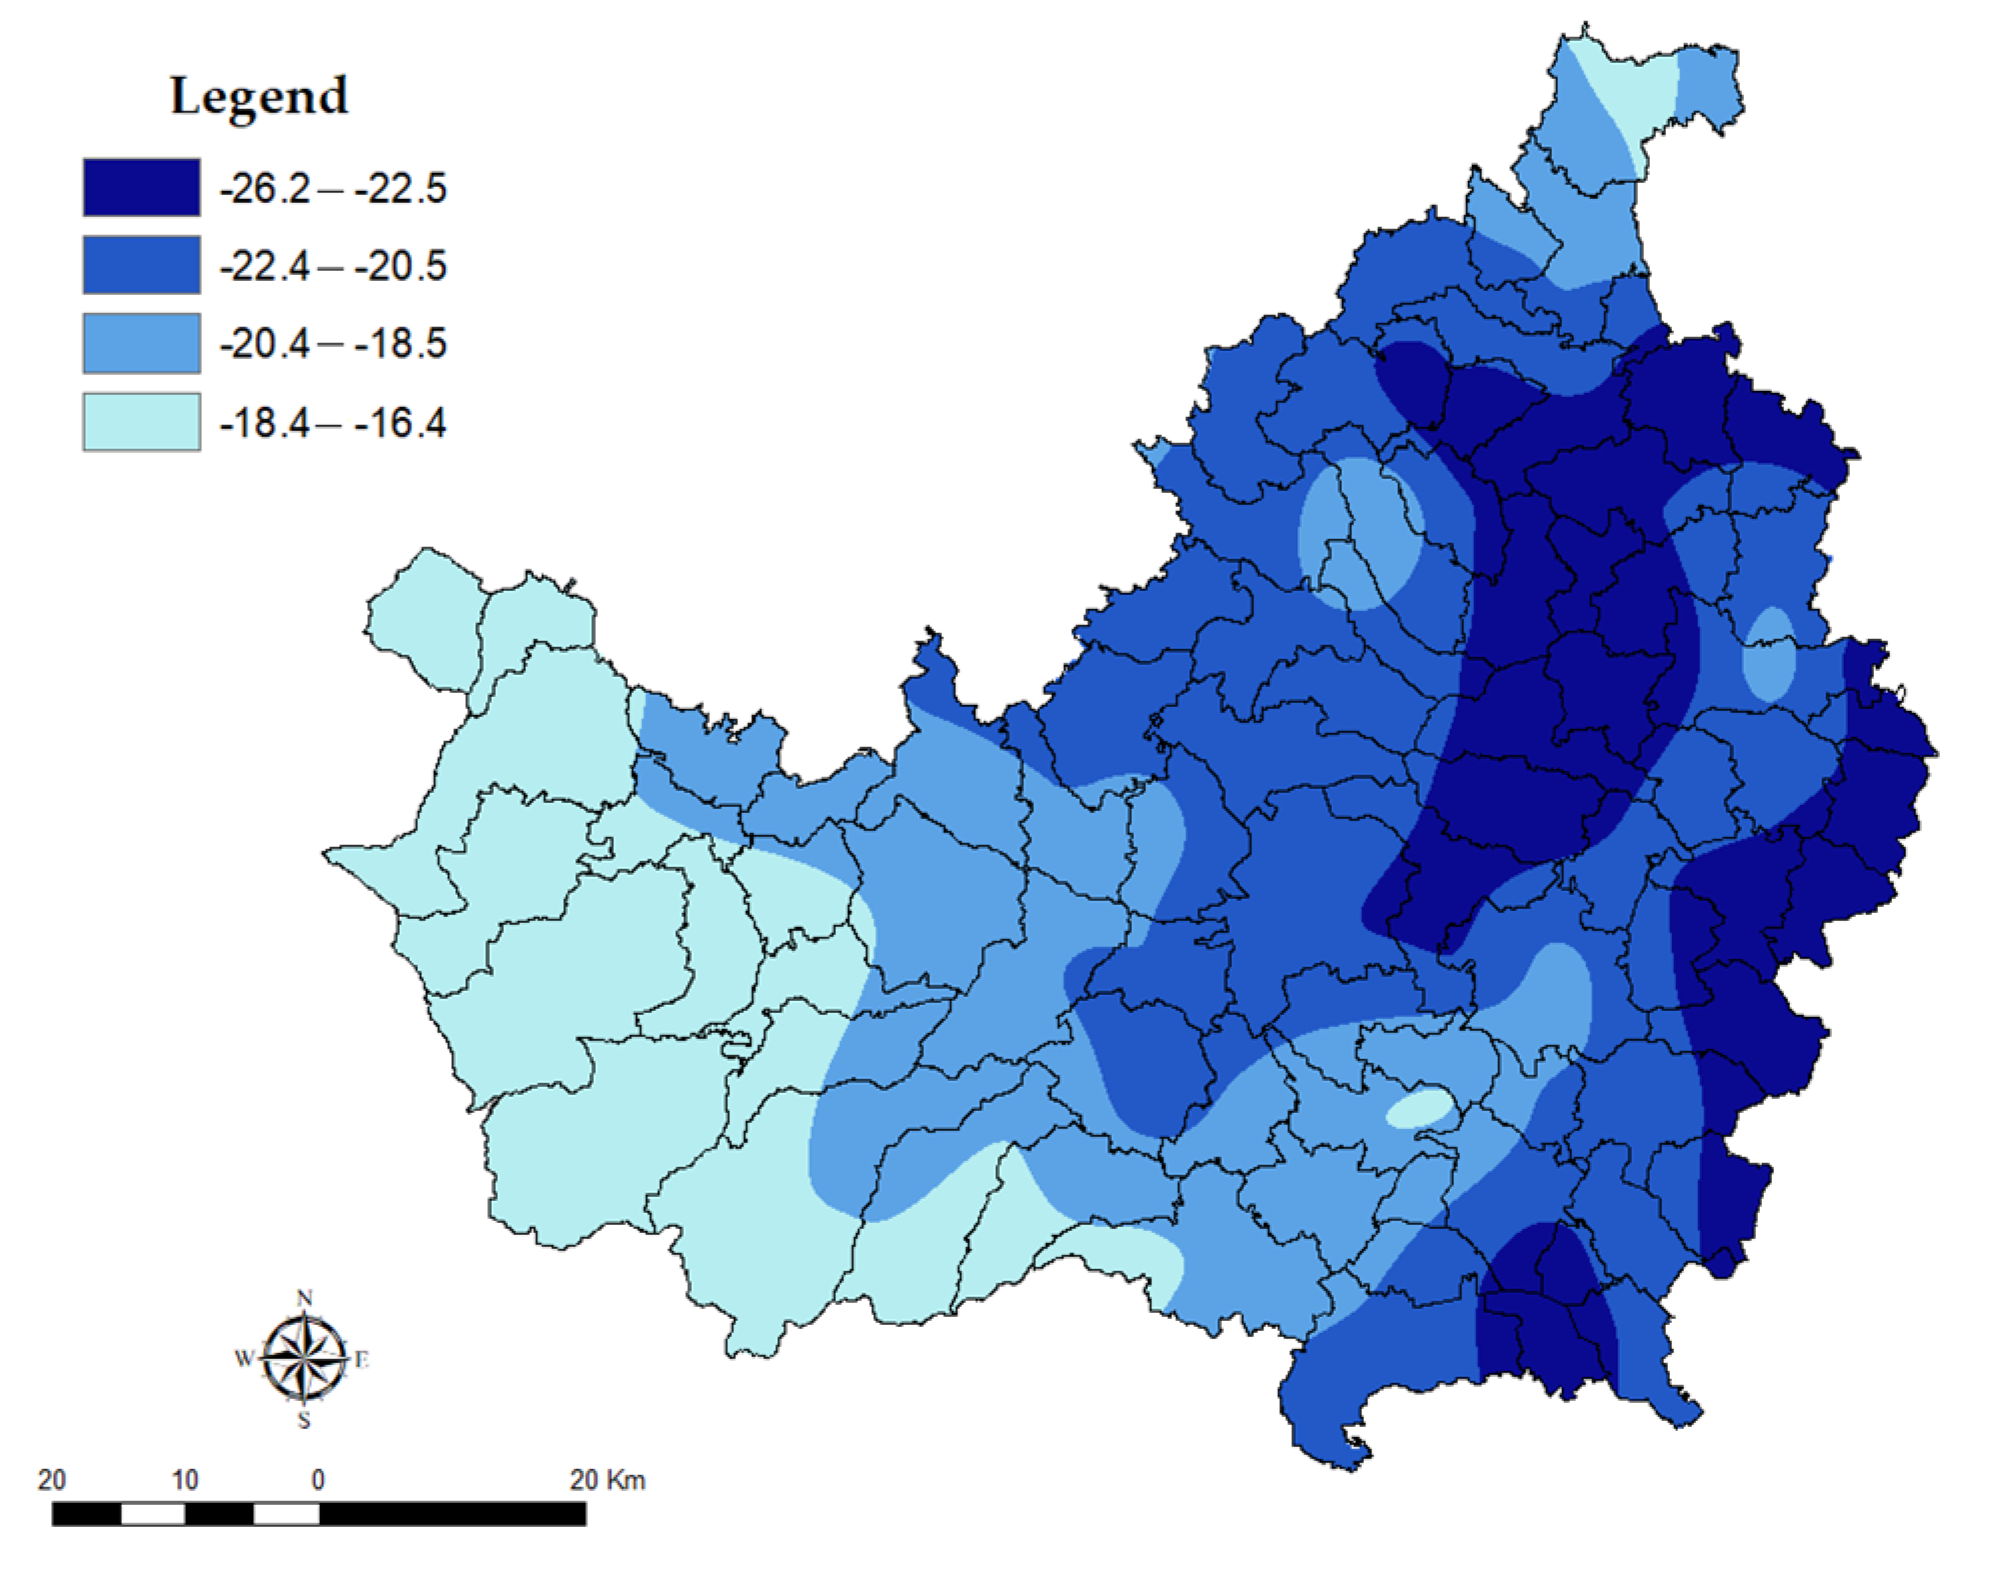
Figure A5.
Intensity of a coldwave event (°C).

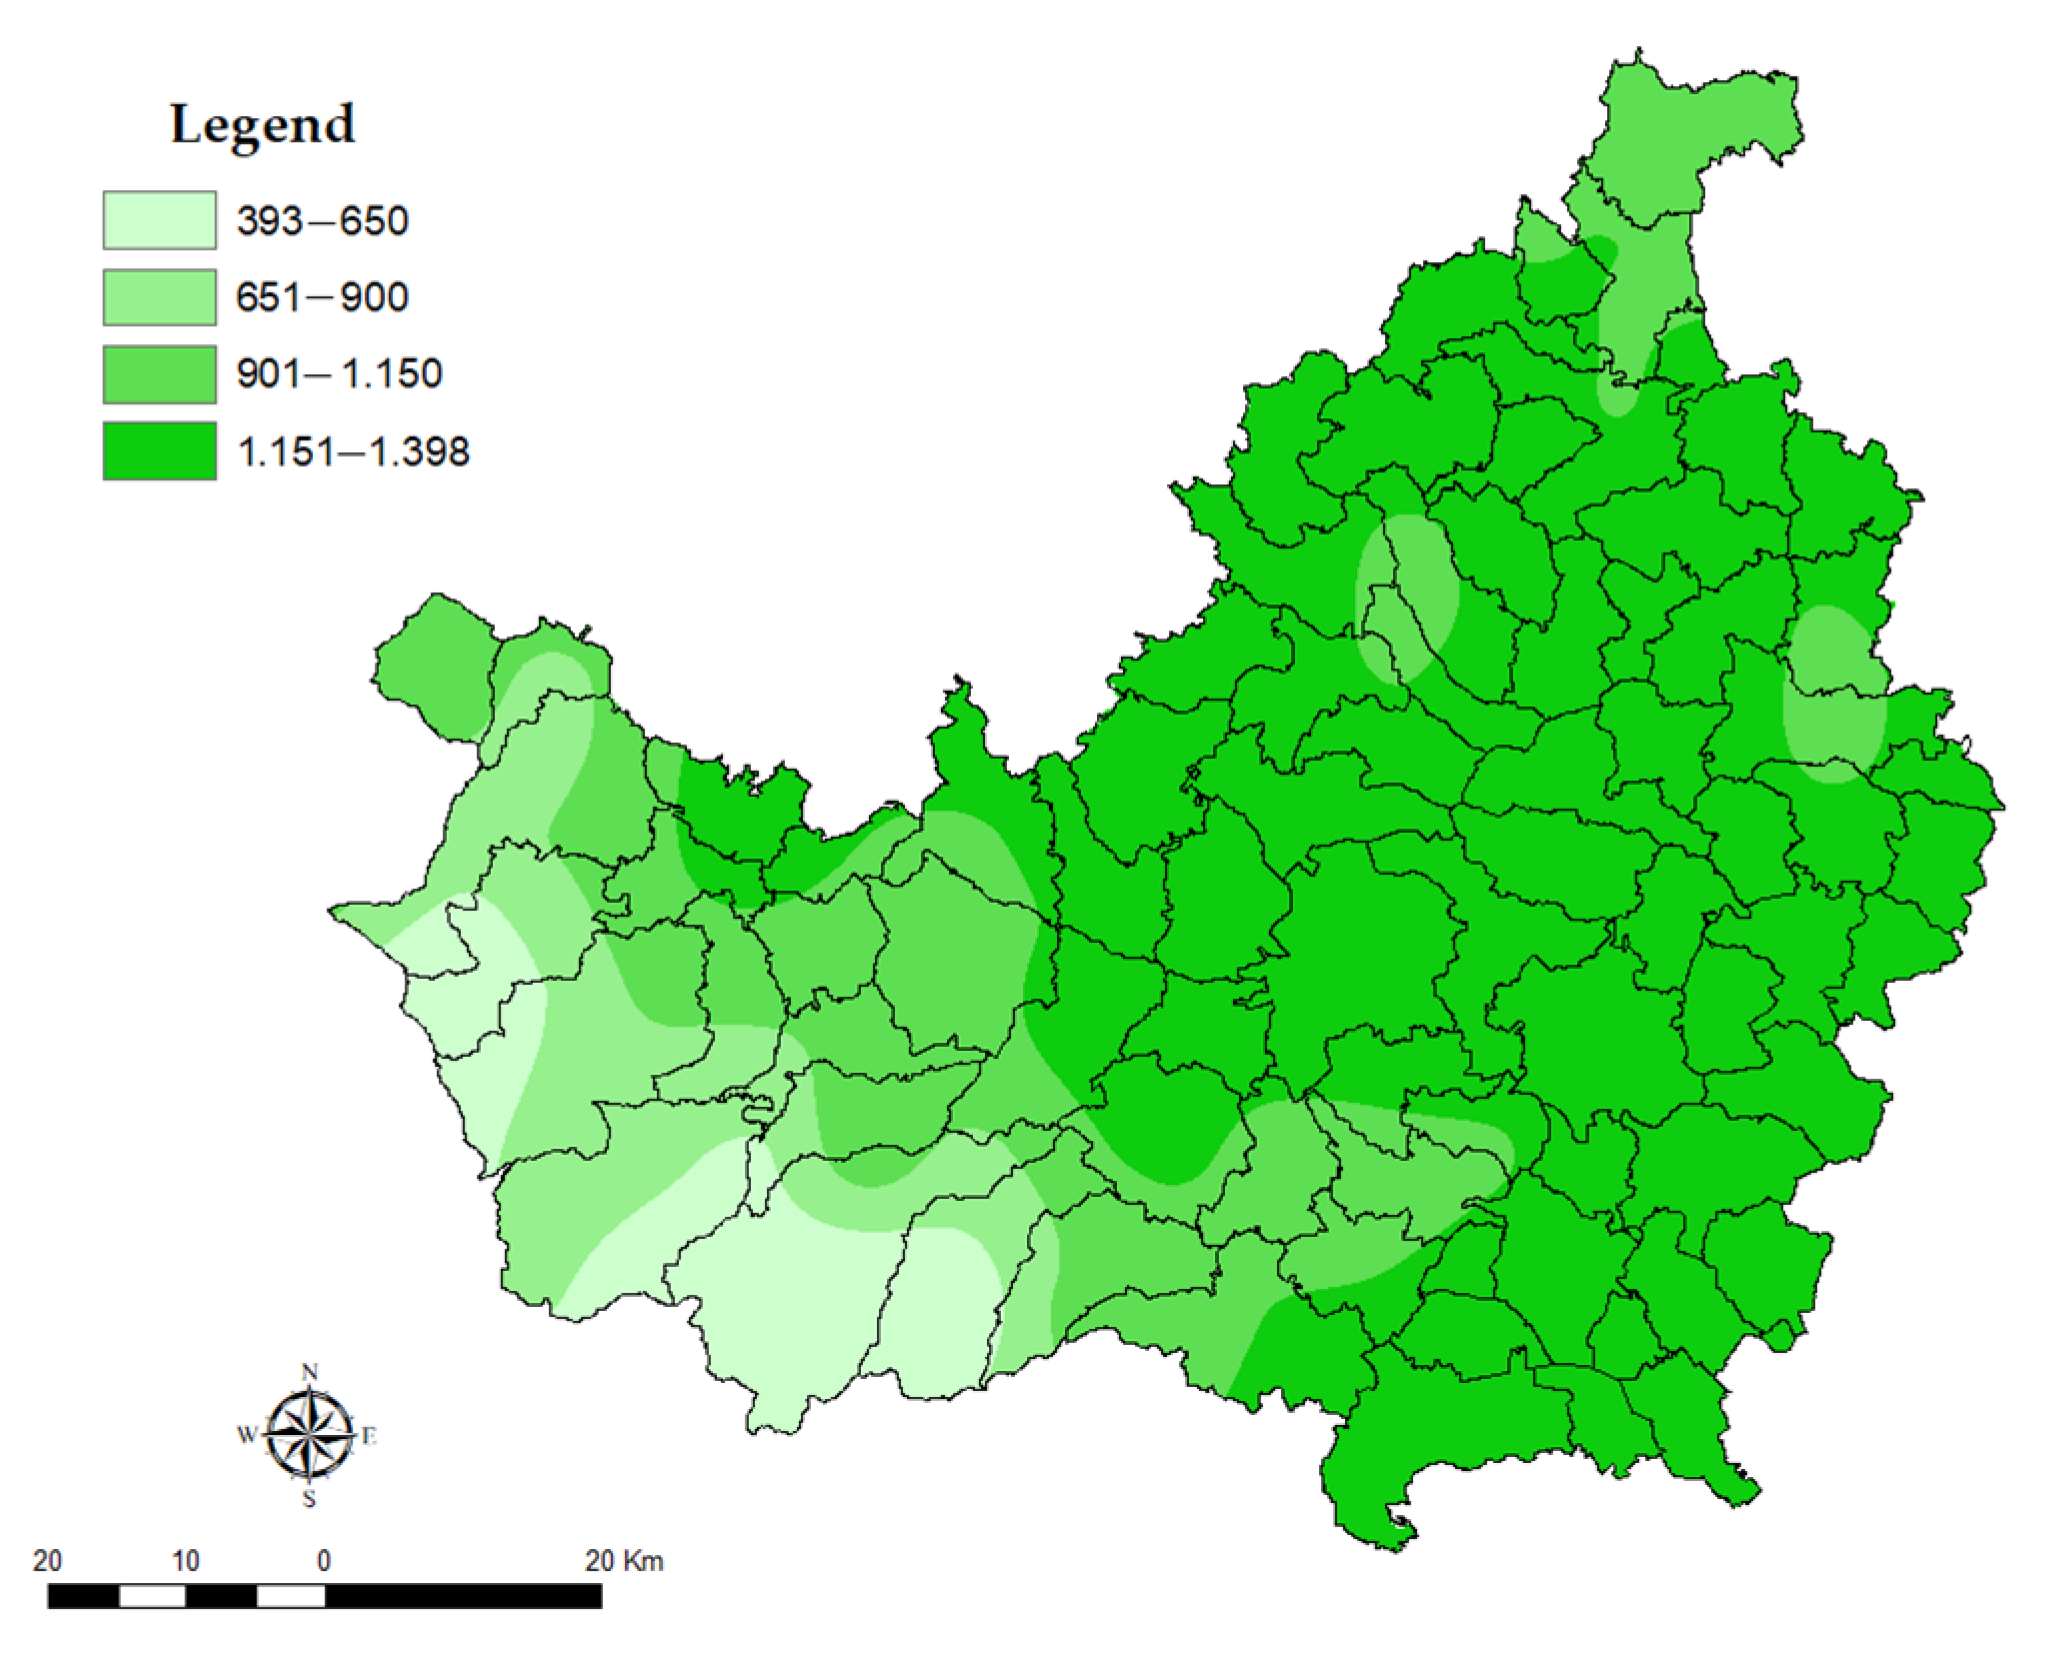
Figure A6.
Growing degree days (°C).

References
- United Nations Sustainable Development Goals. Department of Economic and Social Affairs. Available online: https://sdgs.un.org/ (accessed on 12 June 2021).
- Intergovernmental Panel on Climate Change (IPCC). Climate change 2007: Impacts, adaptation and vulnerability. In Contribution of Working Group II to the Fourth Assessment Report of the Intergovernmental Panel on Climate Change; Cambridge University Press: Cambridge, UK, 2007; p. 976. [Google Scholar]
- Huynh, H.; Do, A.; Dao, T. Climate change vulnerability assessment for Can Tho city by a set of indicators. Int. J. Clim. Chang. Strateg. Manag. 2020, 12, 147–158. [Google Scholar] [CrossRef]
- Wisner, B.; Blaikie, P.; Cannon, T.; Davis, I. At risk: Natural Hazards, People’s Vulnerability and Disasters, 2nd ed.; Routledge: Oxford, UK, 2004. [Google Scholar]
- Cutter, S.L. Vulnerability to environmental hazards. Prog. Hum. Geogr. 1996, 20, 529–539. [Google Scholar] [CrossRef]
- Aroca, J.E.; Bodoque, J.M.; Garcia, J.A.; Diez, H.A. Construction of an integrated social vulnerability index in urban areas prone to flash flooding. Nat. Hazards Earth Syst. Sci. 2017, 17, 1541–1557. [Google Scholar] [CrossRef] [Green Version]
- Cutter, S.L.; Boruff, B.J.; Shirley, W.L. Social vulnerability to environmental hazards. Soc. Sci. Q. 2003, 84, 242–261. [Google Scholar] [CrossRef]
- Adger, W.N.; Brooks, N.; Bentham, G.; Agnew, M.; Eriksen, S. New Indicators of Vulnerability and Adaptive Capacity. Tyndall Centre Technical Reports. Tyndall Centre for Climate Change Research Norwich. 2004. Available online: https://citeseerx.ist.psu.edu/viewdoc/download?doi=10.1.1.112.2300&rep=rep1&type=pdf (accessed on 17 November 2016).
- Birkmann, J. Measuring Vulnerability to Promote Disaster resilient Societies: Conceptual Frameworks and definitions. In Measuring Vulnerability to Natural Hazards—Towards Disaster Resilient Societies; Birkmann, J., Ed.; United Nations University Press: Tokyo, Japan, 2006; pp. 9–54. [Google Scholar]
- Zanetti, V.B.; De Sousa, W.C.; De Freitas, D.M. A Climate Change Vulnerability Index and Case Study in a Brazilian Coastal City. Sustainability 2016, 8, 811. [Google Scholar] [CrossRef] [Green Version]
- Tschakert, P.; Ellis, N.R.; Anderson, C.; Kelly, A.; Obeng, J. One thousand ways to experience loss: A systematic analysis of climate related intangible harm from around the world. Glob. Environ. Chang. 2019, 5, 58–72. [Google Scholar] [CrossRef]
- Meehl, G.A.; Tebaldi, C. More intense, more frequent, and longer lasting heat waves in the 21st century. Science 2004, 305, 994–997. [Google Scholar] [CrossRef] [Green Version]
- Gershunov, A.; Douville, H. Extensive summer hot and cold extremes under current and possible future climatic conditions: Europe and North America. In Climate Extremes and Society; Diaz, H.F., Murnane, R.J., Eds.; Cambridge University Press: Cambridge, UK, 2008; pp. 74–98. [Google Scholar]
- Golden, J.S.; Hartz, D.; Brazel, A.; Luber, G.; Phelan, P. A biometeorology study of climate and heat-related morbidity in Phoenix from 2001 to 2006. Int. J. Biometeorol. 2008, 52, 471–480. [Google Scholar] [CrossRef]
- Anderson, G.B.; Dominici, F.; Wang, Y.; McCormack, M.C.; Bell, M.L.; Peng, R.D. Heat-related emergency hospitalizations for respiratory diseases in the Medicare population. Am. J. Respir. Crit. Care Med. 2013, 10, 1098–1103. [Google Scholar] [CrossRef] [PubMed] [Green Version]
- Gronlund, C.J. Racial and socio-economic disparities in heat-related health effects and their mechanisms: A review. Curr. Epidemiol. Rep. 2014, 3, 165–173. [Google Scholar] [CrossRef]
- Hansen, A.; Bi, L.; Saniotis, A.; Nitschke, M. Vulnerability to extreme heat and climate change: Is ethnicity a factor? Glob. Health Action 2013, 6, 2136. [Google Scholar] [CrossRef] [PubMed] [Green Version]
- Cutter, S.L.; Emrich, C.T.; Webb, J.J.; Morath, D. Social Vulnerability to Climate Variability Hazards: A Review of the Literature. Final Report to Oxfam America. 2009. Available online: http://citeseerx.ist.psu.edu/viewdoc/download?doi=10.1.1.458.7614&rep=rep1&type=pdf (accessed on 17 October 2017).
- Tate, E. Social vulnerability indices: A comparative assessment using uncertainty and sensitivity analysis. Nat. Hazards 2012, 63, 325–347. [Google Scholar] [CrossRef]
- Apotsos, A. Mapping relative social vulnerability in six mostly urban municipalities in South Africa. Appl. Geogr. 2019, 105, 86–101. [Google Scholar] [CrossRef]
- Fussel, H.M.; Klein, R.J.T. Climate change vulnerability assessments: An evolution of conceptual thinking. Clim. Chang. 2006, 75, 301–329. [Google Scholar] [CrossRef]
- Preston, B.L.; Yuen, E.J.; Westaway, R.M. Putting vulnerability to climate change on the map: A review of approaches, benefits, and risks. Sustain. Sci. 2011, 6, 177–202. [Google Scholar] [CrossRef]
- Lee, Y.J. Social vulnerability indicators as a sustainable planning tool. Environ. Impact Assess. 2014, 44, 31–42. [Google Scholar] [CrossRef]
- Debortoli, N.S.; Clark, D.G.; Ford, J.D.; Sayles, J.S.; Diaconescu, E.P. An integrative climate change vulnerability index for Arctic aviation and marine transportation. Nat. Commun. 2019, 10, 2596. [Google Scholar] [CrossRef] [Green Version]
- Kumar, S.; Raizada, A.; Biswas, H.; Srinivas, S.; Mondal, B. Application of indicators for identifying climate change vulnerable areas in semi-arid regions of India. Ecol. Indic. 2016, 70, 507–517. [Google Scholar] [CrossRef]
- Tapia, C.; Abajo, B.; Feliu, E.; Mendizabal, M.; Martinez, J.A.; Fernández, J.G.; Laburu, R.; Lejarazu, A. Profiling urban vulnerabilities to climate change: An indicator-based vulnerability assessment for European cities. Ecol. Indic. 2017, 78, 142–155. [Google Scholar] [CrossRef]
- Hazbavi, Z.; Baartman, J.E.M.; Nunes, J.P.; Keesstra, S.; Sadeghi, S.H. Changeability of reliability, resilience and vulnerability indicators with respect to drought patterns. Ecol. Indic. 2018, 87, 196–208. [Google Scholar] [CrossRef]
- Stângă, I.C.; Grozavu, A. Quantifying human vulnerability in rural areas: Case study of Tutova Hills (Eastern Romania). Nat. Hazards Earth Syst. Sci. 2012, 12, 1987–2001. [Google Scholar] [CrossRef] [Green Version]
- Armaş, I.; Gavriş, A. Social vulnerability assessment using spatial multi-criteria analysis (SEVI model) and the Social Vulnerability Index (SoVI model)—A case study for Bucharest, Romania. Nat. Hazard Earth Syst. 2013, 13, 1481–1499. [Google Scholar] [CrossRef] [Green Version]
- Bănică, A.; Roșu, L.; Muntele, I.; Grozavu, A. Towards urban resilience: A multi-criteria analysis of seismic vulnerability in Iasi city (Romania). Sustainability 2017, 9, 270. [Google Scholar] [CrossRef] [Green Version]
- Török, I. Assessment of social vulnerability to natural hazards in Romania. Carpath. J. Earth Environ. 2017, 12, 549–562. [Google Scholar]
- Török, I. Qualitative assessment of social vulnerability to flood hazards in Romania. Sustainability 2018, 10, 3780. [Google Scholar] [CrossRef] [Green Version]
- Formetta, G.; Feyen, L. Empirical evidence of declining global vulnerability to climate-related hazards. Glob. Environ. Chang. 2009, 57, 1–9. [Google Scholar] [CrossRef] [PubMed]
- Fekete, A. Validation of social vulnerability index in context to river floods in Germany. Nat. Hazards Earth Syst. Sci. 2009, 9, 393–403. [Google Scholar] [CrossRef] [Green Version]
- Holand, I.S.; Lujala, P.; Rød, J.K. Social vulnerability assessment for Norway: A quantitative approach. Nor. Geogr. Tidsskr. 2013, 65, 1–7. [Google Scholar] [CrossRef]
- Chen, W.F.; Cutter, S.L.; Emrich, C.T.; Shi, P. Measuring social vulnerability to natural hazards in the Yangtze River Delta region, China. Int. J. Disaster Risk Reduct. 2013, 4, 169–181. [Google Scholar] [CrossRef] [Green Version]
- Rufat, S.; Tate, E.; Burton, C.; Maroof, S.A. Social vulnerability to floods: Review of case studies and implications for measurement. Int. J. Disaster Risk Reduct. 2015, 14, 470–486. [Google Scholar] [CrossRef] [Green Version]
- Mwale, F.D.; Adeloye, A.J.; Beevers, L. Quantifying vulnerability of rural communities to flooding in SSA: A contemporary disaster management perspective applied to the Lower Shire Valley, Malawi. Int. J. Disaster Risk Reduct. 2015, 12, 172–187. [Google Scholar] [CrossRef]
- Frigerio, I.; Amicis, M. Mapping social vulnerability to natural hazards in Italy: A suitable tool for risk mitigation strategies. Environ. Sci. Policy 2016, 63, 187–196. [Google Scholar] [CrossRef]
- El-Zein, A.; Ahmed, T.; Tonmoy, F. Geophysical and social vulnerability to floods at municipal scale under climate change: The case of an inner-city suburb of Sydney. Ecol. Ind. 2021, 121. [Google Scholar] [CrossRef]
- Armaș, I.; Toma-Danila, D.; Ionescu, R.; Gavriș, A. Vulnerability to earthquake hazard: Bucharest case study, Romania. Int. J. Disaster Risk. Sci. 2017, 8, 182–195. [Google Scholar] [CrossRef]
- National Institute of Statistics (NIS). Bucharest, Romania. Available online: http://www.insse.ro (accessed on 1 April 2021).
- Croitoru, A.E.; Piticar, A. Changes in daily extreme temperatures in the extra-Carpathians regions of Romania. Int. J. Climatol. 2013, 33, 1987–2001. [Google Scholar] [CrossRef]
- Bojariu, R.; Bîrsan, M.V.; Cică, R.; Velea, L.; Burcea, S.; Dumitrescu, A.; Dascălu, S.I.; Gothard, M.; Dobrinescu, A.; Cărbunaru, F.; et al. Schimbările Climatice–de la Bazele Fizice la Riscuri și Adaptare (Climate Change—From Physical Bases to Risks and Adaptation); Printech Press: Bucharest, Romania, 2015. [Google Scholar]
- Croitoru, A.E.; Piticar, A.; Burada, D.C. Changes in precipitation extremes in Romania. Quat. Intern. 2016, 415, 325–335. [Google Scholar] [CrossRef]
- Dumitrescu, A.; Birsan, M.V. ROCADA: A gridded daily climatic dataset over Romania (1961–2013) for nine meteorological variables. Nat. Hazards 2015, 78, 1045–1063. [Google Scholar] [CrossRef]
- Centre for Research on the Epidemiology of Disasters (CRED): The International Disaster Database (EM-DAT). Available online: www.emdat.be (accessed on 18 June 2020).
- Croitoru, A.E.; Piticar, A.; Sfîcă, L.; Harpa, G.V.; Roșca, C.F.; Tudose, T.; Horvath, C.; Minea, I.; Ciupertea, F.A.; Scripcă, A.S. Extreme Temperature and Precipitation Events in Romania; Romanian Academic Press: Bucharest, Romania, 2018. [Google Scholar]
- Cutter, S.L.; Finch, C. Temporal and spatial changes in social vulnerability to natural hazards. Proc. Natl. Acad. Sci. USA 2008, 7, 2301–2306. [Google Scholar] [CrossRef] [Green Version]
- Cardona, O.D.; Aalast, M.K.; Bikmann, J.; Fordham, M.; McGregor, G.; Mechler, R. Determinants of risk: Exposure and vulnerability. In Managing the Risks of Extreme Events and Disasters to Advance Climate Change Adaptation; Cardona, O.D., Allst, M., Eds.; Cambridge University Press: Cambridge, UK, 2012. [Google Scholar]
- Otto, I.M.; Reckien, D.; Reyer, C.P.O.; Marcus, R.; Le Masson, V.; Jones, L.; Norton, A.; Serdeczny, O. Social vulnerability to climate change: A review of concepts and evidence. Reg. Environ. Chang. 2017, 17, 1651–1662. [Google Scholar] [CrossRef]
- Ministry of Regional Development and Public Administration (MRDPA). Revenues and Expenses at LAU and County Level. Bucharest, Romania. Available online: https://www.mlpda.ro (accessed on 17 January 2021).
- European Climate Assassment and Database (E-Obs). Available online: https://www.ecad.eu (accessed on 14 July 2021).
- Sfîcă, L.; Croitoru, A.E.; Iordache, I.; Ciupertea, A.F. Synoptic Conditions Generating Heat Waves and Warm Spells in Romania. Atmosphere 2017, 8, 50. [Google Scholar] [CrossRef] [Green Version]
- World Bank. Cluj County RAS. 2020. Available online: https://www.worldbank.org/en/country/romania/brief/ras-romania (accessed on 17 July 2020).
- Alexander, L.; Herold, N. ClimPACT2 Indices and Software. The University of South Wales: Sydney, Australia, 2016. Available online: https://github.com/ARCCSS-extremes/climpact2 (accessed on 23 November 2020).
- Lu, G.Y.; Wong, D.W. An adaptive inverse-distance weighting spatial interpolation technique. Comput. Geosci. 2018, 9, 1044–1055. [Google Scholar] [CrossRef]
- Cliff, A.D.; Ord, J.K. Spatial Autocorrelation. In Monographs in Spatial Environmental Systems Analysis; Pion: London, UK, 1973; pp. 76–83. [Google Scholar]
- Anselin, L. Local indicators of spatial association—LISA. Geogr. Anal. 1995, 2, 93–115. [Google Scholar] [CrossRef]
- Reckien, D.; Creutzig, F.; Fernandez, B.; Shuaib, L.M.; Restrepo, T.M.; McEvoy, D.; Satterthwaite, D. Climate change, equity and the Sustainable Development Goals: An urban perspective. Environ. Urban. 2017, 29, 159–182. [Google Scholar] [CrossRef]
- Morrow, B. Identifying and mapping community vulnerability. Disasters 1999, 23, 1–18. [Google Scholar] [CrossRef] [PubMed]
- Hedlund, J.; Fick, S.; Carlsen, H.; Benzie, M. Quantifying transnational climate impact exposure: New perspectives on the global distribution of climate risk. Glob. Environ. Chang. 2018, 52, 75–85. [Google Scholar] [CrossRef]
- Ministry of Environment and Climate Change (MECC). Romania’s Sixth National Communication on Climate Change and First Biennial Report to the United Nations Framework Convention on Climate Change. 2013. Available online: https://unfccc.int/sites/default/files/6th_nccc_and_1st_br_of_romania%5B1%5D.pdf (accessed on 16 April 2013).
- Croitoru, A.E.; Man, T.C.; Vâtcă, S.D.; Kobulniczky, B.; Stoian., V. Refining the Spatial Scale for Maize Crop Agro-Climatological Suitability Conditions in an Area with Complex Topography towards a Smart and Sustainable Agriculture. Case Study: Central Romania (Cluj County). Sustainability 2020, 12, 2783. [Google Scholar] [CrossRef] [Green Version]
- Roesch-McNally, G.E. US Inland Pacific Northwest wheat farmers’ perceived risks: Motivating intentions to adapt to climate change? Environments 2018, 5, 49. [Google Scholar] [CrossRef] [Green Version]
- Gurzau, A.E.; Popovici, E.; Pintea, A.; Popa, O.; Pop, C.; Dumitrascu, I. Quality of surface water sources from a central Transylvanian area as a possible problem for human security and public health. Carpath. J. Earth Environ. Sci. 2010, 5, 119–126. [Google Scholar]
- Herbel, I.; Croitoru, A.E.; Rus, A.V.; Roşca, C.F.; Harpa, G.V.; Ciupertea, A.F.; Rus, I. The impact of heat waves on surface urban heat island and local economy in Cluj-Napoca city, Romania. Theor. Appl. Climatol. 2017, 133, 681–695. [Google Scholar] [CrossRef]
- Cutter, S.L.; Burton, C.G.; Emrich, C.T. Disaster Resilience Indicators for Benchmarking Baseline Conditions. J. Homel. Secur. Emerg. Manag. 2010, 7, 51. [Google Scholar] [CrossRef]
- Frazier, T.G.; Thompson, C.M.; Dezzani, R.J. A framework for the development of the SERV model: A Spatially Explicit Resilience-Vulnerability model. Appl. Geogr. 2014, 51, 158–172. [Google Scholar] [CrossRef]
- Ford, J.D.; Sherman, M.; Ford, L.B.; Llanos, A.; Carcamo, C.; Harper, S.; Lwasa, S.; Namanya, D.; Marcello, T.; Maillet, M.; et al. Preparing for the health impacts of climate change in Indigenous communities: The role of community-based adaptation. Glob. Environ. Chang. 2018, 49, 129–139. [Google Scholar] [CrossRef]
- European Commission: European Green Deal. 2020. Available online: https://ec.europa.eu/info/strategy/priorities-2019-2024/european-green-deal_en (accessed on 20 July 2020).
- Manuamorn, O.P.; Biesbroek, R.; Cebotari, V. What makes internationally-financed climate change adaptation projects focus on local communities? A configurational analysis of 30 Adaptation Fund projects. Glob. Environ. Chang. 2020, 61, 102035. [Google Scholar] [CrossRef]
Figure 1.
Study area location.

Figure 2.
Mean multiannual temperature in Cluj County over the period 1961–2013 (°C). Data source: data processed after ROmanian ClimAtic Dataset (ROCADA) gridded database [46].
Figure 2.
Mean multiannual temperature in Cluj County over the period 1961–2013 (°C). Data source: data processed after ROmanian ClimAtic Dataset (ROCADA) gridded database [46].

Figure 3.
Flowchart of the Climate-related Social Vulnerability Index (CleSoVI).

Figure 4.
Built-, Demographic-, Socio-Economic and Climate impact vulnerability in Cluj County.

Figure 5.
Climate-related Social Vulnerability Index scores.

Figure 6.
Cartogram of clusters representing the CleSoVI for measuring the general vulnerability.


Table 1.
Descriptive statistics of variables considered for social vulnerability assessment.
| Vulnerability Components | Variables | Mean | SD | Min | Max |
|---|---|---|---|---|---|
| Exposure | Mean value of daily maximum temperature (°C) | 3.75 | 0.67 | 1.77 | 4.54 |
| Mean annual magnitude of coldwaves (°C) | −20.95 | 2.04 | −25.08 | −16.91 | |
| Mean annual number of hot days (days) | 7.25 | 4.33 | 0.01 | 17.36 | |
| Mean annual number of frost days (days) | 117.82 | 8.13 | 107.21 | 144.99 | |
| Mean duration of a heatwave events (days) | 3.11 | 0.03 | 2.99 | 3.17 | |
| Growing degree days (°C) | 1174.42 | 178.11 | 593.60 | 1378.56 | |
| Sensitivity | Average number of people per household (number) | 2.55 | 0.26 | 2.02 | 3.12 |
| Demographic dependency ratio (%) | 217.50 | 77.14 | 67.31 | 488.81 | |
| Illiteracy rate (%) | 1.85 | 1.70 | 0.24 | 9.93 | |
| Net international migration rate (‰) | −0.12 | 0.45 | −2.00 | 1.19 | |
| Number of housing units per square kilometer (house/km2) | 2.17 | 0.94 | 0.77 | 8.37 | |
| People employed in agriculture (%) | 37.30 | 19.11 | 1.06 | 77.50 | |
| Percentage of forest cover (%) | 21.58 | 15.20 | 0.97 | 87.69 | |
| Population density (people/km2) | 97.42 | 237.95 | 6.03 | 1710.87 | |
| Rate of natural increase (‰) | −8.63 | 6.50 | −27.80 | 13.52 | |
| Share of houses constructed from wood (%) | 16.46 | 16.60 | 1.10 | 68.62 | |
| Share of houses built between 1946–1990 (%) | 27.33 | 8.57 | 9.05 | 46.38 | |
| Share of population under 5 years old (%) | 14.79 | 5.74 | 3.23 | 53.18 | |
| Share of population aged 65 years and above (%) | 30.36 | 10.66 | 8.46 | 66.58 | |
| Share of widows within the female population (%) | 12.97 | 4.41 | 3.80 | 30.77 | |
| Share of women from the total population (%) | 46.84 | 7.76 | 13.91 | 84.19 | |
| Adaptive capacity | Access to major public road network (number) | 2.22 | 1.22 | 1.00 | 5.00 |
| Employment rate (%) | 0.30 | 0.28 | 0.05 | 1.79 | |
| Housing space per person (m2) | 19.29 | 7.90 | 5.25 | 61.14 | |
| Medical-sanitation staff per 1000 persons (‰) | 0.67 | 1.16 | 0.00 | 8.56 | |
| Share of houses with reinforced structure (%) | 0.54 | 0.79 | 0.00 | 5.00 | |
| People employed in services (%) | 39.20 | 14.80 | 15.06 | 82.79 | |
| Per capita income (RON/person) | 971.63 | 451.70 | 249.13 | 3908.83 | |
| Share of houses built after 1990 (%) | 14.18 | 9.90 | 3.19 | 51.13 | |
| Share of households with a kitchen area (%) | 69.50 | 18.02 | 28.30 | 97.94 | |
| Share of households with a fixed bath (%) | 42.30 | 22.84 | 6.67 | 97.62 | |
| Share of households with access to piped water (%) | 48.35 | 23.48 | 12.61 | 98.65 | |
| Share of households with access to the sewage network (%) | 45.95 | 23.40 | 10.90 | 98.52 | |
| Share of households with a central heating system (%) | 17.90 | 20.54 | 1.49 | 92.02 | |
| Share of population with university education (%) | 5.89 | 5.92 | 1.00 | 37.51 |
Notes: SD = Standard Deviation. Max = Maximum value. Min = Minimum value. N = 81 (local administrative units).
Table 2.
The main components and variables explained variance and loadings for the CleSoVI analysis.
Table 2.
The main components and variables explained variance and loadings for the CleSoVI analysis.
| Component | Percent Variance Explained | Dominant Variables | Component | Sign | |
|---|---|---|---|---|---|
| Loading | |||||
| Built Environment Vulnerability Index | Housing facilities | 45.468 | Share of households with access to piped water | −0.934 | − |
| Share of households with access to sewage networks | −0.928 | ||||
| Share of households with a central heating system | −0.703 | ||||
| Share of households with a kitchen area | −0.913 | ||||
| Share of households with a fixed bath | −0.922 | ||||
| Quality of housing | 19.074 | No. of houses with a reinforced structure | −0.823 | + | |
| No. of houses built between 1946–1990 | 0.616 | ||||
| Population density | 0.820 | ||||
| Quality of living | 11.587 | Housing space per person | 0.858 | + | |
| Number of housing units per km2 | −0.884 | ||||
| Share of houses built after 1990 | 0.508 | ||||
| Green environment | 7.824 | Percentage of forest cover | 0.871 | + | |
| Share of houses constructed from wood | 0.748 | ||||
| Cumulative variance explained: 83.953 | |||||
| Kaiser–Mayer–Olkin Measure of Sampling Adequacy 0.789 | Extraction Method: PCA. Rotation Method: Varimax with Kaiser Normalization. Rotation converged in 6 iterations. | ||||
| Bartlett’s Test of Sphericity 0.000 | |||||
| Demographic Vulnerability Index | Family structure | 40.756 | Share of population aged 65 years and above | 0.893 | + |
| Share of the population under 5 years | 0.788 | ||||
| Share of widows within the female population | 0.867 | ||||
| Demographic vitality | 30.551 | Demographic dependency ratio | 0.946 | + | |
| Rate of natural increase | −0.918 | ||||
| Gender and mobility | 14.68 | Net international migration rate | 0.921 | + | |
| Share of women from the total population | 0.608 | ||||
| Cumulative variance explained: 85.987 | |||||
| Kaiser–Mayer–Olkin Measure of Sampling Adequacy 0.773 | Extraction Method: PCA. Rotation Method: Varimax with Kaiser Normalization. Rotation converged in 4 iterations. | ||||
| Bartlett’s Test of Sphericity 0.000 | |||||
| Socio-Economic Vulnerability Index | Education and occupation | 38.662 | Share of population with a university education | −0.828 | − |
| Employment rate | −0.822 | ||||
| Illiteracy rate | 0.552 | ||||
| People employed in agriculture | 0.887 | ||||
| People employed in services | −0.879 | ||||
| Health and accessibility | 25.698 | Access to major public roads | −0.647 | − | |
| Medical sanitary staff per 1000 persons | −0.891 | ||||
| General well-being | 13.768 | Average number of people per household | 0.852 | − | |
| Per capita income | −0.629 | ||||
| Cumulative variance explained: 78.127 | |||||
| Kaiser–Mayer–Olkin Measure of Sampling Adequacy 0.750 | Extraction Method: PCA. Rotation Method: Varimax with Kaiser Normalization. Rotation converged in 6 iterations. | ||||
| Bartlett’s Test of Sphericity 0.000 | |||||
| Climate vulnerability index | Extreme temperature indices | 77.642 | Mean value of daily maximum temperature (°C) | 0.959 | + |
| Mean annual frequency (cumulative duration) of coldwaves (days) | 0.912 | ||||
| Mean annual number of hot days (daily maximum temperature ≥35 °C) | 0.917 | ||||
| Mean annual number of frost days (daily maximum temperature <0 °C) | 0.923 | ||||
| Growing degree days (°C) | 0.969 | ||||
| Mean duration of a heatwave events (days) | 0.527 | ||||
| Cumulative variance explained: 77.642 | |||||
| Kaiser–Mayer–Olkin Measure of Sampling Adequacy 0.826 | Extraction Method: PCA without rotation | ||||
| Bartlett’s Test of Sphericity 0.000 | |||||
Note: the sign indicates whether the used variable increases or decreases social vulnerability (+ = increases vulnerability, − = decreases social vulnerability).
Publisher’s Note: MDPI stays neutral with regard to jurisdictional claims in published maps and institutional affiliations. |
© 2021 by the authors. Licensee MDPI, Basel, Switzerland. This article is an open access article distributed under the terms and conditions of the Creative Commons Attribution (CC BY) license (https://creativecommons.org/licenses/by/4.0/).
Share and Cite
MDPI and ACS Style
Török, I.; Croitoru, A.-E.; Man, T.-C. Assessing the Impact of Extreme Temperature Conditions on Social Vulnerability. Sustainability 2021, 13, 8510. https://doi.org/10.3390/su13158510
AMA Style
Török I, Croitoru A-E, Man T-C. Assessing the Impact of Extreme Temperature Conditions on Social Vulnerability. Sustainability. 2021; 13(15):8510. https://doi.org/10.3390/su13158510
Chicago/Turabian StyleTörök, Ibolya, Adina-Eliza Croitoru, and Titus-Cristian Man. 2021. "Assessing the Impact of Extreme Temperature Conditions on Social Vulnerability" Sustainability 13, no. 15: 8510. https://doi.org/10.3390/su13158510
Note that from the first issue of 2016, this journal uses article numbers instead of page numbers. See further details here.