
Introduction
Quartz extracted from sediments and bedrock for trapped charge dating (TCD) (Ikeya, 1978; Aitken, 1985; Huntley et al., 1985; Wintle and Murray, 2006; Wintle and Adamiec, 2017) is commonly etched using 40% HF acid. This is done to remove non quartz constituents and to remove the outer layer of quartz grains exposed to the α dose component (Fleming, 1970), or to limit varying differences in induced luminescence of α particles compared to electrons (Aitken and Bowman, 1975). The α particles with the energy of 1 MeV will have 3.3 μm of projected range in quartz and the range–energy relation is well known (Berger et al., 1999). Therefore, the reduction of the outer layer will result in a lower dose from α particles and can be estimated (Bell, 1979; Fleming, 1979). It is based on the assumption that we know the rate of quartz etching and that this process is uniform. It was investigated earlier by many researchers (Leko and Komarova, 1973; Goedicke, 1984; Porat et al., 2015; Duval et al., 2018) because this is directly related to the accuracy and precision of the estimated age in TCD.
Frequently, a simplified manner of expression is used, that non quartz ingredients are dissolved (Bell and Zimmerman, 1978) and quartz grains are etched isotropically. Such simplification allows us to perform the dose rate calculation in a straightforward manner. However, important work performed by Bell and Zimmerman (1978) and later Porat et al. (2015) showed explicitly that quartz etching is not uniform with electron microscope pictures. Later, with the advancement of microscope image analysis (IA), Duval et al. (2015) investigated statistical grain size and shape before etching. This showed that the assumption of grain sphericity might be an oversimplification.
In this work we investigate quartz grain size loss due to chemical etching with independent methods of microscopy IA, laser diffraction (LD) and mass loss. It allows us to gain insights into how HF etching affects grain size and shape and how uniform this process is. With microscope IA we will be able to test assumptions made when the etch depth is assessed only from the mass loss.
Experimental
Geological Material Description
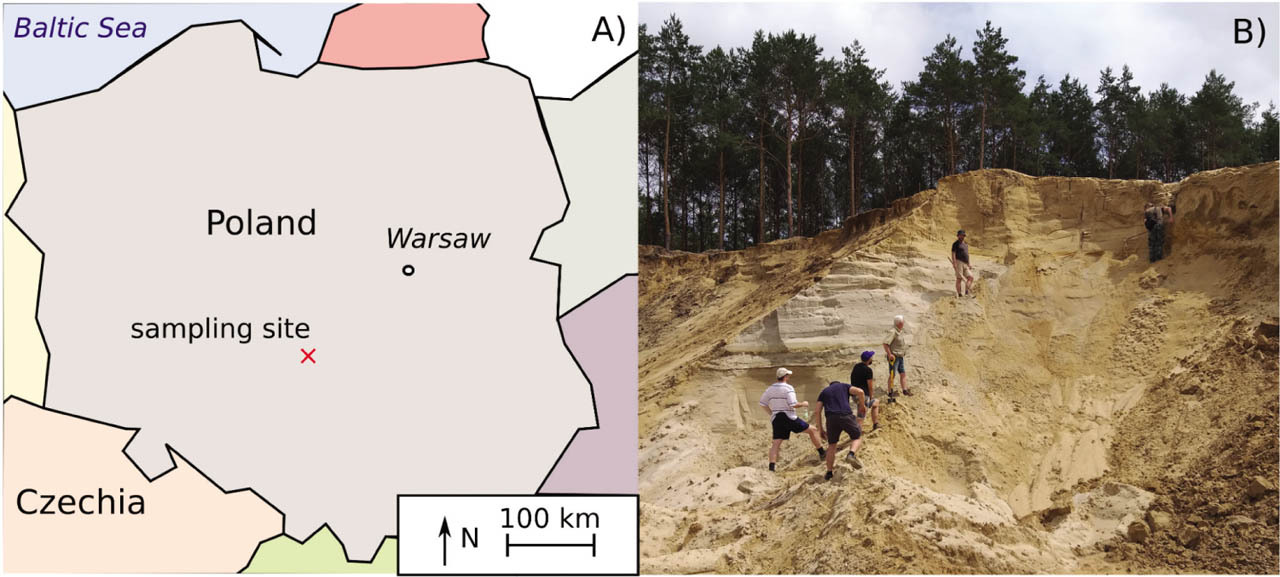
The material used for measurements was collected from the excavations at Ludwików site during the fieldwork of the project. The sampling site (Fig. 1A) is located in an active sand mine (Bełchatów Nowy Świat – the central part of Poland). The geographical coordinates are 51.35° N, 19.31° E and the elevation is 215 m a.s.l. Approximately 20 kg of material was collected at a depth of 570 cm (Fig. 1B). This inland aeolian dune sediment was characterised by a high content of relatively large quartz grains where 90% of the sieved fraction was above 180 μm.
Sample Pretreatment and Quartz Separation
The material was divided into smaller portions and weighed. The sample material was dried at 70 °C and the drying process was monitored by measuring the water loss from the samples. Subsequently, the samples were treated with 20% HCl and 20% H2O2 each time for 24 h at room temperature to remove any carbonates and organic material. Subsequently, the samples were washed in distilled water to achieve a neutral pH value. The desired grain size range was isolated by sieving with mesh widths of 180 μm and 200 μm (ISO 3310-1:2000). Next, the material was distributed into phials (preferred sample mass of ca. 5 g) and separated using a heavy liquid – sodium polytungstate solutions of densities of 2.62 g · cm−3 and 2.75 g · cm−3. This removed 11% of light fraction and 0.5% of heavy minerals. To ensure quartz purity, a sample selected from the material was checked with a Motic BA 310Met polarising mineralogical-petrographic microscope equipped with reflected-transmitted light sources.
Quartz Etching
To prepare quartz for TCD, the grains were routinely immersed in 40% HF acid for 45–60 min, depending on the grain size of the material (Fuchs and Lomax, 2019; Bartyik et al., 2021; Moska et al., 2021). The aim of this exercise was to remove ca. 10 μm of the outer shell of the quartz grains (Aitken, 1985; Duval et al., 2018). In this study, the main question is how etching impacts the mass and grain size of quartz particles, depending on the amount of time the material is immersed in HF acid. The sample material was divided into 16 beakers that contained ca. 3.5 g of quartz grains each (see Table 1 for detailed data). After adding 10 ml of 40% HF, the etching process went on for different time spans. The HF solution was neutralised with HCl (35–38%) and the samples were rinsed with distilled water. The samples were etched in two batches A and B (as shown in Table 1) for 0 min, 30 min, 45 min, 60 min, 90 min, 120 min, 150 min and 180 min (Table 1). While etching (HF 40%), beakers with quartz grains were stirred every 10 min. Typical images of quartz grains are shown in Figs. 2 and 3 before and after 40 % HF etching.
Table 1
Initial and final mass loss of etched quartz grains and estimated etched depth of the grains.
| Time (min) | Batch A | Batch B | Mean etching depth (μm) | ||
|---|---|---|---|---|---|
| Initial mass (g) | Final mass (g) | Initial mass (g) | Final mass (g) | ||
| 0* | 3.5739 | 3.5661 | 3.5033 | 3.4977 | 0 ± N/A |
| 30 | 3.5513 | 2.9595 | 3.5981 | 3.0251 | 5.1 ± 0.3 |
| 45 | 3.5161 | 2.7271 | 3.5524 | 2.7978 | 7.0 ± 0.4 |
| 60 | 3.5400 | 2.5144 | 3.5099 | 2.5116 | 9.5 ± 0.5 |
| 90 | 3.6021 | 2.2142 | 3.4692 | 2.0754 | 13.8 ± 0.8 |
| 120 | 3.5805 | 1.8717 | 3.4540 | 1.7820 | 17.6 ± 1.0 |
| 150 | 3.5299 | 1.5243 | 3.4676 | 1.5269 | 21.7 ± 1.2 |
| 180 | 3.4273 | 1.2808 | 3.5608 | 1.2963 | 25.2 ± 1.4 |
Fig. 2
Random grains before (A) and after 40% HF etching for 60 min (B) and 180 min (C). Note smaller grains ranging from ca. 5 μm up to 100 μm detected after etching (B and C), marked with an arrow.
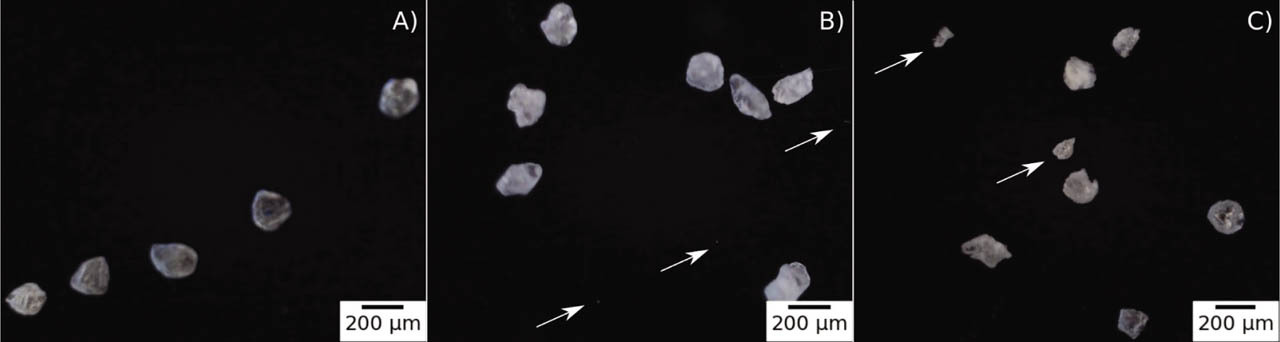
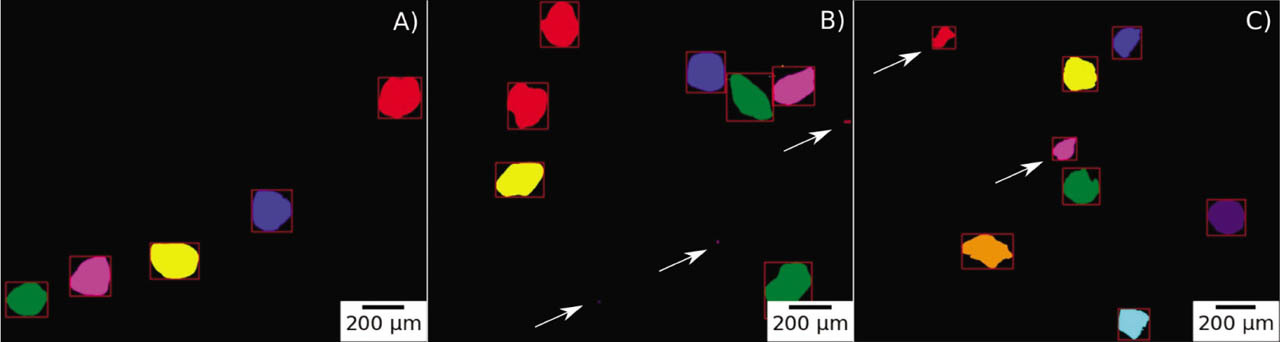
Fig. 3
Random grains before (A) and after 40% HF etching for 60 min (B) and 180 min (C). Note smaller grains ranging from ca. 5 μm up to 100 μm detected after etching (B and C), marked with an arrow. The microscope IA algorithm marks different grains with different colours and draws rectangles for visual validation.
Mass Loss Grain Size Estimates
To measure the etching depth, the weight of all portions of quartz grains before and after 40% HF etching was measured. It was done with the various etching durations described in the previous section. Weighting was performed with a WAA 100/C/1 balance (manufactured by RADWAG). This balance has the verification scale interval of e = 1 mg and the division displayed d = 0.1 mg. The balance was calibrated with a certified 500 mg test weight (F1 classes of weight). Zero minutes etching was used as a reference to assess the material loss after it had undergone procedures not related to etching (Table 1). In other words, the handling and weighting of the sample induces 0.20 ± 0.12% material mass loss on average. This material mass loss is taken into account in our estimations. In our calculations, we assumed that the number of grains remained the same during etching. The main assumption is that grains are spherical with a mean diameter of 190 μm (although in fact it is not true, as we show further on), but we did not want to introduce bias from microscope IA and LD, as described in the following sections. The etching depth (δrm) was calculated using:
where ri = 95 ± 5 μm is the assumed initial grain radius, mi and mf are the initial and final masses and f = 0.0020 ± 0.0012 is average material loss not related to etching. Estimated uncertainties assume spherical quartz grains and take into account weight uncertainty.Laser Analysis of Grain Size Distribution
Samples for laser analysis of grain size distribution were mixed with distilled water. Overnight solutions were mixed using a rotary shaker and sodium hexametaphosphate was added to this mixture (Poręba et al., 2019) before the laser grain size measurement. This procedure was followed although we expected that aggregates should not be an issue in our samples. LD grain size measurements (Mason et al., 2003; Schaetzl et al., 2014) were carried out using Mastersizer 3000 (manufactured by Malvern Panalytical, Malvern, UK). The volumetric particle size distribution is shown in Fig. 4. The DV, LD, 10, DV, LD, 50 and DV, LD, 90 values correspond to diameters which, respectively, intercept 10%, 50% and 90% of the cumulative volume (V). The DN, LD, 10, DN, LD, 50 and DN, LD, 90 correspond to diameters that, respectively, intercept 10%, 50% and 90% of the cumulative distribution with respect to the detected number (N) of particles, under the assumption of spherical particle size.
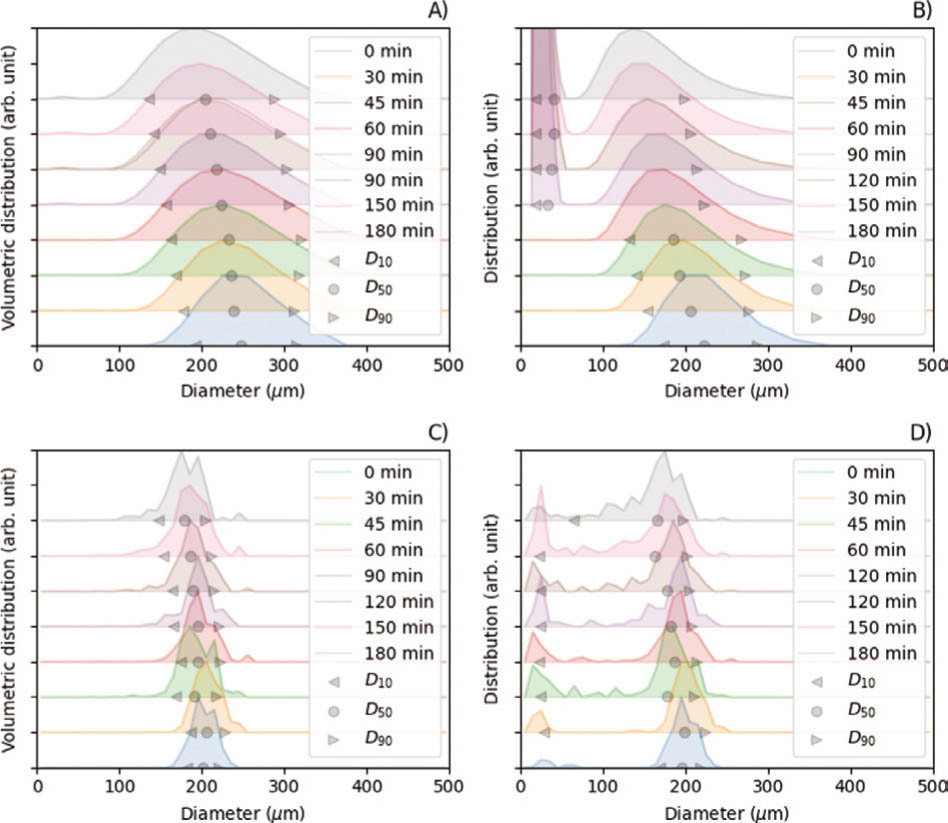
Fig. 4
Laser volumetric grain size distributions (A) and grain size distributions (B). Microscope IA with volumetric grain size distributions (C) and grain size distributions (D). IA, Image analysis.
To assess how grains are etched, we roughly estimate etching depths as 0.5ΔD(t) where
where DX(t = 0 min) and DX(t) are cumulative distributions and where the subscripted X describes the weighting, measurement system and intercept point as a function of etching time t.Particle size Analysis with Microscope Image Analysis
To obtain insights and statistically relevant data on how grains are etched during HF treatment, a Delta Optical microscope was used to obtain digital images. Before each measurement, the microscope used was calibrated using Lacey Carbon Coated 200 Mesh Copper Grids (from SPI Supplies, USA). This allowed us to convert the lengths in pixels to micrometers and obtain data for further analysis. Images with grains of sand were placed on a black background. We placed as many grains as possible without creating clusters. In other words, the grains did not overlap. Typical images are shown below in Fig. 2.
The IA program was created in Python based on an OpenCV (Bradski, 2000) image processing library and according to the code provided by Bhattiprolu (2020). The software algorithm applies a binary threshold, removes noises and detects contours. Next, the software detects and removes grains that overlap each other and grains that are on the border of the image. The typical image passed through this process is shown in Fig. 3. The successfully recognised grains are marked with red rectangles.
Finally, the algorithm determines the projected area, major, minor axes, perimeter and effective diameter estimated from this area. To obtain statistically significant data on average, each measurement was obtained from ca. 50 images of different grains. We assume that volume (V) and area (A) are related i.e. V∼A3/2 (Califice et al., 2013; Zheng et al., 2019). However, this might introduce bias, as we do not have ways to assess the third dimension precisely.
Analogically to LD measurements, we calculate values for microscope IA. DV, IA, 10, DV, IA, 50 and DV, IA, 90 values correspond to diameters which, respectively, intercept for 10%, 50% and 90% of the cumulative volume. To assess the volume, we used the effective diameter which was assessed from the measured projected area of each grain. The DN, IA, 10, DN, IA, 50 and DN, IA, 90 correspond to diameters which, respectively, intercept 10%, 50% and 90% of the cumulative distribution with respect to the detected number of particles. Etching depth proxy i.e. ΔD/2 is estimated as a change of values given above using Eq. (2).
Due to instrumental limitations, the microscope IA set in this experiment is sensitive down to ca. 20 μm grains.
Results and Discussion
The three methods which were used to assess the effect of different durations of HF etching on the size and shape of quartz grains measure different physical properties (Li et al., 2005; Doan et al., 2012; Califice et al., 2013).
In microscope IA, to estimate the volume, we use the area, and this area is used to assess volumetric distributions. In Fig. 4A, C, we plot laser volume grain size distributions for LD and microscope IA, respectively. The LD distributions are shifted towards larger estimated diameters. It is caused by the inherent effect of different measurement methods (Li et al., 2005), as we are dealing with purified and non-regular quartz grains. Considering the fact that our material was selected using 180–200 μm sieves, IA data shows very good agreement with the sieves despite the fact that we deal with non-spherical grains. Moreover, with increased etching duration, distribution widths from LD and microscope IA also increase (Fig. 4A, C). It means that the etching rate is not the same for all grains.
When we use distributions based on the number of grains, we see that the etching process is even more complex (Fig. 4B, D). During etching, we start to detect new small particles below 100 μm. It is visible in both IA and, to a lesser degree, in LD. We expect that, because of negligible volume, new small particles will have negligible effect on the luminescence, but they will distort etch rates values assessed from mass loss estimates. Five such small particles are captured in images Figs. 2B, C and 3B, C.
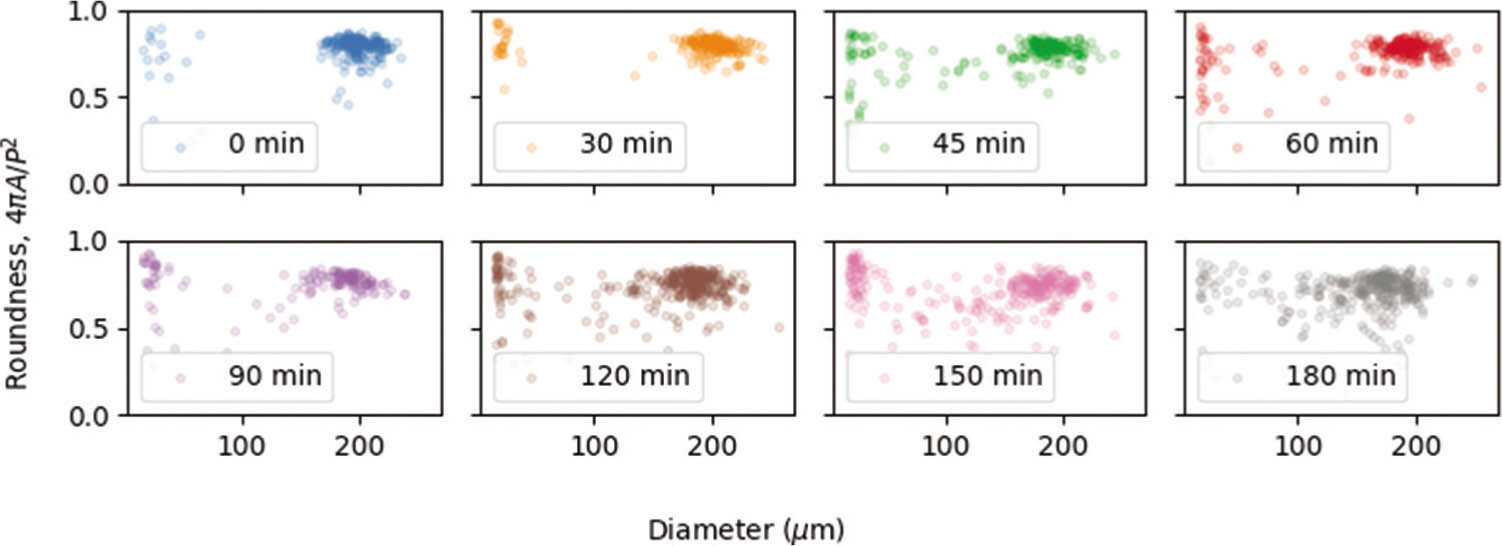
In Fig. 5 we plot the roundness (Cox, 1927) of volume weighted distributions obtained from microscope IA, which is defined as 4πA/P2, where A is the area and P is the perimeter of a given grain. This parameter for perfect circles corresponds to 1, and it decreases when the grains become less spherical. We can see (Fig. 5) that the roundness decreases for longer etching times. It means that the etching process is not uniform even for individual grains. The same result can be deduced from Fig. 4A, C, where, for volumetric distributions, the span between D10 and D90 increases with etching time. In Fig. 6, each point corresponds to a single detected particle with the equivalent diameter and roundness plotted on the x and y axes, respectively. For 0 min etch time (Fig. 6), neither sieving separates all grains, or some grains are mechanically cracked. For longer etching times (Fig. 6), we can see that the equivalent diameter decreases, but what is more interesting is that the roundness also decreases. It means that the grains are becoming less and less spherical. Moreover, for longer etching times (Fig. 6), we can see that there are new small quartz particles created by fracturing larger grains.
Fig. 5
Roundness distribution of quartz grains etched with 40% HF acid for microscope IA. Roundness is defined as 4πA/P2, where A is the area and P is the perimeter. IA, Image analysis..
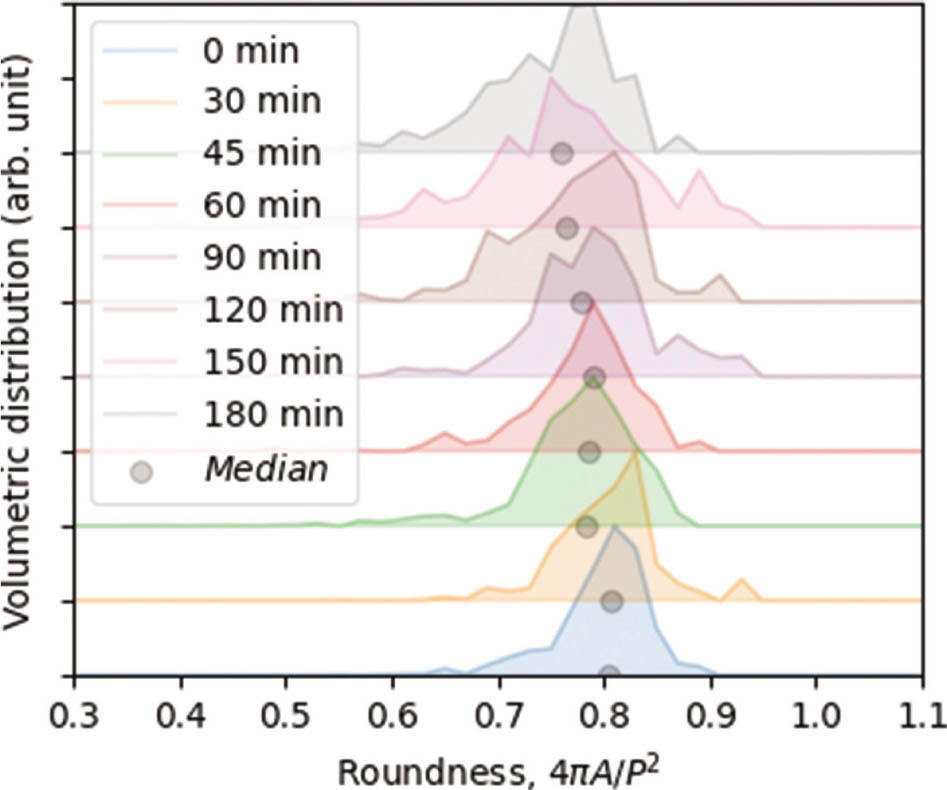
Fig. 6
Roundness and equivalent diameter of quartz grains etched with 40% HF acid for microscope IA. Roundness is defined as 4πA/P2, where A is the area and P is the perimeter. IA, Image analysis.
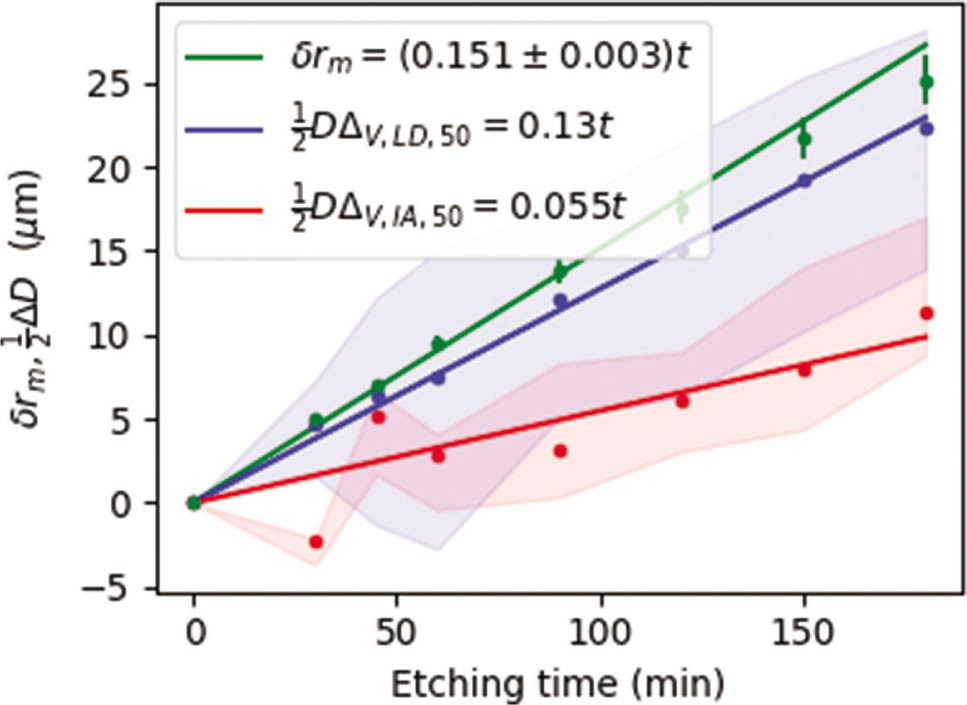
To assess the thickness removed, we used mass loss data (Table 1) and Eq. (1). Obviously, Eq. (1), which assumes spherical shape, uniform etching and constant number of grains, will be only an approximation. We compare it with values obtained from volumetric distributions of D10, D50 and D90 parameters with respect to 0 min etching time. To estimate the etching depths, we use 0.5ΔD(t), which will give us plausible ranges for this parameter. This range also may be used to obtain a rough estimate of what uncertainty might be set when assessing dose rate in programs such as DRAC (Durcan et al., 2015) or μRate (Tudyka et al., 2021).
The slopes plotted in Fig. 7 correspond to a decrease of the quartz radius of ca. 0.151 ± 0.003 μm · min−1, for mass loss estimates. In case of LD, etch depth estimation from 0.5ΔDV, IA, 10, 0.5ΔDV, IA, 50 and 0.5ΔDV, IA, 90 give 0.18 μm · min−1, 0.13 μm · min−1 and 0.06 μm · min−1 values, respectively. Microscope IA etch depth estimation from 0.5ΔDV, IA, 10, 0.5ΔDV, IA, 50 and 0.5ΔDV, IA, 90 give 0.09 μm · min−1, 0.5 μm · min−1 and 0.03 μm · min−1 values, respectively.
Fig. 7
Mass etching depth (δrm) vs. etching time (t) assessed from mass loss calculations. LD 1/2ΔDV, LD, 50 and microscope IA 1/2ΔDV, LD, 50 equivalent radius changes. Light blue and red areas correspond to LD 1/2ΔDV, LD, 10 – 1/2ΔDV, LD, 90 and microscope IA 1/2ΔD, IA, 10 – 1/2ΔDV, IA, 90 ranges. LD, Laser diffraction.
The depth estimates from mass loss estimates and from LD might be overestimated because roundness decreases during etching (Fig. 5), or in other words, LD will be affected by two factors: firstly, grains are getting smaller; and secondly, less round (Li et al., 2005). It does not seem possible for LD to assess both parameters in a straightforward manner. This is supported by our statistical data, as well as in the Figs. 2Cand 3C that after 180 min of HF 40% etching some grains changed their size very little and other grains became small and/or irregular. This effect cannot be assessed from mass loss or from LD data. The nonuniformity of grains increases with etching time (Figs. 4 and 5).
Conclusions
The results of our research show that the estimated etch depth from mass loss is in agreement with earlier work (Leko and Komarova, 1973; Porat et al., 2015; Duval et al., 2018).
The estimated etching rates for the mass loss estimates correspond to 0.151 ± 0.003 μm · min−1. In case of LD, etch depth estimation from 0.5ΔDV, IA, 10, 0.5ΔDV, IA, 50 and 0.5ΔDV, IA, 90 give 0.17 μm · min−1, 0.13 μm · min−1 and 0.06 μm · min−1 values, respectively. IA etch depth estimation from 0.5ΔDV, IA, 10, 0.5ΔDV, IA, 50 and 0.5ΔDV, IA, 90 gives 0.09 μm · min−1, 0.05 μm · min−1 and 0.03 μm · min−1 values, respectively. The ranges provided by microscope IA might be considered for estimating the values and the uncertainty for the calculation of the dose rate in TCD.
Microscope IA and LD grain size distributions (Fig. 4B, D) reveal an increase of smaller grains that are constantly created by cracking larger grains during HF etching.
The increasing span of the volumetric distributions assessed with LD (Fig. 4A) and microscope IA (Fig. 4C) indicates that each grain has a different etch depth rate. This would not be detectable with mass loss estimates. In addition, the etch depth from the mass loss does not account for grain cracking and assumes that the roundness of the grain does not change. Therefore, the etch depth assessed with mass loss estimates could produce overestimated results.
Although microscope IA has its own limitations, which are caused by providing 2D projections of 3D grains, the results of the present study demonstrate that the etch depth assessed from mass loss and LD might be overestimated. Statistical data from microscope IA also revealed that etching decreases roundness with time (Fig. 5). We also report cracking of quartz grains while etching.