


1. Introduction
Population ageing is one of the major challenges faced by the society of most developed countries. As longevity improves, pathologies and dependence that appear at higher ages put a strain on the old-age care systems, their organisation, and financial planning (Hirsch, Reference Hirsch2005; Okma & Gusmano, Reference Okma and Gusmano2020; Waitzberg et al., Reference Waitzberg, Schmidt, Blümel, Penneau, Farmakas, Ljungvall, Barbabella, Augusto, Marchildon, Saunes, Vočanec, Miloš, Contel, Murauskiene, Kroneman, Tambor, Hroboň, Wittenberg, Allin and Or2020). At higher ages, it is common that elderly individuals present difficulties in performing activities that are part of their daily lives (see, e.g. Fuino & Wagner, Reference Fuino and Wagner2018; Vanella et al., Reference Vanella, Heß and Wilke2020). In that sense, care delivered to maintain functional abilities is identified under the name of old-age long-term care (LTC). In most developed countries, the provision of care to elderly people and its financing are issues present in social policy discussions (Karlsson et al., Reference Karlsson, Mayhew, Plumb and Rickayzen2006; Le Corre, Reference Le Corre2012; Duell et al., Reference Duell, Lindeboom, Koolman and Portrait2019). Many studies have evidenced problems related to handling LTC needs (see, e.g. Pang & Warshawsky, Reference Pang and Warshawsky2010; Shao et al., Reference Shao, Hanewald and Sherris2015, Reference Shao, Chen and Sherris2019). As critical points, they specify that current schemes will soon face a lack of financing (Kitchener et al., Reference Kitchener, Ng, Miller and Harrington2006; Brown & Finkelstein, Reference Brown and Finkelstein2009) in available care infrastructure (Katz, Reference Katz2011; Cosandey, Reference Cosandey2016) and in professional caregivers (Nichols et al., Reference Nichols, Davis and Richardson2010; Colombo et al., Reference Colombo, Llena-Nozal, Mercier and Tjadens2011). This stresses the relevance of proper planning and integrates the societal and political evolutions of the scope of handling LTC, both in institutions and at home. Therefore, the emergence of high demand for LTC requires evaluating the capacity of the infrastructure, in particular, the availability of beds and the number of qualified caregivers in specialised institutions. The total care needs set the target for the governments that are ultimately responsible for providing elderly individuals with decent care. Defining an appropriate monitoring for determining the amount of care required is fundamental. The estimation of the overall amount of care also is crucial to secure the financing of care, a concern that involves the government, the insurers, and elderly individuals themselves.
In this paper, we study the factors that drive the total care burden of institutionalised elderly individuals. We express the overall burden in terms of the number of hours of care received while living in an institution. We call the severity of care the total number of hours. It can be modelled by multiplying the duration of stay, that is, the time spent in dependence in an institution, with the intensity of care, that is, the amount of help, expressed in time units, received per period. The duration of stay indicates the occupancy period of a bed in an LTC institution, while the intensity of care is associated with utilisation of medical and care resources, in particular, the number of minutes of help from nurses. We study both components and investigate the determinants that explain the duration and intensity. Building on longitudinal data, we first derive a model to estimate the number of months that elderly individuals stay in an institution. A second model evaluates the number of minutes of care that persons receive each week along the most influential covariates. Combining both peices of information, we evaluate the overall care severity per elderly individual for different profiles.
The overall burden or severity of LTC can be determined in several ways. On the one hand, the overall institutions’ costs stem from the duration in dependence. In fact, factors including the health state, socio-demographic characteristics, and physical and psychological impairments determine the time spent in institutional care (see, e.g. Hedinger et al., Reference Hedinger, Hämmig and Bopp2015; Moore et al., Reference Moore, Keegan, Dunleavy and Froggatt2019). Moreover, different family situations affect the duration of stay in the institution, as well as the amount of care provided; see, for example, Pinquart & Sörensen (Reference Pinquart and Sörensen2011) and Mommaerts (Reference Mommaerts2020). Mortality is another cause that shortens the duration. For example, patients with schizophrenia, mental disorders, tumours, and cognitive impairments suffer from higher mortality rates; see Campbell et al. (Reference Campbell, Diep, Reinken and McCosh1985), Davidson et al. (Reference Davidson, Dewey and Copeland1988) and Pack (Reference Pack2009). On the other hand, measuring the LTC severity also requires a metric for the intensity of care delivered by professionals (Carrino et al., Reference Carrino, Orso and Pasini2018). Indeed, cost analysis highlights that most expenses are devoted to the time that caregivers have to spend on each resident (Hu, Reference Hu1986; Dorr et al., Reference Dorr, Horn and Smout2005) to such an extent that, within OECD countries (i.e., member countries of the Organisation for Economic Co-operation and Development), patient profiles are defined in relation to the minutes of care required (Muir, Reference Muir2017). From a medical perspective, doctors evaluate LTC severity based on medical metrics such as the level of functional limitations and cognitive troubles. Many researchers state that mental and physical diseases can affect functional abilities and therefore entail LTC needs (Anderson et al., Reference Anderson, Anthony, Zhang, Wilson, Kelly-hayes, Wolf, Kreger and Kannel1993; Guibert & Planchet, Reference Guibert and Planchet2018; Fuino & Wagner, Reference Fuino and Wagner2020). In this context, the most well-documented pathologies regarding LTC dependence are dementia and Alzheimer’s (Arrighi et al., Reference Arrighi, McLaughlin and Leibman2010; Koroukian et al., Reference Koroukian, Schiltz, Warner, Sun, Bakaki, Smyth, Stange and Given2016; Farias et al., Reference Farias, Lau, Harvey, Denny, Barba and Mefford2017), heart failure, and high blood pressure (Kuo et al., Reference Kuo, Jones, Milberg, Tennstedt, Talbot, Morris and Lipsitz2005; Sinclair et al., Reference Sinclair, Conroy and Bayer2008; Lesman-Leegte et al., Reference Lesman-Leegte, Jaarsma, Coyne, Hillege, Van Veldhuisen and Sanderman2009), and to some extent cancer (Goodwin, Reference Goodwin1991; Avis & Deimling, Reference Avis and Deimling2008; Chavan et al., Reference Chavan, Kedia and Yu2017). Therefore, individuals’ pathology profiles affect the severity of the dependence and lead to diverse health outcomes and mortality patterns (Tomas & Planchet, Reference Tomas and Planchet2013; Albarrán et al., Reference Albarrán, Alonso-González, Arribas-Gil and Grané2019; Jennings et al., Reference Jennings, Hollands, Keeler, Wenger and Reuben2020). Finally, from a patient perspective, becoming care dependent means a change in lifestyle that is difficult to accept. When moving into an institutional setup, lifestyle habits are drastically altered, and elderly individuals feel a loss of intimacy (Hyer et al., Reference Hyer, Carpenter, Bishmann and Wu2005). This is reflected in practice by the higher prevalence of depression syndromes among institutionalised elderly individuals (Boyle, Reference Boyle2005; Thakur & Blazer, Reference Thakur and Blazer2008).
Our study is based on a longitudinal data set covering the whole institutionalised population of the Geneva canton in Switzerland over a 22-year period, from 1996 to 2018. We build our analysis on the records of 21,758 individuals filled out using the Canadian monitoring method “PLAISIR”. The method records a person’s pathologies, physical limitations, psychological and sensory impairments, the amount of care provided, and further personal information such as gender, date of birth, and date of death. Accounting for the right-censored nature of the data, we model the duration in institutional care using the survival approach, namely, an accelerated failure time (AFT) model with Weibull distribution, while the intensity of care is modelled using a beta regression.
We find that, after age and gender, the pathologies are the key drivers of the duration of stay. However, despite significantly affecting the intensity of care, diseases do not affect the amount of care provided to elderly individuals as much as dependence-related limitations and physical and psychological impairments. The latter two are the key indicators to describe the intensity of care required by an elderly individual. In contrast, physical limitations are less relevant in describing the duration of stay in dependence. Introducing profiles that relate to different types of health conditions, we find that, in general, women come with the highest total care burden. Furthermore, we show that mental and osteoarticular diseases lead to the highest overall care severity, a finding that results from the higher duration of stay. In contrast, elderly individuals with tumours have the lowest overall care burden, which can be explained by the higher mortality rate, and thus a lower expected duration of stay. Finally, given that the variations in care intensity are relatively small in our data, we find that the overall care severity is mainly shaped by the duration of stay.
The remainder of this paper is organised as follows. In Section 2, we lay out the research framework: we review the financing and monitoring of LTC costs in Switzerland and discuss the literature on the variables associated with care duration and intensity. In Section 3, we introduce the available data set, describe the variables, and present descriptive statistics. In Section 4, we introduce the model framework, including the AFT model that lays the basis for the duration analysis and the beta regression model used for the study of the intensity of care. We present and discuss the model results in Section 5. For selected profiles of elderly individuals, we evaluate how certain variables affect the overall care severity of an institutionalised elderly individuals. We conclude the paper in Section 6.
2. Research Framework
Our objective is to model the total care burden in terms of the total number of hours of care an institutionalised elderly individual receives. Therefore, our model relies on the time spent in dependence, the amount of help received, and their respective determinants. On the one hand, the duration of stay defines the time of occupancy of a bed in an LTC institution. The contributions of the government directly relate to it, disregarding the specific pathology. On the other hand, the intensity of care relates to the usage of labour from nurses. It strongly depends on the medical condition of elderly individuals. Payments of health insurance are typically associated with the required number of minutes of care. Since our study uses data from Switzerland, we lay out the costs and the financing of the Swiss care system for elderly dependents in this section. Indeed, the costs are directly linked to the duration of stay and the intensity of care. In Section 2.1, we describe the organisation and cost monitoring of LTC institutions. In Section 2.2, we review the literature on the drivers influencing the care burden.
2.1 Financing and monitoring of LTC costs in Switzerland
Switzerland is a federal state consisting of 26 cantons distributed among the German, French, and Italian linguistic regions. Rules for the care of elderly individuals and its financing are defined at both the federal and cantonal levels. The federal base framework is tailored along cantonal rules accounting for specific situations. In its broadest definition, LTC denotes care delivered to elderly individuals having difficulties performing daily life activities, often identified through the number of limitations in “activities of daily living” (ADL) and “instrumental activities of daily living” (IADL, see, e.g. Kempen et al., Reference Kempen, Myers and Powell1995). While this definition, at least in theory, appears valid in most developed countries (see, e.g. Fuino et al., Reference Fuino, Rudnytskyi and Wagner2020), getting an appropriate definition of LTC in practice is more controversial, in particular, when such a definition influences political and budget decisions and ultimately the amount of care provided and financed by insurers. While in countries such as the US, more than ten LTC systems are listed (Seematter-Bagnoud et al., Reference Seematter-Bagnoud, Fustinoni, Meylan, Monod, Junod, Büla and Santos-Eggimann2012), LTC in Switzerland is either provided at home or in an institution. Furthermore, we observe three categories of curative LTC treatments: nursing, personal hygiene, and ergotherapy (Home Care Association of the Canton of Vaud, 2020). While the first two categories relate to the ability to perform (I)ADL, the third category emphasises the importance of social aspects beyond the ability to perform specific activities.
The financing of LTC relies on social health insurance, the state government, and out-of-pocket payments by the dependent elderly individual. Swiss mandatory health insurance covers all costs defined by the health care benefits ordinance (Swiss Federal Department of Home Affairs, 2021). The contribution to the care costs is defined on a scale along the required number of minutes of careFootnote 1. The state government also participates in funding LTC costs. All Swiss residents aged 65+ years in need of LTC are eligible to receive an allowance regulated under the old-age and survivor’s insurance lawFootnote 2. The pre-defined amount increases with the acuity level. The state government also indirectly participates in the financing of institutional care, for example, by constructing new infrastructure and providing further means-tested allowances for those who cannot afford the costs. Finally, households are responsible for a set of non-covered care mostly related to accommodation expenses (lodging, feeding, and laundry) in institutional care. Furthermore, since 2011 and to limit the increase in health insurance premiums, copayments of up to 20% of the costs are required from residents (Swiss Federal Social Insurance Office, 2010). In 2016, the overall monthly cost of a stay in a Swiss institution is estimated to be CHF 9,652 (Social Insurance and Accommodation Service of the Canton of Vaud, 2016).
The development of the elderly population in recent decades has increased LTC costs. Against this background, it is essential to assess the overall dynamic to predict the needs of nursing homes and qualified personnel in the future. Based on the findings from Donabedian (Reference Donabedian1973), an appropriate monitoring method for nursing homes accounts for three dimensions, namely, the patient health condition, the type of service required, and the resources needed (Roussel & Tilquin, Reference Roussel and Tilquin1993). Under these conditions, two types of monitoring have been implemented in Switzerland since the 1990s. The cantons of Vaud, Geneva, Neuchâtel, and Jura have implemented the Canadian monitoring method “PLAISIR”, which stands for Planification Informatisée des Soins Infirmiers Requis Footnote 3, while the other cantons have implemented the American “Resource Utilization Groups” monitoring methodFootnote 4. Even though significant differences appear in how data are gathered, the results of both methods remain comparable and allow the development of care plans based on estimates of the needs for nursing care and assistance. Indeed, the classifications are articulated around the patient health conditions, the type of care service required and the staff resources needed. Finally, we note that an assessment of the costs of care includes knowledge about the duration of stay and the intensity of care provided.
2.2 Review of the determinants of the duration of stay and intensity of care
In our modelling, we separately assess the time spent in dependence and the amount of help received per period. Both dimensions can be investigated through demographic variables and linked to medical diagnoses, the inability to perform (I)ADLs, limitations in physical and cognitive activities, and impairments of psychological and sensory functions. In the following, we discuss a selection of relevant variables outlined in the extant literature.
A vast amount of literature agrees that age and gender are both relevant determinants of the duration in dependency (see Mathers, Reference Mathers1996; Germain et al., Reference Germain, Vasquez, Batsis and McQuoid2016; Fong et al., Reference Fong, Sherris and Yap2017; Fuino & Wagner, Reference Fuino and Wagner2020) and the intensity of care (see, e.g. de Meijer et al., Reference de Meijer, Koopmanschap, d’ Uva and van Doorslaer2011; Xue, Reference Xue2011). For example, elderly individuals at high ages are more susceptible to developing multiple types of diseases (van den Akker et al., Reference van den Akker, Buntinx, Metsemakers, Roos and Knottnerus1998) that lead to higher mortality rates (Menotti et al., Reference Menotti, Mulder, Nissinen, Giampaoli, Feskens and Kromhout2001) and reduce the duration of stay in an institution. At the same time, Deeg et al. (Reference Deeg, Portrait and Lindeboom2002) find that women have a higher life expectancy than men, regardless of the multimorbidity profile. Moreover, Rickayzen & Walsh (Reference Rickayzen and Walsh2002) observe that women are more likely than men to develop a higher dependency from external help across all ages and thus require a higher intensity of care.
The World Health Organization (1980) and the Institute of Medicine (1991) introduce the relationships among pathologies, impairments of organ systems, and the resulting limitations or disabilities. In general, a disease causes certain organ malfunctions that result in a loss or abnormality of mental, emotional, or physiological structures. Furthermore, these impairments lead to functional limitations, that is, lack of ability to perform an action or activity in a manner considered normal, and overall disability, that is, limitation in performing socially defined activities and roles. As a consequence, different pathologies affect both mortality and the dependence, directly affecting the duration of stay, and the intensity of care, respectively. Furthermore, the influence of pathologies on LTC needs is widely studied by, for example Boult et al. (Reference Boult, Kane, Louis, Boult and McCaffrey1994), Guccione et al. (Reference Guccione, Felson, Anderson, Anthony, Zhang, Wilson, Kelly-Hayes, Wolf, Kreger and Kannel1994), Tomiak et al. (Reference Tomiak, Berthelot, Guimond and Mustard2000), Pritchard (Reference Pritchard2006), Callahan et al. (Reference Callahan, Arling, Tu, Rosenman, Counsell, Stump and Hendrie2012), Biessy (Reference Biessy2017) and Rudnytskyi & Wagner (Reference Rudnytskyi and Wagner2019). Finally, research suggests accounting for the number of diseases, that is, multimorbidity (Marengoni et al., Reference Marengoni, Angleman, Melis, Mangialasche, Karp, Garmen, Meinow and Fratiglioni2011; Barnett et al., Reference Barnett, Mercer, Norbury, Watt, Wyke and Guthrie2012).
Geriatric syndromes are conditions commonly experienced by older individuals (see Inouye et al., Reference Inouye, Studenski, Tinetti and Kuchel2007), including visual and hearing impairments, depressive symptoms, low cognitive performance, persistent dizziness, or lightheadedness. Branch & Jette (Reference Branch and Jette1982) show that similar impairments do not significantly influence the decision to enter a nursing home. However, Koroukian et al. (Reference Koroukian, Schiltz, Warner, Sun, Bakaki, Smyth, Stange and Given2016) find that, when explaining the health status of a person, accounting for the co-occurrence of functional limitations and geriatric syndromes is more informative than considering chronic conditions alone. This means that impairments in psychological and sensory functions should add to the explanation of the duration of stay and the intensity of care. Further works on the influence of impairments, limitations, and disabilities and LTC needs are those of Branch & Jette (Reference Branch and Jette1982), Miller & Weissert (Reference Miller and Weissert2000), Tomiak et al. (Reference Tomiak, Berthelot, Guimond and Mustard2000), Rickayzen & Walsh (Reference Rickayzen and Walsh2002), and de Meijer et al. (Reference de Meijer, Koopmanschap, d’ Uva and van Doorslaer2011).
3. Data on Institutional LTC and Descriptive Statistics
In the following, we describe the data used in our study. In Section 3.1, we provide information on the available data and define the variables used in the analysis. In Section 3.2, we report descriptive statistics on the duration of stay in LTC and care intensity. Exploratory data analysis allows us to substantiate the choice of the methodological approach for modelling.
3.1 Available data and description of variables
Our study is based on a private data set containing observations on elderly individuals who have received institutional care in the canton of Geneva in Switzerland during the period from 1996 to 2018. The anonymous individual data stem from the evaluation tool used to assess the care needs (Republic and Canton of Geneva, General Directorate for Health, 2019). The data contain information on individuals, their medical diagnoses and comprehensive details on their limitations and impairments. Furthermore, it provides information on the date of entry into the care institution, the number of minutes of help provided each week and, if applicable, the date of death. For this study, we retain a set characterising 21,758 individuals, focusing on elderly individuals aged 65 years or olderFootnote 5. After entering an institution, every person passes an initial medical screening. Various tests examine the overall state of health, pathologies, and physical and mental health disorders. During an observation period, the intensity of care required by the person and expressed as the number of minutes of care per week is recorded. While such tests are typically repeated approximately every 1–2 years, we focus on the first evaluation made at entry. Of the available information (for the data collection methodology, see Roussel & Tilquin, Reference Roussel and Tilquin1993), and following the literature review in Section 2.2, we consider 19 key variables that characterise each record in our data (see Table 1).
Table 1. Description of the variables.

Duration and intensity of care. The original data contain the date of admission in the institution and the date of death if applicable. If the person died before the end of the observation period, the difference between the date of death and the date of entry allowed us to calculate the duration of stay D in monthsFootnote 6. If the date of death was empty, the person was still alive at the date of data extraction. In this case, we calculate the duration D as the difference between the date of entry and the latest date available in the data set, which is August 21st, 2018. Additionally, we create a separate indicator variable C telling us if the person is alive or dead, that is, indicating if the data are right-censored or not.
The intensity of care is recorded as the total number of minutes of care T provided to the person per week, that is, a number between 0 and 10,080, where the upper bound corresponds to the total number of minutes in 1 week. This number includes the time of care given for respiratory help (respiratory exercises, chest physical therapy), eating and drinking (providing vitamins, verifying the diet), elimination (giving, removing, and emptying urinal, maintaining hygiene and skin integrity), hygiene (personal, hair, and beauty care), mobility (pushing wheelchair, getting up, or lying down), communication (supportive communication, teaching, group activities), medication needs, intravenous therapy, and other treatments (dressing wounds, blood pressure). The full list and descriptions are available from Roussel & Tilquin (Reference Roussel and Tilquin1993).
Demographic variables. Using the date of birth and the date of admission, we calculate the age at entry into institution AG by taking the number of full years that have passed since birth until entry. In our data, the youngest age at entry is 65 years, while the oldest person has entered institutional care at the age of 106. Furthermore, information on the gender GE of the individual is available in the data. It is recorded as a binary factor with levels “male” and “female”.
Medical diagnoses. Each observation carries information about the person’s disorders. Individuals may have received several medical diagnoses and up to nine are recorded in the data. They are ranked by importance by a doctor. We label the most important (“first”) diagnosis as D1 and explicitly consider one secondary diagnosis D2. The variable ND indicates the number of additional diagnoses beyond the first two. D1 and D2, with ND, allow us to account for the top two medical conditions and possible interactions, as well as to have information on the number of additional health problems that relate to the overall severity.
Diagnoses are encoded using the International Classification of DiseasesFootnote 7. We reduce the number of unique diagnoses by aggregating the diseases into six groups, namely, mental, cerebrovascular, nervous, osteoarticular, heart, and tumour diseases. All other diagnoses are grouped in a category labelled “other”Footnote 8. The main diagnosis D1 is a factor variable with seven levels. The secondary diagnosis D2 is a factor variable with eight levels since we include the possibility of no second diagnosis labelled “none”. Note that the same disease group may appear several times, for example, when a person has several disorders from the same disease group.
Level of dependence. The level of dependence is measured along five dimensions: limitations with ADL, physical mobility, orientation, occupation, and social integration. As with the World Health Organization (1980), the recorded limitations are measured on ordered nine-level scales, where each level corresponds to a particular severity. In Table 2, we describe the limitations for the different levels in each dimension (see also Roussel & Tilquin, Reference Roussel and Tilquin1993). Since individuals entering institutional care are mostly moderately or severely dependent, we observe very few records showing lower levels of dependence. Therefore, we aggregate the levels so that they constitute a share of at least approximately 10%–15% of the data (see Table 1 and the descriptive statistics in Section 3.2). This allows for a lower number of categories in the further modelling. For example, for the social integration limitations variable SI, we consolidate the levels from 1 to 4 into “1–4”, yielding 8.9% of the individuals.
Table 2. Measurement of the level of dependence.

First, the level of dependence in ADL (DP) considers the physical dependence in performing ADL. It refers to the individual’s ability to complete, independently, the basic ADL (e.g., personal hygiene, eating, dressing) and the IADL (e.g. housekeeping, cooking). The assessment of a person’s abilities does not consider the institutional environment, that is, it compares the individual’s potential to perform (I)ADL to a usual healthy person of the same age and gender. Next, the variable PM measures the limitations of physical mobility, that is, the ability to move effectively in the surroundings. The evaluation considers the independent use of mechanical aids (e.g., prosthesis, wheelchair, cane) but not the aid given by other persons. The principal indicator is the distance to which the person can move away from the bed or the chair. The capacity for orientation and interactions with the environment is coded in the variable OR. This concept includes the reception of signals from the environment, their assimilation and the formulation of a response. Living and occupations throughout the day are assessed through the limitations in time and type in OC. This concept refers to the person’s ability to occupy the time in a manner customary for the age and gender group within the institutional environment. Here, all activities related to employment, recreation, education, creation, and customary everyday tasks are included. The difference between the levels “no occupation” and “inappropriate occupations” stems from the ability to perform activities where the first refers to persons who are incapable of sustaining any form of activities, while the second refers to those who do activities without a defined goal. Finally, the social relations and their limitations are recorded in SI. This concept refers to the person’s ability to participate in social activities and maintain adequate social relations, considering life in an institutional setting.
Impairments of psychological and sensory functions. Roussel & Tilquin (Reference Roussel and Tilquin1993) propose an ordered four-level scale, with the levels adequate, mild, moderate, and severe, to measure the severity of 16 psychological and sensory function impairmentsFootnote 9. The evaluation considers any compensation used by the person (glasses, medication that corrects psychological impairments) and compares his or her performance to the average performance of a healthy individual of the same age and gender. For certain functions such as recent memory or sight, it is possible to describe precise definitions for the four levels. For other functions, the person’s state is assessed more qualitatively.
The impairments are closely related to the above-discussed medical diagnoses and levels of dependence. In the forthcoming models, we reduce complexity and keep only those impairments that help explain institutional LTC. Following our model selection (see Section 5), we retain six of the 16 impairments available in the data: Limitations in the recent or short-term memory RM refer to the individuals’ ability to store new information. The “adequate” level is assigned to those who have no memory problems, while “severe” refers to those who can name up to one of three objects mentioned or shown 5 minutes earlier. Perception and attention PA refers to the functions that allow an individual to receive information, process it, and concentrate on certain aspects. Impairments of perception include disturbances of the perception of one’s own body, time, place, hallucinations, and difficulties in differentiating fantasy from reality. Impairments of attention include inattentiveness, distractibility, and inability to change the focus of attention. Impairments in impulses or drives IM refers to the increase, decrease, and change of form of different behaviours related to basic physiological needs or instincts (e.g., anorexia, bulimia, dependence on alcohol, or tobacco). Will and motivation impairments WM refer to disturbances in the ability to orient one’s behaviour, control one’s actions, and pursue a goal. The evaluation considers, for example, a lack of initiative, overcompliance, excessive cooperation, and compulsion. Behavioural impairments BH refer to patterns of behaviour that interfere with social adjustment and functioning. These patterns may be present since adolescence and throughout adult life or may appear due to neurological or mental illness. They mainly manifest themselves as accentuated character traits (e.g. suspiciousness, excessive shyness, worrying, self-destruction, indecisiveness). Visual impairments VS refer to the person’s ability to see and are assessed considering corrected eyesight, for example, with eyeglasses. The “mild” level corresponds to a person who cannot read regular print but can read large prints. The “moderate” level person is unable to read but can follow an object with the eyes. Finally, the “severe” level relates to blindness.
3.2 Descriptive statistics
In the following, we present the descriptive statistics for the duration of stay D and the intensity of care T. Recall that the available data cover a fixed period that terminates at the date of data extraction. The data include
 $n=21,758$
persons who entered a care institution: 17,919 (82.4%) of them died in the observation period, while 3,839 (17.6%) were still alive at the time of data extraction. Due to this right censoring, we cannot directly calculate the mean duration of stay D, and thus, we use survival analysis techniques.
$n=21,758$
persons who entered a care institution: 17,919 (82.4%) of them died in the observation period, while 3,839 (17.6%) were still alive at the time of data extraction. Due to this right censoring, we cannot directly calculate the mean duration of stay D, and thus, we use survival analysis techniques.
The standard way to obtain median estimates of the duration of stay D is to apply the Kaplan–Meier product-limit estimator, a non-parametric estimator based on the survival curve proposed by Kaplan & Meier (Reference Kaplan and Meier1958). Indeed, the Kaplan–Meier estimate allows for right censoring and left truncation in seriatim data. To report the median duration of stay
 $D_\textrm{med}$
across multiple factors, we apply Kaplan–Meier estimates on subsets of the data. In Table 3, we present the median duration of stay
$D_\textrm{med}$
across multiple factors, we apply Kaplan–Meier estimates on subsets of the data. In Table 3, we present the median duration of stay
 $D_\textrm{med}$
and the mean intensity of care
$D_\textrm{med}$
and the mean intensity of care
 $T_\textrm{avg}$
for the different variables’ categoriesFootnote 10.
$T_\textrm{avg}$
for the different variables’ categoriesFootnote 10.
Table 3. Descriptive statistics on the median duration of stay
 $D_\textrm{med}$
(in months) and the mean intensity of care
$D_\textrm{med}$
(in months) and the mean intensity of care
 $T_\textrm{avg}$
(in minutes/week).
$T_\textrm{avg}$
(in minutes/week).

Demographic variables. We divide the age at entry AG into six classes to illustrate the underlying distribution. We observe that the Kaplan–Meier estimates of the median duration of stay
 $D_\textrm{med}$
are decreasing with the age at entry, which is due to increasing mortality rates at higher ages. At the same time, the mean intensity of care
$D_\textrm{med}$
are decreasing with the age at entry, which is due to increasing mortality rates at higher ages. At the same time, the mean intensity of care
 $T_\textrm{avg}$
provided to the person fluctuates around the same value of approximately 16 hours/week. In groups of persons aged 100 years or more at entry, the intensity of care increases to 20.5 hours/week.
$T_\textrm{avg}$
provided to the person fluctuates around the same value of approximately 16 hours/week. In groups of persons aged 100 years or more at entry, the intensity of care increases to 20.5 hours/week.
Most of the elderly individuals in our data are women. Men constitute just above a quarter (27.5%) of the data. We note that men stay dependent for a shorter amount of time than women, with their median duration being almost 15 months lower. Furthermore, men require on average 1.5 hours of care more per week. The prevalence and higher median duration of stay of women can be explained by their higher life expectancy; see, e.g., Mathers et al. (Reference Mathers, Vos, Stevenson and Begg2001), Fong et al. (Reference Fong, Sherris and Yap2017), Schünemann et al. (Reference Schünemann, Strulik and Trimborn2017), and Fuino & Wagner (Reference Fuino and Wagner2018).
Medical diagnoses. Mental diagnoses are those with the highest prevalence in persons entering institutional care. While they rank first in the main diagnosis D1, mental ranks second in the secondary diagnosis D2, after the group of other diagnoses. Pathologies of the nervous system and heart problems also show a high prevalence in both the main and secondary diagnoses. We observed similar values for the median duration of stay across the different main diagnoses, except for persons with osteoarticular problems and tumours. Indeed, osteoarticular pathologies are associated with higher median durations of stay by more than half a year (total 44.8 months), while half of the tumour patients die after 8.7 months. In contrast, only the groups with cerebrovascular and nervous pathologies increased the mean intensity of care. Those with heart diseases as the main diagnosis require the least amount of help during the week. It is remarkable that if a person has one sole diagnosis, that is, the secondary diagnosis D2 is “none”, the median duration of stay in the institution almost doubles, being slightly above 5 years (62.2 months).
Considering the main diagnosis D1, Figure 1 extends the results of the Kaplan–Meier estimates of the duration of stay D and of the intensity of care T distribution from the descriptive statistics in Table 3. From Figure 1(a), we see that the duration of stay D is drastically reduced by a tumour diagnosis, while osteoarticular pathologies come with higher survival rates. The kernel density estimation in Figure 1(b) sheds light on the influence of the main diagnosis on the intensity of careFootnote 11. Overall, we note that the distribution of T is bimodal, with peaks at approximately 450 minutes (7.5 hours) and 1,200 minutes (20 hours) of care per week. We see that the intensity of care in the nervous and cerebrovascular pathologies is left-skewed, which results in higher mean values. The other diagnoses yield distinct bimodal distributions, which raises the hypothesis that diagnoses, on their own, are insufficient to explain the intensity provided to a person.

Figure 1 Kaplan–Meier estimation of the duration of stay D (in months) and kernel density estimation of the intensity of care per week T (in minutes) across main diagnoses D1.
Most dependent persons have multiple diseases with several additional diagnoses ND, with the highest prevalence being found at three and seven additional diagnoses, respectively. The individuals who have seven additional diagnoses are characterised by the lowest median duration of stay (26.1 months) and the highest mean intensity of care (1,053 minutes/week). With an increasing number of additional diagnoses, the median duration of stay decreases and the mean intensity of care slightly increases.
Level of dependence. From Table 3, we see that all variables representing the dependence (i.e., dependence in ADL DP, physical mobility limitations PM, orientation problems OR, occupational limitations OC, social integration limitations SI) follow the intuition that the higher the dependence level is, the lower the median duration of stay and the higher the mean intensity of care are. All variables representing limitations affect the median duration of stay
 $D_\textrm{med}$
and the mean intensity of care
$D_\textrm{med}$
and the mean intensity of care
 $T_\textrm{avg}$
. The spread between the lowest and the highest levels is up to 3 years of stay (from 61.1 to 24.1 months in PM) and more than 20 hours of care per week (from 414 to 1,686 minutes in DP).
$T_\textrm{avg}$
. The spread between the lowest and the highest levels is up to 3 years of stay (from 61.1 to 24.1 months in PM) and more than 20 hours of care per week (from 414 to 1,686 minutes in DP).
In particular, we note that 35% of the institutionalised elderly individuals (Level 8 in dependence in ADL DP, see Table 2) require help for most of their daily needs, and 7.5% require constant aid from the personnel (Level 9 in DP). Almost a quarter of elderly individuals are restricted to a bed or chair in terms of mobility (Level 9 in PM), 10.1% are limited to their room (Level 8 in PM), while the rest can move around in the institution. For both dependence in ADL DP and physical mobility limitations PM, we see a clear distinction in the mean intensity of care between the different severity levels. Simultaneously, we observe 22.2% suffering from severe impairment of orientation or complete disorientation (Levels 7 and 8+ in orientation problems OR). Those individuals, on average, require a higher intensity of care, comparable to those who are highly dependent on ADL or highly limited in physical mobility. The most prevalent level of occupational limitations OC is 7, that is, occupations limited in time and type, supporting the decision to institutionalise for these elderly individuals. Furthermore, most of the persons socialise only with primary contacts (Level 6 of social integration limitations SI). Indeed, the prevalence of the isolated elderly individuals living in nursing homes is at least twice as high as that of the community-dwelling population (Victor, Reference Victor2012).
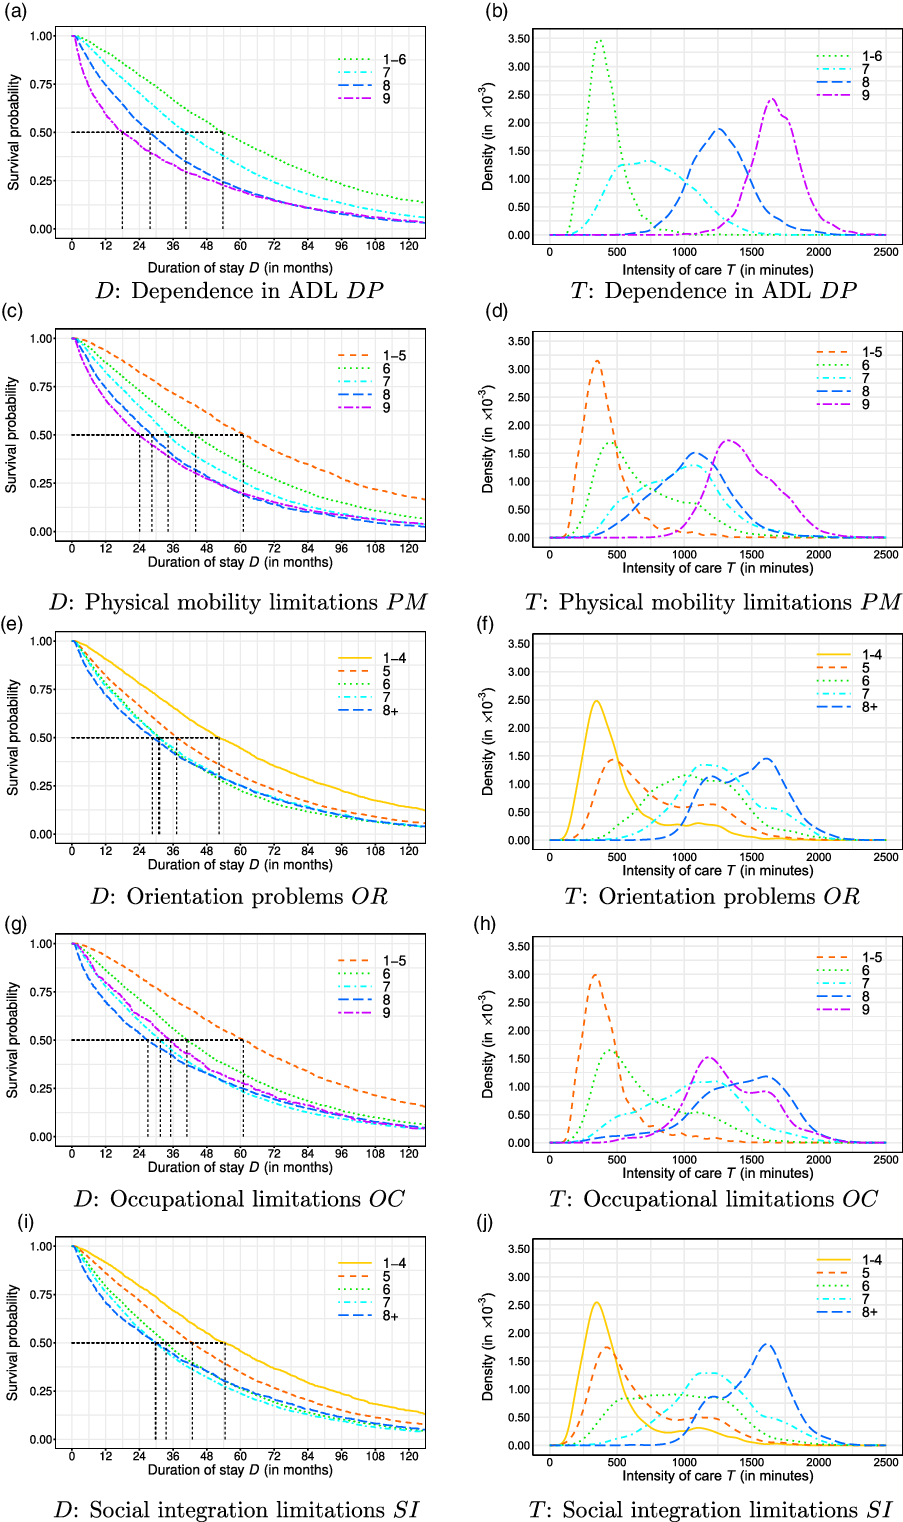
Figure 2 Kaplan–Meier estimation of the duration of stay D (in months) and density estimation of the intensity of care per week T (in minutes) across dependence factors.
We extend the results obtained in Table 3 by plotting the Kaplan–Meier and kernel density estimates for the dependent variables in Figure 2. The graphs demonstrate clear differences in the survival probability along D and in the density of T across different levels of dependence. While many curves can be well separated, the representing curves of some levels are intertwined, as with the intensity of care across levels of OC in Figure 2(h), or are close to each other, as with the curves representing the intensity of care in Levels 7 and 8 (floor and room limitations, respectively) of physical mobility PM.
Impairments of psychological and sensory functions. We observe a similar impact of the impairments (recent memory impairments RM, perception and attention impairments PA, impulse impairments IM, will and motivation impairments WM, behavioural impairments BH, visual impairments VS). As expected, we observe that when the level of psychological or sensory function impairment worsens, the median duration of stay
 $D_\textrm{med}$
decreases, and the mean intensity of care
$D_\textrm{med}$
decreases, and the mean intensity of care
 $T_\textrm{avg}$
increases. Regarding dependence, impairments importantly affect the median duration of stay
$T_\textrm{avg}$
increases. Regarding dependence, impairments importantly affect the median duration of stay
 $D_\textrm{med}$
and the mean intensity of care
$D_\textrm{med}$
and the mean intensity of care
 $T_\textrm{avg}$
, with spread of approximately two and a half years (from 59.4 to 30.2 months for RM) and approximately 18 hours or care per week (from 538 to 1,612 minutes in IM). For all variables, except visual impairments VS, the most prevalent level of psychological and sensory function impairments is the moderate level.
$T_\textrm{avg}$
, with spread of approximately two and a half years (from 59.4 to 30.2 months for RM) and approximately 18 hours or care per week (from 538 to 1,612 minutes in IM). For all variables, except visual impairments VS, the most prevalent level of psychological and sensory function impairments is the moderate level.
We present the Kaplan–Meier and density estimates of the duration of stay D and the intensity of care T, respectively, in Figures 3 and 4. The “adequate” level of all psychological and sensory impairments is associated with the highest survival probabilities, while the other levels intersect each other. At the same time, for all impairments, except VS, we note a good separation of the distribution of T across the levels. In Figure 4(f), we observe that all distributions of T for visual impairments VS are intertwined. Although the moderate and severe levels of visual impairments are left-skewed, there is no clear separation of the distributions such as, for instance, in Figure 4(c) for impulse impairments IM.

Figure 3 Kaplan–Meier estimation of the duration of stay D (in months) across psychological and sensory function impairments.

Figure 4 Density estimation of the intensity of care per week T (in minutes) across psychological and sensory function impairments.
4. Modelling Framework
Our objective is to fit an explanatory model to calculate the foreseeable need for LTC of a person who has just entered the institution. The overall care need or severity S corresponds to the total number of hours of care elderly individuals receive while sojourning in an institution. Thus, we quantify the overall care severity through the product
 $S = D \cdot T$
, where D stands for the duration of stay and T for the intensity of careFootnote 12. This decomposition allows us to separately investigate the time spent in the institution, that is, the period where a bed is occupied, and the amount of care received, that is, the usage of caregivers’ resources. Indeed, as discussed in Section 2, we expect to find different influencing factors for the two dimensions. The overall mean care severity is then given by
$S = D \cdot T$
, where D stands for the duration of stay and T for the intensity of careFootnote 12. This decomposition allows us to separately investigate the time spent in the institution, that is, the period where a bed is occupied, and the amount of care received, that is, the usage of caregivers’ resources. Indeed, as discussed in Section 2, we expect to find different influencing factors for the two dimensions. The overall mean care severity is then given by
 $\mathbb{E}[S] = \mathbb{E}[D \cdot T]$
. In our modelling, we consider the simplifying assumption that T and D are independent. Such an approach is commonly accepted, for example, in the practice of actuarial calculations in non-life insuranceFootnote 13. We approximate the mean care severity
$\mathbb{E}[S] = \mathbb{E}[D \cdot T]$
. In our modelling, we consider the simplifying assumption that T and D are independent. Such an approach is commonly accepted, for example, in the practice of actuarial calculations in non-life insuranceFootnote 13. We approximate the mean care severity
 $\hat{S}$
by
$\hat{S}$
by
 \begin{equation} \hat{S} = \mathbb{E}[S] = \mathbb{E}[D] \cdot \mathbb{E}[T] = \hat{D} \cdot \hat{T},\end{equation}
where
 $\hat{D} = \mathbb{E}[D]$
and
$\hat{D} = \mathbb{E}[D]$
and
 $\hat{T} = \mathbb{E}[T] $
are estimated with two separate models.
$\hat{T} = \mathbb{E}[T] $
are estimated with two separate models.
In Section 4.1, we present a model for the duration of stay D, expressing the number of months an elderly individual spends in an institution until death. In Section 4.2, we lay out a model for the intensity of care T, corresponding to the number of minutes of care received per week based on the individual’s evaluation at entry.
4.1 Duration of stay model
To model the duration of stay D in the institution, we first assess its distribution by fitting the observed durations with distributions commonly used in survival models. We find that the formal hazard proportionality test described in Grambsch & Therneau (Reference Grambsch and Therneau1994) is not passed, although the assumption of proportional hazards visually holds when plotting the Cox–Snell residuals. This is commonplace when faced with a large amount of data, and thus, we proceed by considering a different type of model, the AFT model; see Collett (Reference Collett2015). The two model classes intersect when the underlying distribution is Weibull.
To select the underlying distribution for the AFT model, we use the Bayesian information criterion (BIC) scores of the fitted models with all variables (see Table 1) for the exponential, Weibull, Gaussian, logistic, log-normal, and log-logistic distributions of
 $D_i$
. The lowest BIC score is obtained using the Weibull distribution. Thus, we apply the Weibull AFT model to our data.
$D_i$
. The lowest BIC score is obtained using the Weibull distribution. Thus, we apply the Weibull AFT model to our data.
A standard log-linear form of the AFT model with Weibull distribution is
 \begin{equation} \log D_i = x_i^\mathrm{T} \lambda + \sigma \varepsilon_i, \quad i = 1,\ldots, n,\end{equation}
where
 $\lambda = \left(\lambda_0, \lambda_1, \ldots, \lambda_k\right)^\mathrm{T}$
is a vector of unknown regression parameters,
$\lambda = \left(\lambda_0, \lambda_1, \ldots, \lambda_k\right)^\mathrm{T}$
is a vector of unknown regression parameters,
 $x_i = (x_{i0},\, x_{i1}, \ldots, x_{ik})$
are the observations of known covariates, and n stands for the number of observations. Here,
$x_i = (x_{i0},\, x_{i1}, \ldots, x_{ik})$
are the observations of known covariates, and n stands for the number of observations. Here,
 $\lambda_0$
corresponds to the intersection term, and hence we have
$\lambda_0$
corresponds to the intersection term, and hence we have
 $x_{i0} = 1$
, for
$x_{i0} = 1$
, for
 $ i = 1,\ldots,n$
. In this form,
$ i = 1,\ldots,n$
. In this form,
 $\varepsilon_i$
does in fact have the standard Gumbel distributionFootnote 14.
$\varepsilon_i$
does in fact have the standard Gumbel distributionFootnote 14.
In our case,
 $D_i$
follows a Weibull distribution with scale parameter
$D_i$
follows a Weibull distribution with scale parameter
 $\exp(x_i^\mathrm{T} \lambda)$
and shape parameter
$\exp(x_i^\mathrm{T} \lambda)$
and shape parameter
 $1/\sigma$
. The mean duration is then expressed as
$1/\sigma$
. The mean duration is then expressed as
 \begin{equation} \mathbb{E}[D_i] = \exp(x_i^\mathrm{T} \lambda) \, \Gamma\left(1 + \sigma\right),\end{equation}
where
 $\Gamma$
stands for the gamma function,
$\Gamma$
stands for the gamma function,
 $\Gamma(z)=\int_0^\infty x^{z-1}e^{-x} \,\mathrm{d}x$
.
$\Gamma(z)=\int_0^\infty x^{z-1}e^{-x} \,\mathrm{d}x$
.
AFT models account for right censoring, and the coefficients
 $\lambda$
are obtained by maximising the likelihood function (see Klein & Moeschberger, Reference Klein and Moeschberger1997, Chapter 3.5),
$\lambda$
are obtained by maximising the likelihood function (see Klein & Moeschberger, Reference Klein and Moeschberger1997, Chapter 3.5),
 \begin{equation} \mathcal{L} = \prod_{i=1}^n \left[f_{W}(D_i)\right]^{\delta_i} \left[S_{W}(D_i)\right]^{1-\delta_i},\end{equation}
where
 $f_{W}$
is the Weibull density function,
$f_{W}$
is the Weibull density function,
 $S_{W}$
is the Weibull survival function, and
$S_{W}$
is the Weibull survival function, and
 $\delta_i = 0$
if the data are right-censored and
$\delta_i = 0$
if the data are right-censored and
 $\delta_i = 1$
otherwise. To fit the model, we applied the survreg function from the survival package in R; see Therneau (Reference Therneau2021).
$\delta_i = 1$
otherwise. To fit the model, we applied the survreg function from the survival package in R; see Therneau (Reference Therneau2021).
4.2 Care intensity model
The intensity of care T provided to a person each week is bounded and takes values in the interval (0, 10,080). The upper bound is derived from the total number of minutes in 1 week. Usual practice performs a regression analysis on a transformation of the data so that the modified response variable, say
 $\tilde{T}$
, takes values in the whole real line. Such an approach is in general disadvantageous since we can interpret the resulting analysis only in terms of the mean of
$\tilde{T}$
, takes values in the whole real line. Such an approach is in general disadvantageous since we can interpret the resulting analysis only in terms of the mean of
 $\tilde{T}$
, while our interest is on the mean of T. However, a simple linear transformation
$\tilde{T}$
, while our interest is on the mean of T. However, a simple linear transformation
 $\tilde{T} = T / 10,080$
does not obstruct our intentions. Moreover, we see from Figures 1, 2, and 4 that the data seem to be heteroskedastic. Indeed, not only do the means depend on the levels of the predictors, but the variance also changes.
$\tilde{T} = T / 10,080$
does not obstruct our intentions. Moreover, we see from Figures 1, 2, and 4 that the data seem to be heteroskedastic. Indeed, not only do the means depend on the levels of the predictors, but the variance also changes.
An interpretative model in terms of the mean of T based on the beta distribution, hence, called the beta regression model, has been proposed by Ferrari & Cribari-Neto (Reference Ferrari and Cribari-Neto2004). Later, Simas et al. (Reference Simas, Barreto-Souza and Rocha2010) provided an extension of the beta regression model that allows for non-linearity and variable dispersion. In the latter model, the standard beta density function
 \begin{equation} f(\tilde{T};\, p, q) = \frac{\Gamma(p + q)}{\Gamma(p) \, \Gamma(q)} \tilde{T}^{p - 1} (1-\tilde{T})^{q - 1}, \quad 0 < \tilde{T} < 1,\end{equation}
is parameterised by the mean
 $\mu = p / (p + q) \in (0, 1)$
and the precision parameter
$\mu = p / (p + q) \in (0, 1)$
and the precision parameter
 $\phi = p + q > 0$
, yielding
$\phi = p + q > 0$
, yielding
 \begin{equation} f(\tilde{T};\, \mu, \phi) = \frac{\Gamma(\phi)}{\Gamma(\mu \phi) \, \Gamma\left((1-\mu) \phi\right)} \tilde{T}^{\mu \phi - 1} (1-\tilde{T})^{(1-\mu)\phi - 1}, \quad 0 < \tilde{T} < 1.\end{equation}
While the mean
 $\mu$
relates to the mean of
$\mu$
relates to the mean of
 $\tilde{T}$
, the numerical value of the precision parameter
$\tilde{T}$
, the numerical value of the precision parameter
 $\phi$
does not have a simple interpretation. However, its estimate provides information on the variance of
$\phi$
does not have a simple interpretation. However, its estimate provides information on the variance of
 $\tilde{T}$
. Indeed, by definition, the variance of a random variable with a beta distribution is
$\tilde{T}$
. Indeed, by definition, the variance of a random variable with a beta distribution is
 $\text{var}( \tilde{T} ) = V(\mu) / (1 + \phi)$
, where
$\text{var}( \tilde{T} ) = V(\mu) / (1 + \phi)$
, where
 $V(\mu) = \mu / (1-\mu)$
. Thus, for a given mean
$V(\mu) = \mu / (1-\mu)$
. Thus, for a given mean
 $\mu$
, the larger the value of
$\mu$
, the larger the value of
 $\phi$
is, the smaller the variance of
$\phi$
is, the smaller the variance of
 $\tilde{T}$
and T.
$\tilde{T}$
and T.
Let
 $\tilde{T}_i$
,
$\tilde{T}_i$
,
 $i=1,\ldots,n$
, follow the beta distribution with the above density function. We assume that the mean
$i=1,\ldots,n$
, follow the beta distribution with the above density function. We assume that the mean
 $\mu$
and the precision parameter
$\mu$
and the precision parameter
 $\phi$
characterising
$\phi$
characterising
 $\tilde{T}_i$
satisfy the following functional relations:
$\tilde{T}_i$
satisfy the following functional relations:
 \begin{equation} g_1(\mu_i) = x_i^\mathrm{T} \beta, \quad \mathrm{and} \quad g_2(\phi_i) = x_i^\mathrm{T} \theta,\end{equation}
where
 $\beta = \left(\beta_0, \beta_1, \ldots, \beta_k\right)^\mathrm{T}$
and
$\beta = \left(\beta_0, \beta_1, \ldots, \beta_k\right)^\mathrm{T}$
and
 $\theta = \left(\theta_0, \theta_1, \ldots, \theta_k\right)^\mathrm{T}$
are vectors of unknown regression parameters, and
$\theta = \left(\theta_0, \theta_1, \ldots, \theta_k\right)^\mathrm{T}$
are vectors of unknown regression parameters, and
 $2(k+1) < n$
. Here,
$2(k+1) < n$
. Here,
 $\beta_0$
and
$\beta_0$
and
 $\theta_0$
correspond to the intersection terms, and hence, we have
$\theta_0$
correspond to the intersection terms, and hence, we have
 $x_{i0} = 1$
,
$x_{i0} = 1$
,
 $\forall i = 1,\ldots,n$
.
$\forall i = 1,\ldots,n$
.
The resulting log-likelihood function has the following form:
 \begin{align*} \ell(\beta, \theta) &= \sum_{i = 1}^n \left[ \log \Gamma(\phi_i) - \log \Gamma(\mu_i \phi_i) - \log \Gamma\left((1 - \mu_i)\phi_i\right) + (\mu_i \phi_i - 1) \log \tilde{T}_i \right.\\&\quad \left. + \left((1-\mu_i)\phi_i - 1\right) \log(1 - \tilde{T}_i) \right],\end{align*}
where
 $\mu_i = g_1^{-1}(x_i^\mathrm{T} \beta)$
and
$\mu_i = g_1^{-1}(x_i^\mathrm{T} \beta)$
and
 $\phi_i = g_2^{-1}(x_i^\mathrm{T} \theta)$
are defined in equation (7). There are various approaches to choose the link functions such that
$\phi_i = g_2^{-1}(x_i^\mathrm{T} \theta)$
are defined in equation (7). There are various approaches to choose the link functions such that
 $g_1^{-1}\,{:}\, \mathbb{R} \to (0, 1)$
and
$g_1^{-1}\,{:}\, \mathbb{R} \to (0, 1)$
and
 $g_2^{-1}\,{:}\, \mathbb{R} \to \mathbb{R}_+$
. It is the best practice to use interpretable link functions, as opposed to data-driven approaches, since only in the former case will the standard errors of the resulting parameter estimates be truthful. In our numerical implementation, we choose the standard transformations
$g_2^{-1}\,{:}\, \mathbb{R} \to \mathbb{R}_+$
. It is the best practice to use interpretable link functions, as opposed to data-driven approaches, since only in the former case will the standard errors of the resulting parameter estimates be truthful. In our numerical implementation, we choose the standard transformations
 \begin{equation} g_1(\mu) = \log\left(\frac{\mu}{1-\mu}\right), \quad \mathrm{and} \quad g_2(\phi) = \log(\phi),\end{equation}
and, therefore, we have, for
 $i=1,\dots,n$
,
$i=1,\dots,n$
,
 \begin{equation} {\mu}_i = \frac{1}{1 + \exp(\!-x_i^\mathrm{T} \beta)}, \quad \mathrm{and} \quad {\phi}_i = \exp(x_i^\mathrm{T} \theta).\end{equation}
To fit this model, we use the R package betareg. Details can be found in the original work by Cribari-Neto & Zeileis (Reference Cribari-Neto and Zeileis2010), and the extended work by Grün et al. (2012).
5. Results and Discussion
In this section, we apply the econometric models introduced in Section 4. In Section 5.1, we discuss the specification of the models. We introduce the variable transformations and discuss the selection of the psychological and sensory function impairments, the inclusion of interaction terms between age at entry and gender, and how the variable importance is measured. We also show how the coefficients of the models are interpreted. We present the results of the duration of stay and intensity of care models, respectively, in Table 4 and analyse and interpret them in Sections 5.2 and 5.3. Next, we assess the goodness-of-fit of both models in Section 5.4, and finally, we highlight model estimates of the duration of stay, the intensity of care, and the overall care severity for selected profiles of the institutionalised elderly individuals in Section 5.5.
Table 4. Model results for the duration of stay D and the intensity of care T models.

Note: Significance levels in column “Sig.” are reported as follows: p-value < 0.1., < 0.05 *, < 0.01 **, < 0.001 ***. The column “Effect” reports the effect related to a category deviating from the baseline (all other parameters remaining at the baseline). The column “Imp. (rank)” reports the effect on the BIC and the corresponding rank of the variable.
5.1 Specification of the models and results
In Table 4, we report the regression results for both the duration of stay (equation (2)) and intensity of care (equation (6)) models. In each model and for each variable, we report the estimates for the regression coefficients with the standard deviation and the significance level. Recall that the original data contain 16 variables related to psychological and sensory function impairments (see Section 3.1). To reduce the complexity and improve the scores of the models, we reduce the number of these factor variables using a variable selection procedure based on the BIC. Overall, we retain six variables associated with psychological and sensory function impairments. Three variables (PA, BH, VS) appear in the duration of stay model, and four (RM, IM, WM, VS) appear in the intensity of care model. All the other covariates summarised in Table 1 are included in both models.
Most of the covariates in our data are categorical variables (see Table 1). From the descriptive statistics in Table 3, we observe that women (72.5%) are more prevalent than men in institutional care, and, therefore, we choose “female” as the baseline for the gender GE variable. For the main diagnosis D1, we choose the group of mental pathologies as the baseline since it has the highest prevalence (34.3%). The second diagnosis, D2, involves comorbidity and interactions with D1. To avoid ambiguous interpretations in the baseline, we assume that elderly individuals have no secondary diagnosis and choose “none” as the baseline for D2. Furthermore, for the variables that describe the levels of dependence, we use the group of lowest levels as a baseline. Thereby, we use the groups laid out in the descriptive statistics (see Table 3), that is, levels 1–6 for dependence in ADL DP, 1–5 for physical mobility limitations PM, 1–4 for orientation problems OR, 1–5 for occupational limitations OC, and 1–4 for social integration limitations SI. Finally, we use the “adequate” level (healthy) as the reference category in the impairments of psychological and sensory functions (recent memory impairments RM, perception and attention impairments PA, impulse impairments IM, will and motivation impairments WM, behavioural impairments BH, and visual impairments VS).
The set of covariates further includes two numerical variables: the age at entry AG and the number of additional diagnoses ND. While AG starts at 65 years, ND takes integer values from 0 to 7, where zero indicates that the person has no additional diagnoses, that is, only one or two diagnoses given by D1 and D2. As we have seen in Table 3, LTC prevalence rates and entrance into care institutions expand after the age of 80 years (see also, e.g., Colombo et al., Reference Colombo, Llena-Nozal, Mercier and Tjadens2011). To account for this, we consider
 $AG=80$
years as a reference point and subtract 80 from the AG variable when fitting the models, that is, we transform the predictor into (
$AG=80$
years as a reference point and subtract 80 from the AG variable when fitting the models, that is, we transform the predictor into (
 $AG - 80$
). Hence, an 80-year-old woman at entry with a mental main diagnosis, without secondary or additional diagnoses, the lowest dependence levels and no other impairments characterises the baseline health profile and corresponds to the intercept term, or baseline, in both models.
$AG - 80$
). Hence, an 80-year-old woman at entry with a mental main diagnosis, without secondary or additional diagnoses, the lowest dependence levels and no other impairments characterises the baseline health profile and corresponds to the intercept term, or baseline, in both models.
In Table 4, we also provide intuition for the interpretation of the obtained estimates in the column labelled “Effect”. For the categorical variables, the “Effect” measures the increase or decrease of D and T in absolute values when the variable switches from its baseline to the corresponding level, and all other parameters remain the same at the baseline. For numerical variables, we do not report the information. Indeed, since our models are non-linear, the corresponding effects must be evaluated through equations (3) and (9), respectively. If several parameters are changed at the same time, the effects also must be calculated using the original equations (see also the model estimations illustrated in Section 5.5).
Furthermore, to rank the importance of the variables, we remove each variable from the model and compute the resulting BIC score. Then, we subtract the BIC score of the full model and report the difference in the column labelled “Imp. (rank)” in Table 4. If the difference is positive, the reduced model would suffer from information loss, and the variable is important. In contrast, if the difference is negative, the reduced model would benefit from removing the variable. Since we report the results for all variables, some of them have negative importance values (e.g. OR, OC, SI in the duration of stay model), which means that these variables may be omitted. Finally, we order each difference in BIC scores and report the rank in parentheses.
5.2 Duration of stay
In the first part of Table 4 in the column labelled “Duration of stay D”, we present the results of the AFT model (equation (2)) applied to our data set. The first columns present the fitted coefficients
 $\hat{\lambda}$
of the model and the corresponding standard deviations
$\hat{\lambda}$
of the model and the corresponding standard deviations
 $\sigma_{\hat{\lambda}}$
. The mean duration of stay for the baseline that can be read from the intercept row in the “Effect” column is 135 months.
$\sigma_{\hat{\lambda}}$
. The mean duration of stay for the baseline that can be read from the intercept row in the “Effect” column is 135 months.
Demographic variables. We observe a negative effect of the age at entry AG on the duration of stay with
 $\hat{\lambda}_{AG} = -0.0354$
. This follows the intuition that the later a person enters institutional care, the less time he or she spends there. Our result substantiates the findings on increased mortality rates at higher ages (Mathers, Reference Mathers1996; Deeg et al., Reference Deeg, Portrait and Lindeboom2002; Fong et al., Reference Fong, Sherris and Yap2017) and, thus, a reduced duration of stay (Colombo et al., Reference Colombo, Llena-Nozal, Mercier and Tjadens2011; Fuino & Wagner, Reference Fuino and Wagner2020). At the same time, the coefficient
$\hat{\lambda}_{AG} = -0.0354$
. This follows the intuition that the later a person enters institutional care, the less time he or she spends there. Our result substantiates the findings on increased mortality rates at higher ages (Mathers, Reference Mathers1996; Deeg et al., Reference Deeg, Portrait and Lindeboom2002; Fong et al., Reference Fong, Sherris and Yap2017) and, thus, a reduced duration of stay (Colombo et al., Reference Colombo, Llena-Nozal, Mercier and Tjadens2011; Fuino & Wagner, Reference Fuino and Wagner2020). At the same time, the coefficient
 $\hat{\lambda}_{GE} = -0.3884$
yields that males, on average and for the baseline profile, spend
$\hat{\lambda}_{GE} = -0.3884$
yields that males, on average and for the baseline profile, spend
 $43.4$
fewer months than women in the institution. Both variables share first and second place in the importance ranking, with the age at entry AG being almost twice as important as the gender GE in terms of BIC.
$43.4$
fewer months than women in the institution. Both variables share first and second place in the importance ranking, with the age at entry AG being almost twice as important as the gender GE in terms of BIC.
Medical diagnoses. As one can observe from the descriptive statistics in Table 3 and the survival curve pictured in Figure 1(a), pathologies are one of the key factors that shape the duration of stay D. In fact, the number of additional diagnoses ND is the third most important variable, followed by the main diagnosis D1 (rank four). The secondary diagnosis D2 takes eighth place. All main diagnoses significantly reduce the duration of stay compared to the group of mental diagnoses, except for cerebrovascular and osteoarticular pathologies, which appear to be not significant. A tumour in the main diagnosis significantly reduces the baseline duration by 77.4 months on average. In absolute value, the coefficient
 $\hat{\lambda}_{D1}^\mathrm{Tumour} = -0.8512$
is the highest among the D1 levels. This result follows from the lower expected lifetime due to the often faster progression of the tumours, which more rapidly leads to death compared to other diseases (Guccione et al., Reference Guccione, Felson, Anderson, Anthony, Zhang, Wilson, Kelly-Hayes, Wolf, Kreger and Kannel1994). Next comes the group of heart-related diseases, which reduce the average duration of stay by 17.5 months.
$\hat{\lambda}_{D1}^\mathrm{Tumour} = -0.8512$
is the highest among the D1 levels. This result follows from the lower expected lifetime due to the often faster progression of the tumours, which more rapidly leads to death compared to other diseases (Guccione et al., Reference Guccione, Felson, Anderson, Anthony, Zhang, Wilson, Kelly-Hayes, Wolf, Kreger and Kannel1994). Next comes the group of heart-related diseases, which reduce the average duration of stay by 17.5 months.
The secondary diagnosis D2 does not significantly affect the duration of stay except for tumour diagnoses and, to a lesser extent, heart diseases (compared to the baseline with no secondary diagnosis). We observe that the duration of stay, on average, is reduced by an additional 43.6 months (
 $\hat{\lambda}_{D2}^\mathrm{Tumour} = -0.3899$
) regardless of the type of main diagnosis D1. Simultaneously, heart disease in D2 decreased the mean duration by 9.7 months. In general, the more pathologies a person has, the less time he or she spends in dependence (
$\hat{\lambda}_{D2}^\mathrm{Tumour} = -0.3899$
) regardless of the type of main diagnosis D1. Simultaneously, heart disease in D2 decreased the mean duration by 9.7 months. In general, the more pathologies a person has, the less time he or she spends in dependence (
 $\hat{\lambda}_{ND} = -0.0522$
). Multi-morbidity comes with a higher chance of developing severe conditions along a pathology, which eventually increases the mortality rate, especially at higher ages (see, e.g., Menotti et al., Reference Menotti, Mulder, Nissinen, Giampaoli, Feskens and Kromhout2001; Deeg et al., Reference Deeg, Portrait and Lindeboom2002; Byles et al., Reference Byles, D’Este, Parkinson, O’Connell and Treloar2005).
$\hat{\lambda}_{ND} = -0.0522$
). Multi-morbidity comes with a higher chance of developing severe conditions along a pathology, which eventually increases the mortality rate, especially at higher ages (see, e.g., Menotti et al., Reference Menotti, Mulder, Nissinen, Giampaoli, Feskens and Kromhout2001; Deeg et al., Reference Deeg, Portrait and Lindeboom2002; Byles et al., Reference Byles, D’Este, Parkinson, O’Connell and Treloar2005).
Level of dependence. Our regression results show significant differences between the different levels of DP, PM, and OC and thus support the clear distinction that we observed between the curves of the different levels in the graphs of Figure 2 (see Figures 2(a), (c), (g), respectively). All levels of dependence in ADL DP, the fifth most important variable, are highly significant and reduce the mean duration of stay by up to 58.5 months. Furthermore, physical mobility PM takes the sixth place in the importance ranking, with all coefficients being highly significant. Increased levels of PM monotonously shorten the duration of stay. Both DP and PM increase the mortality rates, which result in a shorter duration (Rickayzen & Walsh, Reference Rickayzen and Walsh2002). Despite its rank at 12 (second to last in the ranking), the occupational limitations variable OC has all its coefficients significantly different from the baseline, although the p-value thresholds are different. For example, Level 7 (confined occupation in terms of time and type) reduces the mean duration of stay the most (12.8 months) with a three-star significance, while the most vulnerable group of unoccupiable elderly individuals (Level 9) yields the least significant coefficient (reduction of 10.2 months).
The overlapping curves for the levels in the variables OR and SI translate into regression coefficients that are not significant. The variable occupational problems OR has only one coefficient
 $\hat{\lambda}_{OR}^{8\text{+}} = -0.0980$
(disorientation or unconscious) that is one-star significant, which reduces the mean duration of stay by 12.6 months compared to the baseline.
$\hat{\lambda}_{OR}^{8\text{+}} = -0.0980$
(disorientation or unconscious) that is one-star significant, which reduces the mean duration of stay by 12.6 months compared to the baseline.
Impairments of psychological and sensory functions. The BIC variable selection procedure leaves us with three factors related to the impairments that are included in the duration of stay model: perception and attention PA, behavioural BH, and visual impairments VS. Behaviour BH ranks seventh in the importance ranking, right after the dependence in ADL DP and physical mobility PM variables. Since behavioural impairments manifest themselves as accentuated character traits, elderly individuals with severe levels of BH are cared for more intensely (see Figure 4(e)), which leads to a higher mean duration of stay. The coefficient of the severe level (
 $\hat{\lambda}_{BH}^\mathrm{Severe} = 0.2986$
) is the only significant coefficient. It increases the mean duration of stay by 47 months compared to the baseline.
$\hat{\lambda}_{BH}^\mathrm{Severe} = 0.2986$
) is the only significant coefficient. It increases the mean duration of stay by 47 months compared to the baseline.
The perception and attention variable PA takes the ninth rank in the importance list and is the second most important variable among psychological and sensory function impairments. We observe two coefficients significantly different from the baseline:
 $\hat{\lambda}_{PA}^\mathrm{Moderate} = -0.0783$
(one star) and
$\hat{\lambda}_{PA}^\mathrm{Moderate} = -0.0783$
(one star) and
 $\hat{\lambda}_{PA}^\mathrm{Severe} = 0.1257$
(two stars). Surprisingly, they are of the opposite signs. Compared to the adequate level, moderate impairments decrease the mean duration of stay by 10.2 months, while severe impairments increase it by 18.1 months. From Figure 4(b), we deduce that the latter level corresponds to a much higher intensity of care, which through more attentive care results in slower health deterioration and, thus, a higher expected duration (Tombaugh & McIntyre, Reference Tombaugh and McIntyre1992).
$\hat{\lambda}_{PA}^\mathrm{Severe} = 0.1257$
(two stars). Surprisingly, they are of the opposite signs. Compared to the adequate level, moderate impairments decrease the mean duration of stay by 10.2 months, while severe impairments increase it by 18.1 months. From Figure 4(b), we deduce that the latter level corresponds to a much higher intensity of care, which through more attentive care results in slower health deterioration and, thus, a higher expected duration (Tombaugh & McIntyre, Reference Tombaugh and McIntyre1992).
Finally, the mild level in the visual impairments variable VS reduces the duration of stay by 9.2 months, which may be linked to the lower level of help and overconfidence of the person. Indeed, from Figure 4(f), we see that the adequate and mild (and, to some extent, the moderate) levels of VS receive similar intensities of care, while blind people (severe level) receive extra attention. We find that a severe level of sight impairment increases the mean duration of stay by 11.7 months.
5.3 Intensity of care
The results of the beta regression model (equation (6)) for the intensity of care are presented in the second part of Table 4 under the heading “Intensity of care T”. The first two columns provide the
 $\beta$
and
$\beta$
and
 $\theta$
estimates corresponding to the mean and precision parameters of the beta distribution of
$\theta$
estimates corresponding to the mean and precision parameters of the beta distribution of
 $\tilde{T}$
. The mean intensity of care T provided to the baseline profile is 296.8 minutes/week (see the column labelled “Effect”), corresponding to approximately 5 hours/week. The other values reported in the “Effect” column relate to increases and decreases in the intensity of care T in the different factors.
$\tilde{T}$
. The mean intensity of care T provided to the baseline profile is 296.8 minutes/week (see the column labelled “Effect”), corresponding to approximately 5 hours/week. The other values reported in the “Effect” column relate to increases and decreases in the intensity of care T in the different factors.
Demographic variables. We observe a significant negative, although small, effect of the age at entry AG on the mean intensity of care. The estimate
 $\hat{\beta}_{AG} = -0.0014$
indicates that older individuals receive, on average, slightly less help for their daily needs. At the same time, the positive three-star significant coefficient
$\hat{\beta}_{AG} = -0.0014$
indicates that older individuals receive, on average, slightly less help for their daily needs. At the same time, the positive three-star significant coefficient
 $\hat{\theta}_{AG} = 0.0114$
suggests that at higher ages, the variance of the intensity of care is lower compared to the younger elderly individuals, which may result from heterogeneous health conditions and an increase in disability (Fries, Reference Fries1980; Olshansky et al., Reference Olshansky, Rudberg, Carnes, Cassel and Brody1991). The variable AG ranks seventh in importance. Furthermore, the coefficient
$\hat{\theta}_{AG} = 0.0114$
suggests that at higher ages, the variance of the intensity of care is lower compared to the younger elderly individuals, which may result from heterogeneous health conditions and an increase in disability (Fries, Reference Fries1980; Olshansky et al., Reference Olshansky, Rudberg, Carnes, Cassel and Brody1991). The variable AG ranks seventh in importance. Furthermore, the coefficient
 $\hat{\beta}_{GE} = 0.0684$
indicates that males receive, on average, more help than females. For the baseline profile, the difference is 20.3 minutes/week. The negative coefficient
$\hat{\beta}_{GE} = 0.0684$
indicates that males receive, on average, more help than females. For the baseline profile, the difference is 20.3 minutes/week. The negative coefficient
 $\hat{\theta}_{GE} = -0.0793$
indicates that the amount of help received by males has a higher variance, yielding more precise estimations for women than for men. Gender GE is one of the key determinants of the intensity of care, since it takes third place in importance.
$\hat{\theta}_{GE} = -0.0793$
indicates that the amount of help received by males has a higher variance, yielding more precise estimations for women than for men. Gender GE is one of the key determinants of the intensity of care, since it takes third place in importance.
Medical diagnoses. As we have observed in Figure 1(b), the main diagnosis D1 is not a strong determinant factor for explaining the intensity of care. Indeed, D1 takes only the 12th place in the importance ranking. Nevertheless, all diagnoses’ coefficients are significantly (three stars) different from the mental disease baseline, except for tumour (two-star significant) and heart diseases (not significant). Significant differences increase the mean intensity of care by approximately 10 minutes/week. The secondary diagnosis D2 is the least important variable in our model. Since none of the
 $\hat{\beta}_{D2}$
coefficients is significant, there is no benefit in knowing the secondary diagnosis for explaining the intensity of care. However, the positive coefficients
$\hat{\beta}_{D2}$
coefficients is significant, there is no benefit in knowing the secondary diagnosis for explaining the intensity of care. However, the positive coefficients
 $\hat{\theta}_{D2}$
indicate that the variance of the intensity of care evaluation can be reduced by including D2. Finally, the number of additional diagnoses ND ranks fifth in importance. The coefficient
$\hat{\theta}_{D2}$
indicate that the variance of the intensity of care evaluation can be reduced by including D2. Finally, the number of additional diagnoses ND ranks fifth in importance. The coefficient
 $\hat{\beta}_{ND} = 0.0130$
is highly significant and has a positive effect on the mean intensity, that is, the more comorbidities a person has, the more care he or she requires. This finding supplements the results of Barnett et al. (Reference Barnett, Mercer, Norbury, Watt, Wyke and Guthrie2012) when applied to the intensity of care provided to dependent elderly individuals in an institution. Indeed, the number of pathologies provides more relevant information than the underlying diseases themselves.
$\hat{\beta}_{ND} = 0.0130$
is highly significant and has a positive effect on the mean intensity, that is, the more comorbidities a person has, the more care he or she requires. This finding supplements the results of Barnett et al. (Reference Barnett, Mercer, Norbury, Watt, Wyke and Guthrie2012) when applied to the intensity of care provided to dependent elderly individuals in an institution. Indeed, the number of pathologies provides more relevant information than the underlying diseases themselves.
Level of dependence. Dependence in ADL DP is the most important variable explaining the intensity of care. Moreover, it comes with the highest values of
 $\hat{\beta}$
coefficients (all three-star significant) among all variables. Compared to the baseline (levels 1–6), levels 7, 8, and 9 increase the mean intensity of care by 152.7 minutes (2.5 hours), 280.6 minutes (4.7 hours), and 408.6 minutes (6.8 hours) per week, respectively. Thus, expectedly, ADL limitations are a key driver of care intensity. Simultaneously, the coefficients
$\hat{\beta}$
coefficients (all three-star significant) among all variables. Compared to the baseline (levels 1–6), levels 7, 8, and 9 increase the mean intensity of care by 152.7 minutes (2.5 hours), 280.6 minutes (4.7 hours), and 408.6 minutes (6.8 hours) per week, respectively. Thus, expectedly, ADL limitations are a key driver of care intensity. Simultaneously, the coefficients
 $\hat{\theta}_{DP}$
are negative, which indicates a higher variance of the intensity of care for different levels of DP compared to the baseline.
$\hat{\theta}_{DP}$
are negative, which indicates a higher variance of the intensity of care for different levels of DP compared to the baseline.
The second most important variable, PM, is associated with physical mobility limitations. All coefficients
 $\hat{\beta}_{PM}$
are three-star significant and positive, indicating an increasing mean intensity of care compared to the baseline. Moreover, the amount of help increases for the higher levels of PM by up to 192.9 minutes (approximately 3.2 hours) per week for the fully immobile elderly individuals (Level 9). At the same time, the precision coefficient
$\hat{\beta}_{PM}$
are three-star significant and positive, indicating an increasing mean intensity of care compared to the baseline. Moreover, the amount of help increases for the higher levels of PM by up to 192.9 minutes (approximately 3.2 hours) per week for the fully immobile elderly individuals (Level 9). At the same time, the precision coefficient
 $\hat{\theta}_{PM}^9 = 0.4890$
is three-star significant and positive, indicating a lower variance compared to the baseline. In contrast, Levels 6 and 7 lead to a higher variance, which may be explained by the fact that people who ordinarily get around independently inside the institution and their bedroom, respectively, are more exposed to a sudden and unexpected need for help when moving around. For example, when trying to get to another floor, being lost, or forgetting the place of their bedroom (Maresova et al., Reference Maresova, Javanmardi, Barakovic, Barakovic Husic, Tomsone, Krejcar and Kuca2019), it might be the case that these two levels should receive more help than they usually do to reduce the spread and make help requests more predictable.
$\hat{\theta}_{PM}^9 = 0.4890$
is three-star significant and positive, indicating a lower variance compared to the baseline. In contrast, Levels 6 and 7 lead to a higher variance, which may be explained by the fact that people who ordinarily get around independently inside the institution and their bedroom, respectively, are more exposed to a sudden and unexpected need for help when moving around. For example, when trying to get to another floor, being lost, or forgetting the place of their bedroom (Maresova et al., Reference Maresova, Javanmardi, Barakovic, Barakovic Husic, Tomsone, Krejcar and Kuca2019), it might be the case that these two levels should receive more help than they usually do to reduce the spread and make help requests more predictable.
The variables linked to orientation problems OR and occupational limitations OC take fourth and sixth place in the importance ranking. Like the dependence in ADL DP and physical mobility limitations PM, all
 $\hat{\beta}$
coefficients are three-star significant and positive, yielding an increased mean intensity of care for the higher levels of dependence. For both OR and OC, the maximum increase is approximately 1 hour/week (66.5 and 66.0 minutes, respectively). Finally, social integration SI is a much less relevant driver of the intensity of care. Indeed, limitations with physical activities drive the intensity of care much more than the needed help with social contacts. Surprisingly, a reduced level of communication abilities leads to a slightly lower amount of help, which may be explained by the solitary lifestyle of these persons (Simard & Volicer, Reference Simard and Volicer2020). Although the coefficients
$\hat{\beta}$
coefficients are three-star significant and positive, yielding an increased mean intensity of care for the higher levels of dependence. For both OR and OC, the maximum increase is approximately 1 hour/week (66.5 and 66.0 minutes, respectively). Finally, social integration SI is a much less relevant driver of the intensity of care. Indeed, limitations with physical activities drive the intensity of care much more than the needed help with social contacts. Surprisingly, a reduced level of communication abilities leads to a slightly lower amount of help, which may be explained by the solitary lifestyle of these persons (Simard & Volicer, Reference Simard and Volicer2020). Although the coefficients
 $\hat{\beta}_{SI}$
are small, the highest reduction in mean intensity of care (12.6 minutes/week) is found in the most alienated and abandoned individuals (levels 8+).
$\hat{\beta}_{SI}$
are small, the highest reduction in mean intensity of care (12.6 minutes/week) is found in the most alienated and abandoned individuals (levels 8+).
Impairments of psychological and sensory functions. Following the BIC variable selection procedure four variables are included in our model: recent memory RM, impairment in impulses IM, will and motivation WM, and visual impairment VS. Recent memory RM is the only factor that sees a slight decrease (approximately 10 minutes/week) in the intensity of care at moderate and severe levels (two stars). In the other variables (IM, WM, VS), all levels are significant and come with an increased intensity of care at the more severe levels. However, the increase remains relatively small and remains below 20 minutes/week. Indeed, in the impairment in impulses IM, the largest increase in the mean care intensity is 19.9 minutes/week at the moderate level. For will and motivation WM impairments, we observe an additional 19 minutes/week at the same level, while severe visual impairments require 18.5 minutes/week more.
5.4 Goodness-of-fit and alternative model specifications
Goodness-of-fit of the AFT model. In the previous sections, we applied the AFT and beta regression models to the data, and we reported the results for the duration of stay D and the intensity of care T. To assess the quality of the fit of the AFT model (equation (2)) with Weibull distribution, we plot the Cox–Snell residuals (see Klein & Moeschberger, Reference Klein and Moeschberger1997, Chapter 11.2). Therefore, we calculate the cumulative distribution function of the Weibull distribution at the observed durations of stay,
 \begin{equation} U_i \equiv F_W(D_i;\, \lambda, \sigma) = 1 - \exp\left(\!-\left(\frac{D_i}{\exp(x_i^\mathrm{T} \hat{\lambda})}\right)^{1/\hat{\sigma}}\right),\end{equation}
using the coefficient estimates
 $\hat{\lambda}$
and
$\hat{\lambda}$
and
 $\hat{\sigma}$
reported in Table 4. Under the correct model, the values
$\hat{\sigma}$
reported in Table 4. Under the correct model, the values
 $U_i$
should be uniformly distributed on the unit interval. However, recall that 17.6% of the observations are censored. To overcome this, we apply the transform
$U_i$
should be uniformly distributed on the unit interval. However, recall that 17.6% of the observations are censored. To overcome this, we apply the transform
 $E_i = -\log\left(1 - U_i\right)$
, and now the Cox–Snell residuals
$E_i = -\log\left(1 - U_i\right)$
, and now the Cox–Snell residuals
 $E_i$
are expected to constitute a right-censored sample that follows the exponential distribution with unit rate. We compute the Neslon–Aalen estimator of the cumulative hazard rate of
$E_i$
are expected to constitute a right-censored sample that follows the exponential distribution with unit rate. We compute the Neslon–Aalen estimator of the cumulative hazard rate of
 $E_i$
without any predictors, which should be approximately equal to the cumulative hazard rate of the unit exponential, that is, the identity function under the null hypothesis.
$E_i$
without any predictors, which should be approximately equal to the cumulative hazard rate of the unit exponential, that is, the identity function under the null hypothesis.
We report both quantities in Figure 5(a) and we confirm the required behaviour. Indeed, we see that most of the residuals are concentrated on the diagonal, while only the right tail is slightly below. Note that these are few observations from the whole data set, which contains 21,758 records. However, standard formal statistical tests reject the null hypothesis, which is not surprising for a data set of this size. Presently, we are satisfied with the visual agreement of the curve depicted in Figure 5(a). Different model specifications could correct the slight deviation, but at the potential cost of loss of interpretability.

Figure 5 Illustration of the goodness of fit.
Goodness-of-fit of the beta regression model. To assess the goodness-of-fit of the beta regression model (equation (6)), we proceed by calculating the pseudo
 $R^2$
as a global measure of explained variance. It is defined as the square of the sample correlation coefficient between the observed intensity of care and the fitted intensity of care. The resulting pseudo
$R^2$
as a global measure of explained variance. It is defined as the square of the sample correlation coefficient between the observed intensity of care and the fitted intensity of care. The resulting pseudo
 $R^2$
of our model is 79.31%, which in practice is considered relatively high.
$R^2$
of our model is 79.31%, which in practice is considered relatively high.
We further follow the approach proposed by Ferrari & Cribari-Neto (Reference Ferrari and Cribari-Neto2004) to extend our analysis. We define the standardised residuals, also called Pearson residuals, as
 \begin{equation} r_i = \left(\tilde{T}_i - \hat{\mu}_i\right) / \sqrt{\widehat{\mathrm{var}}(\tilde{T}_i)},\end{equation}
where
 $\widehat{\mathrm{var}}(\tilde{T}_i) = \left[\hat{\mu}_i (1 - \hat{\mu}_i)\right] /(1 + \hat{\phi}_i)$
, and
$\widehat{\mathrm{var}}(\tilde{T}_i) = \left[\hat{\mu}_i (1 - \hat{\mu}_i)\right] /(1 + \hat{\phi}_i)$
, and
 $\hat{\mu}$
and
$\hat{\mu}$
and
 $\hat{\phi}$
are the estimates of
$\hat{\phi}$
are the estimates of
 $\mu$
and
$\mu$
and
 $\phi$
, respectively. Since the exact distribution of these residuals is not known, half-normal plots with simulated envelopes are a useful diagnostic tool (see Atkinson, Reference Atkinson1985; Kutner et al., Reference Kutner, Nachtsheim, Neter and Li2005). The idea is to enhance the standard half-normal plot by adding a simulated envelope that can be used to decide whether the observed residuals are consistent with the fitted model. The construction of a half-normal envelope for the beta regression model is fully described in Ferrari & Cribari-Neto (Reference Ferrari and Cribari-Neto2004). Under the null hypothesis, the observations should lie inside the envelope a prespecified percentage of times. In Figure 5(b) we draw the envelope (area between both plain curves) and the Pearson residuals using 500 simulations and a 95% confidence interval. We observe three outliers at the top right corner and some observations that lie outside the envelope (see the records starting from 2.2 on the horizontal axis). Overall, 76.3% of the data lie inside the confidence interval. Note that given the large number of observations, the boundaries of the simulated envelope are rather narrow. Thus, we conclude that the intensity of care model achieves satisfactory concordance with the data.
$\phi$
, respectively. Since the exact distribution of these residuals is not known, half-normal plots with simulated envelopes are a useful diagnostic tool (see Atkinson, Reference Atkinson1985; Kutner et al., Reference Kutner, Nachtsheim, Neter and Li2005). The idea is to enhance the standard half-normal plot by adding a simulated envelope that can be used to decide whether the observed residuals are consistent with the fitted model. The construction of a half-normal envelope for the beta regression model is fully described in Ferrari & Cribari-Neto (Reference Ferrari and Cribari-Neto2004). Under the null hypothesis, the observations should lie inside the envelope a prespecified percentage of times. In Figure 5(b) we draw the envelope (area between both plain curves) and the Pearson residuals using 500 simulations and a 95% confidence interval. We observe three outliers at the top right corner and some observations that lie outside the envelope (see the records starting from 2.2 on the horizontal axis). Overall, 76.3% of the data lie inside the confidence interval. Note that given the large number of observations, the boundaries of the simulated envelope are rather narrow. Thus, we conclude that the intensity of care model achieves satisfactory concordance with the data.
Alternative models. To further investigate the results, we also consider models where the age at entry AG and the number of additional diagnoses ND are coerced into categorical variables, separately and simultaneously, with the levels used in the descriptive statistics reported in Table 3. It appears that the resulting BIC values increase importantly, which is due, to a large extent, to the increase in the number of degrees of freedom. Thus, we confirm that AG and ND should be kept as numerical variables. Furthermore, in the extant literature, the interaction term between AG and gender GE is proven to significantly affect LTC usage (see, e.g. von Strauss et al., Reference von Strauss, Agüero-Torres, Kåreholt, Winblad and Fratiglioni2003; Crimmins et al., Reference Crimmins, Kim and Solé-Auró2010; Fuino et al., Reference Fuino, Rudnytskyi and Wagner2020). Indeed, at increasing ages, the duration of stay in an institution and the intensity of care are different for males and females. In our models, however, adding this interaction term yields higher BIC values, and moreover, if added, the coefficients of the interaction terms in both models are not significant for both numerical and categorical definitions of AG.
5.5 Estimation of the overall care severity
Using selected profiles of the institutionalised elderly, we estimate the duration of stay, the intensity of care, and the overall care severity. Thereby, the overall mean care severity is estimated by
 $ \hat{S} = \hat{D} \cdot \hat{T}$
; see equation (1), where where
$ \hat{S} = \hat{D} \cdot \hat{T}$
; see equation (1), where where
 $\hat{D} = \mathbb{E}[D]$
and
$\hat{D} = \mathbb{E}[D]$
and
 $\hat{T} = \mathbb{E}[T] $
are estimated through equations (3) and (9), respectively.
$\hat{T} = \mathbb{E}[T] $
are estimated through equations (3) and (9), respectively.
Effect of the age at entry and the gender. Our first analysis looks at the care requirements along the age at entry AG and the gender GE. To present the results, we introduce a profile that we call “modal”, where for each characteristic other than AG and GE, we take the most prevalent value, that is, the mode value (see Table 3). Hence, the modal profile characterises an individual with a mental main diagnosis, a secondary diagnosis grouped under “other” and having seven additional diagnoses. The dependence of the individual is such that he or she needs help with ADL at unpredictable times (
 $DP = 7$
) and has mobility limited to the institution (
$DP = 7$
) and has mobility limited to the institution (
 $PM = 6$
), moderate disturbances of orientation (
$PM = 6$
), moderate disturbances of orientation (
 $OR = 5$
), occupational limitations in time and type (
$OR = 5$
), occupational limitations in time and type (
 $OC = 7$
), and social limitations with only primary contacts (
$OC = 7$
), and social limitations with only primary contacts (
 $SI = 6$
). Furthermore, the individual has moderate impairments in recent memory RM, perception and attention PA, impulses IM, will and motivation WM, behaviour BH, and, finally, a mild visual impairment VS.
$SI = 6$
). Furthermore, the individual has moderate impairments in recent memory RM, perception and attention PA, impulses IM, will and motivation WM, behaviour BH, and, finally, a mild visual impairment VS.
In the graphs of Figure 6, we present the estimated duration of stay
 $\hat{D}$
, intensity of care
$\hat{D}$
, intensity of care
 $\hat{T,}$
and overall care severity
$\hat{T,}$
and overall care severity
 $\hat{S}$
across the age at entry and both genders for the modal profile. We note that throughout all ages, women stay longer in the institution, and they require less help per week. Consequently, the overall care severity
$\hat{S}$
across the age at entry and both genders for the modal profile. We note that throughout all ages, women stay longer in the institution, and they require less help per week. Consequently, the overall care severity
 $\hat{S}$
of women is larger. In line with their higher life expectancy, for any age at entry, women stay longer in an institution than men (Mathers et al., Reference Mathers, Vos, Stevenson and Begg2001; Fong et al., Reference Fong, Sherris and Yap2017; Schünemann et al., Reference Schünemann, Strulik and Trimborn2017). The graph in Figure 6(a) shows that the mean duration of stay when entering an institution at 65 years is 90.5 and 61.3 months for women and men, respectively. At this age, the difference (29.2 months) between the genders is the largest. It decreases as the age at entry AG increases, and the duration of stay shortens. For example, men (women) entering at the age of 80 years are estimated to stay 36 (53) months. These values are comparable with the range of observations reported in Fuino & Wagner (Reference Fuino and Wagner2020), Tables 11 and 12. Figure 6(b) indicates that there is only a small difference in the intensity of care between the genders, the intensity yielding 750 (800) minutes/week for men (women). Indeed, we have found that the age at entry is not one of the key determinants of the intensity of care (see Table 4). Furthermore, we observe that, for any gender, the difference between the age of 65 and 100 years is only 36 minutes.
$\hat{S}$
of women is larger. In line with their higher life expectancy, for any age at entry, women stay longer in an institution than men (Mathers et al., Reference Mathers, Vos, Stevenson and Begg2001; Fong et al., Reference Fong, Sherris and Yap2017; Schünemann et al., Reference Schünemann, Strulik and Trimborn2017). The graph in Figure 6(a) shows that the mean duration of stay when entering an institution at 65 years is 90.5 and 61.3 months for women and men, respectively. At this age, the difference (29.2 months) between the genders is the largest. It decreases as the age at entry AG increases, and the duration of stay shortens. For example, men (women) entering at the age of 80 years are estimated to stay 36 (53) months. These values are comparable with the range of observations reported in Fuino & Wagner (Reference Fuino and Wagner2020), Tables 11 and 12. Figure 6(b) indicates that there is only a small difference in the intensity of care between the genders, the intensity yielding 750 (800) minutes/week for men (women). Indeed, we have found that the age at entry is not one of the key determinants of the intensity of care (see Table 4). Furthermore, we observe that, for any gender, the difference between the age of 65 and 100 years is only 36 minutes.

Figure 6 Estimated duration of stay, intensity of care and overall care severity for the modal profile.
With the estimates for the overall care severity
 $\hat{S}$
in Figure 6(c), we can observe the total burden of institutional care that comes with men and women entering an institution at different ages. Depending on the age at entry and gender, the care severity can change by a factor of five. Indeed, the estimated values for the modal profile range from 4,925 hours of care for women institutionalised at the age of 65 years to 984 hours of care for men entering the institution at the age of 100 years. We observe a decreasing trend of
$\hat{S}$
in Figure 6(c), we can observe the total burden of institutional care that comes with men and women entering an institution at different ages. Depending on the age at entry and gender, the care severity can change by a factor of five. Indeed, the estimated values for the modal profile range from 4,925 hours of care for women institutionalised at the age of 65 years to 984 hours of care for men entering the institution at the age of 100 years. We observe a decreasing trend of
 $\hat{S}$
across the ages at entry that is in line with the trend observed for the duration of stay
$\hat{S}$
across the ages at entry that is in line with the trend observed for the duration of stay
 $\hat{D}$
. While the shapes for both genders resemble each other, the care severity for women is approximately 40% higher than that for men (2,840 versus 2,050 hours at
$\hat{D}$
. While the shapes for both genders resemble each other, the care severity for women is approximately 40% higher than that for men (2,840 versus 2,050 hours at
 $AG=80$
) but decreases faster. The difference of approximately 1,350 hours at the age of 65 years is only approximately 380 hours at the age of 100 years.
$AG=80$
) but decreases faster. The difference of approximately 1,350 hours at the age of 65 years is only approximately 380 hours at the age of 100 years.
Effect of the main and secondary diagnoses. Considering the modal profile for an 80-year-old woman at entry, we present in Figure 7 the estimates for different combinations of the main D1 and secondary D2 diagnoses, as all other characteristics remain the same. From our regression analysis (see Table 4), we found that both the main and secondary diagnoses greatly influence the duration of stay, while they have only a small effect on the intensity of care. By estimating the overall care severity, we integrate the effects on both the duration and intensity. We find that the combination of mental and osteoarticular diseases (in any order) leads to the longest estimated duration of stay of approximately 62 months, also triggering the highest overall care severity of approximately 3,650 hours. We observe that a tumour as the main diagnosis is care intensive, with an intensity ranging from 845 minutes/week, in combination with an osteoarticular secondary diagnosis, to 868 minutes/week with a secondary tumour diagnosis. However, the group with a main tumour diagnosis, D1, showed the shortest duration of stay (from 17 to 27 months), leading to the lowest overall severity (from 1,040 to 1,620 hours). As with tumours, heart-related diagnoses show a lower estimated duration in both main (from 35 to 55 months) and secondary (from 23 to 56 months) diagnoses. At the same time, they yield one of the lowest intensities of care (between 825 and 845 minutes/week when considering the main diagnosis) after the group of mental diagnoses. Again, the shape of the overall care severity is driven by the duration of stay because pathologies affect the intensity of care less.

Figure 7 Estimated duration of stay, intensity of care and overall care severity for the modal profile with different main and secondary diagnoses.
Effect of the number of medical diagnoses. To investigate the effect of the number of additional diagnoses ND, we consider three profiles of an 80-year-old woman at entry with a mental main diagnosis and an “other” secondary diagnosis. First, in the “reference” profile, the considered elderly individuals have the lowest dependence levels and no other impairments. Second, in the “modal” profile, dependence and impairments take the mode values as laid out above. Third, in the “severe” profile, all dependence levels and impairments take the highest possible values (i.e., dependence Level 9 and severe impairment). Additionally, we consider a fourth profile focusing on tumours: the “tumour” profile is based on the modal profile but with main and secondary tumour diagnoses. This additional profile is motivated by the observation that a tumour diagnosis noticeably influences the duration of stay (see Figure 1(a) and Table 4).
In Figure 8, we present the estimated duration of stay
 $\hat{D}$
, intensity of care
$\hat{D}$
, intensity of care
 $\hat{T,}$
and overall care severity
$\hat{T,}$
and overall care severity
 $\hat{S}$
for the four profiles across the number of additional diagnoses ND. We observe that with more diagnoses, the duration decreases and the intensity increases for all profiles, which is intuitive. However, each profile has its own character. For example, individuals with the reference profile require the least amount of help with 300 (330) minutes/week for
$\hat{S}$
for the four profiles across the number of additional diagnoses ND. We observe that with more diagnoses, the duration decreases and the intensity increases for all profiles, which is intuitive. However, each profile has its own character. For example, individuals with the reference profile require the least amount of help with 300 (330) minutes/week for
 $ND=0$
(
$ND=0$
(
 $ND=7$
). However, they stay longer in the institution with a mean duration of 130 (90) months when
$ND=7$
). However, they stay longer in the institution with a mean duration of 130 (90) months when
 $ND=0$
(
$ND=0$
(
 $ND=7$
). This leads to an overall care severity between 2,800 and 2,120 hours. Individuals with the modal profile, on average, stay in the institution from 82 to 57 months with zero or seven additional diagnoses, respectively. At the same time, the intensity of care ranges from 770 to 840 minutes/week, leading to an overall care severity ranging from 4,480 to 3,380 hours and decreasing with ND.
$ND=7$
). This leads to an overall care severity between 2,800 and 2,120 hours. Individuals with the modal profile, on average, stay in the institution from 82 to 57 months with zero or seven additional diagnoses, respectively. At the same time, the intensity of care ranges from 770 to 840 minutes/week, leading to an overall care severity ranging from 4,480 to 3,380 hours and decreasing with ND.

Figure 8 Estimated duration of stay, intensity of care and overall care severity along the number of additional diagnoses for different profiles.
Individuals with the severe profile stay in the institution slightly less long than the modal profile (range from 77 to 53 months). However, in contrast to the modal profile, individuals with the severe profile are the most demanding for help in their daily needs, with the care intensity ranging from 1,770 to 1,910 minutes/week. Thus, the resulting care severity is almost doubled compared to the modal profile (range from 9,640 to 7,200 hours). Finally, from Figure 7(b), we note that individuals with the tumour profile require, on average, 30 minutes of care per week less than elderly individuals with the modal profile. However, the duration of stay of these persons is only 24 months if they do not have any additional diagnoses (
 $ND=0$
). This duration even reduces to 17 months when
$ND=0$
). This duration even reduces to 17 months when
 $ND=7$
. As a result, the overall care severity of the tumour profile is the lowest, ranging from 1,380 to 1,040 hours.
$ND=7$
. As a result, the overall care severity of the tumour profile is the lowest, ranging from 1,380 to 1,040 hours.
6. Conclusion
In this paper, we propose a model to assess the total LTC burden based on the time spent in institutionalised care and the intensity of care provided to elderly individuals. We empirically estimate the model parameters using a private dataset comprising approximately 21,758 individuals from nursing homes in Switzerland. Due to the longitudinal nature of the right-censored data, we relied on survival analysis methods and used an AFT model for the duration of stay. After the age at entry and gender, we found that the pathologies were the key factors affecting the duration of stay in the institution before death. More precisely, individuals with mental and osteoarticular diseases stay the longest, while elderly people with tumours have the shortest duration. Further determinants of the duration are the dependence on ADL and physical mobility limitations. Finally, we find that some mild and moderate levels of physical and sensory function impairments are likely to receive less attention from nurses, which is linked to a reduced duration of stay.
We parameterise a beta regression model for the intensity of care to estimate the mean number of minutes of care per week that a person receives. While we show that pathologies have a minor effect on the amount of help, the key determinants are different limitations in ADL, physical mobility, orientation in space, and occupation. Our results further suggest that psychological and sensory function impairments shape only the distribution of the intensity of care, rather than considerably affecting the mean. Finally, we explore the results by studying selected profiles of the institutionalised elderly individuals. Thereby, we illustrate the overall care severity as the product of the duration of stay and intensity of care. We find that women entering an institution have a higher total care burden than men. We also show that mental and osteoarticular diseases lead to the highest overall severity, mainly resulting from the higher duration of stay. At the same time, tumours lead to the lowest duration of stay, resulting in the lowest care burden.
Our results are directly relevant for policy-makers and the planning of care capacity in institutions. The decomposition of the total number of hours of care in duration and intensity, or, in other words, in the occupancy period of a bed and in the utilisation of care resources, is relevant for deriving actionable policies. On the one hand, the length of stay in an institution drives the number of required places for LTC and the construction of infrastructure. On the other hand, the amount of help needed directly relates to the number of personnel and the education of caregivers. It is also a useful indicator to measure the efficiency of prevention measures, for example, to slow down the aggravation of medical conditions and to contain the increase in required care. Planning the future capacity of institutions and the handling of dependence at large must combine both dimensions of occupancy and prevention while supporting the efforts with policies promoting ageing at home associated with an efficient use of care resources.
In our work, we link demographic factors and medical diagnoses to the care requirements of elderly individuals. The care severity estimate gives an indication of the number of hours of care needed. Hence, it provides an estimate for the future care costs of an elderly individual upon entering an institution. The indicator can help to make the pricing of LTC coverage more precise. For example, innovative insurance contracts could evaluate the one-time premium to guarantee a life annuity underwritten at the moment of entering a care institution. While a large part of the care costs are financed today by health insurers, copayments are required by the elderly individuals to finance their stay in the institution. These may be more important depending on the type of institution (e.g., private and public facilities) and specific types of care (e.g. medical nursing and social company). While the numerical results may vary across countries and populations, we trust that our findings provide relevant indicators when assessing the LTC burden in institutions beyond Switzerland. Indeed, care severity is based on health conditions rather than on country-specific variables.
We provide robust results on institutional LTC estimates solely using information on elderly individuals from the moment when they enter an institution, that is, in this work, we consider only the first individual health evaluation. During the time in the institution, the health status evolves, and new evaluations are conducted every 1 or 2 years. With typically deteriorating health conditions, more information can provide updates on the remaining duration of stay and, more importantly, on the intensity of care, which, on average, increases. Therefore, since our model does not consider the care intensity dynamics, our estimates can potentially be enhanced. Furthermore, the study of the development of the different medical conditions and limitations over time could provide further insight and extend this work. Additionally, it is of interest to derive patterns from the data and to establish key profiles of elderly individuals to further understand the main drivers of the need for care and to better assess the corresponding workload for the personnel. Finally, in this paper, we have approximated the total care burden considering the product of duration and intensity. This approximation holds best if both factors are independent. Further research could study the dependence structure between the two dimensions.
Acknowledgment
Michel Fuino and Joël Wagner acknowledge financial support from the Swiss National Science Foundation (grant no. 100018_169662). All authors are thankful to the General Directorate for Health of the Republic and Canton of Geneva for providing the data used in this study.


 Open access