


Writing in 1919, the economist Alfred Marshall opined that the performance of large British businesses lagged far behind that of the United States and Germany. For Marshall, the chief problem was that ownership had separated from control in public companies and that they were managed by amateurs. As a result, they lacked vigor, which in turn had an adverse effect on national prosperity (Marshall Reference Marshall1919, pp. 316, 328). He goes on to suggest that the only solution to what he termed this “evil” was to follow the U.S. example and have shareholders empower autocratic and appropriately educated and trained managers.
Was Marshall right? Scholars have suggested that the managerial inefficiency in British railway companies at the turn of the twentieth century may have been partly due to their very diffuse ownership structure (Arnold and McCartney Reference Arnold and McCartney2005; Crafts, Leunig, and Mulatu Reference Crafts, Leunig and Mulatu2008; Mitchell, Chambers, and Crafts Reference Mitchell, Chambers and Crafts2011). However, to date, we have relatively little evidence about the relationship between ownership structure and firm performance in the early twentieth century.
An older tradition in business and economic history does not share Marshall’s view. This tradition is of the view that British management in the Edwardian era was amateurish chiefly because the ownership of public corporations was concentrated in the hands of families (Payne Reference Payne1967, 1984; Elbaum and Lazonick Reference Elbaum and Lazonick1984; Gourvish Reference Gourvish1987; Chandler Reference Chandler1990, p. 240; Wilson Reference Wilson1995, p. 154).Footnote 1 This managerial amateurism may have had deep cultural roots in the fact that industry and commerce were socially looked down upon in Britain. Consequently, many industrialists and businessmen aspired to become gentlemen and sent their progeny to elite schools, which blunted any business and managerial acumen they may have possessed (Coleman Reference Coleman1973; Wiener Reference Wiener1981). Amateurism may also have had deep-seated legal roots in that the investor protection necessary to facilitate the move away from concentrated family ownership was not available until well into the twentieth century (La Porta, Lopez-de-Silanes, and Shleifer Reference La Porta, Lopez-de-Silanes and Shleifer1999, 2008; Coyle, Musacchio, and Turner Reference Acheson, Campbell and Turner2019).
In this paper, we ask whether Marshall’s view is correct by examining the ownership and control of circa 1,700 of the largest public companies listed on U.K. stock exchanges in 1911. Our sample covers a wide range of industries and is much more representative than those used in previous studies. The first thing we do is examine the directorial ownership of these firms using a unique data source. We find that on average there was a separation of ownership from control. Nevertheless, there were 263 public companies where directors owned more than one-third of the capital and 125 where the directors owned more than 50 percent of the capital.
We then examine if ownership and control ultimately matter for the performance of firms. Using profitability, dividend, stock market, and longevity data, we analyze whether the presence of diffuse ownership, concentrated ownership, and family ownership were correlates of poor performance for Edwardian public companies. We find no relationship between performance and director ownership.
We then move on to examine the characteristics of those individuals who managed companies. It is important to do this for at least two reasons. First, the separation of ownership from control meant that the manager of such a company was in an influential position. As Marshall recognized, this influence could have been detrimental to shareholders because of potential agency problems (Jensen and Meckling Reference Jensen and Meckling1976; Fama and Jensen Reference Fama and Jensen1983). Indeed, Marshall was of the view that managers of British companies were amateurish. Second, according to upper echelons theory, the performance of firms reflects the observable characteristics of their top manager (Hambrick and Mason Reference Hambrick and Mason1984; Hambrick Reference Hambrick2007). Our main finding is that proxies for the amateurism of the chairmen of British companies had little effect on performance.
Overall, our evidence suggests that business and economic historians may need to look elsewhere for the roots of Britain’s relative corporate demise. Most public companies had diffuse ownership, which had little bearing on corporate performance. Moreover, we find that there is no evidence that the presence of potentially amateurish managers adversely affected corporations during the Edwardian era.
This paper contributes to several interconnected strands of literature. First, it contributes to the recent literature that has challenged the older tradition that ownership was concentrated. Foreman-Peck and Hannah (Reference Foreman-Peck and Hannah2012, 2013) show that ownership was divorced from control for the 300 largest British companies in 1911. Relatedly, Hannah (Reference Hannah2007) and Braggion and Moore (Reference Braggion and Moore2011) have suggested that diffuse ownership was commonplace by c.1900, and Acheson et al. (Reference Acheson and Gareth Campbell2015) show that ownership was relatively diffuse among smaller public companies in the second half of the nineteenth century.
Second, it contributes to the debate over when ownership separated from control in the United Kingdom. Much of the extant literature suggests that the separation of ownership from control in the United Kingdom happened at some point in the second half of the twentieth century (Florence Reference Florence1961; Nyman and Silberston Reference Nyman and Silberston1978; Scott Reference Scott1990; Leech and Leahy Reference Leech and Leahy1991; Cheffins Reference Cheffins2001; Coffee Reference Coffee2001; Franks, Mayer, and Rossi Reference Gourvish2009). Our paper speaks to this debate by categorically showing that for most firms, ownership had separated from control by 1911, but that there was a rump of industrial companies where ownership was concentrated in the hands of families.
Finally, our paper contributes to the rather sparse literature on the leaders of public companies in the Victorian, Edwardian, and interwar eras. Apart from Stanworth and Giddens’ (1974, 1975) sociological study of company chairmen and directors in the first seven decades of the twentieth century, Gourvish’s (1973) study of the general managers of railways, Nicholas’s (1999a) study of entrepreneurial performance, and despite the production of a dictionary of business biography (Jeremy Reference Jeremy1984), there have been few systematic studies looking at the characteristics and backgrounds of the leaders of public companies. This neglect has been long standing and may arise from what Wiener (1981) argued was a deeply ingrained anti-business and pro-aristocratic culture in Britain. As well as addressing this lacuna, our study also contributes to modern and general debates about CEO characteristics (Hambrick and Mason Reference Hambrick and Mason1984; Cappelli and Hamori Reference Cappelli and Hamori2005; Wang et al. Reference Wang2016).
DATA
Our examination of ownership and control in the Edwardian era in a comprehensive fashion is only possible because of a publication called The Investors’ Four Shilling Yearbook (IFSY), which was published for four years before WWI. The object of the yearbook was “to provide a handy and accurate record of the position of every important corporate body or undertaking whose securities are quoted in the United Kingdom,” and it was aimed at investors “however inexpert in finance” (IFSY 1912, p. v).
The 1912 edition of the yearbook reports, for most companies, the total amount of shares owned by the board of directors in terms of the par value of ordinary and preference shares in 1911. Unlike other information or figures reported in the yearbook, the computation of this figure would have required substantial effort to calculate and collate because the yearbook’s researchers would have had to trawl through annual lists of shareholdings held at Somerset House and other registries to find out the share ownership of individual directors (Foreman-Peck and Hannah Reference Foreman-Peck and Hannah2012, p. 1218). The researchers also estimated the number of share-holders in these lists, and the approximate number of shareholders in each company is reported to the nearest 100. We suspect that this cost is why the effort to gather this ownership information was not repeated.
We use the amount of capital owned by directors as reported by IFSY as our measure of the degree of separation of ownership from control. There are several caveats to using this figure. First, it is possible that the wives of directors or other close relatives owned shares, meaning that the true ownership of their husbands was much higher. In the Online Appendix, we examine a small sample of the original forms from which the director ownership data was compiled. We find little evidence of wives owning substantial shares. Second, it is possible that there were large owners who were not directors (see Online Appendix Table 11). Such large owners did exist in a sample of companies before 1900, but they were uncommon (Acheson et al. Reference Acheson and Gareth Campbell2015). However, we are interested in the separation of ownership from control and not the degree of ownership concentration, so the fact that there may have been large owners who were not directors does not affect our analysis.
There are 1,693 companies reported in the 1912 edition of the IFSY. Foreman-Peck and Hannah (2012) suggest that the yearbook was comprehensive with very few notable omissions—the only sector that was omitted was foreign mining. These 1,693 companies would have been the largest reported in the Stock Exchange Yearbook (1912) and together they comprised £1.807 billion of share capital. Essex-Crosby’s (1937, p. 226) figures show that there were 5,337 companies registered under the Companies Acts in the Stock Exchange Official Intelligence in 1914. This figure excludes Irish, foreign, and all British statutory companies (in other words, those companies incorporated by the Crown or Parliament). Therefore, our sample is (at best) c.25 percent of all public companies in 1911. In terms of capitalization, our companies in 1911 are c.45 percent of the total share value quoted in the Investor’s Monthly Manual in 1913.2 The companies in the Investor’s Monthly Manual, but not in the IFSY were primarily small firms that were not as popular with investors.
Because we wanted to know who had managerial control of these companies and the voting rights attached to shares, and because these details were not reported in the IFSY, we collected data on these from the 1912 Stock Exchange Yearbook. In terms of managerial control, we obtained the names of chairmen. We also collected board size and the number of peers and Members of Parliament (MPs) on boards.
The next step in the data collection was to obtain the biographies of the chairmen of our 1,693 companies. To do this, we used Herbert Bassett’s Businessmen at Home and Abroad (Bassett Reference Bassett1912). This publication was a biographical dictionary of the directors of the most important companies registered in the United Kingdom. The book was an impartial and independent dictionary because those listed in it did not pay to be included and were not obligated to buy a copy. Furthermore, the directory appears to have no geographical bias because Bassett (Reference Bassett1912, p. iii) used a nation-wide network of associates to collect biographical information. This also was not Bassett’s first foray into creating a biographical dictionary (Bassett 1900). Furthermore, he had been on the editorial staff of the Financial Times, and was the editor of the Financial Review of Reviews, Bradshaw’s Railway Manual, and the IFSY. In other words, Businessmen at Home and Abroad can be viewed as being well-informed, comprehensive, and accurate.
We found biographical details for 806 of our chairmen. The biographical details reported in Bassett (Reference Bassett1912) include the year of birth, other directorships, club membership, education, career prior to being a chairman, and whether they had been an officer in the military. We assume that when nothing is reported for several categories, then that means the individual had not been an officer in the military, did not receive a formal university or elite school education, was not and had not been an MP, was not a Justice of the Peace or Deputy Lieutenant, and was not a director at another company.Footnote 3 In terms of career background, we are interested in whether the chairman had been an accountant, banker, engineer, lawyer, or merchant. Unfortunately, the career background of every chairman or director is not reported. We therefore make no assumptions about the career backgrounds of these individuals.
The final step was to collect data to test whether ownership structure and the background of the chairman were correlated with firm performance. In terms of accounting performance measures, the IFSY contains total asset figures and net profit figures for the majority of companies. In terms of market measures of performance, we obtained the end-of- December 1910 price of ordinary shares for just over 950 of our companies from the Investor’s Monthly Manual. We also collected dividend yields from this same source. Finally, because we are interested in viewing performance in terms of survival (Alchian Reference Alchian1950), we use the Register of Defunct Companies (1979, 1990) to determine when and why companies disappeared.
Online Appendix Table 1 describes all the variables used in this paper as well as the data source for each variable. The replication kit is available at Aldous, Fliers, and Turner (Reference Aldous, Fliers and Turner2022).
Table 1 DESCRIPTIVE STATISTICS

Notes: See Online Appendix Table 1 for variable definitions.
Sources: See text and Online Appendix Table 1.
OWNERSHIP STRUCTURE
The descriptive statistics in Table 1 reveal that of the 1,693 companies reported in IFSY, director ownership data was reported for 1,548 companies. Before looking at director ownership, we note several things about our sample. First, in terms of company characteristics, there is a good spread in terms of company age and company size, which are potential determinants of ownership (Demsetz and Lehn 1985). In addition, firm leverage, another potential covariate of ownership, is relatively low for most companies.
Second, companies with foreign operations may have faced greater agency costs in the Edwardian era and therefore had more concentrated ownership (Acheson, Campbell, and Turner Reference Acheson, Campbell and Turner2019). Notably, 31.7 percent of companies have foreign operations, which is representative of the U.K. stock market at the time (Rogers, Campbell, and Turner Reference Rogers, Campbell and Turner2020).
Third, the place where shares are traded and listed may have influenced ownership for several reasons. Listing rules of the London Stock Exchange in this era required two-thirds of capital to be issued to the public (Melsheimer and Laurence Reference Melsheimer and Laurence1905; Hannah Reference Hannah2007; Cheffins, Koustas, and Chambers Reference Cheffins, Koustas and Chambers2013). In addition, an official listing on the London market was a signal of firm quality that may have promoted diffuse ownership (Fjesme, Galpin, and Moore Reference Fjesme, Galpin and Moore2021). Finally, shares listed on multiple exchanges may have been more liquid, which may have influenced ownership concentration (Rogers, Campbell, and Turner Reference Rogers, Campbell and Turner2020). From Table 1, we see that there is a good spread in our sample between companies listed on the London market and those listed on other U.K. stock exchanges. There is also a representative split between those listed on the official list and those on supplementary lists.
Table 1 shows that ownership was separated from control for most companies, with the median and mean of director ownership being 8.9 and 17.2 percent, respectively. These figures are much higher than those reported in Foreman-Peck and Hannah (Reference Foreman-Peck and Hannah2012) because they only focused on the 337 largest companies in 1911, but they are on a par with what Acheson et al. (Reference Acheson and Gareth Campbell2015) report for the Victorian era. However, there were companies where ownership was not separated from control—directors owned one-third or more of the capital in 17.0 percent of companies, and they owned more than one-half of the capital in 8.1 percent of companies.
The ownership figures reported in Table 1 are based on cash flow rights. Ideally, we would convert these into control rights, but our data sources do not allow us to do this because director ownership is not reported on an individual basis. However, as can be seen from Table 1, 73.0 percent of companies had one-share-one-vote, which means that for these firms, control rights and cash flow rights were equivalent. A further 13.4 companies had 1 vote per x shares, where x was typically 5. The wedge between the control and cash flow rights of the directors of such firms would have been very small. The other 13.6 percent of firms had non-linear voting structures or capped the maximum number of votes that any one shareholder had. In addition, over 50 percent of companies granted owners of preference shares similar voting rights to those attached to ordinary shares, which implies that the voting and cash flow rights for the directors of these companies would have been similar irrespective of the type of shares that they owned.
How much control did directors ultimately have even when ownership was relatively diffuse? Small board sizes (see Table 1) would have facilitated coordinated action by directors. However, working in the opposite direction was the small shareholder base in most companies (see Table 1), which would have made it much easier for shareholders to exercise a voice in company affairs, particularly because company articles of association typically permitted the use of a poll (which would have been the equivalent of one shareholder one vote) and only applied voting schemes if enough shareholders (usually five) requested it (Acheson, Campbell, and Turner Reference Acheson, Campbell and Turner2019).
Online Appendix Table 2 reveals that there was a substantial variation in ownership structure across industries. Utilities and transportation industries had the most diffuse ownership, which was partly a function of their size and capital needs. At the other end of the spectrum were merchants, breweries, paper and printing, and engineering. These companies were typically smaller and younger. The only surprising result in Online Appendix Table 2 is that banks and insurance companies appear to have a lot of director ownership. However, this is because the boards of these companies were on average twice the size of other companies in the sample. Furthermore, these companies were far more likely to have voting structures such as graduated voting and upper limits on votes, with the result that the concentration of voting rights was less than that of cash flow rights.
Table 2 COVARIATES OF OWNERSHIP STRUCTURE

Notes: The dependent variable in specifications 1 to 3 is the natural logarithm of the percentage of director ownership. In specification 4, the dependent variable is a binary variable = 1 if director ownership is great than one-third, 0 otherwise. In specification 5, the dependent variable is a binary variable = 1 if director ownership is great than one-half, 0 otherwise. t-statistics calculated via robust standard errors are in parentheses. Significance is shown by ***p < 0.01, **p < 0.05, *p < 0.1.
Sources: See Online Appendix Table 1 for sources and variable definitions.
We identify family firms by ascertaining if a director’s name is also part of the company’s name. Although this is likely to underestimate the number of family firms, circa 25 percent of our sample consists of family firms (Table 1). Notably, the mean director ownership for family companies is 29.6 percent versus 12.8 percent for non-family companies.
Because ownership varied across family firms and industries, we explore further the covariates of director ownership using an OLS regression. This approach also allows us to see the relationship (if any) between director ownership and voting structures. Both Hilt (Reference Hilt2008) and Musacchio (Reference Musacchio2009) suggest that voting rights are an important determinant of ownership structure.
We regress our explanatory variables in Table 1 on the natural logarithm of director ownership. We also regress these variables on our two binary director ownership variables (in other words, Directors > 1/3 and Directors > 1/2) using a logit regression. We control for industry fixed effects in all specifications and cluster the standard errors at the firm level.
The regression results in Table 2 bear out the strong positive relationship between director ownership and being a family firm. Family firms have approximately 78 percent higher director ownership in our sample. Indeed, the variance decomposition of specifications 1, 4, and 5 reveals that family firms play the largest explanatory role, with 23 to 26 percent of the explained variation being attributable to this variable alone. This implies that ownership was not separated from control for the average family firm.
Table 2 reveals that board size is positively related to director ownership, whereas the number of shareholders is negatively related. These are likely to be mechanical relationships. The presence of MPs and peers on boards may have been viewed as providing independent reassurance to small investors, thus facilitating a separation of ownership from control. Alternatively, they may have been viewed as ornamental directors (Campbell and Turner 2011; Grossman and Imai 2016). The coefficients on the MPs on board and Peers on board variables support the latter view.
In terms of firm attributes, Table 2 reveals that larger and older firms had a greater separation of ownership from control. The former had greater capital needs and therefore needed to draw from a wider pool of owners, and shares in older companies had had more time to diffuse. The coefficient on the Leverage variable suggests that it is unrelated to director ownership apart from when director ownership exceeds one-third and one-half. In other words, firms with high levels of director ownership were much less leveraged than their peers. This may reflect risk aversion on the part of directors.
The results in Table 2 suggest that companies with foreign operations are more likely to have diffuse ownership. This is somewhat counterintuitive because one would expect that firms with overseas operations may have faced greater agency costs because of distance and greater information asymmetries. However, such firms typically mitigate agency costs by offering shareholders greater protection in their articles of association (Acheson, Campbell, and Turner Reference Acheson, Campbell and Turner2019). Furthermore, the threat of expropriation by foreign governments and their intrinsically risky nature may have discouraged directors from holding large stakes in such companies.
In terms of voting schemes, there is no indication from the results in Table 2 that the voting rights of ordinary shares were related to director ownership, which would suggest that cash flow rights and voting rights were closely aligned. However, the results suggest that if preference shares have votes, then director ownership is lower. Notably, when we split our sample out into family and non-family firms, the coefficient on the preference share voting variable becomes insignificant in the subsample of family firms and loses much of its economic significance in the subsample of non-family firms. These results are consistent with family firms maintaining control by issuing non-voting preference shares.
With regards to where shares were listed and traded, the only variable of statistical significance is the Official list variable, which indicates that the listing requirement that two-thirds of capital be issued to the public was associated with lower levels of director ownership.
DID OWNERSHIP STRUCTURE MATTER?
Alfred Marshall believed that many large U.K. companies lacked vigor because ownership was separated from control. In this section, we explore whether diffuse ownership is correlated with firm performance. In terms of firm outcomes, we use return on assets as our accounting measure of performance and Tobin’s Q as one of our market-based measures of performance. The former measures the efficiency with which managers run the firm. Tobin’s Q, on the other hand, is a measure of how well the firm is run from the perspective of shareholders.
Accounting historians cast doubt on the usefulness of net profit and total asset figures for comparing business performance before the reforms introduced in the Companies Act of 1948 (Marriner Reference Marriner1980; Arnold Reference Arnold1996, 1997; Arnold and Matthews Reference Arnold and Matthews2002; Pitts and Boyns Reference Pitts and Boyns2011; Boyns Reference Boyns2021). They suggest three major weaknesses with financial statement data: the use of hidden reserves, consolidation of accounts, and non-standardized depreciation practices. However, the first two of these only became problems after 1914 (Davies and Bourn Reference Davies and Bourn1972; Edwards Reference Edwards1991; Edwards and Boyns Reference Edwards and Boyns1994; Arnold Reference Arnold1996, 1997) and the third, to the extent that it existed, is somewhat mitigated by using industry fixed effects in our regression analysis.
Because of this potential weakness with accounting data, we also use dividend yield as an alternative market-based measure of performance. Although dividends in this era were less subject to manipulation and were regarded as an important metric of performance by shareholders, they were discretionary (Turner, Ye, and Zhan Reference Turner, Ye and Zhan2013). Therefore, we must interpret our results with care because the signaling value of dividends means that dividend payouts may have differed across firms for strategic reasons, whereas all firms were trying to push profits and firm values as high as possible (Turner, Ye, and Zhan Reference Turner, Ye and Zhan2013). Finally, we use a time-to-failure variable as an additional performance measure. This variable is a binary variable that measures whether or not a company failed (in other words, went into bankruptcy) within a particular time period (ranging from 10 to 30 years). We categorize failed firms as those that were liquidated or dissolved; companies that merged, were nationalized, or went private were not deemed to have failed. One can think of this as a Darwinian approach to firm performance (Alchian Reference Alchian1950).
If Marshall was correct, then firms with concentrated ownership would perform better than their peers. On the other hand, if the old traditional view is correct, then concentrated ownership would result in lower performance. However, an alternative hypothesis is that ownership is endogenous, with the result that it has no discernible effect on firm performance (Demsetz and Lehn Reference Demsetz and Lehn1985).
From Table 1, which shows the descriptive statistics for our performance variables, we can see that we only have Tobin’s Q, dividend yield, and time to failure for a subset of our sample.Footnote 4 As can be seen from Online Appendix Table 3, the subset of the sample for which we have these performance measures differs from our main ownership sample reported in Tables 1 and 2. Unsurprisingly, we find that the sample of firms for which we have performance metrics is tilted toward larger firms with more dispersed ownership. While we understand that this might result in a selection bias, thankfully, as can be seen from Online Appendix Table 3, the subset of firms for which we have return on assets does not differ from our main sample.
Table 3 OLS RESULTS FOR DIRECTOR OWNERSHIP AND FIRM PERFORMANCE

Notes: t-statistics calculated via robust standard errors are in parentheses. Significance is shown by ***p < 0.01, **p < 0.05, *p < 0.1.
Sources: See Online Appendix Table 1 for sources and variable definitions.
In order to assess how director ownership correlates with return on assets, Tobin’s Q, and dividend yield, we use an OLS regression and regress director ownership and control variables on the three performance variables. We use industry fixed effects to address some of the omitted variable bias. Table 3 reports the regression results. To explore the relationship between director ownership and time to failure, we use a logit regression model to estimate the effect of director ownership on time to failure. The results from this regression are in Table 4.
Table 4 LOGIT RESULTS FOR DIRECTOR OWNERSHIP AND FIRM FAILURE

Notes: The dependent variable in each specification is a binary variable if the time to firm failure ≥ 10, 15, 20, 25 years. z-statistics calculated via robust standard errors are in parentheses. Significance is shown by ***p
< 0.01, **p < 0.05, *p < 0.1. Coefficients reported are expressed as marginal effects.
Sources: See Online Appendix Table 1 for sources and variable definitions.
The results in specification 2 of Table 3 reveal that companies with higher director ownership had superior returns on assets—a one standard deviation increase in director ownership is associated with a 10 percent increase in return on assets. This result appears to be driven by those firms where directors own more than 50 percent of the shares (see Online Appendix Table 4). Interestingly, the coefficient on the family firm variable is positive and statistically significant in specification 2 in Table 3, which suggests that they were more efficiently run. Because of the close relationship between director ownership and family firms (see Table 2), in Table 5, we interact the variable Family firm with the director ownership variable. When we do this, ownership and family firms are no longer correlates of return on assets. However, when family ownership is interacted with the Directors>1/2 (see Online Appendix Table 5), the interaction term is significant and positive, suggesting that family firms with high director ownership performed better than other firms.
Table 5 REGRESSION RESULTS WITH INTERACTION BETWEEN FAMILY FIRMS AND OWNERSHIP

Notes: In regressions 1 to 4 OLS is used and in regressions 5 and 6 a logit model is used. t-statistics calculated via robust standard errors are in parentheses. Significance is shown by ***p < 0.01, **p < 0.05, *p < 0.1. Because Tobin’s Q is highly skewed, we follow the usual practice in the literature of capping it at 10. Coefficients reported are expressed as marginal effects.
Sources: See Online Appendix Table 1 for sources and variable definitions.
We can also see from Table 3 that there is no relationship between Tobin’s Q or dividend yield and director ownership. While the effects cannot be generalized (due to the lack of statistical significance), the point estimates are not trivial. We find that a one standard deviation increase in ownership increases Tobin’s Q by approximately 2.6 percent and decreases dividend yield by approximately 17 percent.Footnote 5 As can be seen from Table 5, the same result holds when we interact director ownership and family firms. Furthermore, these results hold when alternative measures of director ownership are used (see Online Appendix Table 4).
As we can see from the results in Table 4, our two measures of time to failure and ownership are uncorrelated.Footnote 6 We can also see that there is no relationship between the time-to-failure measures and being a family firm. The introduction of interaction terms into the regression specification (Table 5) and the use of alternative measures of director ownership (Online Appendix Table 4) do not change these results. One might argue that companies could have changed their ownership structure very quickly after 1911, with the result that doing this type of analysis tells us very little. However, given that ownership structure takes substantial time to change and is often path dependent (Bebchuk and Roe Reference Bebchuk and Roe1999), one can reasonably expect that the ownership structure in 1911 persisted for quite some time afterward. Thus, from this Darwinian and long-run perspective, neither Marshall nor the holders of the older traditional view were correct.
As our sources only report cash flow rights, we could potentially mismeasure the degree of separation of ownership from control. To address this issue, we limit our sample to the 73 percent of companies that have one-share-one-vote rules and rerun our regressions. The results in Online Appendix Table 6 suggest that our findings are qualitatively unchanged.
Table 6 CHAIRMAN CHARACTERISTICS

Sources: See text and Online Appendix Table 1 for sources and variable definitions.
The relationship between director ownership and firm performance may differ in important ways across types of companies, for example, young and old firms, large and small firms, and firms in old and new industries (Braggion and Moore Reference Braggion and Moore2013). We look for heterogeneity along these dimensions. The results in Online Appendix Table 7 show that there is no difference in the relationship between ownership and performance when we split our sample along these three dimensions.
Table 7 REGRESSION RESULTS FOR CHAIRMAN CHARACTERISTICS AND FIRM CHARACTERISTICS
Notes: t-statistics calculated via robust standard errors are in parentheses. Significance is shown by ***p < 0.01, **p < 0.05, *p < 0.1. For all logit regressions, we report odds-ratios.
Sources: See Online Appendix Table 1 for sources and variable definitions.
Thus far, we have assumed that the relationship between director ownership and firm performance is linear. However, the relationship could be nonlinear in that, up to some point, performance rises with director ownership, but after a certain point in the ownership spectrum, performance begins to decline (Morck, Shleifer, and Vishny Reference Morck, Shleifer and Vishny1988; McConnell and Servaes Reference McConnell and Servaes1990). To test for this possibility, we introduce a squared director ownership variable into our regressions. The results, which are in Online Appendix Table 8, suggest that there is not a curvilinear relationship between director ownership and performance.
Taken together, our results suggest that ownership structure ultimately did not matter for firm performance. While part of this conclusion is drawn based on the absence of statistical significance, we also report variance decompositions in Table 3 and Table 4. We find that, at best, the firm’s ownership structure explains approximately 1.8 percent of the observed variation in our data. No matter how we measure performance, companies with a separation of ownership from control performed no differently than those with concentrated ownership or, in the case of ROA, performed better. Notably, the coefficient on the number of shareholders variable is positive and significant in Tobin’s Q and ROA regressions in Table 3. Although this variable is an imperfect measure of the degree of separation of ownership from control, it offers further evidence that contradicts Marshall’s claim that widely held firms performed worse.
Because of endemic endogeneity problems, we cannot make strong causal claims about the relationship between director ownership and firm performance. Nevertheless, we do our best to mitigate these concerns. In Tables 3 and 4, we present a univariate regression, then augment our model with control variables, and only in the third specification do we include industry fixed effects. To the extent that observable and unobservable controls are correlated, the changes in the coefficient of ownership from one specification to another might give us a hint as to the direction of causality. We find that only for Tobin’s Q does such a change occur. However, this effect is largely driven by the inclusion of return on assets as one of our controls.Footnote 7
WHO WERE THE MANAGERS?
In the previous section, our evidence suggests that if U.K. firms lacked vigor, it was not because of their ownership structure or the involvement of families. Perhaps it was because too many companies had amateurish managers. Marshall believed that the managers of diffuse firms (which make up over 75 percent of our sample) were amateurs and were unsuited to the task of managing large and complex organizations, unlike managers in the United States. On the other hand, the older traditional view suggests that family ownership equated to amateur management because genetics was prioritized over talent when it came to appointing managers.
Who were the managers or CEOs (to use modern parlance) of public companies in 1911? For Alfred Marshall, the chairman was the individual who had the most power in public companies (Marshall Reference Marshall1919, p. 311). This was particularly the case if they combined the post with being a managing director (Foreman-Peck and Hannah Reference Foreman-Peck and Hannah2012, p. 1223).Footnote 8 In terms of our 1,693 companies, 889 of them distinguished among directors just the chairman, 688 had a separate chairman and managing director, 58 had only a managing director, and 58 appear to have been run by a committee of directors (in the sense that they did not name any director as occupying such posts).Footnote 9 Thus, given this dominance of chairmen, and taking on board the view of Marshall, we focus our analysis on the chairmen of our sample companies.
Obtaining biographical information on chairmen from 1911 was only possible thanks to Bassett (1912), which reports biographical information for 51.0 percent of the chairmen in our sample. One might be worried that our chairman data has a selection bias that makes it non-representative. However, as can be seen from Online Appendix Table 9, our chairman sample is representative of our overall sample in terms of director ownership and family firms. Nevertheless, in terms of firm size and some correlates of it, the chairman sample contains slightly larger companies.
What constitutes an amateurish chairman in Edwardian Britain? We consider three aspects of the degree of amateurism of managers: (1) practical business experience in their career; (2) human capital in the form of education; and (3) the size of their corporate network as measured by the number of other directorships they hold.
We consider a chairman to be amateurish if they have ascended to their managerial position based on their social status rather than practical business experience. Of course, some individuals from an elite social background may make good managers of a complex business organization, but the absence of business experience will hamper the effectiveness of the average manager from this background.
In terms of human capital, we consider the education of managers. There is a long-running debate on the effect of elite private schools and education on British industry. One view is that elite private schools did not prepare pupils for a business career because their curriculum was focused on the classics at the expense of science and commerce, and they encouraged gentrification at the expense of the nation’s economic life (Ward Reference Ward1967; Coleman Reference Coleman1973; Allen Reference Allen1979; Sanderson Reference Sanderson1988). Berghoff (Reference Berghoff1990) and Rubinstein (Reference Rubinstein1988), on the other hand, suggest that there is no evidence for the negative effect of elite private schools on business.
Cognitive ability is a strong predictor of job performance by managers and CEOs, and there is a very close correlation between academic achievement in the form of a university education and job performance (Wally and Baum Reference Wally and Robert Baum1994; Kuncel, Hezlett, and Ones Reference Kuncel, Hezlett and Ones2004; Falato, Li, and Milbourn 2015). However, similar criticisms as to those for elite private schools have been leveled at the Oxford and Cambridge universities, particularly in the nineteenth century when the average chairman in our sample was of university age, in that they did not typically offer subjects of direct relevance to business and industry (Sanderson Reference Sanderson1999, pp. 48– 53).
The third aspect of amateurism we look at is whether managers have other directorships. A chairman with multiple directorships may indicate a superior managerial skillset or social connections and can give firms strategic benefits (Galaskiewicz Reference Galaskiewicz1985; Pfeffer Reference Pfeffer1991; Geletkanycz, Boyd, and Finkelstein Reference Geletkanycz, Boyd and Finkelstein2001; Fich and Shivdasani Reference Fich and Shivdasani2006). It may also suggest better or preferential access to knowledge and finance (Boyd Reference Boyd1990; de Jong, Fliers, and Westerhuis Reference de Jong, Fliers and Westerhuis2021). In addition, interlocking directorships may foster collusion with firms in the same industry, with subsequent monopoly effects (Battaggion and Cerasi Reference Battaggion and Cerasi2020). There can also be a potential downside to chairmen having multiple directorships—they might be too “busy” to give their chairmen role enough time and focus (Fich and Shivdasani Reference Fich and Shivdasani2006). This will be particularly the case when a chairman is also a chairman of another company.
From Table 6, we see that in terms of background, the chairmen in our sample fall into two broad categories. The first category consists of those who have a business background and deep experience in engineering, law, accounting, banking, or mercantile trades. As can be seen from Table 6, 38 percent of our chairmen have business experience. The second category consists of those from the social and political elite. Many of them were or had been MPs or aristocrats. Many also belonged to elite gentlemen’s clubs. Finally, many also held honorific positions such as Justice of the Peace or Deputy Lieutenant. Justices of the Peace were unpaid judges who presided in local courts, which adjudicated on minor offenses. Historically, these posts were held by members of the gentry, but by 1911, prominent businessmen were also being appointed to these posts. Deputy Lieutenant positions were usually held by members of the gentry, and the postholders were responsible for elements of local administration (Thomson Reference Thomson1922; Trevelyan Reference Trevelyan1937, pp. 22–4). Holding these honorific positions signaled social prominence and usually implied that the holder was a major landowner.Footnote 10
With respect to education, Table 6 shows that 17 percent of chairmen had been educated at one of the seven elite private schools in England and 23 percent had a university education, with the majority of those being educated at Oxford or Cambridge.Footnote 11 In 1871, when the average chairman would have attended university, only 0.1 percent of the population of 18- to 21-year-olds in England attended university, and by 1900, this figure was only 0.3 percent (Schwarz Reference Schwarz2004). Thus, the figure of 23 percent of chairmen having attended university is relatively high.
In terms of corporate networks, the average chairman held 3.5 other directorships, which implies that chairmen were connected to the wider corporate network. Table 6 also reveals that 36 percent of our chairmen were directors of firms in the same industry and 19 percent were directors in a bank. The average number of other chairmanships at 1.4 means that a minority of chairmen could be classified as busy directors.
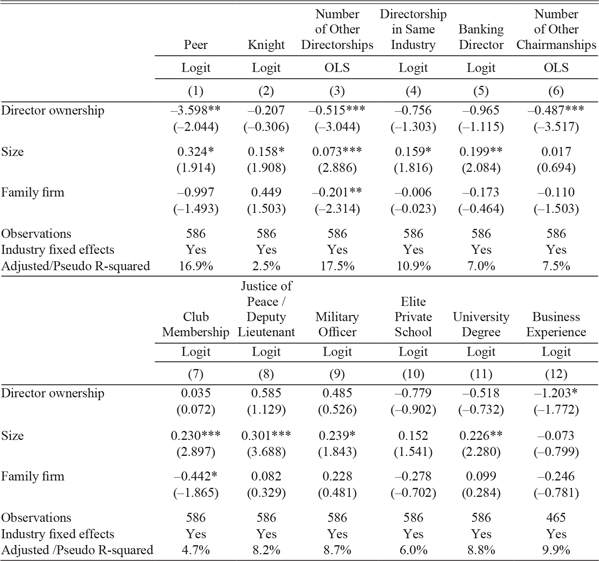
Marshall (Reference Marshall1919) was of the view that amateur managers were present in companies that had diffuse ownership and were large. Conversely, one would expect family firms to be managed by a family member who was in position not because of their social status but because they had deep business experience. In order to test whether directorship ownership, family firms, and firm size were determinants of our various proxies for amateurism, we regress these three variables on a variety of chairman characteristics, while controlling for industry fixed effects.
The regression results in Table 7 reveal that firms with more director ownership are less likely to be managed by peers, one of the chief markers of an amateur manager. This is generally consistent with Marshall’s claim. They are also less likely to have a chairman who has multiple directorships and chairmanships. This is unsurprising because the chairman of a company that has high director ownership has more skin in the game and therefore can devote less time to being a director or chairman elsewhere. The results also reveal that firms with more director ownership were less likely to be managed by someone with business experience. This is likely because the business experience variable and Bassett (Reference Bassett1912) do not explicitly capture founders and manufacturers.
In terms of family firms, very few of the coefficients in the regressions in Table 7 are significant. Chairmen with club memberships, a marker of social status and proxy for amateurism, were less likely to run family firms. As was the case for firms with high director ownership, chairmen of family firms were less likely to have other directorships.
The results in Table 7 suggest that firm size is an important determinant of many of our proxies for amateurism. On the one hand, larger firms were more likely to have chairmen who were peers, club members, former military officers, or who held honorific posts (Justice of the Peace/ Deputy Lieutenant). In other words, the largest companies were more likely to be managed by men who were amateurs. However, the results in Table 7 also reveal that the chairman of a large company was much more likely to have a university degree, which perhaps points to them having greater cognitive ability. Furthermore, chairmen of large companies were more likely to have directorships in other companies, which suggests that they had better corporate connections.
Table 7 also reveals that larger firms were more likely to have a chairman who held a directorship at another firm in the same industry. Cross-directorships may imply that companies were acting in concert to decrease competition, or it may imply that individuals were more likely to be chairmen if they held a directorship in the same industry, which would suggest a deep expertise in that industry.
Finally, Table 7 suggests that larger firms were more likely to have a chairman who was a director at a bank. Given that large firms could easily tap corporate debt markets in this era (Coyle and Turner Reference Coyle and Turner2013), chairmen who were also bank directors were likely there because of their expertise rather than any benefit that might accrue from having a relationship with a bank.
Marshall’s implicit critique of the managers of these large British public companies was that, unlike their American counterparts, they were run by amateurs who were not suitably equipped to manage large and complex organizations. This raises a question as to how much the managers and leadership of U.S. corporations differed from those in the United Kingdom in 1911. Unfortunately, there is no similar in-depth statistical analysis for circa 1911 in the United States. However, there are several studies that touch on the characteristics of the leaders of the largest corporations in the United States in the first decade of the twentieth century.Footnote 12
Newcomer (Reference Newcomer1955) looks at the chairmen/presidents of the 214 largest U.S. corporations in 1900. She restricts her sample to industrials, railroads, and utilities. To facilitate a comparison with our 1911 sample, we look at the 214 largest companies from these three same broad sectors. Newcomer finds that 39.4 percent of her sample in 1900 had a university education, whereas we find that 25.9 percent of our sample in 1911 had attended university.
In terms of other directorships, Newcomer found that 44.0 percent of her sample had zero, whereas only 16.8 percent of our sample did not have other directorships. Unfortunately, Newcomer does not provide an average for her sample to enable a deeper comparison. With regards to business background, the vast majority of Newcomer’s sample had a deep business background, whereas a large proportion of our sample came to their chairmanships through social rather than business background. This suggests that the typical chairman of large British industrials, railroads, and utilities had more business connections than their U.S. peers, but their business experience was not as deep.
Miller (Reference Miller1949, 1950) looks at the business leaders of U.S. companies with the equivalent of £9 million and above in capital between 1900 and 1910. There are 190 business leaders in his sample. To enable comparison, we look at the chairmen of those firms with £7 million or more in capital, which is only 47 companies. Miller finds that the 190 business leaders had 16 directorships on average, whereas the average for our subsample is only 2. Miller also finds that CEOs typically come from higher-status families and the business elite. While this is the case for the chairmen in our sample in terms of social status, 50 percent of U.K. chairmen in the largest 47 companies were from the political, aristocratic, and landed-gentry elite rather than the business elite.
In summary, Marshall’s critique of the leaders of U.K. companies appears to have some justification. Relative to their U.S. peers, many of them did not have deep business experience, and a smaller proportion had been educated at the university level. In terms of corporate connections, U.S. CEOs of very large firms were much better connected via director networks than their U.K. counterparts. However, the average company in our sample had as many directors, if not more, than those in Newcomer’s study. Ultimately, however, we must ask whether these differences matter for firm performance.
DID MANAGERS MATTER?
In this section, we explore whether characteristics that may have indicated that managers were amateurish were correlated with firm outcomes. As observed earlier, a large proportion of our chairmen came from landed elite and aristocratic backgrounds rather than from business backgrounds. Using markers of elite social status such as being a peer, knight, or member of an elite gentleman’s club, being a Justice of the Peace or Deputy Lieutenant, or having served as an officer in the military, we can test whether chairmen with any of these markers performed differently from their contemporaries.
We also tested whether the Number of other directorships that a chairman had mattered for firm performance. To see if access to finance or potential collusion were important, we used the Directorship in the same industry and Banking director variables in our analysis. Because there can be a potential downside to chairmen having multiple chairmanships in that they are too busy, we tested if our Number of other chairmanships was correlated with firm performance.
To explore the effect of private schools and education, our Elite private school variable, we test whether chairmen who had been educated at an elite private school underperformed their peers. Using our University degree and Oxbridge degree variables, we can test whether universityeducated chairmen performed better than their peers.
To examine the effect of managers, we regress the various chairman characteristics on three of our firm performance measures. Because chairmen would have turned over on a regular basis, we do not consider it appropriate to use our time-to-failure measure, our long-run measure of performance, for this analysis. The regression results are in Table 8.
Table 8 OLS RESULTS FOR PERFORMANCE METRICS AND CHAIRMAN CHARACTERISTICS

Notes: t-statistics calculated via robust standard errors are in parentheses. Significance is shown by ***p < 0.01, **p < 0.05, *p < 0.1. The control variables are as follows: return on assets, director ownership, family firm, number of shareholders, board size, MPs on board, peers on board, multiple votes, preference share voting, size, age, leverage, foreign, Official list, and London.
Sources: See Online Appendix Table 1 for sources and variable definitions.
From Table 8, there are at least four things worthy of comment. First, in terms of education, the results suggest that the companies that had chairmen with university and Oxbridge degrees did not perform differently from their contemporaries. However, the negative and statistically significant coefficient on the Elite private school variable in the specification suggests that companies with chairmen who had been educated at an elite private school underperformed their counterparts. But this result only holds for one of our measures. The causality here is difficult to distinguish because the poor firm performance could arise from the fact that poorly performing firms were more likely to choose private-school- educated men to be their chairmen. Nevertheless, this result tentatively supports the view that elite private schools did a poor job of preparing pupils for a career in business.
Second, the number of other directorships is uncorrelated with firm performance. However, in specifications 1 and 2, the coefficient on the Number of other chairmanships variable is negative and statistically significant. We find that a one standard deviation increase in the number of other chairmanships is associated with a decrease in the firm’s return on assets by c.39 percent and a decrease in Tobin’s Q of c.20 percent. This implies that firms that had a chairman who was also a chairman of at least one other company performed less well than their peers. This result is consistent with the idea that such individuals would have been too busy to devote adequate time and attention to running the companies they headed. Notably, firms with a chairman who is also a director of another company in the same industry have a higher dividend yield. This is consistent with such chairmen being better networked and having greater industry experience.
Third, markers of elite social status such as being a peer, knight, or member of an elite gentleman’s club, being a Deputy Lieutenant or Justice of the Peace, or having served as an officer in the military were unrelated to firm performance. In other words, companies with chairmen who were in the position due to their social status rather than their business experience performed no better or worse than their peers. This suggests that the leadership experience that chairmen from elite social backgrounds gained from being MPs, running local governments, or serving in the military was no better or worse than that received by those with deep business experience.
Fourth, during the Edwardian era, most managerial characteristics appeared to be uncorrelated to any measure of performance. Indeed, the maximum explanatory power when all chairman characteristics are considered jointly ranges from 3.9 to 27.1 percent. Ultimately, our control variables and industry fixed effects are much more important in understanding corporate performance.
Because the sample size shrinks markedly when the business experience variable is included, we do not include it in the specifications in Table 8. In Online Appendix Table 10, we run the regressions in Table 8 but include the business experience variable. The results of these regressions are consistent with what we have found in that business experience is not correlated with firm performance.
Overall, these results lend little support to Marshall’s contention that the chairmen of British companies were amateurish. The finding that university education, director networks, and business backgrounds were uncorrelated with firm performance implies that they were not the reason for the lack of vigor in U.K. public companies. Ultimately, our evidence suggests that, if Marshall was correct in identifying a corporate malaise in Britain, its source lay elsewhere.
CONCLUSIONS
For most of the top c.1,700 public companies in Edwardian Britain, ownership was separated from control. However, there is little evidence to suggest that ownership structure ultimately matters for performance. What do these results imply for the older traditional view among business and economic historians? Our findings clearly demonstrate that concentrated family control is not common among public companies of all sizes. In addition, even where there were family owners, it does not appear to have affected firm performance. However, if we cannot blame family ownership for the malaise that affected British industry, where else can we look?
Alfred Marshall suggested that the agency problem, which arose from the separation of ownership from control, was the root cause of the malaise of British companies. He argued that U.S. companies had overcome these problems by having professional, experienced, and suitably empowered CEOs. The evidence base for this assertion is thin. Based on several studies that looked at small samples in the United States, we found that the typical chairman of a U.K. public company was less likely to be university educated and had less deep business experience than their peers in the United States. However, there is not a lot of evidence that these things were correlated with firm performance. This suggests a rich research agenda. Did ownership and CEO characteristics differ between the United States and the United Kingdom in the 1910s? How did chairmen get to the top? How long did the education gap with their U.S. peers persist? Why did British business leaders, unlike their U.S. counterparts, have relatively small corporate networks? And why do these networks matter? One possible answer to these questions is that interlocking directorships facilitated the combination of businesses and ultimately industrial concentration and that their relative absence in the United Kingdom meant that it fell behind other industrial nations in this regard (Stanworth and Giddens Reference Stanworth and Giddens1975). However, the counterargument to this view is that the gentlemanly culture we have identified at the top of British business contributed to companies operating in a clubby manner, which resulted in cartels, restrictive practices, and anticompetitive behavior. This weakened competition in the product market, which then bred managerial complacency and underperformance from the 1920s onward. This resulted in British companies that were less productive and innovative (Broadberry and Crafts Reference Broadberry1992, 2001; Crafts Reference Crafts2012).
The other element that Marshall suggested was important was the presence of an autocratic professional at the helm rather than an amateur who was one of many equals on the board and had to build consensus. Coleman (Reference Coleman1987), using a sample of 10 firms, suggests that autocratic leadership did not work out well for British companies. Future research needs to examine how the roles of managing director and CEO evolved in the United Kingdom and whether the perceived long-run malaise of British business can be traced back to the lack of autocratic dictators at the helm.


 Open access