


“The inhabitant of London could order by telephone, sipping his morning tea in bed, the various products of the whole earth, … and reasonably expect their early delivery upon his doorstep; he could at the same moment and by the same means adventure his wealth in the natural resources and new enterprises of any quarter of the world, … or he could decide to couple the security of his fortunes with the good faith of the townspeople of any substantial municipality in any continent that fancy or information might recommend.”
—John M. Keynes (Reference Keynes1919)This description of the world before WWI by Keynes (Reference Keynes1919) illustrates that the spread of the telephone during the height of the First Globalization not only connected people with local contacts but also enabled them to access locations and markets in more far-flung destinations. But what really drove the adoption of the telephone—the opportunity to call a contact in a distant town or one’s neighbor down the road?
The spread of the telephone relied on two elements: first, the diffusion of the backbone infrastructure, local exchanges, and the lines between them; and second, the adoption of individual lines by end users subscribing to a phone service provider. Although closely connected, the two steps of diffusion and adoption were made by two distinct decision-makers: the service provider and individual subscribers. The underlying factors and motives for these decisions likely differed, so separate investigations are required to discover what drove the diffusion of telephone exchange infrastructure into new locations and what influenced the adoption of phone lines by users in those locations.
The advent of new communication technology usually has an impact on the integration and organization of markets and thereby the economic activities of connected places (Ejrnæs and Persson Reference Ejrnæs and Persson2010; Steinwender Reference Steinwender2018). Analyses of spatial economic patterns often refer to market access, the extent to which a particular market can be accessed, as an important mechanism through which information and communication can have a spatially distinct effect (Redding Reference Redding2010; Allen Reference Allen2014; Ploeckl 2015). For a network technology such as the telephone, this corresponds to network effects and the potential influence of links between network participants. Given that the telephone requires backbone infrastructure to enable local network participation, the question is: what network aspects drove the diffusion of such infrastructure? Was it characteristics that influenced the expected size of the local network, or was it the expected extent of connections with other locations and the state-wide network? And similarly, once a local network was established, was the adoption driven by the size of the local network and market, or was it the extent of network participation and markets in other locations that led to more phone line subscriptions?
The diffusion and adoption of information technology, including the telephone, have commonly been investigated on a macro-country level (Wallsten Reference Wallsten2005; Rammert Reference Rammert1990; Comin and Hobijn Reference Comin and Hobijn2010) or on a micro-household or firm level (Scott Reference Scott2011). In contrast, investigations of the impact of market access are often focused on the level in-between—towns and regions (Sokoloff Reference Sokoloff1988; Redding and Sturm Reference Redding and Sturm2008; Ploeckl Reference Ploeckl2010). The initial diffusion of the telephone within a country happened through spreading from town to town.Footnote 1 Consequently, I expand the literature on technology diffusion by analyzing the diffusion of the telephone on a town level, considering the timing of a local network exchange being established in the town and the extent of adoption as measured by the number of phone lines subscribed to within the local exchange network.
Network-oriented approaches examine the impact of connections between agents within the network.Footnote 2 That impact depends on the characteristics of all actors and the strength or weight of the network ties linking them (Esteves and Mesevage Reference Esteves and Mesevage2019). Market access, on the other hand, is an important core element of the New Economic Geography literature, normally in combination with a love of variety, increasing returns to scale, and transaction costs (Redding and Rossi-Hansberg Reference Redding and Rossi-Hansberg2017). Although the literatures on empirical network effects and quantitative economic geography are fairly separate, their conceptual similarities allow us to frame the empirical analysis of the diffusion and adoption of network technology telephone in terms of market access and spatial effects.
Empirically, I study this using the telephone diffusion in Bavaria.Footnote 3 Munich, its capital, installed a local network exchange, a prerequisite for public use and private phone lines, in 1883. Over the next two decades, the postal authority installed more than 300 local exchanges in towns all over the state. Bavaria created a unified, state-wide network relatively soon after the initial installation, connecting all local and regional networks within a decade (Bennett Reference Bennett1895). While it was not a leading adopter, it was not lagging significantly behind either. By 1900, its take-up was squarely in the European middle, lagging behind the leading Scandinavians, in line with the German Empire and the United Kingdom, and ahead of others such as France and Austria, making it an appropriate setting to understand the development of the telephone within a Western, industrializing context (Wallsten Reference Wallsten2005; Bennett Reference Bennett1895; Günther Reference Günther1910).
This also holds for institutional arrangements. Similar to other European countries, the Bavarian telephone service provider was a public monopoly. The timing of exchange openings was therefore the outcome of a centralized decision process without significant local technology supply-side differences. Similarly, firms and households in every location faced the same conditions and pricing to subscribe to a phone line. The provision of telephone technology through a single monopolist without systematic local or regional differences in the supply of telephone technology removes supply-side considerations or constraints faced by competing firms in countries with private markets from the analysis.
The empirical analysis focuses on the impact of market access, in particular, the “local” market access effect from the market within the town itself and the “external” market access effect related to long-distance connections to other towns. Consequently, I use for each Bavarian town its population and postal revenues as measures for the local market access and size effects and the inverse transaction cost weighted sum of these values in all other towns as measures of external market access. Additionally, a time-varying extension of the exchange diffusion analysis uses, at any given time, the number of lines in towns with already established exchanges to calculate external market access for those towns that do not yet have an exchange. Similarly, the spatial econometrics approach used in the phone line adoption analysis includes a spatial lag effect, constructed as the inverse transaction cost weighted sum of the number of phone lines in other towns, as a phone line-based external market access measure.
In addition, I use a number of economic characteristics in the analysis, including the presence and usage of the railroad, sectoral employment, and tax revenues, as potential demand factors shaping adoption and diffusion. These factors reflect Bavaria’s heterogeneity, with substantial differences between industrializing centers and rural towns. The existence of a public monopolist also raises the question of political influence on the process (Wallsten Reference Wallsten2005; Hesse Reference Hesse2002). The relative strength of different political parties is included, as is the politically relevant regional religious makeup, to account for a potentially systematic political impact.
The diffusion of exchange openings over towns is empirically estimated with a survival duration model for the period 1883 to 1905, including time-varying covariates and an extension with spatial duration dependence. The results indicate that, besides the expected local size effect, external market access did indeed have an impact, with the average level of market access reducing the expected time until an exchange was established in the median town by about six months, or 3 percent, compared to a local market only counterfactual. The adoption of telephone lines is analyzed for the cross-section in 1905 using a spatial autogressive lag model. Results show that a network effect-like impact of lines in other locations, so the ability to call subscribers in other exchanges, was positively associated with the rate of adoption in a town. I also find that initially, local market size clearly dominated the diffusion of exchanges, while toward the latter years of the period, the influence of external market access began to increase. The situation is very similar for the adoption of telephone lines. For early-adopters of large cities, the telephone was essentially an urban amenity for intra-city communication, while for smaller places, the telephone was predominantly an external link to other towns.
The results for the political factors show a preferential treatment of areas more closely aligned with the government during the diffusion process. Economic characteristics, like agricultural employment, show no or only a minor impact on the diffusion once market access effects are accounted for, but were somewhat more influential for the adoption, highlighting the role of the telephone as an urban amenity with the attendant impact on urban spatial structures (Anas, Arnott, and Small Reference Anas, Arnott and Small1998), whose demand was influenced by the extent of local economic activity.
Similarly, the presence of a railroad station did not influence diffusion and had, except for the most active stations, a negative impact on adoption. In contrast to the telegraph and its strong link to the railroad (Johnston Reference Johnston2021; John Reference John2010), the origins of the telephone as an urban amenity were clearly distinct from existing transport technologies and highlighted the emerging separation of communication and transportation networks and their respective impacts (Wenzlhuemer Reference Wenzlhuemer2017).
SETTING
The Telephone
The telephone was the third revolutionary change in communication services during the nineteenth century after the mail and telegraph. Inventive breakthroughs in the United States in 1876 led to the commercialization of the telephone, and by early 1878 the first public exchange was opened, which moved the technology beyond internal, private networks. The initial networks were pure hub-and-spoke systems, where an individual subscriber first contacted the local network exchange, which then connected the individual to the desired recipient of the call, who had to be directly linked to the same exchange. Soon, the introduction of connections between network exchanges enabled long-distance calling between telephone lines linked to different exchanges, which rapidly increased the number of lines a subscriber could call (Kingsbury Reference Kingsbury1915).
Countries all over the world started to adopt this new communication method as a publicly available service; London opened the first public exchange in Europe in 1878, Paris followed in 1879, and Berlin in 1881 (Bennett Reference Bennett1895; Hesse Reference Hesse2002). Although private American companies had set up European subsidiaries to install public networks, many states refused to grant them the necessary permissions and instead created monopolies, often administered by existing postal and telegraph authorities. This was also based on the initial perception, for example, in the German Empire, that the telephone was a technology to be used in combination with the telegraph rather than as an independent system (Wallsten Reference Wallsten2005).
Bavaria
Bavaria was one of the states that granted a monopoly to its public postal authority. It was a German state that had controlled its core territory for centuries and had expanded to its contemporary borders in 1815. As a member of the Deutsche Bund, the political institution of the German states, and the Zollverein, the customs union of a group of German states, it already had close political and economic connections to its neighboring states prior to the founding of the empire in 1871. The state still had large rural areas, but some urban centers were clearly industrializing in the second half of the nineteenth century (von Waltershausen Reference von Waltershausen1920). Politically, it was a constitutional monarchy with a Catholic dynasty presiding over a Catholic state that had acquired substantial Protestant areas at the start of the nineteenth century. Politically, the last two decades of that century were characterized by tensions between liberal governments and parliaments dominated by an ultramontane Catholic conservative party.Footnote 4
When Bavaria surrendered its full sovereignty and agreed to join the new German Empire in 1871, it insisted on several rights to preserve a certain degree of autonomy within the new political structure. One of the most visible signs of this autonomy was the retention of an independent postal service. While the services of the other states were merged to form the new Imperial Postal system, the Bavarian Postal authority, as well as that of its neighbor Wuerttemberg, retained full autonomy (Bennett Reference Bennett1895). This independence also included the telegraph. These different German services did cooperate very closely; one example was their joint participation in the Universal Postal Union through the Imperial Service. Practically, it was the continuation of a close formal cooperation that had already existed prior to the founding of the empire, most notably in the 1850 German Postal Union and Telegraph Union (von Waltershausen Reference von Waltershausen1920), which had established a single postal area in Germany and close technical coordination between the telegraph systems. As previously stated, most telephone systems in Central Europe were introduced through postal services, and the emerging Bavarian telephone network was no exception.
The postal service managed the roll-out of the telephone service and constructed local network exchanges throughout the state. The final decision on where such a local network would be established, however, was made by the Bavarian state government. Nonetheless, the full process did start in the towns themselves. If there was a noticeable demand for private telephone lines in a town, the local municipality had the option to submit a petition to the Bavarian postal authority with the names of potential subscribers and their expected expenditure. The authority collected these petitions and submitted them to the government, along with a rough cost estimate. Since the establishment of these exchanges was a major capital expense, the government had to submit a budget request to the parliament before it could authorize their construction. Parliamentary debates featured members of parliament actively lobbying the government and the postal authority on behalf of locations in their constituencies. Once the government had received budgetary approval,Footnote 5 the postal authority was tasked with creating the exchanges (Thiel Reference Thiel1983).Footnote 6 It was given full, centralized control over the procurement process, which therefore meant that there was no systematic local influence on the availability and selection of exchange equipment and technology.
Like the decisions about telephone exchange locations, the tariff setting was also centralized. The Bavarian Postal Authority used a uniform tariff setting for the whole state, so all potential subscribers faced the same conditions when making their decisions. The tariff structure did have one regional component, as one tariff aspect differentiated between calls to subscribers within the same “Regierungsbezirk,” large administrative regions within the state, and calls into other regions.
Once an exchange was established in a town, the early adopters were usually businesses, while purely private households rarely subscribed to a telephone line (Milne Reference Milne2007). This is clearly visible in early phone directories that indicate the nature of the business of each subscriber (Königlich Bayerische Posten und Telegraphen 1905). A quantitative confirmation is provided by Günther (Reference Günther1910), who lists the relative sizes of categories of subscribers for the German town of HalleFootnote 7 and shows a 3 percent rate for purely private lines. The share of subscribers using it for both private and personal purposes, however, was surely higher, as the common co-location of business premises and private rooms in the same building enabled continuous personal access and availability.
The Bavarian Postal Authority was a monopolist provider of public telephone services. If it sought to maximize either revenues, profits, or economic benefits, it established exchanges in markets where it expected the strongest demand and highest willingness to pay. The core hypothesis here is that this demand, as reflected in so-called market access, was indeed central to the diffusion of phone exchanges and the adoption of telephone lines. Crucially, this includes local market access, like local population size reflecting demand based on within-town connections, and external market access, like distance-weighted population or postal revenues in nearby towns reflecting demand for long-distance connections, as important demand features. Additional hypotheses include that the relative importance of external and local market access varies over time, especially with the expanding extent of the network.
The provision of infrastructure through a public body like the Bavarian Postal Authority is obviously vulnerable to direct political influence. This can take different forms, from the importance of individual politicians and their influence to the direct use of infrastructure to sway a specific election or a systematic long-term patronage prioritizing specific regions due to their political, cultural, or similar characteristics. The substantial length of the period under question and the fairly complete diffusion over the whole of Bavaria imply that the most relevant aspect is a structural, regional preferential treatment due to the political and closely related characteristics of different Bavarian regions, most importantly their respective religious affiliations. Political and religious heterogeneity, however, not only can influence the exchange diffusion process, but these differences can also shape the reception and attitude of potential customers toward new technology, thereby influencing the speed of adoption of that technology within towns.
DATA
Table 1 reports summary statistics for the variables used in the empirical estimation, covering the 306 towns with an exchange established by 1905, with sources and specifications either explained next or in the Online Appendix.Footnote 8
Table 1 SUMMARY STATISTICS

Notes: Variable definitions are explained in the Online Appendix. MA_Post and MA_Population are the external market access measures with postal revenues and communication-based distance decay, respective with population and inverse distance decay.
Source: See Online Appendix.
Telephone Diffusion and Adoption
The first stage of the diffusion is reflected in the establishment dates of the initial local exchanges in towns, measured by the date the postal service reports as the start of service. The actual order of service openings differed slightly from the official establishment decision order by the central authority due to different construction spans and times to completion; however, the opening date is used because the telephone only really began to have an effect once the network had been established and consumers were able to get a phone line. Between 1883 and the end of 1905, 306 exchanges were opened in towns. The spatial pattern, as shown in Figure 1, indicates a population size effect, with predominantly larger towns hosting an exchange by 1896, while additional locations by 1900 and 1905 appear smaller population-wise. The cumulative number, shown in Figure 2, follows an exponential pattern, reflecting the acceleration of the roll-out over these two decades. This fits as the first part of an S-shaped diffusion pattern, which is consistent with the impact of network effects (e.g., as more of the early towns got exchanges, the gains from exchanges for many other towns increased, leading to a steeper slope in the diffusion curve) (Rogers Reference Rogers1995).

Figure 1 LOCATIONS OF EXCHANGES
Notes: The map plots the locations of all towns with an exchange by 1896, 1900, and 1905 showing the population size of these towns in the year 1880.
Source: Author calculations based on paper data set.

Figure 2 EXCHANGE DIFFUSION
Notes: The graph plots the number of exchanges in opened in Bavarian towns over time.
Source: Author calculations based on paper data set.
The second stage, adoption, looks at the number of subscribers within towns as measured by the number of phone lines connected to the respective local telephone exchange. These subscription numbers are available for a few years and include all private subscriptions, lines for administrative and other government institutions, as well as public phones. Figure 3 shows the adoption rates, the number of lines per capita, in all connected Bavarian towns in 1896, 1900, and 1905, respectively, plotted against the time the phone service had been available in each case. The plot does show a slight upward trend from 1896 to 1905, but no similar curve pattern as the exchange data. This is likely due to the longer time frame—the adoption of the telephone expanded for a century after the end of the period under study. These observations are therefore from the initial stage of the usual S-shaped diffusion pattern, rather than tracing out the full curve (Scott Reference Scott2011).

Figure 3 ADOPTION RATES IN BAVARIAN TOWNS
Notes: The graph plots the rate of per capita telephone adoption in Bavarian towns with a telephone exchange in 1896, 1900, and 1905.
Source: Author calculations based on paper data set.
Market Access Characteristics
I follow the empirical literature and proxy overall market access by market potential, summing the size of the respective market
 $M{P_i} = \sum{_j}\frac{{{M_j}}}{{{d_{ij}}}}$
by corresponding spatial transaction costs (Redding and Rossi-Hansberg Reference Redding and Rossi-Hansberg2017).
$M{P_i} = \sum{_j}\frac{{{M_j}}}{{{d_{ij}}}}$
by corresponding spatial transaction costs (Redding and Rossi-Hansberg Reference Redding and Rossi-Hansberg2017).
There are different approaches to measuring the size of a market, including GDP, especially at the country level, and population, predominantly at the regional or local level. Network-oriented studies often focus on firms, organizations, or industries, so the relevant market size is then proxied with overall market revenues, sales, or other demand measures. Here I use town population, town revenues from post and telegraph services, as well as the number of phone line subscriptions in a town, which allows the construction of different measures to highlight certain aspects of market access, including communication-specific access versus broad, general access, and local markets versus distant, external ones.
The official municipal population size is used as the relevant local population. It was recorded every five years in a census, and despite substantial overall growth between 1880 and 1905, its relative size distribution stayed very stable. Revenues for postal as well as telegraph services were reported on a town levelFootnote 9 by the Bavarian postal service. Although highly correlated in 1880 (0.72), telegraph revenues show a relatively higher standard deviation than postal ones. This likely reflects differences in the main user groups, with telegraph demand being substantially more commercially oriented than postal demand (Ploeckl 2015, 2016). Furthermore, the 1905 cross-sectional number of phone lines is used as a measure of external market size in the analysis of the phone line adoption rate, while the time-varying numbers, interpolated monthly from official records in 1896, 1900, and 1905 and the respective opening dates of exchanges, are used to construct an additional measure of market size in a time-varying extension of the exchange diffusion analysis.
The baseline specifications for the exchange diffusion analysisFootnote 10 use cross-sectional market size based on postal revenues in 1882 as external market access measure. The time-varying specification replaces this cross-sectional value with the time-varying, monthly number of phone lines from those locations that already had an exchange at that respective point in time.Footnote 11 The baseline specifications for the 1905 phone line adoption analysis use the 1880 population values, and through the spatial lag component of the estimation, the 1905 cross-section of phone lines in all towns as external market access measures. Local market access measures for both analyses utilize the 1880 population as well as the 1882 postal and telegraph revenuesFootnote 12 as market size values. The time-varying specification of the exchange diffusion analysis replaces the static population measure with a monthly local population size interpolated from five-yearly censuses starting in 1880.
External market access measures are constructed with spatial transaction costs, which are usually proxied to distanceFootnote
13
between locations. Based on the gravity framework, most studies apply a simple inverse distance,
 $\frac{1}{{{d_{ij}}}}$
, decay factor, which I use for a general market access measure based on population. Lampe and Ploeckl (Reference Lampe and Ploeckl2014), however, show that while telephone calls in Bavaria at the time followed the overall general gravity framework quite well, they exhibited a stronger distance decay. This is consistent with studies for modern phone calls that also find a steeper decay (Rietveld and Janssen Reference Rietveld and Janssen1990; Krings et al. Reference Krings, Calabrese, Ratti and Blondel2009), indicating that spatial transaction costs within the communication sector are more appropriately represented by a steeper decay factor.Footnote
14
Consequently, market access measures using communication values, such as postal and telegraph revenues or the number of phone lines, use the steeper
$\frac{1}{{{d_{ij}}}}$
, decay factor, which I use for a general market access measure based on population. Lampe and Ploeckl (Reference Lampe and Ploeckl2014), however, show that while telephone calls in Bavaria at the time followed the overall general gravity framework quite well, they exhibited a stronger distance decay. This is consistent with studies for modern phone calls that also find a steeper decay (Rietveld and Janssen Reference Rietveld and Janssen1990; Krings et al. Reference Krings, Calabrese, Ratti and Blondel2009), indicating that spatial transaction costs within the communication sector are more appropriately represented by a steeper decay factor.Footnote
14
Consequently, market access measures using communication values, such as postal and telegraph revenues or the number of phone lines, use the steeper
 $\frac{1}{{d_{ij}^{1.8}}}$
factor found for Bavarian phone calls to keep consistency between proxies for market size and spatial transaction costs.
$\frac{1}{{d_{ij}^{1.8}}}$
factor found for Bavarian phone calls to keep consistency between proxies for market size and spatial transaction costs.
This study focuses on the distinction between the market within the location and the local network itself and the markets in other, distant locations and exchange networks. To delineate that difference between intra-city and inter-city effects, I label the first “local” market access and the second “external” market access.
To account for not including market access outside of Bavaria, I include a dummy variable for proximity to its external border, as measured by a town located in a county bordering another German state or the neighboring Austrian Empire.
Economic Characteristics
Given that early subscribers were primarily commercial customers, the economic characteristics of towns were potentially relevant for the timing of an exchange opening as well as for the strength and speed of line adoption when available.
The Bavarian railroads were closely linked to the various communication services in both technical and administrative ways. Operationally, they were, at the time, the main backbone transportation network for the mail; they had a significant influence on the development of the telegraph; and administratively, they were closely integrated with the postal, telegraph, and telephone authority. The network was fairly well-developed, as about 60 percent of the included locations had a railroad station by 1880. In addition to this external margin of railroad presence, there were also substantial differences in the importance and usage of each station. This possible impact of the internal usage margin is captured by including the revenues accrued at each station.
Bavaria’s economic structure showed substantial heterogeneity in sectoral terms; agriculture was still the dominant occupational sector with an average regional share of over 60 percent, but there were clear points of industrialization. The potential impact is included in the share of agricultural workers among all male workers, the share of non-farm workers in the total population, and the degree of specialization. The first two are measured for a wider area, more precisely the federal political constituency, rather than the town itself, and therefore reflect a more regional economic situation.
Specialization is reflected in an index of dissimilarity, which uses employment in 23 sector categories within counties to measure how specialized and different a county is in contrast to the whole state.
Another economic indicator potentially reflecting local demand conditions is the height of tax revenues, as measured in the per-capita state tax revenue in a location’s county. As noted previously, Bavaria’s substantial heterogeneity is reflected in the wide range of values between towns. However, as tax revenues are also commonly used as a proxy for state capacity (Johnson and Koyama Reference Johnson and Koyama2017), any effect from this variable could potentially not only reflect local economic activity but also local administrative and political capabilities.
Finally, three administrative spatial characteristics are included that intertwine economic, market access, and administrative conditions.Footnote 15 The first is whether a town is “kreisfrei,”Footnote 16 where the town municipality also constitutes a county. The second covers the proximity to a large city, which is indicated by a town being located in a county that was administered by and named after a large “kreisfrei” city that was not actually located in that county. The third measures the share of the county population residing in the town.
Political and Cultural Characteristics
Two central aspects of relevant political and cultural differences in nineteenth-century Bavaria are the strong interaction between religious and political characteristics, as well as the contrast between a more culturally liberal government and a persistently conservative parliamentary majority. To focus on these systematic differences rather than individual politicians and elections, the constituency election results for the “Reichstag,” the federal parliament of the German Empire, rather than Bavarian state-level elections, are utilized. The broader differentiation in terms of political parties and movements on a German imperial level also captures different political characteristics more clearly than comparable Bavarian state politics. The different parties have been grouped into three main streams,Footnote 17 namely Socialists, Liberals, and the “Zentrum,” which was strongly conservative and the main Catholic confessional political party. This split roughly covers the alignment with government or parliamentary majority as well as an urban progressive versus rural conservative predominance. This is also reflected in the overall voter participation rate, which correlates negatively with agriculture and is included in the analysis next to the vote shares for the socialists and the “Zentrum” party. The socialists were clearly an urban-based movement (correlation with agriculture: –0.84), while the “Zentrum” was stronger in rural areas (correlation with agriculture: 0.61).
The confessional Catholic nature of the “Zentrum” party also highlights another relevant social dimension—religious differences. Although Bavaria is commonly seen as a strong Catholic state, it had acquired substantial Protestant areas, especially during the mediatization process during the Napoleonic Wars and the fall of the Holy Roman Empire. The share of Catholics in the population is strongly correlated with the “Zentrum” vote share (0.92); consequently, the difference between the two, rather than the direct share of Catholics, is included to understand more clearly if any potential effect is due to a political dimension or a religious, cultural one.
DIFFUSION OF EXCHANGES
The diffusion of local network exchanges, as shown in Figure 2, followed an exponential pattern over the first two decades of the telephone in Bavaria, so the focus of the analysis here is on individual locations to determine where these fell on the diffusion curve and the factors that influenced when an exchange was opened there.
Consequently, the focus is on the timing of events, which implies the appropriateness of a duration analysis approach. This method, also known as survival analysis, analyzes the length of time until a particular event occurs (Kalbfleisch and Prentice Reference Kalbfleisch and Prentice1980). In this case, the event is the opening of a newly installed local network exchange, and the analysis focuses on explaining the length of time until that event occurred in a particular town.
One approach to survival analysis starts with the idea that every observation has at any given point in time a particular probability for the event to occur. This probability is then modeled with a hazard rate with two components, namely a baseline probability hazard rate and a multiplicative factor reflecting the influence of covariates such as the characteristics described earlier.
The researcher needs to select a parametric distribution for the baseline hazard rate. I use the commonly applied Weibull distribution as it can flexibly accommodate several different hazard rate shapes, including an exponential curve. It can also be expressed in an accelerated failure time (AFT) version, which facilitates an easier interpretation of the results (Kalbfleisch and Prentice Reference Kalbfleisch and Prentice1980).
Formally, the hazard rate h(t), reflecting the probability that a location receives a telephone exchange at time t, is modeled as:
 $h\left( t \right) = p{t^{p - 1}}{e^{\left( {{X'}{\beta ^{\rm{*}}}} \right)}}$
where p is a parameter of the underlying Weibull distribution, X is the set of covariates, and β ∗ is a vector of parameters for the influence of these covariates on the hazard rate. The estimation will determine p and β ∗, with the latter indicating which covariates had a significant impact on the probability and thereby the timing of the exchange.
$h\left( t \right) = p{t^{p - 1}}{e^{\left( {{X'}{\beta ^{\rm{*}}}} \right)}}$
where p is a parameter of the underlying Weibull distribution, X is the set of covariates, and β ∗ is a vector of parameters for the influence of these covariates on the hazard rate. The estimation will determine p and β ∗, with the latter indicating which covariates had a significant impact on the probability and thereby the timing of the exchange.
The equivalent accelerated failure time formulation is log(T) = α + X′β + σW, where T is the length of time until the event occurs, while α and σ are based on the underlying Weibull distribution parameters, the coefficients β are a direct transformation of β∗, and W is an error with an extreme value distribution. The time it took for town i to receive an exchange, T i, can then be interpreted as the product of a constant, e (α), error term, e (σWi), and the impact of the covariates, e(X´ iβ). This means that a negative coefficient implies that a higher covariate value reduces the spell length multiplicatively, resulting in a proportional reduction of the time until an exchange is established.
This leads to the following baseline specification:
 \begin{align*}& log{T_i} = \alpha + {\beta _{\text{1}}}M{A_{post}}_{ - i} + {\beta _{\text{2}}}Borde{r_i} + {\beta _{\text{3}}}Populatio{n_i} \\
& \quad\, +\, {\beta _{\text{4}}}PostRevenue{s_i} + {\beta _{\text{5}}}TelegraphRevenue{s_i} + {\beta _{\text{6}}}Agricultur{e_i} \\
& \quad\, +\, {\beta _{\text{7}}}EmploymentRati{o_i} + {\beta _{\text{8}}}Similarit{y_i} + {\beta _{\text{9}}}StateTa{x_i} \\
& \quad\, +\, {\beta _{{\text{1}}0}}Railroa{d_i} + {\beta _{{\text{11}}}}RailroadRevenue{s_i} + {\beta _{{\text{12}}}}VoteParticipatio{n_i} \\
& \quad\, +\, {\beta _{{\text{13}}}}Socialist{s_i} + {\beta _{{\text{14}}}}Zentru{m_i} + {\beta _{{\text{15}}}}{\left( {Cath - Zentrum} \right)_i} \\
& \quad\, +\, {\beta _{{\text{16}}}}CityStatu{s_i} + {\beta _{{\text{17}}}}CountyPopShar{e_i} + {\beta _{{\text{18}}}}Fring{e_i} + \sigma {W_i}\\ \end{align*}
\begin{align*}& log{T_i} = \alpha + {\beta _{\text{1}}}M{A_{post}}_{ - i} + {\beta _{\text{2}}}Borde{r_i} + {\beta _{\text{3}}}Populatio{n_i} \\
& \quad\, +\, {\beta _{\text{4}}}PostRevenue{s_i} + {\beta _{\text{5}}}TelegraphRevenue{s_i} + {\beta _{\text{6}}}Agricultur{e_i} \\
& \quad\, +\, {\beta _{\text{7}}}EmploymentRati{o_i} + {\beta _{\text{8}}}Similarit{y_i} + {\beta _{\text{9}}}StateTa{x_i} \\
& \quad\, +\, {\beta _{{\text{1}}0}}Railroa{d_i} + {\beta _{{\text{11}}}}RailroadRevenue{s_i} + {\beta _{{\text{12}}}}VoteParticipatio{n_i} \\
& \quad\, +\, {\beta _{{\text{13}}}}Socialist{s_i} + {\beta _{{\text{14}}}}Zentru{m_i} + {\beta _{{\text{15}}}}{\left( {Cath - Zentrum} \right)_i} \\
& \quad\, +\, {\beta _{{\text{16}}}}CityStatu{s_i} + {\beta _{{\text{17}}}}CountyPopShar{e_i} + {\beta _{{\text{18}}}}Fring{e_i} + \sigma {W_i}\\ \end{align*}
where T i is the time in months it took until a location i was connected; the time period starts in May 1883 when Munich opened the first exchange and ends in December 1905 and is measured in months; σW i is the error term; and the remaining factors are the town characteristics introduced earlier that potentially shaped the diffusion process, including market access measures as the main variables of interest, such as external market access based on postal revenuesFootnote 18 in other markets, labeled as MA post−i. There are two extensions to this baseline specification: first, a hazard stratification, and second, the introduction of time-varying covariates. Stratification means grouping the observations into different strata and then allowing the underlying baseline hazard rate to vary between these groups, while the multiplicative effect of covariates remains consistent. Practically, this is done by including fixed effects for seven larger regional administrative areas.
The second allows for exogenous variation for the covariates during the spell. This implies that the modifying effect of covariates on the hazard rate changes whenever an included covariate changes value over time.Footnote 19 Here I replace two fixed covariates with a time-varying version,Footnote 20 more precisely the two main market access variables of interest, namely local population and external market access. The interpretation of the resulting coefficients remains the same as for the baseline specification.
The next subsection goes beyond the baseline specification and provides robustness tests of whether any potential external spatial effects are due to spatial autocorrelation effects rather than the impact of external market access.
Results
Table 2 shows the results for the baseline specification, as well as the two extensions. Overall, the three specifications are fairly consistent, although there are a small number of variables that vary around the thresholds for statistical significance. The following discussion is based on the time-varying specification unless indicated otherwise.
Table 2 DIFFUSION OF LOCAL EXCHANGES
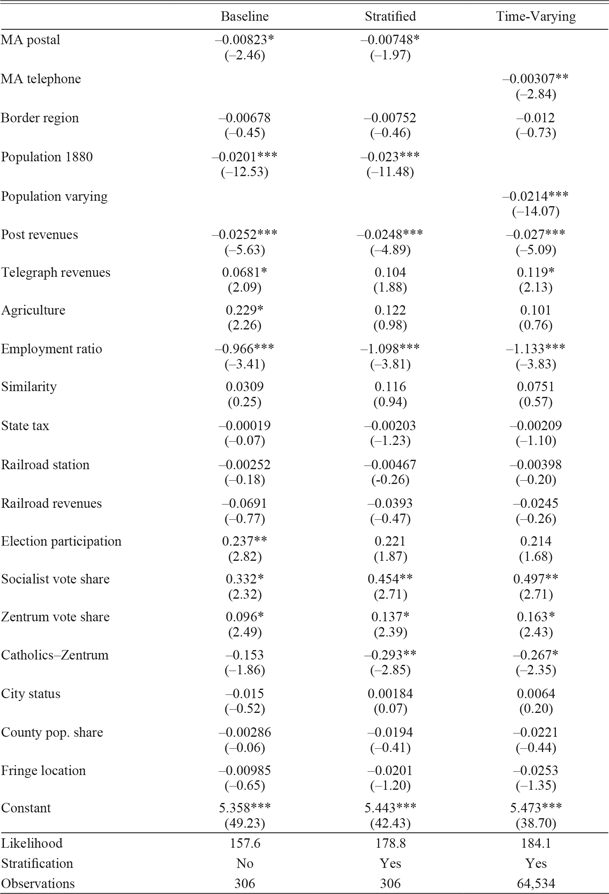
Notes: * p < 0.05, ** p < 0.01, *** p < 0.001, t-statistics in parentheses, likelihood is the log Pseudolikelihood.
Source: Author calculations.
The market access factors contain local and external market measures. As expected, the main local measure, the size of the town (population in 1880, population time-varying), matters, with 1,000 additional residents bringing the exchange forward by about 2 percent. For the median town, those 1,000 additional residents reduce the time by about four months, from approximately 220 to 216 months. Similarly, going from the 25th and 75th percentiles of the size distribution reduces it by just over 6 percent—about a year for the median town. While these effects are not large, they are conditional on other characteristics, some of which are correlated with population.
Moving from the local population market access to communication-based measures, per capita postal and telegraph revenues (post revenues, telegraph revenues) demonstrate that the demand for communication services had an influence beyond that based on the size of the local population. The two values are substantially correlated (0.73), although telegraph revenues had a higher variance and range. While the effect of a town’s postal revenues reduced the time to establishment, the town’s telegraph revenues increased it. At mean values, the post effect outweighs the telegraph effect by −10.4 to 4.3 percent. Similarly, changing the covariates from their 25th to the 75th percentile implies a 6.4 percent reduction and a 3.0 percent increase, respectively.
While there is no discernible effect of proximity to a border (border region), the external market access (MA postal) has a negative effect, reducing the time to establishment.Footnote 21 Using the coefficients from the stratified specification, the difference between the 25th and 75th percentile leads to a time reduction of about 1.5 percent, equivalent to about 650 additional inhabitants. The corresponding phone line-based external market access variable (MA telephone) in the time-varying extension changes over time, but the difference between the 25th and 75th percentilesFootnote 22 at the end of 1900 is associated with a 2.1 percent time reduction, which increases to 3.9 percent by the end of 1905. The section on “Market Access Considerations” discusses further aspects of the market access measure results.
Most other economic covariates show no significant impact. This covers, in particular, sectoral characteristics, with the retarding effect of agriculture (agriculture) turning insignificant with the inclusion of stratification regions. Similarly, neither the degree of specialization (similarity) nor the level of state tax (state tax) nor the additional administrative covariates (city status, county pop. share, fringe location) have a statistically significant effect. Agriculture and the employment ratio (employment ratio) are negatively correlated (–0.43), so the effect of the latter likely captures the difference between agricultural and non-agricultural demand for the telephone in combination with the general impact of more economically active regions. The impacts of a one standard deviation increase and of going from the 25th to the 75th percentile are a reduction in time of 7 and 6 percent, respectively. Contrary to expectations, there was no effect of railroads and railroad stations (railroad revenues, railroad station). This points toward the telephone representing a major divergence in inter-city transport and communication infrastructure, at least when market access effects are accounted for.
The political covariates show an impact as well, indicating that demand alone cannot explain diffusion. There was a retarding effect of Socialist and “Zentrum” votes in contrast to liberal votes (Socialist vote shares, Zentrum vote shares), which highlights that political affinity with the government and the ministry that controlled the telephone administration led to more favorable treatment and faster exchange establishment than closeness with the conservative, Catholic parliament majority. A one standard deviation higher “Zentrum” vote share, about 30 percent more, results in a 10 month later opening for the median town, a 4.8 percent longer wait. This is also reflected in the impact of the difference between “Zentrum” votes and population shares of Catholics (Catholics–Zentrum); it seems that the weaker the grip of the conservative Catholic political movement on the Catholic population, the faster an exchange was established. The average gap was associated with a delay of about 3 percent over no gap—about six months for the median town. The comparatively stronger negative impact of the Socialist vote share, about 6 percent or close to a year later for a 12 percent or one standard deviation higher vote share, is consistent with the enmity of both liberal state governments and conservative parliaments toward that political movement.
Robustness
The formulation of external market access underlying these results builds on geographic distance between locations. This raises the possibility that the found effect picks up a purely geographic expansion of the network rather than market access. This means that a location saw an exchange established not because of any economic characteristic or market demand, but because it just happened to be close to an existing exchange. This is addressed by incorporating a spatial correlation effect into the diffusion estimation, following Kachi and Hays (Reference Kachi, Hays and Robert2015). Practically, this builds upon the baseline modelFootnote 23 and adds a factor Ay, where A is the matrix modeling the potential spatial dependency between locations and y is the outcome, as well as makes a necessary correction to the error terms. Conceptually, this is very close to the spatial autoregressive estimation used in the analysis of the telephone adoption in the next section. However, there, the spatial interaction factor represents the network effect between exchanges influencing adoption, while here it represents the spatial proximity affecting diffusion, so the effect of being close to another location that got an exchange.
This spatial effect could potentially take three different patterns. The first, labeled decay, assumes that towns are influenced by all other towns, but closer towns have a stronger impact. As with the calculation of market access variables, the spatial correlation is modeled with a distance decay function, and I apply the same
 $\frac{1}{{d_{ij}^{1.8}}}$
as for the adoption network effect. The second potential pattern, labeled band, reflects that towns are influenced by towns within a particular distance threshold in an identical fashion. The correlation is then modeled with dummies indicating whether the distance between two towns is below a distance threshold of 25 km. The third, labeled region, is based on the tariff structure. The Postal Authority grouped local exchanges into “Bezirke,” usually spatially consistent regions, allowing a special rate for calls within these regions. The spread of new local exchanges could have been influenced by the extent of existing exchanges within towns in the region. Again, the correlation is modeled with a dummy, indicating that two towns are within the same group.
$\frac{1}{{d_{ij}^{1.8}}}$
as for the adoption network effect. The second potential pattern, labeled band, reflects that towns are influenced by towns within a particular distance threshold in an identical fashion. The correlation is then modeled with dummies indicating whether the distance between two towns is below a distance threshold of 25 km. The third, labeled region, is based on the tariff structure. The Postal Authority grouped local exchanges into “Bezirke,” usually spatially consistent regions, allowing a special rate for calls within these regions. The spread of new local exchanges could have been influenced by the extent of existing exchanges within towns in the region. Again, the correlation is modeled with a dummy, indicating that two towns are within the same group.
The results in Table 3 show that the estimated coefficients for the main covariates,Footnote 24 including those for external market access,Footnote 25 are essentially identical to the baseline specification results, while the spatial effects are not significant. In contrast to the telegraph, the main infrastructure for the telephone was within locations rather than between them, so an exchange could be established and operated profitably without an external connection. Consequently, geographic proximity and the related cost savings for inter-city infrastructure apparently did not represent an important consideration in the initial location decision, including in comparison to the potential demand effect from external market access.
Table 3 DIFFUSION OF LOCAL EXCHANGES

Notes: * p < 0.05, ** p < 0.01, *** p < 0.001, t-statistics in parentheses.
Source: Author calculations.
ADOPTION OF TELEPHONE LINES
Connections to other towns mattered when a location saw the arrival of the telephone. But did those also matter for the adoption of phone lines within the town?
The main focus is to explore whether by 1905 there were visible network effects between locations in the adoption of telephone lines—did it matter that subscribers could call beyond the local network? This fits with a spatial autoregressive lag model (SARLM), where each outcome can depend on a weighted combination of the outcomes in all other locations (LeSage and Pace Reference LeSage and Pace2009). This potential interdependence—the adoption in one location depending on the adoption in other locations—resembles the network structure of the telephone, where someone might subscribe to a line because someone in a different town has one.
The SARLM approach adds a weighted linear combination of all other outcomes as an independent variable to a regular linear specification (LeSage and Pace Reference LeSage and Pace2009). Consistent with the external market access effect in the diffusion analysis, I apply an inverse distance decay with
 ${w_{ij}} = \frac{1}{{d_{ij}^{1.8}}}$
as the relative weightsFootnote
26
for this linear combination.Footnote
27
${w_{ij}} = \frac{1}{{d_{ij}^{1.8}}}$
as the relative weightsFootnote
26
for this linear combination.Footnote
27
The analysis is focused on understanding the impact of covariates on the adoption rate within a town. However, using the adoption rate as an outcome variable creates a problem with the interpretation of the included spatial effect, as it treats the impact of the adoption rate of a very small town as the same as that of the largest town. To retain the impact of the other covariates on the adoption rate but weigh the spatial effect by the size of connected locations, I multiply outcome and independent variables by the local population.Footnote 28 The outcome variable turns into the absolute number of lines, while the interpretation of the covariate effects can still be done in relation to the adoption rate.Footnote 29 The change also implies that the spatial network effect reflects the impact of the distance-weighted sum of lines in other towns on the number of lines in a place, while the external market access covariate MA Population, the distance-weighted sum of the population in other places, shows a general market access effect on the adoption rate.
This leads to the following specification:
 \begin{align*} & Line{s_i} = {\text{ }}\rho {\sum \nolimits_{j \ne i}}{w_{ij}}Line{s_j} + {\text{ }}{\beta _{\text{1}}}{\underline{MA}_{{population } - {\text{i}}}} + {\text{ }}{\beta _{\text{2}}}{\underline{Border}_{i}} + {\beta _{\text{3}}}\underline{Population}_{i} \hfill \\
& \quad \,+\, {\beta _{\text{4}}}{\underline{PostRevenues}_{i}} + {\text{ }}{\beta _{\text{5}}}{\underline{TelegraphRevenues}_{i}} + {\text{ }}{\beta _{\text{6}}}{\underline{Agriculture}_{i}} \hfill \\
& \quad \,+\, {\beta _{\text{7}}}{t\underline{EmploymentRatio}_{i}} + {\beta _{\text{8}}}{\underline{Similarity}_{i}} + {\beta _{\text{9}}}{\underline{StateTax}_{i}} \hfill \\
& \quad \,+\, {\beta _{{\text{1}}0}}{\underline{Railroad}_{i}} + {\beta _{{\text{11}}}}{\underline{RailroadRevenues}_{i}} + {\beta _{{\text{12}}}}{\underline{VoteParticipation}_{i}} \hfill \\
& \quad \,+\, {\beta _{{\text{13}}}}{\underline{Socialists}_{i}} + {\beta _{{\text{14}}}}{\underline{Zentrum}_{i}} + {\beta _{{\text{15}}}}{\underline{Cath}} - {\underline{Zentrum}}_{i} + {\beta _{{\text{16}}}}{\underline{City}_{i}} \hfill \\
& \quad \,+\, {\beta _{{\text{17}}}}{\underline{CountyPopShare}_{i}} + {\beta _{{\text{18}}}}{\underline{Fringe}_{i}} + {\beta _{{\text{19}}}}{\underline{InstallTime}_{i}} + {\epsilon_{i}} \hfill \\ \end{align*}
\begin{align*} & Line{s_i} = {\text{ }}\rho {\sum \nolimits_{j \ne i}}{w_{ij}}Line{s_j} + {\text{ }}{\beta _{\text{1}}}{\underline{MA}_{{population } - {\text{i}}}} + {\text{ }}{\beta _{\text{2}}}{\underline{Border}_{i}} + {\beta _{\text{3}}}\underline{Population}_{i} \hfill \\
& \quad \,+\, {\beta _{\text{4}}}{\underline{PostRevenues}_{i}} + {\text{ }}{\beta _{\text{5}}}{\underline{TelegraphRevenues}_{i}} + {\text{ }}{\beta _{\text{6}}}{\underline{Agriculture}_{i}} \hfill \\
& \quad \,+\, {\beta _{\text{7}}}{t\underline{EmploymentRatio}_{i}} + {\beta _{\text{8}}}{\underline{Similarity}_{i}} + {\beta _{\text{9}}}{\underline{StateTax}_{i}} \hfill \\
& \quad \,+\, {\beta _{{\text{1}}0}}{\underline{Railroad}_{i}} + {\beta _{{\text{11}}}}{\underline{RailroadRevenues}_{i}} + {\beta _{{\text{12}}}}{\underline{VoteParticipation}_{i}} \hfill \\
& \quad \,+\, {\beta _{{\text{13}}}}{\underline{Socialists}_{i}} + {\beta _{{\text{14}}}}{\underline{Zentrum}_{i}} + {\beta _{{\text{15}}}}{\underline{Cath}} - {\underline{Zentrum}}_{i} + {\beta _{{\text{16}}}}{\underline{City}_{i}} \hfill \\
& \quad \,+\, {\beta _{{\text{17}}}}{\underline{CountyPopShare}_{i}} + {\beta _{{\text{18}}}}{\underline{Fringe}_{i}} + {\beta _{{\text{19}}}}{\underline{InstallTime}_{i}} + {\epsilon_{i}} \hfill \\ \end{align*}
The length of time the exchange had been open in the location has been added as a covariate to control for a time trend effect. The practical estimation is then conducted with a Maximum Likelihood approach.
The included spatial effect also has implications for the interpretation of the coefficients of the other covariates (LeSage and Pace Reference LeSage and Pace2009; Esteves and Mesevage Reference Esteves and Mesevage2019). The resulting coefficients demonstrate a direct effect but do not account for a possible feedback loop through the network linkage between the locations. For example, a railroad station is opened in town A, which then sees the direct effect on adoption as estimated. However, neighbor town B also sees an impact as its external network effect depends on the outcome level of A and consequently on the impact of town A’s railroad station. The impact on B then feeds back to A through A’s external network effect. Consequently, if there is such a network effect between locations, any direct effect from a particular local characteristic in one place will affect the outcomes in other places, and through that, then also result in an indirect effect in the original location itself.
Results
Table 4 shows the results for 1905 when adding the different sets of location characteristics into the estimation, while Table 5 shows the corresponding indirect and, consequently, total effects for the full specification.Footnote 30 Due to the focus on the spatial network effect as a separate mechanism, the discussion of the control variables, however, refers primarily to the direct effects.
Table 4 ADOPTION OF TELEPHONE LINES 1905

Notes: * p < 0.05, ** p < 0.01, *** p < 0.001, standard deviation in parentheses. Population rescaled by 10 for readability.
Source: Author calculations.
Table 5 NETWORK SPATIAL FEEDBACK EFFECTS

Notes: The direct effects are from Column (4) of Table 4, the indirect effects are calculated with the “impacts” function of the “spatialreg” package in R. This function is based on LeSage and Pace (Reference LeSage and Pace2009), which shows how to trace and quantify the spatial lag feedback (indirect) effect given the direct effect of a covariate on the outcome and the spatial lag structure. The total effect is the sum of direct and indirect effects.
Source: Author calculations.
Starting with the market access variables, the network effect of connections with other locations (ρ) has a consistently significant and positive effect. More subscribers in one location led to more subscribers in other locations. Interestingly, the general, non-communication-specific external market access factor (MA Population) turns from small and positive to slightly negative when adding more control factors, highlighting that spatial network effects between towns were primarily due to the possibility of calling between them rather than a general economic linkage. Market access abroad also had a small effect—a position close to the border (border) increased the adoption rate by about 0.2 percentage points.
Combining the estimated spatial network effect (ρ), the distance matrix (W), and the number of phone lines (y) allow me to calculate the size of the network effect for each townFootnote 31 —how many lines were associated there with the connection to lines in other towns. Overall, about 4.5 percent of lines, or 2,240 out of 49,529, are associated with this effect, though its relative size varies between towns, from essentially zero to one, with a median share of 0.17 and mean share of 0.25. This corresponds closely to the size of the indirect effect, shown in Table 5, which strengthens the magnitude of the effect of other factors by 4.2 percent.
The estimated size of the local market, including the general demand reflected in the local population (population) and specific demand seen in postal and telegraph revenues (post revenues, telegraph rev.), shows a significant and positive impact on the adoption rate. The size effect is consistent with a network effect within the local exchange network: the higher potential number of lines led to more subscribers and so a higher relative number of participants. The effect of general population size is fairly small: 100,000 more people are associated with a 0.2 percent point higher participation rate, pointing toward an effect that is primarily relevant for large cities. The effect of demand in the local markets is notable, with the difference between the 25th and 75th percentiles of postal revenues associated with 0.25 percentage points of higher adoption.
The economic factors do show a pattern that differs substantially from that found for the exchange diffusion process. While the employment ratio (employment ratio) again has a positive impact, there is a significantly positive and larger effect of agriculture (agriculture). Tax revenues (state tax) also had a positive but quite small effect.
Notably different is also the significant impact of the railroad (rail station, rail revenues). The negative effect of the station dummy and the positive impact of railroad revenuesFootnote 32 show that the effect is contingent on the local usage pattern. However, except for a small number at the upper end, the combined effect is slightly negative for most locations.
This indicates a clear separation of the telephone network from physical transportation networks. Although the telegraph had started to split communication and transportation networks (Wenzlhuemer Reference Wenzlhuemer2017), it retained a close link to transportation technology,Footnote 33 especially the railroad (Johnston Reference Johnston2021; John Reference John2010). In contrast, the results here confirm that the telephone developed much more independently and furthered the emerging divergence of the networks for communication and transportation.
In contrast to the exchange diffusion, the adoption of phone lines was the result of decisions by individuals. Consequently, political variables reflect more cultural differences than political processes. A location with 10 percent Socialist (Socialist) rather than liberal votes saw a 0.1 percent higher adoption rate, while 10 percent “Zentrum” votes (Zentrum) rather than liberal votes saw a small −0.03 percent gap.
MARKET ACCESS CONSIDERATIONS
The results and data allow further exploration of the role of market access, especially with regard to effects over time and along the location size distribution.
Figure 4 plots the cumulative number of exchanges established over time, as well as two counterfactual diffusion curves. One shows the counterfactual number of exchanges when the estimated effect of external market access is removed, and the other when the respective effect of the local town population is removed. Figure 5 plots the relative ratio of the counterfactual numbers to actual exchanges.

Figure 4 COUNTERFACTUAL EXCHANGE DIFFUSION
Notes: The graph plots the predicted number of exchanges in counterfactual scenarios without the external Market Access effect as well as without the Town Size effect.
Source: Author calculations based on paper data set.

Figure 5 RELATIVE EXCHANGE DIFFUSION WITHOUT MARKET ACCESS EFFECTS
Notes: The graph plots the relative share of exchanges predicted to have been established without the estimated external Market Access respective the Town Size effect.
Source: Author calculations based on paper data set.
The ratio for the counterfactual without external market access shows a wave-type pattern that reflects the bunched decision-making process where the parliament authorized several exchanges at once, which were then established over time. The impact of external market access then is such that the implied delay is within the time frame of one set of exchanges, and therefore small enough to be fully caught up before the next tranche of exchanges is opened. The ratio for the counterfactual without the local effect shows an implied delay of the roll-out by a decade. The next decade then sees a convergence between the two counterfactuals, where the strength of the local population size effect substantially weakens, while the impact of external markets relatively increases. Over the last few years, both have had a very similar, dissipating impact. The results show that larger cities with a larger local market access and associated impact clearly dominated the initial stages of the roll-out, while the timing for smaller places later on was also influenced by external market access. They also indicate that the impact of local population size on the diffusion was strong for the first decade, though not particularly persistent, as the delay would have been fully caught up within another decade or so.
There is a similar pattern visible for adoption. Conducting the adoption analysis for 1900 and 1905 for the 126 towns with an exchange in 1900 shows a strengthening of the spatial network effect of the inter-city connections over time for the whole network, while the effect of general market access moved in the opposite direction. A similar pattern is also visible for the network effect along the size distribution. Figure 6 plots the share of lines due to the estimated external network effectFootnote 34 on town size for 1905. It is very visible that for larger places, starting in the 5,000 to 10,000 range, the influence of external markets was negligible and dominated by local effects. For smaller places, the impact of other places becomes much more varied and substantial, and for some even the dominating effect.

Figure 6 SHARE OF THE LINES DUE TO EXTERNAL NETWORK EFFECT IN 1905
Notes: The graph plots town population against the predicted relative share of phone lines due to the estimated external network effect (nw i/y i), as described in the Adoption of Telephone Lines.
Source: Author calculations based on paper data set.
CONCLUSION
Was it the ability to call a neighbor or to make a long-distance call that drove telephone diffusion and adoption? As it turns out, both played a role. The initial roll-out in larger cities was predominantly influenced by local market size. For these locations, the telephone was essentially an urban amenity whose impact was to foster local connectivity. Later on, the rollout spread to smaller, more rural locations, where external market access was more relevant and influential. For these locations, the telephone was mainly new infrastructure that gave them closer links to other towns and the urban centers of the state, resulting in a much more pronounced role of spatial network effects between towns for residents in these places to get a telephone line.
The found relative impact of market access on the diffusion and adoption of the telephone here points to the ways and mechanisms by which the telephone shaped agglomeration effects. The predominant local network role for larger cities is consistent with the contemporary contention by Günther (Reference Günther1910) and Fuhrmann (Reference Fuhrmann1909) that the telephone enabled a spatial specialization effect within cities. Firms could use the telephone to coordinate multiple sites within the city much more easily, which allowed for the spatial separation of different functions. While production could shift to the suburbs, administration and other relevant functions could locate closer to other relevant firms and institutions, thereby enabling and strengthening the effect of local externalities and spillovers. For smaller towns in the countryside, the telephone allowed farmers to access distribution channels and markets more easily, strengthening local agriculture (Fuhrmann Reference Fuhrmann1909), although the overall effect could have been more ambivalent as the monitoring possibilities through the phone allowed for more spatial separation, which could have led to some activity moving away from their rural locations into larger cities.
The telephone was a technological breakthrough that changed communications for good, particularly strengthening the divergence between communications and transportation networks. The introduction of truly interactive remote conversations shaped how businesses, governments, and individuals dealt with spatially distinct relationships, transforming the existing spatial distribution of economic activity. This study demonstrates that this technology, however, was not just a force that shaped this distribution; it was also influenced by the existing conditions under which it diffused over space. And it shows that the role, and thereby the impact, of the new technology of the telephone showed substantial heterogeneity, from local urban amenity to long-distance connections, as a reaction to the environment it encountered.


 Open access