


Radiocarbon (14C) dates on marine shells from archaeological sites are used to frame the cultural history of coastal peoples throughout the world. However, the measured 14C ages of marine organisms are almost always considerably greater than their true calendar ages because the ocean is depleted in 14C compared to the atmosphere. This discrepancy is referred to as the “marine reservoir effect” (MRE).
If we measure the 14C age of a marine organism—for example, an oyster shell from a hearth on the banks of the lower Potomac River—how do we determine its true calendar age? We need, first, a marine calibration curve to account for the temporally variable age offset between the atmosphere and the globally averaged surface ocean (e.g., Marine20 [Heaton et al. Reference Heaton, Köhler, Butzin, Bard, Reimer, Austin and Ramsey2020]); and, second, we need to know the local correction factor, termed ΔR, which represents the difference between the reservoir age of the global surface ocean and the surface waters of the Potomac River estuary.
Regional ΔR values are estimated from large 14C datasets of known-age or paired specimens, but the distribution of ΔR data is patchy (Figure 1). Even where data are available, correctly calculating or applying ΔR values is not always straightforward. ΔR can vary over short- and long-term time scales (e.g., Culleton et al. Reference Culleton, Kennett, Lynn Ingram, Erlandson and Southon2006; Deo et al. Reference Deo, Stone and Stein2004; Hadden and Schwadron Reference Hadden and Schwadron2019), over short distances (Hadden and Cherkinsky Reference Hadden and Cherkinsky2017a; Rick and Henkes Reference Rick and Henkes2014), and among species at the same time and place (Dury et al. Reference Dury, Eriksson, Savinetsky, Dobrovolskaya, Dneprovsky, Harris, Van Der Plicht, Jordan and Lidén2021; Hadden and Cherkinsky Reference Hadden and Cherkinsky2015). The ΔR term inevitably adds uncertainty to the calibrated 14C date, meaning that dates on shell and other marine organisms are generally less precise than dates on terrestrial materials. These challenges may prompt archaeologists to question when shell dates should be used, or whether 14C chronologies based on marine shell should be trusted.

Figure 1. Distribution of North American ΔR values currently available from calib.org/marine. All values have been updated with respect to the Marine20 curve. (Figure by Carla S. Hadden.) (Color online)
Some coastal archaeologists sidestep these problems by dating alternative materials. For example, Sanchez and colleagues (Reference Sanchez, Rick, Culleton, Kennett, Buckley, Erlandson and Losey2018) relied on dates on terrestrial herbivore bones, rather than previously dated shell, in their analysis of the occupational history of the Par-Tee site on the Oregon coast. The occupational history of the Salishan village of Čḯxwicən, on the coast of Washington State, was derived from 101 dates on wood, with only a single date on shell, despite the archaeological abundance of the latter (Campbell et al. Reference Campbell, Sterling and Lewarch2019; Hutchinson et al. Reference Hutchinson, Butler, Campbell, Sterling, Etnier and Bovy2019). Still, other archaeologists prefer shell as a material for dating. On the west coast of North America, for example, at least half of the approximately 8,000 14C dates from cultural deposits are on marine shell (Hutchinson Reference Hutchinson2020). Schwadron's (Reference Schwadron2017) analysis of shell mound/midden complexes of southwestern Florida included over 200 dates, all on shell. These disparate approaches reflect opposing views on the suitability of shells for 14C dating.
We espouse a moderate position, recognizing the prominence of shell in 14C catalogs and the relative abundance of shell in coastal cultural deposits. We consider that the challenges in dating shell (and assessing the validity of legacy dates) are surmountable but require careful, context-specific attention to the factors that can potentially influence the dates. Here, we review the benefits of dating shell; describe some of the mechanical, chemical, biological, and cultural processes that give rise to age disparities; and evaluate various approaches to mitigating age offsets. Our hope is that these comments will not only aid archaeologists in the planning and interpretive stages of research but also assist in assessing the reliability of legacy chronologies based on marine materials. Although we draw from North American examples and case studies in this article, the broader implications are global.
Why Date Shell?
Given that archaeologists now commonly date short-lived plant remains in order to generate local ΔR values (e.g., Kennedy et al. Reference Kennedy, Russell and Guilderson2005), why continue to date marine shell at all? In many cases the answer is one of expediency, shell often being the most abundant datable material in coastal archaeological deposits. For example, Gifford (Reference Gifford1916) estimated that the shell mounds in San Francisco Bay were 56% shell by weight, but that charcoal fragments accounted for only 0.2%. The ubiquity and abundance of shell is particularly relevant in large-scale reconnaissance and survey projects, where the aim is to quickly document shell midden sites that are actively eroding or being inundated by rising seas. Archaeological surveys of Chesapeake Bay (Reeder-Myers and Rick Reference Reeder-Myers and Rick2019) and the coastal Florida Everglades (Schwadron Reference Schwadron2017), for example, relied on oyster shells—easily recovered from eroding shorelines or from small test excavations—to facilitate rapid, large-scale sampling in order to develop chronologies of at-risk archaeological resources. In addition, ages on shell may be more readily tied to cultural activities, such as studies focused on shellfishing practices or the timing and tempo of the construction of shell-built environments (e.g., Macario et al. Reference Macario, Souza, Trindade, Decco, Lima, Aguilera and Marques2014; Martindale et al. Reference Martindale, Cook, McKechnie, Edinborough, Hutchinson, Eldridge, Supernant and Ames2018; Schwadron Reference Schwadron2017; Thompson et al. Reference Thompson, Marquardt, Cherkinsky, Roberts Thompson, Walker, Newsom and Savarese2016).
Alternative materials for dating are not only comparatively rare in coastal archaeology but do not necessarily produce more accurate dates (Thomas Reference Thomas2008). For example, wood charcoal dates often are older than their archaeological context (“old-wood” effects; Bronk Ramsey Reference Bronk Ramsey2009; Dee and Bronk Ramsey Reference Dee and Ramsey2014). Terrestrial animals that consume marine organisms, including humans, are subject to MRE, whereas dates on freshwater organisms from carbonate terrains need to be corrected for “hardwater effects”—the freshwater analog of MRE (Philippsen Reference Philippsen2013). No material type is without problems.
Last, shell carbonate is one of the easiest materials to date in terms of sample chemistry, even by the earliest conventional methods (e.g., Libby et al. Reference Libby, Anderson and Arnold1949; see Lindauer et al. [Reference Lindauer, Hadden, Macario and Guilderson2021] for an overview of the history of research on 14C in marine carbonates). Strategies for diagenetic screening and chemical pretreatment typically are more straightforward for shell carbonate (e.g., Brock et al. Reference Brock, Higham, Ditchfield and Ramsey2010), making it a more economical option compared to other materials. For some applications, 14C can even be measured in carbonate directly, without conversion to CO2 or graphite (Bush et al. Reference Bush, Santos, Xu, Southon, Thiagarajan, Hines and Adkins2013).
Reservoir Age of the Global Ocean and the Need for a Marine Calibration Curve
14C is part of the global carbon cycle: the mechanical, chemical, and biological processes that move carbon atoms between the atmosphere, ocean, and biosphere. Some processes are fast and others slow, giving rise to differences in carbon turnover rates and residence times, and consequently, differences in the concentration of 14C among the various reservoirs. Here, we briefly review some important characteristics of the marine 14C cycle (Figure 2). We direct the reader to Alves and colleagues (Reference Alves, Macario, Ascough and Ramsey2018) for a detailed review of global marine 14C storage and fluxes.

Figure 2. Potential influences on and sources of 14C to marine mollusk shells. (Figure by Ian Hutchinson.) (Color online)
14C atoms are created from 14N atoms by neutron bombardment in the upper atmosphere and are rapidly oxidized to 14CO2 in the lower atmosphere. Atmospheric 14CO2 is introduced to the terrestrial biosphere via photosynthesis. Dead terrestrial biomass (detritus or soil organic matter) may be transported by wind or water to the surface ocean, contributing “old” (14C-depleted) carbon to marine dissolved organic carbon (DOC) and particulate organic carbon (POC) pools. Atmospheric 14CO2 also diffuses directly from the atmosphere to the surface layer of the ocean. Some is converted to plankton biomass via photosynthesis; some remains as dissolved inorganic carbon (DIC), the form of carbon from which marine mollusks build their carbonate shells. Dead marine organisms sink to the deep ocean, where carbon atoms can remain for millennia before gradually circulating back to the surface as 14C-depleted DIC. The net effect is that the global ocean has proportionally less 14C (relative to the stable isotopes, 12C and 13C) than the atmosphere and terrestrial biosphere, as do all the organisms that incorporate carbon from the ocean into their tissues.
The foundation of the 14C dating technique is that the concentration of 14C declines in an organism's tissues at a predictable rate after its death. Because marine organisms have less 14C to begin with, their 14C clocks have a “head start” compared to terrestrial organisms, typically appearing several hundred 14C years older than terrestrial samples of the same calendar age. This gives rise to the need for a marine-specific 14C calibration curve. Where the terrestrial calibration curve accounts primarily for variation in 14C production, the marine calibration curve also accounts for carbon exchange between the atmosphere and the ocean.
The first marine calibration curve was published by Stuiver and colleagues in 1986, and it has been updated several times with additional datasets and more complex models of carbon circulation to more accurately describe the variability in marine radiocarbon dynamics throughout the radiocarbon record (Heaton et al. Reference Heaton, Köhler, Butzin, Bard, Reimer, Austin and Ramsey2020; Hughen et al. Reference Hughen, Baillie, Bard, Warren Beck, Bertrand, Blackwell and Buck2004; Reimer et al. Reference Reimer, Baillie, Bard, Bayliss, Warren Beck, Blackwell and Ramsey2009, Reference Reimer, Bard, Bayliss, Warren Beck, Blackwell, Ramsey and Buck2013; Stuiver and Braziunas Reference Stuiver and Braziunas1993; Stuiver et al. Reference Stuiver, Reimer and Braziunas1998). The current marine calibration curve, Marine20 (Heaton et al. Reference Heaton, Köhler, Butzin, Bard, Reimer, Austin and Ramsey2020), is based on simulations with an ocean-atmosphere-biosphere box-model of the global carbon cycle, and it incorporates updated information about variability in atmospheric 14C (i.e., IntCal20) and CO2. The revised estimate for the rate of CO2 diffusion is significantly slower than was estimated in earlier curves, meaning that the global-average marine reservoir age is greater than previously thought. The result is in an upward shift of Marine20 compared to previous marine calibration curves (Figure 3).

Figure 3. Relationships among the marine and atmospheric calibration curves, reservoir ages, and ΔR, with comparisons of estimated values based on the 2013 and 2020 calibration curves: (A) calculation of a local marine reservoir age from a hypothetical known-age marine sample; (B) visualization of global marine reservoir age with respect to atmosphere; (C) calculation of a hypothetical ΔR value from a known-age marine sample; and (D) example of a marine radiocarbon date calibrated using Marine13 versus Marine20, with updated ΔR values. (Figure by Carla S. Hadden.)
Some essential concepts associated with marine calibration are reviewed in Figure 3, using the 50–550 cal AD interval as an example. The degree of 14C depletion of a body of water compared to the atmosphere is known as its “reservoir age” (R), measured in 14C years. The reservoir age of a local body of marine water (e.g., a bay, lagoon, or portion of a coastline) is calculated from the 14C age of a local marine sample (e.g., shell carbonate) whose true calendar age is known independently. The local reservoir age is simply the difference between this measured 14C age and the expected 14C age for that calendar year, based on the atmospheric IntCal dataset (Reimer et al. Reference Reimer, Bard, Bayliss, Warren Beck, Blackwell, Ramsey and Buck2013, Reference Reimer, Austin, Bard, Bayliss, Blackwell, Ramsey and Butzin2020; Figure 3A). In contrast, the global marine reservoir age represents the average 14C offset between the atmosphere and the global average surface ocean at a point in time; it is the offset between the Marine and IntCal calibration curves in 14C years (Figure 3B).
ΔR: Local Offsets from the Global Ocean Reservoir Age
Differences in coastal geomorphology, ocean circulation, upwelling, and source-water chemistry produce localized deviations in 14C concentration compared to the global-average ocean. In addition, variations in mollusk habitats, feeding strategies, and growth rates may occur over small spatial and temporal scales. These and other sources of variability give rise to the need for local (ideally, species-specific) correction factors, termed ΔR, which are used in conjunction with the marine calibration curve to calibrate marine shell dates accurately.
ΔR estimates represent localized offsets from the global marine calibration curve (Figure 3C); they account for differences between local (Figure 3A) and global (Figure 3B) marine reservoir ages. Equivalently, ΔR estimates are calculated as the difference between the measured 14C age of a local marine sample whose true calendar age is known independently and the expected 14C age for that year as determined from the marine calibration dataset. “Local” in this usage represents regions of the ocean, or even species within those regions, where the many variables at work produce areas of similar 14C values. These can vary considerably across the globe and over time.
Because the marine calibration curve functions as the baseline for comparison, all ΔR values are necessarily specific to the version of the calibration curve that was used as the reference point. As updated marine calibration curves are released, existing ΔR values must be recalculated based on the new calibration curve. In general, the upward shift of the Marine20 curve compared to Marine13 (i.e., the larger global reservoir age) resulted in a shift toward lower ΔR values (see Figure 3C for a comparison of a ΔR value calculated using Marine13 versus Marine20). Calibrating a shell date using the new calibration curve and updated ΔR results in relatively minor differences in the calibrated date compared to using the old curve with the older ΔR (see Figure 3D for a comparison)—the changes to the former being largely canceled out by changes to the latter. On the other hand, combining an old ΔR with the new curve (or vice versa) would lead to an erroneous calibrated age, potentially wrong by a century or more.
A common mistake is to calibrate a shell date without specifying a ΔR value, which has the same effect as specifying that ΔR = 0 ± 0—a bold and likely wrong assumption that will lead to erroneous calibrated ages and problematic chronologies. First, the “global average ocean” is not a real location on Earth. By default, archaeologists should assume that every real place is offset from the global average, and that an estimate for ΔR is necessary. Second, a shell date calibrated without a ΔR value (i.e., ΔR = 0) would appear 100–200 years older if calibrated using the Marine13 curve compared to the same date calibrated using the Marine20 curve. Again, this curve-dependent offset is largely canceled out when appropriate, updated ΔR values are applied (see Figure 3D).
Published ΔR values derived from known-age shells, mostly dating to the nineteenth and early twentieth centuries, are compiled in the global marine reservoir database (calib.org/marine), accessible via mapping software (Reimer and Reimer Reference Reimer and Reimer2001). Conveniently, all ΔR values in the global marine reservoir database have been updated with respect to Marine20 and should only be used with the Marine20 curve. Note that although the database is an invaluable resource to coastal archaeologists, 14C dynamics change over time (as discussed in the following section). Consequently, ΔR values in the database may not be accurate for the more distant past—a source of additional uncertainty.
Sources of Variability in ΔR
Some of the major sources of regional variability that give rise to local reservoir age offsets are described below. The specific cases mentioned in this section are intended to demonstrate just some of the many ways that localized processes can impart localized 14C signatures on marine fauna. The goal is not a comprehensive predictive guide but rather an overview of some sources of variability that may complicate shell dates in their geographic region of interest.
Source Water Variability: Upwelling
Deep ocean water has been out of contact with the atmosphere for centuries, with reservoir ages significantly greater than the global surface ocean average. The entrainment of deep-water into near-shore areas may be triggered by winds blowing offshore, or by alongshore winds, in combination with the Coriolis effect. Upwelling also can be induced by deflection of alongshore currents by obstacles or by turbulent flow—either across rugged bottom topography or in narrow straits—by large-scale estuarine circulations, or by eddies (either semipermanent, or, as in the case of the Gulf Stream, migratory).
Mollusk shells influenced by these 14C-depleted upwelled waters exhibit measured 14C ages that are significantly older than those unaffected by upwelling (e.g., Ortlieb et al. Reference Ortlieb, Vargas and Saliège2017). The most renowned example of upwelling in North America is associated with the California Current, which intensifies under the influence of northerly winds each spring and summer off the coast from British Columbia to Baja California. Offshore deflection of the southward-flowing waters of the current by the Coriolis force triggers shoreward movement of bottom waters across the shelf. Here, reservoir ages, and therefore ΔR values, are among the largest and most variable in North America (see Figure 1; Hutchinson Reference Hutchinson2020:Figures 1 and 2).
Source Water Variability: Horizontal Advection
The western temperate margins of the world's oceans are under the influence of countervailing subtropical and subarctic gyres, and surface ocean currents along these margins are typically bidirectional. The subsurface currents on the continental slope not only differ in temperature and salinity but also in 14C signatures. The Gulf of Maine is a prime example. The surface circulation pattern in that embayment is dominated by cool Scotian Shelf waters, but the temperature and salinity profiles with depth reflect the influence of subsurface waters intruding into the basin from the warmer Gulf Stream. Eddies shed by meanders in the Gulf Stream entrain slope waters and carry them onto the continental shelf and into the basin (Du et al. 2021), where they rise to the surface. The circulation pattern varies in strength throughout the year and displays considerable decadal-scale variability (Shadwick et al. Reference Shadwick, Thomas, Comeau, Craig, Hunt and Salisbury2010). Changes in the 14C signatures of mollusks from the Gulf of Maine document the effects of horizontal advection, with interannual and decadal-scale variability on the order of 100 14C years in the period from 1680 to 1840 (Lower-Spies et al. Reference Lower-Spies, Whitney, Wanamaker, Griffin, Introne and Kreutz2020).
Fluvial, Terrestrial, and Atmospheric Influences
Estuaries are semi-enclosed, coastal bodies of water in which sea water is significantly diluted with fresh water. The mixing of marine, freshwater, and terrestrial carbon can lead to highly variable estuarine reservoir ages. Rick and colleagues (Reference Rick, Henkes, Lowery, Colman and Culleton2012) observed variability in reservoir age (and thus, in ΔR) on the order of 100–200 14C yr among oyster shells from the Chesapeake Bay and Middle Atlantic regions, which they attributed to the size and complexity of the bay and its watershed. Even small estuaries exhibit high degrees of variability; for example, the weathering of geologic-age carbonate limestone introduces “old” carbon into the Apalachicola estuary in northern Florida, causing ΔR values to vary on the order of centuries (Hadden and Cherkinsky Reference Hadden and Cherkinsky2017a). On islands of the Canadian Arctic, England and colleagues (Reference England, Dyke, Coulthard, McNeely and Aitken2013) observed significant age differences between surface-dwelling and burrowing mollusks, which they attributed to the age and origin of the DIC in the freely circulating ocean water relative to that of the pore water in the surrounding sediment, derived from the flushing of weathered limestone.
“Vital Effects”
An alternative explanation for the 14C age differences observed by England and colleagues (Reference England, Dyke, Coulthard, McNeely and Aitken2013) is the role of dietary carbon. Although shell carbonate is derived predominantly from ambient DIC, some portion (typically <10%) is from dietary (organic) sources, where respired metabolic carbon is incorporated into the shell. The metabolic contribution, however, varies not only between species but with the age and size of the individual (Gillikin et al. Reference Gillikin, Lorrain, Meng and Dehairs2007; Lorrain et al. Reference Lorrain, Paulet, Chauvaud, Dunbar, Mucciarone and Fontugne2004) and can give rise to inter- and intraspecies 14C age offsets. Epifaunal species, such as mussels, feed on the diatoms and cyanophytes that comprise the bulk of the phytoplankton in surface waters. Because the 14C in phytoplankton is at equilibrium with 14C in the dissolved CO2 in the ambient water, these food sources have little impact on shell 14C. In estuarine settings, however, epifaunal bivalves may metabolize older organic detritus (see Figure 2) and incorporate this “old” carbon into their shells.
In some cases, estimates of MRE may be only weakly constrained because of the breadth of the animal's niche. Limpets, for example, can grow from the high tide limit to the infratidal fringe, on wave-exposed rocky reefs and in sheltered estuaries. Individual limpets, however, have small home ranges. Contemporaneous limpet shells in an archaeological midden may have different 14C signatures depending on microhabitat and carbon source (Ascough et al. Reference Ascough, Cook and Dugmore2005).
Further complications arise from the fact that the growth rates of marine mollusks are genetically, ontogenetically, and environmentally determined (Schöne Reference Schöne2008). Significant within-shell variability in shell 14C reflects changes in ambient water conditions over seasonal and annual scales (e.g., Scourse et al. Reference Scourse, Wanamaker, Weidman, Heinemeier, Reimer, Butler, Witbaard and Richardson2012; Wanamaker et al. Reference Wanamaker, Heinemeier, Scourse, Richardson, Butler, Eiríksson and Knudsen2008). However, many taxa cease growth in extreme temperatures. Consequently, the 14C record within an individual shell is a discontinuous archive of ambient marine 14C conditions during a series of annual growth spurts (Schöne Reference Schöne2008).
Strategies for Estimating ΔR
Archaeologists need not quantitatively evaluate every single variable influencing local ΔR values. Rather, ΔR is estimated by measuring the net effect of all variables on a species at a given place and time, accounting for multiple sources of variability by calculating an appropriate measure of uncertainty. This involves measuring the 14C concentration of known-age marine materials and comparing the measured ages to expected ages, using the 14C calibration curves as a baseline for comparison (see Figure 3C). The relationship is often generalized in the literature as

where P is the measured conventional 14C age of a marine sample whose true calendar age is known, and Q is the expected 14C age for that calendar year according to the marine calibration curve (currently Marine20). The latter can be accessed as text files via http://intcal.qub.ac.uk and OxCal software. ΔR values based on earlier curves are updated by changing Q—the expected 14C date—based on the latest marine curve.
Estimates of ΔR rely on 14C measurements of marine materials whose age is known independently. Three general approaches for estimating ΔR are discussed here: (1) measuring the 14C age of known-age “pre-bomb” marine carbonates (e.g., live-collected museum specimens), (2) measuring the 14C ages of pairs of marine and terrestrial samples that are of unknown age but are assumed to be contemporaneous (Ascough et al. Reference Ascough, Cook and Dugmore2005), and (3) estimating from Bayesian chronological modeling.
Known-Age “Pre-bomb” Carbonates
Atmospheric tests of thermonuclear bombs in the 1950s and early 1960s led to a near doubling of the level of 14C in the atmosphere (Levin and Kromer Reference Levin and Kromer2004; Levin et al. Reference Levin, Kromer, Schoch-Fischer, Bruns, Münnich, Berdau, Vogel and Münnich1985; Nydal and Lövseth Reference Nydal and Lövseth1983). This 14C “bomb pulse” was also recorded in the ocean (e.g., Druffel Reference Druffel1996; Kastelle et al. Reference Kastelle, Kimura and Goetz2008), albeit somewhat muted compared to the atmosphere and with a time lag that increased with depth. Because the bomb pulse rapidly and significantly altered the reservoir age of the global ocean, 14C ages on “post-bomb” and modern live-collected shells cannot be used to retrodict ΔR values in the more distant past.
Natural history museum collections are an important source of known-age “pre-bomb” (pre–AD 1950) shells for estimating ΔR. Museum records rarely specify whether the shells were collected live or dead, so care should be taken to select specimens that likely died shortly before collection (e.g., periostracum intact; glossy, unbleached appearance; presence of operculum; lack of epibionts on shell interior), avoiding specimens collected from known fossil shell beds. Whereas the local reservoir age, R, is the difference between the measured 14C age and the expected 14C age that corresponds to the known year of collection based on the IntCal curve (Figure 3A), ΔR is the difference between the measured 14C age and the expected 14C age for the known year of collection based on the Marine curve (Figure 3C). The uncertainty of ΔR usually is taken to be the uncertainty of the marine sample 14C measurement (Reimer and Reimer Reference Reimer and Reimer2017), or calculated as $\sqrt {\sigma _P^2 + \sigma _Q^2 }$ (Stuiver et al. Reference Stuiver, Pearson and Braziunas1986).
Published ΔR values derived in this manner are available in the global marine reservoir database. However, archaeologists should be aware of the limitations of ΔR values based on known-age pre-bomb samples. First, the sampling universe is limited by the availability of well-documented and well-curated collections relevant to the region of interest. In many cases, the few museum specimens that do satisfy the sampling criteria are from a limited number of sites, which may not be representative of the entire region. Second, appropriate museum specimens usually were collected in the nineteenth and early twentieth centuries. The resulting ΔR values may not be accurate for the more distant archaeological past due to changes in global climate, ocean circulation, and coastal morphology. Therefore, the “paired sample” approach described below may be used as an alternative to, or in conjunction with, the pre-bomb sample approach to derive more robust regional and temporally specific ΔR values.
Marine–Terrestrial Sample Pairs
Local marine reservoir offsets can be estimated from archaeological materials directly, without relying on materials whose age is known precisely, by comparing the measured 14C ages of pairs of marine and terrestrial archaeological specimens that are assumed to be the same age (Ascough et al. Reference Ascough, Cook and Dugmore2005; Southon et al. Reference Southon, Rodman and True1995). Typically, archaeologists target shells and seed or wood-charcoal samples from the same deposit (e.g., Schmuck et al. Reference Schmuck, Reuther, Baichtal and Carlson2021) or archaeological feature (e.g., Hadden and Cherkinsky Reference Hadden and Cherkinsky2017b) for sampling.
ΔR calculation is slightly more complicated in this case, but, as with pre-bomb shells, P is the measured 14C age of the marine sample. Q, the expected age, is calculated in three steps: (1) the 14C age of the contemporaneous terrestrial sample is measured and (2) calibrated with the IntCal calibration curve to determine the calendar age, and (3) the calendar age is reverse calibrated with the marine calibration curve (Figure 4). The reverse-calibrated marine age (Q) and resulting ΔR usually do not follow a Normal (Gaussian) distribution. Reimer and Reimer (Reference Reimer and Reimer2017) developed a ΔR calculator (http://calib.org/JS/JSdeltar20/) to simplify this calculation. Their solution uses a convolution integral—an integral that expresses the amount of overlap of one function as it is shifted over another function—to determine a confidence interval for the offset between the observed and expected values. The result is approximated as a Normal distribution, which allows for a simpler estimation of uncertainty.
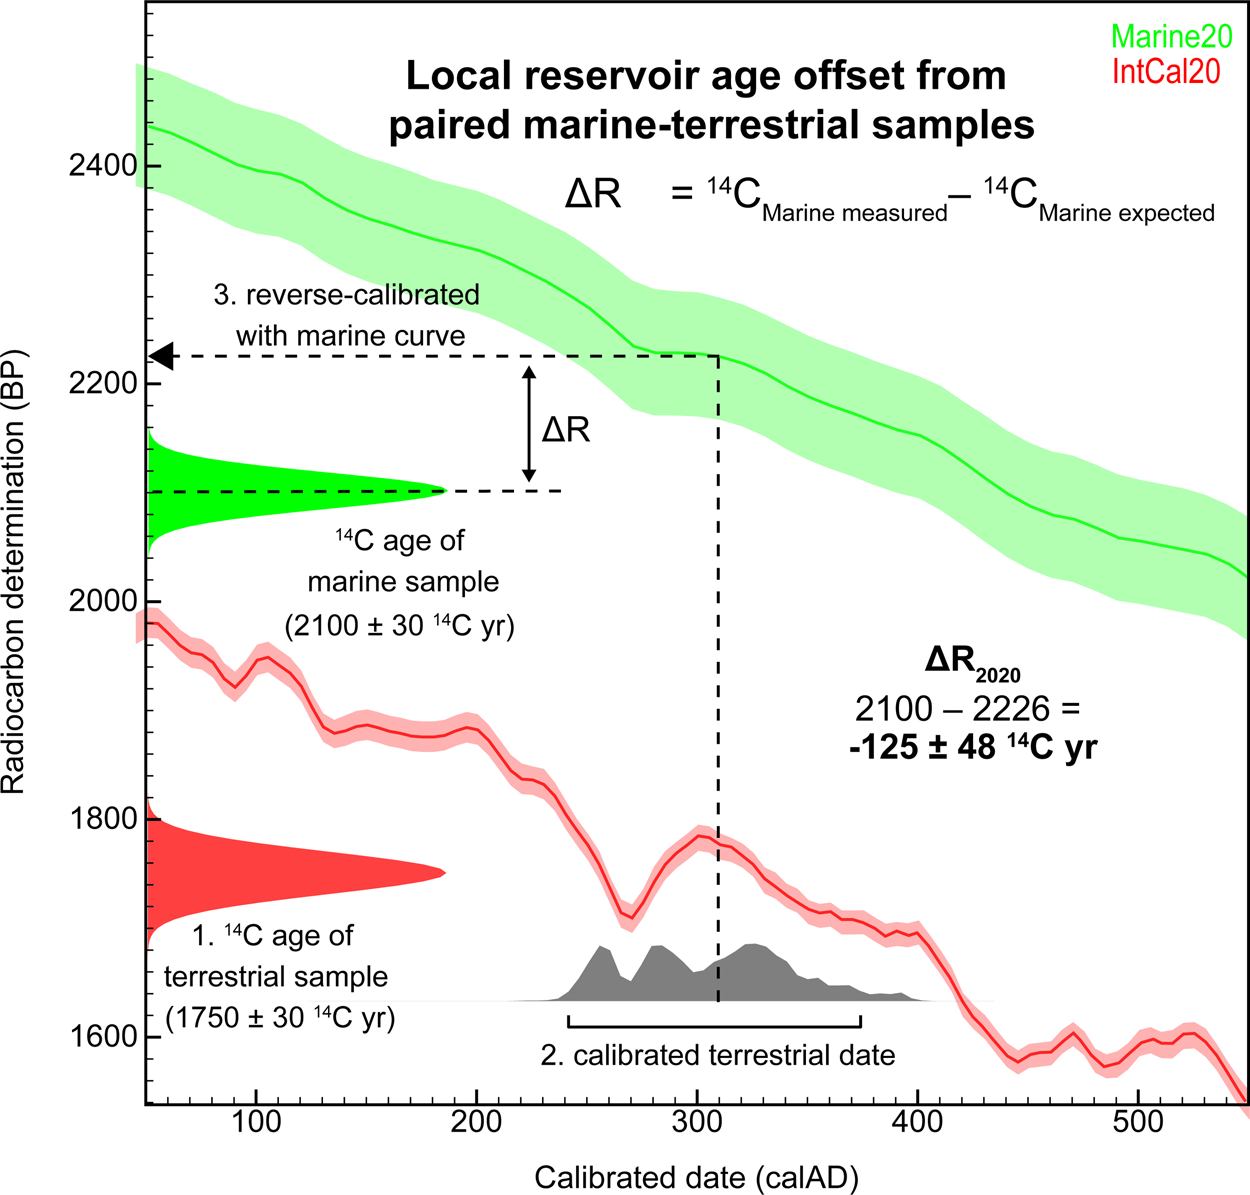
Figure 4. Simplified overview of calculating ΔR from paired marine and terrestrial samples, where Q—the marine expected age—is estimated as follows: (1) the radiocarbon age of the terrestrial sample is measured, (2) the terrestrial date is calibrated with the IntCal calibration curve, and (3) the resulting calendar age is reverse calibrated with the marine calibration curve. (Figure by Carla S. Hadden.) (Color online)
ΔR estimates derived from paired samples generally are less precise (i.e., larger uncertainty terms) than those from pre-bomb shells (see Figure 5 for an extreme example), not only because the 14C ages of both the shell and the charcoal samples are inherently uncertain but also because their absolute contemporaneity usually cannot be independently established. For this reason, ΔR values estimated using this approach are excluded from the global marine reservoir database. Extreme variation in ΔR values among paired samples, as demonstrated in Figure 5, are likely the products of stratigraphic disturbance; the samples were incorrectly assumed to be contemporaneous.

Figure 5. Probability density functions (100-year bins) of ΔR values derived from 15 late Holocene shell–wood pairs from five archaeological sites in Puget Sound (Washington State; Deo et al. Reference Deo, Stone and Stein2004; ΔR recalculated with Marine20) and pre-bomb shells from 15 sites in Puget Sound and adjacent waters (calib.org/marine). (Figure by Ian Hutchinson.)
Like their pre-bomb counterparts, regional ΔR values derived from shell-wood pairs are specific to a time period. Attempts to quantify temporal variation in ΔR requires dating shell-wood pairs from a range of chronological contexts (e.g., Deo et al. Reference Deo, Stone and Stein2004), abetted and constrained, perhaps, by ΔR values from nonarchaeological data sources (e.g., Jazwa and Rosencrance Reference Jazwa and Rosencrance2019; Thakar Reference Thakar2014).
Regional ΔR Values and Uncertainty
A ΔR value derived from a single known-age shell date or marine–terrestrial pair does not provide a statistically robust estimate of ΔR value for the region/population of interest (Cook et al. Reference Cook, Ascough, Bonsall, Derek Hamilton, Russell, Sayle, Marian Scott and Bownes2015; Martindale et al. Reference Martindale, Cook, McKechnie, Edinborough, Hutchinson, Eldridge, Supernant and Ames2018). We join with Heinemann and colleagues who, commenting on a parallel research problem, noted that shell carbonate
can only be used as a proxy archive if the combination of environmental conditions and the major contribution of biology are considered. Therefore, the data stress the importance of replicating at the biological level, i.e., measure several animals from the same location and time, even though this drastically increases the measuring effort [Heinemann et al. Reference Heinemann, Hiebenthal, Fietzke, Eisenhauer and Wahl2011:7].
In addition to real variability in ΔR due to environment and biology, Cook and colleagues (Ascough et al. Reference Ascough, Cook, Church, Dugmore, McGovern, Dunbar, Frioriksson and Gestsdóttir2007; Cook et al. Reference Cook, Ascough, Bonsall, Derek Hamilton, Russell, Sayle, Marian Scott and Bownes2015; Russell et al. Reference Russell, Cook, Ascough, Marian Scott and Dugmore2011) argue that the implicit assumption of contemporaneity may lead to substantial errors, despite stringent precautionary measures to minimize spurious associations. Cook and colleagues (Reference Cook, Ascough, Bonsall, Derek Hamilton, Russell, Sayle, Marian Scott and Bownes2015) recommend that typically four marine-sourced materials and four contemporaneous terrestrial materials be dated from a stratigraphic unit, resulting in 16 individual ΔR values calculated pairwise, to calculate the average ΔR for a particular site or region. Fewer samples may be sufficient, or more samples may be necessary, depending on the size of the study area and the complexity of 14C dynamics therein. Replicate sampling adds considerably to the expense of the investigation but increases confidence in the resultant ΔR value and, therefore, the archaeological chronology (Martindale et al. Reference Martindale, Cook, McKechnie, Edinborough, Hutchinson, Eldridge, Supernant and Ames2018).
Chi-squared (χ2) tests as described by Ward and Wilson (Reference Ward and Wilson1978) are frequently used in ΔR research to test for homogeneity of replicate samples within a dataset. For example, Rick and colleagues (Reference Rick, Henkes, Lowery, Colman and Culleton2012) utilized the χ2 test to evaluate whether individual ΔR values calculated from known-age pre-bomb museum specimens were similar throughout Chesapeake Bay and therefore could be combined to calculate a regional average ΔR, or whether subregional averages were necessary. Cook and colleagues (Reference Cook, Ascough, Bonsall, Derek Hamilton, Russell, Sayle, Marian Scott and Bownes2015) recommend using χ2 tests with the paired-sample approach to verify that archaeological samples of the same material type are contemporaneous—and removing those that are not—prior to calculating ΔR. Schmuck and colleagues (Reference Schmuck, Reuther, Baichtal and Carlson2021), however, caution against the arbitrary removal of outliers, arguing that to do so sacrifices accuracy for the sake of precision. Although outliers that are obviously related to errors in measurement or context should be identified and removed, they argue that many outliers reflect real variability in animal biology or the environment and should be included in regional average ΔR estimates.
To calculate a regional or site-level average ΔR, the pooled mean (μ) of replicate samples generally is used:

where ΔRi and σ i are the individual ΔR values calculated for known-age samples or sample pairs and their individual uncertainties (based on Ward and Wilson's [Reference Ward and Wilson1978] method for combining 14C dates; see also Reimer and Reimer Reference Reimer and Reimer2001).
There are many methods for calculating the uncertainty for an average ΔR value, summarized by Alves and colleagues (Reference Alves, Macario, Ascough and Ramsey2018:Equations 13–16). Care must be exercised to ensure that an appropriate method for calculating uncertainty is applied for regional ΔR estimates derived from multiple individual animals or sample pairs. Reimer and Reimer (Reference Reimer and Reimer2001), citing Bevington (Reference Bevington1969), report uncertainty as the maximum of the weighted uncertainty in the mean of ΔR

and the standard deviation of ΔR

Cook and colleagues (Reference Cook, Ascough, Bonsall, Derek Hamilton, Russell, Sayle, Marian Scott and Bownes2015) recommend the standard error for predicted values of ΔR, calculated as

The weighted uncertainty in the mean tends to decrease as the number of measurements increases, regardless of the dispersion and variance of the individual measurements. The weighted uncertainty may be appropriate if the individual ΔR values are statistically identical (i.e., they pass a χ2 test). Otherwise, it tends to overestimate certainty and precision of the regional average ΔR. In contrast, the standard deviation and the standard error for predicted values of ΔR both account for the variance in the dataset. These tend to result in larger measures of uncertainty but better reflect the range of variability that might influence the 14C content of an archaeological assemblage of shells. The standard deviation and the standard error for predicted values usually produce comparable results (Schmuck et al. Reference Schmuck, Reuther, Baichtal and Carlson2021).
The goal in selecting a method for estimating uncertainty is not necessarily to calculate the smallest possible value. Rather, it is to ensure that the uncertainty term on a regional ΔR value adequately reflects the range of variability in ΔR over space and time. In practice, this means that a larger, more conservative uncertainty term is likely to produce a more accurate, albeit less precise, calibrated date for a sample of unknown age. In contrast, a smaller uncertainty term may result in a more precise calibrated age, but one that may not be accurate. When determining an appropriate measure of uncertainty for a regional average ΔR, often two measures of uncertainty are compared—such as the standard deviation and the weighted uncertainty—and the greater of the two values is used (e.g., Reimer and Reimer Reference Reimer and Reimer2001; Rick et al. Reference Rick, Henkes, Lowery, Colman and Culleton2012).
Bayesian Approach to Estimating ΔR and Uncertainty
In many archaeological cases, ΔR data available for the region of interest are scarce or problematic. For example, a very small number of individual ΔR values are published; or data are available but vary widely and/or do not appear to follow a Normal (Gaussian) distribution; or a mix of marine and terrestrial dates are available for an archaeological site, but the contemporaneity of the samples is not secure. In cases such as these, a Bayesian model-based approach may be suitable for incorporating this limited or problematic information about ΔR into a chronological model in a mathematically robust manner.
Macario and colleagues (Reference Macario, Souza, Aguilera, Carvalho, Oliveira, Alves and Chanca2015) demonstrated the use of Bayesian chronological modeling implemented in OxCal software (Bronk Ramsey Reference Bronk Ramsey2009) to estimate ΔR in such a scenario. In their case study of the coast of Rio de Janeiro, Brazil, the archaeological dataset consisted of a mix of both marine and terrestrial dates from a single shell mound; however, none were contemporaneous sample pairs. Macario and colleagues suggested a simple, conservative solution. The set of marine and terrestrial dates were modeled together within a single OxCal Phase (defined as a group of possibly related events). Rather than specifying ΔR as a Normal distribution described by the parameters μ and σ, as would normally be the case, they described ΔR as a Uniform distribution over a large range of plausible values (e.g., between −600 and +600 14C yr) following Bronk Ramsey and Lee (Reference Bronk Ramsey and Lee2013).
The use of an intentionally vague prior estimate for ΔR in effect serves as a placeholder, allowing ΔR to take any value over the range specified. The limits of this distribution can be chosen to cover the full range of reservoir offsets reported for the globe, or for a super-region. Additional chronological constraints that are commonly used in Bayesian chronological modeling—such as site stratigraphy, TPQs and TAQs, etcetera—can be incorporated as usual, as can prior probabilities for outliers, mixed calibration curves, and alternative dating methods such as OSL dates. Once the model is run, an updated “posterior probability” is calculated for all model parameters, including for ΔR, as well as the modeled calibrated dates (marine and terrestrial). The result is a probability distribution for ΔR limited by the initial range specified and all other model parameters. A North American example of this application (with OxCal code) can be found in Hadden and Schwadron (Reference Hadden and Schwadron2019).
Issues of Archaeological Context
A 14C date on a wooden artifact, or charcoal from a hearth, reflects the time at which atmospheric carbon was permanently assimilated into the wood of the tree—not the year the tree was felled, when the timber was used, or when the wood was burned (Schiffer Reference Schiffer1986). Each tree ring represents a single year of growth, and many species have long lifespans. Therefore, different regions of the tree will yield different 14C ages. Often, 14C dates on wood are at least slightly older than their archaeological context (Dee and Bronk Ramsey Reference Dee and Ramsey2014). The potential for an “inbuilt age” of living wood, combined with the fact that wood could be used by people long after the death of the tree, is commonly referred to as the “old wood” problem.
Archaeological mollusks have an analogous problem: “old shell.” Like trees, marine mollusks grow incrementally and are potentially long lived, and different regions of a shell yield different 14C ages (e.g., Hadden and Cherkinsky Reference Hadden and Cherkinsky2017b; Kilada et al. Reference Kilada, Campana and Roddick2007). However, most shellfish gathered by Indigenous peoples on the shores of North America were relatively young individuals, typically under 20 years old (e.g., Cannon and Burchell Reference Cannon and Burchell2009). More problematically, archaeological deposits may include shells that predate the event of interest, such as reworked midden deposits, curated/heirloom shell objects, or “dead collected” shells (e.g., Edinborough et al. Reference Edinborough, Martindale, Cook, Supernant and Ames2016; Martindale et al. Reference Martindale, Letham, McLaren, Archer, Burchell and Schöne2009; Thompson et al. Reference Thompson, Marquardt, Cherkinsky, Roberts Thompson, Walker, Newsom and Savarese2016).
The archaeological record is “a massive palimpsest of derivatives from many separate episodes” (Binford Reference Binford1981:197). Resolving separate episodes is rarely possible, except at a very coarse chronological resolution. This, combined with the “old wood” and “old shell” problems, limits the accuracy and precision of ΔR values derived from archaeological samples because the paired-sample approach relies on the assumption that the samples are contemporaneous. If, for example, the wood charcoal was actually 50 years older than the shell with which it is “paired,” the resultant ΔR estimate would be off by 50 years. Culleton and colleagues (Reference Culleton, Kennett, Lynn Ingram, Erlandson and Southon2006) suggest averaging out the 14C variability within shells by sampling across multiple increments, analogous to dating bulk charcoal. Given that the trees may have lifespans that are an order of magnitude greater than those of harvested mollusks, the difference in time averaging represented by the two bulk samples may introduce additional error. Ideally, paired samples should be from secure contexts, and they should represent short periods of growth—for example, charcoal from seeds or twigs paired with juvenile, live-collected shells.
Last, selecting and applying an “appropriate” value for ΔR (and its uncertainty) introduces subjectivity to the dating process. Different assumptions about the origin of the shell and the 14C dynamics in the source water will alter the calibrated age. For marine-shell trade goods, such as beads, the potential source region may span hundreds of kilometers of coastline (e.g., Hadden et al. Reference Hadden, Cherkinsky, Smith, Ollivier and Pan2017). Even in cases where shellfish are assumed to have been harvested locally, ΔR can vary significantly within even small estuaries (Hadden and Cherkinsky Reference Hadden and Cherkinsky2017a). The archaeologist's choices about whether and how to incorporate this information directly impact the accuracy and precision of the resulting calibrated date.
Practically speaking, in most cases, marine shell dates are accurate within a few centuries. In some applications, such as regional reconnaissance surveys (e.g., Reeder-Myers and Rick Reference Reeder-Myers and Rick2019; Schwadron Reference Schwadron2017), this scale of chronological resolution is adequate (Martindale et al. Reference Martindale, Marsden, Patton, Ruggles, Letham, Supernant, Archer, McLaren and Ames2017). However, the palimpsest nature of shell midden sites, combined with the inherently limited resolution of archaeological chronologies derived from shell, limits the types and time scales of observable human behaviors (Bailey Reference Bailey2007). Century-scale patterns often can be ascertained from marine shell dates. Chronologies on the human generational scale are rare but possible (e.g., Letham et al. Reference Letham, Martindale, McLaren, Brown, Ames, Archer and Marsden2015). Attempts to resolve cultural phenomena at finer scales from shell dates alone, even with high-precision Bayesian modeling, warrant skepticism.
Concluding Remarks
Marine shell is commonly the most abundant material excavated in coastal North American archaeology and one of the most readily available materials for 14C dating in those contexts. However, building reliable archaeological chronologies from marine shell dates is fraught with challenges. Although we are of the opinion that a healthy skepticism of shell dates is warranted, we argue that the challenges are rarely insurmountable. To that end, we offer the following words of advice to the coastal archaeologist:
• Always publish measured 14C ages and associated data (e.g., taxonomic information), not just calibrated age ranges, to allow comparison with previously published sources and to facilitate future recalibration efforts. This is true both for marine reservoir datasets and for cultural chronologies.
• (Re)calibrate shell dates using the latest curve, especially when comparing new and old datasets. Beware that comparing shell dates calibrated with different curves may introduce systematic offsets if ΔR values are not updated.
• ΔR values are calibration-curve specific. Old ΔR values must be updated for use with new calibration curves. All ΔR values in the global marine reservoir database (calib.org/marine) have been updated with respect to Marine20 and should only be used with the Marine20 curve. ΔR estimates obtained from other sources must be recalculated manually prior to use with the new curve.
• The “global average ocean,” where ΔR = 0 by definition, is not a real place. Assume that a local offset exists in your region and that a ΔR value is necessary to accurately calibrate your marine shell dates.
• Use replicate samples to calculate regional average ΔR values. Sample size depends on the heterogeneity 14C in the marine environment. A ΔR value from a single marine–terrestrial pair or known-age shell date is not a statistically robust estimate of a regional ΔR.
• Many methods exist for calculating uncertainty for regional average ΔR values. The goal is to select one that adequately reflects the range of variability in ΔR over space and time. Accuracy is more important than precision. We recommend the standard deviation or the standard error for predicted values of ΔR in most cases.
• Calibrated shell dates are inherently less precise than most terrestrial dates due to uncertainty in ΔR. This limits the types and time scales of observable human behaviors. The research question should guide the sampling strategy.
• Decisions about the “appropriate” value for ΔR (and its uncertainty) introduces subjectivity to the dating process. These decisions may have unintended consequences.
Beyond coastal archaeology, the issues raised here about dating marine shell should prompt all archaeologists to think critically about chronology building, sample selection, and calibration. Other material types have similar or analogous issues: hardwater reservoir effects in freshwater systems (Philippsen Reference Philippsen2013), mixed and variable carbon sources in terrestrial animal tissues (Cramb and Hadden Reference Cramb and Hadden2020), and even offsets in terrestrial plants related to growing seasons (Manning et al. Reference Manning, Kromer, Cremaschi, Dee, Friedrich, Griggs and Hadden2020) introduce uncertainty in the 14C record. As archaeologists demand ever greater precision from 14C chronologies, understanding the nuances of 14C dynamics becomes increasingly important.
Acknowledgments
This manuscript is dedicated to coastal archaeologists, especially the shell daters and the shell haters who inspired this attempt to find a middle ground. Thanks to the contributors of the Canadian Archaeological Radiocarbon Database and the Global Marine Reservoir Database, to Meghan Burchell and Rowan Lockwood for input on shellfish age-of-harvest, and Edgar Alarcón Tinajero for translation assistance. The manuscript was greatly improved by comments and suggestions from Torben Rick and an anonymous reviewer.
Funding Statement
The work was partially funded by the University of Georgia and the University of British Columbia.
Data Availability Statement
No new datasets were generated or analyzed in this study.
Competing Interests
The authors declare none.


 Open access