


Introduction
In the spring of 2016, Social Science History featured a comparative analysis of Canadian and American urbanization (Kim and Law Reference Kim and Law2016) to which we respond with a similarly designed study of Australia. Grounded in institutional economics, Kim and Law’s study joined an emergent literature which poses that institutions sculpt economic geography through their control of resource allocation (Samuels Reference Samuels1995; Acemoglu et al. Reference Acemoglu, Johnson and Robinson2001). Contrary to neoclassical economics, where markets are singular drivers of the economy, institutional economics emphasize “the rules of the game” (North Reference North1990: 3), the foundational, formal and informal constraints on capital accumulation which condition how economic forces influence development (Glaeser et al. Reference Glaeser, La Porta, Lopez-de-Silanes and Shleifer2004; Acemoglu et al. Reference Acemoglu, Johnson and Robinson2005; Huggins Reference Huggins2016).
Relative to economic geography, institutional perspectives have been integral to developing theories of settlement patterns. Urban primacy, a settlement pattern defined by one dominant city and an absence of second cities (Jefferson Reference Jefferson1939), is associated with the capitals of centralized polities where subnational and/or local government is weak, implying centralized development is concomitant with centralized power (Kim and Law Reference Kim and Law2016: 121). In nearly all cases of primacy the primate city is a political capital (Short and Pinet-Peralta Reference Short and Pinet-Peralta2009), a constant suggesting political institutions reinforce primacy regardless of whether or not further agglomeration in the primate city is optimal (Henderson Reference Henderson2003; Anthony Reference Anthony2014). Conversely, decentralized economic geography is common of federations comprised of strong subnational governments (Ades and Glaeser Reference Ades and Glaeser1995; Aroca and Atienza Reference Aroca and Atienza2016).
Kim and Law’s (Reference Kim and Law2016) comparative analysis followed studies of urbanization which linked the balance of power between a country’s tiers of government with variations in primacy (Kim and Law Reference Kim and Law2012). In the Americas, Kim and Law (Reference Kim and Law2012) measured national capital city population magnetism to be strongest where sub-national government is weak, weakest where sub-national government is strong. Canada and the United States stood apart for their strong subnational polities within federal systems, decentralized nationalFootnote 1 settlement patterns, and the existence of large non-capitalFootnote 2 cities. Kim and Law (Reference Kim and Law2012, Reference Kim and Law2016) attributed these features to British colonization and localism in the same way they and others have attributed centralized Spanish colonial institutions and weak localism to urban primacy throughout Latin America (Aroca and Atienza Reference Aroca and Atienza2016). Between Canada and the United States, Kim and Law (Reference Kim and Law2016) measured stronger capital city effect in provinces, attributing this to provinces’ wider range of own source revenues (OSRs) whilst overseeing relatively weaker local governments. Canadian local governments are more reliant upon, and have little basis to oppose, well-resourced and hands-on provinces whereas US local governments are usually afforded broader autonomy, rights, and revenue channels (Kim and Law Reference Kim and Law2016). Thus, strong local governments possess the autonomy to develop regardless of how their potential is perceived in the capital. Meanwhile, weak local government renders development beholden to and bottlenecked in higher tiers. Kim and Law (Reference Kim and Law2016: 123) described their results as “highly suggestive of a causal relationship” between the power conferred by capital city status and population because Canadian and American capitals were usually “chosen for political reasons prior to… industrialization.”
In this study, we ask how the above theoretical perspective and applied methods inform an understanding of urbanization in Australia, a similarly wealthy, large, decentralized federation also of British colonial origin. This approach is particularly salient in Australia where beneath a remarkably even national urban hierarchy, states exhibit primacy in their capitals (Short and Pinet-Peralta Reference Short and Pinet-Peralta2009). There has been conjecture about the causes of primacy in Australian states which evoke theories of environmental determinism (Rowland Reference Rowland1977) and first-mover advantages (Neutze Reference Neutze1977) given the present day state capitals were amongst the few oases cited by the 18th and 19th century colonists and served as logical hubs in a challenging wilderness (Statham Reference Statham1990). Still, the capitals’ disproportionate success led Bird (Reference Bird1965) and Statham (Reference Statham1990) to ask if the founders had remarkable foresight, choosing the only pockets of the continent capable of holding millions despite having little experience of Australia.
In the Americas, empirical modeling enabled studies to quantify the population magnetism of location specific institutional, natural, and economic factors, providing statistical insights about the drivers of city populations. To examine Australia, we employ an empirical model of population similarly centered upon the “rules of the game,” fundamental conditions that may impart competitive advantages which vary in space and time across the continent. The central research question guiding our inquiry is, Which location-specific political, natural and economic factors are associated – if any – with population size in Australian major centers?
This research is important and timely because the Australian Federal Government has launched a policy – encapsulated in the report “Planning for Australia’s Future Population,”– which aims to decentralize population from the primate capital cities (Australian Government 2019). The report highlights problems besetting Australian capital cities such as unaffordable housing, traffic congestion, “overcrowded public transport,” and a lack of “shared values and ideals” (Australian Government 2019: 5). To alleviate congestion costs the government aims to decentralize population from large cities into strategic regional centers deemed to have the “potential to support economic and population growth in the regions” through investments in improved infrastructure connectivity (Australian Government 2019: 26). However, in offering a solution the government implies a known root cause of primacy, which we suggest has limited scientific grounding.
This paper is structured into five sections. First, in the background section we describe a century of urban primacy in Australian states and review various explanations. Second, to set the context within which our empirical model exists we recount Australia’s history of federalism focusing upon the balance of intergovernmental power. Third, our methods describes the quantitative research strategy, design, and analytical techniques used in a model of urbanization designed to assess whether certain factors endow cities with competitive advantages. Fourth, we present our results, derived from statistical analyses contextualizing Australian urbanization. Sixth, we discuss and interpret our results, answer questions about limitations, and consider implications. Fifth, we discuss our results, answer questions about limitations and conclude.
Background
Urban primacy in Australia
According to the Australian Bureau of Statistics (ABS, 2019a), Australia is one of the most urbanized nations in the world, with more than 60% of its population living in the six state capitals of Sydney, Melbourne, Brisbane, Perth, Adelaide, and Hobart. Australia is also a large, advanced, capitalist, democratic federation; features consistent with decentralized urbanization (Ades and Glaeser Reference Ades and Glaeser1995). Scholars correctly observe Australia’s even national urban hierarchy (Anthony Reference Anthony2014), however extreme urban primacy in states is apparent upon “closer examination” (Short and Pinet-Peralta Reference Short and Pinet-Peralta2009: 1262).
The high concentration of people in Australia’s state capitals has been a matter of serious concern since the early days of settlement and long part of Australia’s political landscape (Archer Reference Archer2015). By the late 19th century, advocates of decentralization believed Australian cities were unhealthy both to the body and to morality, due to them containing a festering cocktail of overcrowding, decadence, and poverty (Neutze Reference Neutze1974). Following Federation, continued primacy in states undermined widespread optimism, perhaps expectations, that Australia would spread out to prosper, a pervasive sentiment at the time (Rowland Reference Rowland1977). Gradually, optimism was replaced with resignation that the environment would temper expansionism. The perception of a lowly populated, inhospitable Australia is mainstream in the 21st century, with climate volatility reinforcing the impression that regions of Australia are over-populated (Lane Reference Lane2017). Still, high growth in capital city regions continues. In recent years the populations of Sydney and Melbourne have grown by over 100,000 annually (Birrell and Healy Reference Birrell and Healy2018), though this recently declined following the COVID-19 pandemic (ABS 2021). Rapid growth in these cities has meant residents experience significant impacts in terms of rising housing costs, infrastructure provision, and road congestion (Kelly and Donegan Reference Kelly and Donegan2015; Seamer Reference Seamer2019).
To contextualize primacy in Australia, particularly as related to Kim and Law’s (Reference Kim and Law2016) analysis of Canada and the United States, in Figure 1, we compare measures of primacy in Australian states and the Northern Territory with measures for the five most populous Canadian provinces and American states. Primacy is expressed as a percentage: equal to the largest city’s population as a proportion of the state/provincial total urban population (Henderson Reference Henderson2003). In Figure 1, four of five American states exhibit the lowest primacy in the sample except for New York, where 80% of the urban population resides in Greater New York City. California’s measure is also moderately high, where 50% of the urban population resides in Greater Los Angeles. Canadian provinces have higher measures of primacy than American states, with an extremely high measure in Manitoba, and high measures in Quebec, British Columbia, and Ontario. By comparison, Australian states have the highest overall measures, particularly in South Australia (88%), Western Australia (87%), Victoria (83%), and the Northern Territory (82%), where urban populations live almost entirely in capital cities. The lowest measures in Australia, Tasmania (59%) and Queensland (55%), are also high illustrating pervasive primacyFootnote 3 .
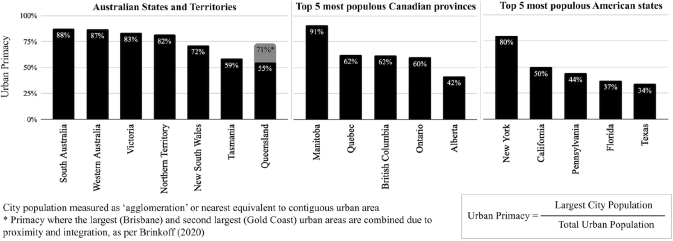
Figure 1. Measures of urban primacy for Australian states compared.
Sources: Statistics Canada (2011); United States Census Bureau (2018); ABS (2019a); Brinkhoff (Reference Brinkhoff2021).
To further contextualize the experience of primacy in Australia we plotted measures of primacy for every decade from 1911 to 2016 in Figure 2 (ABS 2014, 2019a). The trend lines in Figure 2 feature sometimes steep and temporary declines in primacy (e.g., 1950s and 1960s). As opposed to reflecting the ascension of non-capital cities, most declines resulted from the ABS reclassifying a previously rural population center into urban, thereby inflating the denominator of the calculation and muting ongoing and moderate increases in primacy. Whilst the quantity of urban centers increased, the shape of state urban hierarchies was remarkably stable given the long timeframe. In every period the capitals experienced nominal population growth far in excess (by multiples) of all other urban centers in the state. One ‘true’ decline of primacy occurred in Queensland from the 1990s with the emergence of Gold Coast as a major population center, though Gold Coast is arguably part of Greater Brisbane (Brinkhoff, Reference Brinkhoff2021).

Explanations of primacy in Australia
Given Australia’s renowned aridity and heat it seems logical to conclude that the natural environment and primacy are related. Whilst the environment may constrain development to regions of Australia, what evidence is there to suggest this explains the exclusive success of state capitals? Bird (Reference Bird1965) and Statham (Reference Statham1990) both questioned the naturalist narrative that the capitals are relative oases given the founders’ limited experience of Australia. Other accounts of Australian primacy emphasize economics. Stilwell (Reference Stilwell1974) attributed metropolitan dominance to market forces – international capitalism favoring port capitals, exports favoring thin rural populations, modern technology (e.g., rail) allowing capitals to serve vast geographies, and urbanization preceding rural development in Australia.
Interestingly, neoclassical perspectives of primacy do not require the state capital regions to be singular natural oases. They pose that colonial administrative seaports, established in an era of modernity and urbanization, centralized economic activity, thereby minimizing the quantity of urban centers, the capitals prospering on account of their head start (Robinson Reference Robinson1962; Brennan and Brennan Reference Brennan and Brennan1963; Neutze Reference Neutze1977). Thus, Australia’s colonial capitals benefitted from first-mover advantages, enabling them to extend their dominance (Johnston Reference Johnston1977). This path-dependent explanation of primacy suggests inevitability due to institutional habit and economic legacy (Martin and Sunley Reference Martin and Sunley2006: 399). Acknowledging the rigidity of path-dependence, North (Reference North1990: 98–99) cautioned against confounding it with permanence because “at every step along the way there [are] choices—political and economic—that [provide] real alternatives.” Furthermore, neoclassical perspectives sometimes confound urban primacy with urbanization in Australia, demonstrated by the use of the terms “metropolitanization” (Glynn Reference Glynn1975) and “metropolitan dominance” (McCarty and Schedvin Reference McCarty and Schedvin1978) instead of primacy. Importantly, primacy denotes agglomeration in one city, not cities in general.
In the urban primacy literature, theories of primacy partly align with market-driven interpretations such as El-Shakhs (Reference El-Shakhs1972) who posed that in concentrating scarce resources primacy supports early economic development. However, El-Shakhs’s conception of primacy was processual; in large geographies primacy may be a stage of economic maturation where increasing wealth and urbanization portend decentralization (Williamson Reference Williamson1965; Wheaton and Shishido Reference Wheaton and Shishido1981). Where this does not occur, particularly in large, wealthy polities with urban populations over two million, urban economists suggest institutions reinforce further agglomeration in the primate city to the detriment of overall economic growth (Henderson Reference Henderson2003).
Increasingly, contemporary accounts of primacy in Australia acknowledge a role played by institutions. The Australian geographer Langton (Reference Langton2010) paired institutions and primacy by associating regional inequality with state capitals, describing an extractive economic dynamic between capitals and their regions. Bolleter (Reference Bolleter2018) suggested a role played by political history when he posed that the origins of ‘metropolitan dominance’ in Australia can be traced to colonial administration, Australia being a federation of independent colonies tethered to London, not one another (Paris Reference Paris1994, Potts Reference Potts2003). Similarly Eversole and Walo (Reference Eversole and Walo2020) contend that colonial centralization was a catalyst for Australia’s deep city-country divide; the idea that non-capital regions are non-metropolitan, collectively referred to as regional Australia. Most recently, Wilkinson et al. (Reference Wilkinson, McKenzie and Bolleter2022) found that Australia’s configuration of intergovernmental power (e.g. strong federal and state tiers juxtaposed with weak substate government) to be consistent with the international experience of primacy - primate cities are political capitals of centralized governments which dominate their members politically, administratively, and fiscally. However, beyond few qualitative references, what exists of Australian primacy research has limited engagement with institutional economics and empirical techniques.
Australian Federalism
A federation for a continent
After colonization (1788–1901) Australia was federated under its Constitution in 1901. Colonial development in Australia was remarkable for its government centeredness (Aitken Reference Aitken1959). A harsh natural environment compelled the state to fill the void left by reluctant private enterprise (Coleman Reference Coleman2016). Furthermore, colonial governments had easier access to London capital markets than did private enterprise and therefore played a driving role in economic development. In London the colonies were ‘part of the family’ and Australian public loans, whilst speculative, were regulated and closer to home than distance would suggest (Ergas and Pincus Reference Ergas and Pincus2015: 235). In turn, settlers to Australia expected services, looking ‘upon the State as a vast public utility’ for the greater good (Hancock Reference Hancock1930: 72). These nascent proclivities color Australian federalism.
Australia’s Constitution recognizes two tiers of government, Commonwealth and States, and specifies only federal powers (intending to limit them), with those unspecified left in the preserve of states (Fenna Reference Fenna2012). Evident from Constitutional deliberations, this approach followed the nineteenth century American tradition of limited federal government (Commonwealth of Australia 2011). However, it failed to protect state rights because the Constitution provides little guidance about what those state rights are (James Reference James1992). Fenna (Reference Fenna2019: 47) chronicles federal encroachment into state policy arenas and explains that, ‘implicit powers [were] more easily eroded than enumerated ones.’
Localism is not absent in Australia, but a fundamental sphere of the public sector predating ‘states’ by forty years; each colony had local government by the 1860s (Grant and Drew Reference Grant and Drew2017). States manage independent systems of local government dispersed across over 500 Local Government Areas (LGAs) (Ryan and Lawrie Reference Ryan and Lawrie2020). A local tier of government is not provided for in the national Constitution despite two failed referenda to include it (in 1974 and 1988). LGAs were established by states to deliver a narrow range of services (e.g., parks, roads, garbage) and are internationally distinctive in what they do not cover, such as police, school and hospital services which are provided by states (Wild River Reference Wild River2003). In the last fifty years local government responsibilities and capabilities have broadened, however they remain creatures of states, ‘[not] well-springs of a thriving democratic polity’ (Grant and Woods Reference Grant and Woods2016: 247).
Theoretically, constitutional recognition could boost local governments, however much of their weakness derives from state administrative choices, not law. McNeil (Reference McNeill, Dollery and Marshall1997: 21) compares Australian municipalities with American, noting both lack federal constitutional status and are therefore creatures of states, however American political culture favors ‘local political action and participation… giving to local authorities a greater degree of responsibility and autonomy.’ That is, Australian states can empower local governments with relative ease. However widespread skepticism of local capabilities and state paternalism result in weak local government, particularly in legislative and fiscal terms (Wilkinson et al. Reference Wilkinson, McKenzie and Bolleter2022).
Initially Strong States
With federation, six independent colonial tax systems became states, surrendering their customs and excise duties to the Commonwealth. To contextualize the impact federation had on states, in 1897 customs duties were 76% of colonial income (McLean Reference McLean2004). To recover revenues, state delegates inserted a clause into the Constitution to empower/compel the Commonwealth to facilitate federal to state transfers. The evolving terms and methods of this system remain central debates of Australian federalism (McLean Reference McLean2004).
The early decades of federation were marked by tension between nationalists and federalists. Federalists represented Australian conservatism, advocacy for states’ rights, and limited federal government. Nationalists represented Australian progressivism and collectivism, advocacy for centralization on the grounds of nation building. Federalists were the dominant political force in Australia at the turn of the twentieth century. Craven (Reference Craven2005: 2) describes the Constitution as a ‘liberal-conservative artifact,’ referring to Australia’s right-of-center Liberal party. These rivalries retain relevance in contemporary politics, however nationalism ultimately won. Australia’s trajectory of federalism is characterized by the rise of bipartisan centralization and once powerful states being dominated by a growing central government (Fenna Reference Fenna2007, Galligan Reference Galligan, Appleby, Aroney and John2012, Saunders and Foster Reference Saunders, Foster, Halberstam and Reimann2014).
The federalist persuasion began waning five years after federation. In 1906 Australia’s High Court expanded from three to five justices, the additional two being more nationalist in their sympathies, marking the beginning of a centralizing trend (Zimmermann and Finlay Reference Zimmermann and Finlay2010). Centralization accelerated in 1920 following generational change in the High Court (Mathews and Grewal Reference Mathews and Grewal1997) and a new centrist direction, particularly apparent in the Engineers Case (1921) when the Court ruled that the Commonwealth could govern state employee wages, creating the ‘widest meaning possible’ for Commonwealth powers (Mathews and Jay Reference Mathews and Jay1972: 96). This ruling nullified and replaced the reserve rights doctrine (implied state powers are broad) with a literal interpretation of the Constitution (unwritten powers don’t really exist). The case is considered a turning point ‘when a new national spirit took over, [with] a marked centralist tone,’ shifting the federal-state relationship (Nethercote Reference Nethercote2016: 108-109). Australia turned away from the American precedent of broadly interpreted states’ rights and toward a distinctly British administrative precedent (Latham Reference Latham1937).
Prior to the 1920s the states had ‘favorable’ views of Federation, particularly during World War I when ‘the Federation made good… [Australia] took her station among the nations of the world… [and] entered a larger national life’ (Piesse Reference Piesse1980: 199). Furthermore, through state income taxes some states had recovered what they lost in customs duties. By 1920 some states ‘were becoming more financially independent’ leading up to World War II (James Reference James1992: 11). Figure 3 attests to this state self-sufficiency, illustrating states’ initially strong revenue raising powers. The figure features federal, state, and local government own-source revenues (OSRs) as a percentage of gross national product (GNP) for the period 1910 to 2018. OSRs represent a tier of government’s independently generated and controlled income. As a proportion of national product, OSRs indicate a tier’s fiscal strength and economic weight.

Not all Australian states were self-sufficient. The interwar period proved to test and transform the federation as it grappled with three challenges (Prest and Mathews Reference Prest and Mathews1980). First, states and Commonwealth were borrowing in London independently and sometimes in competition. To manage this, in 1927 the Commonwealth and states signed the Financial Agreement creating the Australian Loans Council, effectively centralizing public borrowing (Mathews and Jay Reference Mathews and Jay1972: 109) and signaling federal financial leadership (Burton et al. Reference Burton, Dollery and Wallis2002).
Second, due to the Financial Agreement transfers to states changed from per capita payments to annual interest payments on state debt. This proved problematic in the West and in a 1933 referendum 66% of Western Australians voted to abandon the federal experiment to avoid being impoverished by it (McLean Reference McLean2004). Though unsuccessful, the Commonwealth was moved to address transfer inequities by creating the Commonwealth Grants Commission (CGC), an independent statutory body tasked with ensuring federal transfer equity, with claimant states receiving grants ‘sufficient to bring [their] budgetary position into line with that of the standard non-claimant states’ (Mathews and Jay Reference Mathews and Jay1972: 5).
Third, to service debts incurred during the first World War (1914–1918), the Commonwealth began to ‘invade’ direct taxation by creating forms of income tax (Smith Reference Smith1993: 46). As per Figure 3, by 1920 federal OSRs rivaled states. Effectively the Commonwealth was competing with state income, complicating Australia’s tax system (Burton et al. Reference Burton, Dollery and Wallis2002; Prest and Mathews Reference Prest and Mathews1980). World War II created an emergent need to simplify things in the name of national mobilization via federal uniform income tax. Challenged by four states, the legislation survived in the High Court, not on the grounds of wartime provisions but on Constitutional interpretation, fortifying federal income tax indefinitely. States legally can levy income taxes but it is impractical given little tax room and the fact that increases to state revenues diminish federal transfers (McLean Reference McLean2004; New South Wales Government 2011).
Mid-century federal omnipotence
The balance of power in Australia’s federation shifted dramatically as a result of World War II. The proportion of state revenue from federal transfers increased from 14% in 1939, to 46% by 1947 (CGC 2019). Federal OSRs ascended to over 26% of GNP in 1945 whilst state OSRs declined to Federation-era lows (5%) by 1951 (Figure 3). The Commonwealth was further advantaged in 1949 when the High Court classified retail sales tax as excise duties, effectively assigning sales tax to the Commonwealth and denying states (and local governments by default) a critical source of elastic revenue. ‘Defying all logic… the High Court continued to decree that taxes on consumption were taxes on production and were therefore excise taxes’ (Mathews and Grewal Reference Mathews and Grewal1997: 18). By 1950 the Commonwealth collected 88% of all taxation in Australia (8% by states, 4% by local governments) whilst states retained responsibility for the implementation of education, healthcare, law enforcement, utilities, transportation and other major infrastructure as ‘agents of the Commonwealth’ (Mathews and Jay Reference Mathews and Jay1972: 190).
The postwar reality was one of entrenched vertical fiscal imbalance (VFI), a well examined and oft regretted characteristic of Australian federalism whereby federal revenue exceeds federal spending obligations (Burton et al. Reference Burton, Dollery and Wallis2002). VFI is normal of federations, however in Australia it is controversial due to its extremity relative to ‘all other economically advanced countries’ (Mathews and Grewal Reference Mathews and Grewal1997: 767; McNeill Reference McNeill, Dollery and Marshall1997). Critiques of VFI focus on blurred accountabilities inherent to transfer dependence — the Commonwealth delegates responsibility to states which in turn can claim they are under-resourced. Still VFI persists, mitigated by horizontal fiscal equalization (HFE), a federal transfer system noteworthy for its efficacy to redress federal dominance, flatten interstate differences, and continuously improve the fairness of transfers (McLean Reference McLean2004).
Rising VFI was not passively accepted. Under the conservative Menzies Government (1949–1966) federalism was weakly revived, now termed ‘weak centralism,’ a period where centralization plateaued (Hollander and Patapan Reference Hollander and Patapan2007). As per Figure 3, during this time federal OSRs deflated from their wartime peak to a low of 21% of GNP in 1960, though this would prove temporary. Federal OSRs expanded in the 1960s as the Commonwealth’s fiscal supremacy enabled its gradual legislative expansion into health, welfare, and education (Fenna Reference Fenna2019). Meanwhile states, persistently emasculated by the High Court, appeared resigned to source grants from the Commonwealth rather than test new revenue streams such as consumption/service taxes (Mathews and Jay Reference Mathews and Jay1972). For example, James (Reference James1992) argued that states were sluggish to respond when the Commonwealth abandoned Land Tax in 1952 and that this lethargy precipitated federal encroachment in the 1970s.
New Federalism
By Reinhardt and Steel’s (Reference Reinhardt and Steel2006) account, the history of federal taxation can be divided into two periods. The first covers Federation to the 1970s when Commonwealth and states jostled to establish roles, responsibilities, and defend revenues. After the 1970s focus shifted to harmonization (in the guise of centralization to attain administrative efficiency, cost cutting, etc.) and equity-based improvements to the transfer system. The 1970s were pivotal largely because of the Whitlam Government (1972–1975), which initiated the ‘most ambitious expansion of the Commonwealth’s role in the history of Australian federalism’ (Fenna Reference Fenna2019: 46).
The Whitlam Government saw the Commonwealth’s role as overseer of state deliverables. It ‘took states to task because of their neglect of the local sphere’ through the creation of ‘inter-jurisdictional moderating institutions,’ signifying federal entry into state domains (Chapman Reference Chapman1997: 46). Whitlam’s reforms espoused state power, local power, regional power with the in-practice caveat being centralized orchestration of these powers (Burton et al. Reference Burton, Dollery and Wallis2002). To control states the Commonwealth increasingly conditioned transfers. The usage of ‘tied’ grants accelerated from 13% of state income in 1970 to 23% in 1980 (over 50% by the 2010s) (Fenna Reference Fenna2019). However, Whitlam’s transformative approach with states backfired. Strong political opposition and impasses prompted the Governor General to dismiss the Whitlam government in 1975.
One of Whitlam’s lasting impacts was bringing intergovernmental relations to the fore. The following (Fraser) government introduced the term ‘New Federalism’ to restart relations and achieve ‘partnership and not domination’ (Mathews and Grewal Reference Mathews and Grewal1997: 14). Fraser’s government introduced tax sharing arrangements with states and set up the Australian Council of Intergovernmental Relations. This more cooperative federalism gained momentum under the Hawke Government (1983–1991), which oversaw Special Premiers Conferences, later formalized into the Council of Australian Governments, today a central intergovernmental arena (Burton et al. Reference Burton, Dollery and Wallis2002).
Under new federalism the Commonwealth emphasized state self-reliance and fiscal restraint by decreasing transfers. With this came some fiscal devolution. In 1994 the terms of public borrowing were devolved when the Financial Agreement was amended. Public borrowing became, ‘deregulated… with the states now active players in domestic and global financial markets’ (Commonwealth of Australia 2008). Expenditure devolution also occurred when the Commonwealth introduced the Goods and Services Tax (GST) in 2000, effectively a federal sales tax. GST revenues are collected by the Commonwealth and returned in full (subject to horizontal fiscal equalization calculations) to states as untied funds, now constituting the majority of federal transfers and a windfall for state incomes (Commonwealth of Australia 2008: 52).
Despite new federalism, Australian states remain fiscally dwarfed by the Commonwealth. The decline in Commonwealth OSRs in the 2000s (Figure 3) does not signify a lasting change but reflects Australia’s mining boom and the global financial crisis, which raised national productivity and decreased federal revenues respectively. Most major taxes (e.g., personal and corporate income tax, sales taxes) are the domain of the Commonwealth. State OSRs, whilst keeping pace with economic expansion, are limited to payroll tax, stamp duties, land taxes, gambling taxes, various transaction and service fees/taxes, and mineral extraction royalties (CGC 2019). They are further limited by the fact that improved fiscal capacity decreases federal transfers, as experienced by Western Australia which in 2016 received only 30% of the average GST payment due to its high mining royalties revenue (Commonwealth Grants Commission 2016). Overall, fiscal centralization has left states ‘more bereft of revenue sources than any other such tier in the world’ (Coleman Reference Coleman2016: 2). Furthermore, subnational fiscal weakness compounds at the substate level, with local OSRs being the smallest in every period represented in Figure 3, increasing only marginally from 1% in 1910 to 2% in 2018 whereas Canadian and American local government OSRs were significantly larger (approximately 5% and 7% in 2000 respectively) (Kim and Law Reference Kim and Law2016).
Methods – An empirical model of Australian city populations
Having established a qualitative understanding/history of Australian federalism, we introduce a time-series quantitative model of population guided by Kim and Law’s (Reference Kim and Law2016) comparative analysis of Canada and the United States, which followed Galiani and Kim’s (Reference Galiani, Kim, Costa and Lamoreaux2011) model of political centralization and geographic development. Political centralization/decentralization refers to resource control (e.g., taxation), whether a centralized government taxes then transfers, or a decentralized government devolves fiscal powers throughout the hinterland.
“In the decentralized scenario… locations are allowed to independently set taxes and local public goods [so] the geographic distribution of population between the capital city and hinterland will be determined by differences in economic productivity. In the politically centralized scenario… population distribution between capital city and hinterland depends on the relative weight the central government places on the welfare of capital city versus hinterland residents” (Kim and Law Reference Kim and Law2016: 134).
To examine this relationship, we utilized a deductive-correlational modeling strategy that regressed city populations with location specific factors that might endow a city with competitive advantages (e.g., capital city status, natural endowment, infrastructure). The model enabled us to stratify factors and determine their respective explanatory power.
Correlation is a research strategy that uses statistical models to investigate relationships. Specifically, it seeks to identify a relationship between two or more variables in a data set (Swaffield and Deming Reference Swaffield and Deming2010: 90). Linear regression is used to explore probability and in-detail dependency among two observed variables, including the direction and significance of dependency (Bryman Reference Bryman and Bergman2008; Sharifi et al. Reference Sharifi, Sivam and Boland2016: 1840). To achieve this, research designs often incorporate the technique called multiple regression. This allows investigation of a series of independent variables and one dependent variable to identify which variables exhibit the strongest correlation with others. This may or may not suggest directional cause or effect, but it narrows down the possibilities for investigation (Swaffield and Deming Reference Swaffield and Deming2010: 43). Using multiple linear regressions, we determined how city populations related to political, economic, and natural factors.
Study sites
Our model utilized city population data from Australia’s quinquennial census, featured as “major centers” in historic population statistics (ABS 2014; Australian Bureau of Statistics 2019a) a term combining two Australian Statistical Geography Standard classifications: (i) Greater Capital City Statistical Areas, the population of each capital city urban area and (ii) Significant Urban Areas, urban centers with populations over 10,000 as of the 1991 census. We did not utilize Australian municipal units (LGAs) due to their fractured configuration in major cities (e.g., Sydney, Melbourne, Perth), where there is little alignment between municipalities and urban populations. We expanded the ABS data set to include major centers with populations over 10,000 in any census period, sourced from Australian census records (ABS 1911, 1921, 1933, 1947, 1954, 1966, 1976, 1986) and Brinkoff (Reference Brinkhoff2021) – a total of 94 major centers nationally by 2016, illustrated in Figure 4.
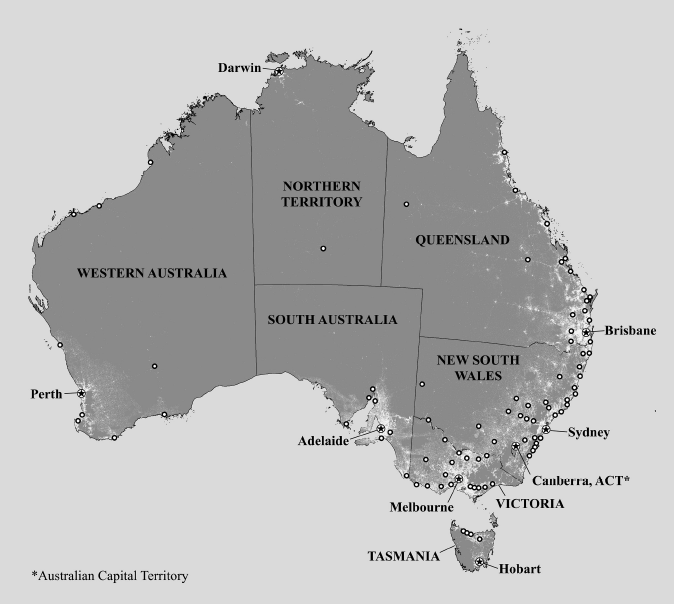
Figure 4. Map of Australian major centers overlaid upon a map of population density.
Sources: ABS (2019a).
Regression factors
Table 1 outlines nine variables identified from the literature utilized in our model of population and how they were measured. The selection of factors largely follows those utilized by Galiani and Kim (Reference Galiani, Kim, Costa and Lamoreaux2011) and Kim and Law (Reference Kim and Law2012, Reference Kim and Law2016), a selection of regression variables focused upon location specific attributes that frame the “rules of the game” and condition development. They are grouped into three categories: Political, natural, and economic. Unlike Kim and Law, we did not include city size (km2) given our city population measures are demographic constructs, not salient political units.
Table 1. Independent variables utilized in model of Australian major center populations

Political factors
We measured two political factors; state capital city status and federal capital city status. There are numerous reasons to anticipate that capital city status will result in higher populations. Whether the capital makes the city, or the city makes the capital, empirical evidence suggests capital city status itself constitutes a competitive advantage (Anthony Reference Anthony2014). This is explained by the ability of capitals to agglomerate government jobs, lobbyingFootnote 4 , and business, thereby sustaining steady growth (Ades and Glaeser Reference Ades and Glaeser1995).
Natural factors
A theory/hypothesis of environmental determinism (the belief that the environment, most notably its physical factors such as landforms and climate, determines the patterns of human culture, settlement, and societal development) informed the selection of natural factors. Kim and Law (Reference Kim and Law2016) examined the presence of major rivers in Canada and the USA, representing a means of aquatic navigation and trade. Due to Australia having few major rivers, we took a broader tack and measured the presence of a navigable waterway, including rivers, canals, bays, estuaries, etc., which are protected from sea swells and accessible to international waters. This included naturally navigable waterways and those made navigable by technology (e.g., dredging). We examined positional factors, latitude and longitude, to control for unmeasured natural and historic circumstances that might have caused population to concentrate regionally. Should either positional factor correlate with population this would suggest the location of larger major centers in a particular region of the continent. Relative to climate, we included high temperature and rainfall given Australia’s renowned heat and aridity. We hypothesized city populations will negatively correlate with temperature, and positively correlate with rainfall.
Economic factors
We regressed two economic factors focused upon transportation and trade infrastructure, the presence of a major seaport and airport. Major ports are included on account of their pivotal economic function in Australia throughout the century (Statham Reference Statham1990). In terms of other economic data, city-specific, industry-level productivity data were unavailable for the period of analysis (e.g., manufacturing, agriculture, and services). Still, the model holds central as the dependent variable, one such economic productivity measure, major center population. That is, individuals are valuable economic actors and their concentrations speak volumes about productivity (Zsolnai Reference Zsolnai2018). Furthermore, the qualification of ports as “major” considers economic productivity.
Statistical analysis
Univariate analyses were run for each year, regressing each factor individually with major center population. Multivariate models were then run for each year, with all factors we tested entered into the model. Our multivariate statistical model regressed the log of major center populations with the all factors outlined in Table 1 entered into the model for each decade (n = 11; 1911Footnote 5 , 1921, 1933, 1947, 1954, 1966, 1976, 1986, 1996, 2006, 2016) with the population and factor data corresponding to that year. We estimated the following regression equation where log(pop)i is the natural logarithm of city i population;
 $$log\left( {pop} \right)i = \beta 0 + \beta 1SCCi + \beta 2FCCi + \beta 3SEAi + \beta 4AIRi + \beta 5Ni + \varepsilon i$$
SCCi and FCCi correspond with state/federal capitals; SEAi and AIRi indicate the presence of a major seaport or airport, and Ni represents the remaining exogenous natural factors.
Results
Table 2 presents statistics describing our sample of Australian major centers. The number of centers multiplied in the 20th century, from 19 in 1911 to 94 in 2016. Meanwhile the concentration of national population in capital cities increased from 38% in 1911 to 67% in 2016. The percent of urban population in capital cities increased from 66% in 1911 to 75% in 2016 (ABS 2019a). As expected, these measures indicate that the capitals, namely Sydney, Melbourne, Brisbane, Perth, and Adelaide enjoyed a disproportionate share of growth. The resulting size discrepancy between capital cities and major centers in general is illustrated by the difference between the median and maximum populations. In 2016 Australia’s largest city (Sydney in all periods) had a population of 5,024,923, while the median population in the sample was 28,238, illustrating the anomalous large scale of the capitals relative to other centers, a reality that necessitated the use of the natural log of population in our statistical model, a means of managing skewness toward larger values.
Table 2. Australian major centers with populations over 10,000
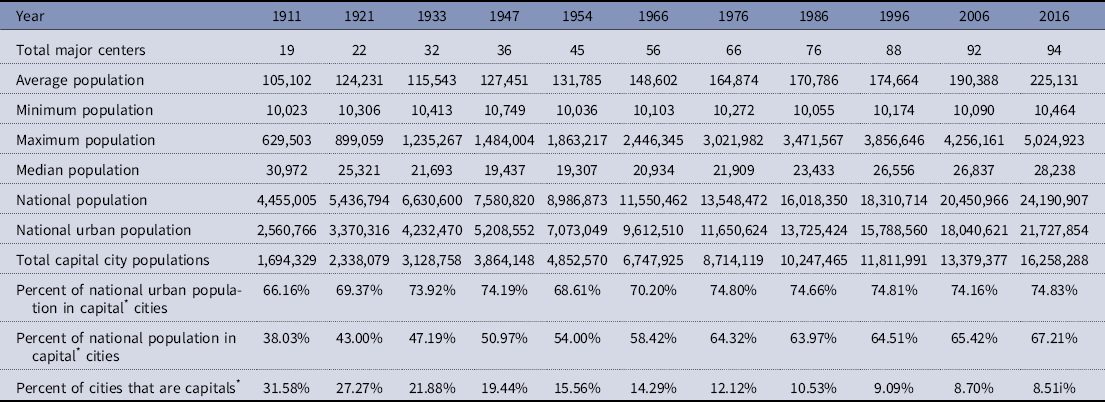
Table 3 presents the results of eleven multivariate linear regressions for each year from 1911 to 2016. It is important to note that the model compared/weighted factors to explain population variation within the sample. Some factors that appear insignificant (navigable waterway) or intermittently significant (seaport, airport) were strongly, positively correlated with population in univariate analyses in all periods for which there was data (results not shown). The multifactor model does not indicate that these factors are unimportant but identifies the strongest relationships. The correlation coefficient is presented for each factor above the standard error and significance code, or p-value. To contextualize this, if x is the coefficient, its impact on city population equals exp(x) – 1. For example, state capital status was the only factor explaining size variation among cities in our sample for all periods and in 2016 its correlation coefficient was 0.977 with a p value less than .001, the strongest measurable statistical relationship. Thus, in 2016, the impact of state capital city status on population equalled exp(0.977) – 1 = 1.65, or the coefficient is associated with a 165% increase in population, a large impact apparent in all periods.
Table 3. Log of major center population regressed on political, natural, and economic factors
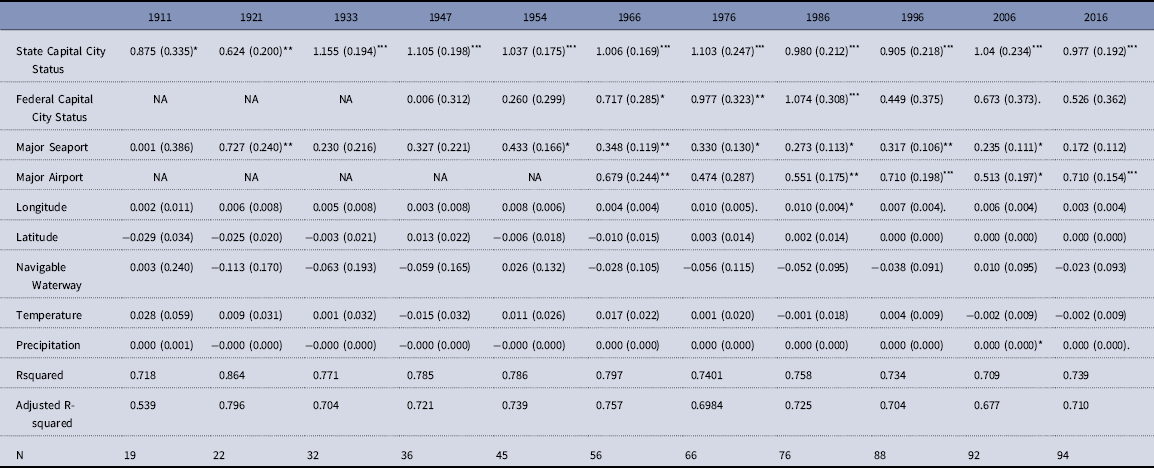
Significance (p-value): 0 “***” .001 “**” .01 “*” .05 “.” .1.
Notes: Each column represents a separate regression. Standard errors are displayed in parentheses. Includes only major centers with populations of 10,000 or above.
From 1966 to 1986, and also in 2006, federal capital status demonstrated a significant positive relationship with population; however, this relationship weakens in later periods. Note, in univariate analyses, federal capital city status continued to correlate with population after 1986. The presence of a seaport had a moderately strong, significant, positive effect on population in most periods, particularly between 1954 and 2006, though the impact declined from a 54% increase to population (0.433. p < .05) in 1954 to 27% in 2006 (0.235, p < .05). Major airports were strongly, positively correlated with city populations for most measured periods, associated with a 103% increase in population (0.710, p < .001) in 2016.
Relative to natural factors, few relationships were identified. Navigable waterway, latitude, and temperature were insignificant in all periods (same for univariate analyses of latitude and temperature). From 1976 to 1996, longitude moderately, positively correlated with population (0.007, <0.1), indicating cities east of the sample’s center tended to be slightly larger, likely reflecting population growth in non-capital major centers on Australia’s Pacific coast, particularly in Queensland. Rainfall showed a weak (0.000, p < .1) relationship with population in 2006, indicating disproportionate population growth in wetter centers.
Discussion
Consistent with studies of primacy internationally, we identified a strong statistical relationship between capital city status and Australian major center populations both in univariate analyses and in a multivariate model that considered seven additional economic and natural factors. Taken together with very high, relatively stable measures of primacy, we suggest Australia’s largest major centers benefit from capital city status, an observable magnet of population. Whilst our results imply capital city status is a core driver of population variation among Australian major centers, we recognize the natural and economic prerequisites of state capital city status in Australia. Each capital was an early, if not initial point of settlement in its colony, chosen for its assessed economic superiority in 18th and 19th century contexts (Statham Reference Statham1990). Acknowledging this, Statham demonstrated how later colonial experience revealed additional and numerous favorable locations and still primacy persisted. We suggest whatever natural advantages the capitals have they are not exclusive to very large cities nor are they enough to explain the extreme and persistent condition of primacy.
It may appear counter intuitive that Australia’s capital cities do not occupy natural “oases” compared to other major centers, given Australia’s largest cities have navigable waterways near the coast. Furthermore, in univariate and multivariate analyses containing only the natural factors we found navigable waterways had a strong, positive relationship with population. However, when all factors were added to the model natural factors became largely insignificant. This indicates that while larger major centers in the sample usually have navigable waterways, political and economic factors were better able to explain what differentiates the largest major centers in the sample. Our results do not refute the importance of natural factors but suggest that there are other, smaller major centers in Australia with comparable natural endowments. Also worth noting relative to natural factors is the sample’s inherent survivor’s bias. That is, the regressions speak to variation among major centers with populations over 10,000, a relatively small sample (<100), as compared with Canada which in 2000 had 145 cities with populations over 25,000 (Kim and Law Reference Kim and Law2016). The Australian sample itself, as well as our modification of the “major river” variable, speaks to natural limitations and we suggest the natural environment poses observable, long recognized limitations to urbanization, particularly in the arid interior. However, the presumption that these limitations are universal and/or explain primacy was not supported.
Interestingly, the time-series results reflect trends in economic geography. Three such examples include the significance of precipitation in 2006, the fading importance of seaports, and the rise and fall of federal capital city status in the 1960s to 1980s, arguably a zenith of centralization in fiscal federalism. First, the positive, albeit weak, relationship with rainfall coincides with Australia’s changing economic geography, a late 20th century and ongoing migration into tropical Queensland (and Western Australia) sometimes referred to as a sunbelt migration (O’Connor et al. Reference O’Connor, Stimson and Daly2001). Second, the fading importance of seaports in the regression reflects increasing trade volumes in the seaports, both new and old, of relatively small non-capital cities such as Karratha, Western Australia; Devonport, Tasmania; and Portland, Victoria. By the 21st century, both large and small centres had high volume seaports, resulting in the factor being incapable of explaining or predicting variation in major center populations. Third, despite the federal capital, Canberra, being founded in 1913, the variable does not become statistically significant until the 1960s and only temporarily. The initial rise in significance corresponds with the 1957 National Capital Development Commission, which jump-started Canberra’s development following war-time delays, heralding decades of growth (Sansom Reference Sansom, Slack and Chattopadhyay2009a). Interestingly, the importance of federal capital city status increased and plateaured in the 1970s-1980s, a period commencing with marked federal expansion and concluding with some moderation of federal omnipotence. Whilst the Commonwealth remains the most powerful tier in fiscal terms, relative to the urban hierarchy there was a shift away from federal aggrandizement. That is, relative to other factors Canberra’s status as capital conferred no population advantage from the 1990s. This followed the Sunbelt phenomenon and the Commonwealth abandoning the ‘traditional administrative model of direct control... [now preferring] to work through other providers’ such as states, regional and local government (Head Reference Head2007: 161)
Competing Agendas
The federal capital variable is also noteworthy for its weakness and what it does not correspond with, such as the ascension of federal revenues (e.g., Figure 3). In Kim and Law (Reference Kim and Law2012, Reference Kim and Law2016) the mechanism fostering agglomeration in capital cities was each tier of government’s relative OSRs. For example, capital city effect is larger in Canadian provinces than American states because provinces have higher OSRs, whereas American local governments have access to more revenue sources than Canadian. Different capital city effects are apparent in Australia; the federal capital gains little agglomeration benefit despite its fiscal omnipotence whilst stable/increasing measures of primacy suggest little discernible relationship between state OSRs and primacy. For example, despite periods of significant state OSR decline (e.g., 1940s) or incline (e.g., early 2000s mining booms), primacy largely held steady.
Rather than countering Kim and Law’s mechanism, we suggest the Australian data refine it. That is, the centralization of OSRs is not a mechanism for primacy by default, but a mechanism for one tier to enact an agenda over others, to express the ‘relative weight the central government places on the [capital]’ (Kim and Law Reference Kim and Law2016: 134). Put another way, primacy may coincide with centralized governance, but centralized governments do not always select for primacy. This is apparent in China, where a strong central government implements a federal ideology of evenness, sought through migration controls, resulting in a relatively flat urban hierarchy (Au and Henderson Reference Au and Henderson2006). Demonstrated by its equalization system, Australia’s federal government is similarly concerned about and equipped to implement an evenness agenda. ‘The crucial point of federalism in Australia is the pervasiveness of doctrines of equality and equalization… [which] in practice takes the form of standardization, homogenization, and even uniformity’ (Nethercote Reference Nethercote2016: 115). Rationally then, an agenda of per capita fairness has steered federal transfers to existing population centers since federation.
Thus, Australia’s problem is not one of transfer logic, but one of few subnational revenue streams. Outside of transfers there are few elastic (e.g., local point-of-sale tax) or speculative/innovative sources of capital in Australian public finance. This is particularly acute in the local government sector. Outside of grants, LGA funding options for major infrastructure are restrictive (Australian Productivity Commission 2008). Some recommend increased usage of debt (Comrie Reference Comrie2014; Grimsey Reference Grimsey2013) such as municipal bonds (Dollery et al. Reference Dollery, Kortt and Grant2012; Grant and Woods Reference Grant and Woods2016; Byrnes et al. Reference Byrnes, Dollery, Crase and Simmons2008), debts issued by subnational and substate governments on capital markets. For example, in the United States publicly traded ‘muni-bonds’ finance over two-thirds of public infrastructure and are issued by local, regional, and state governments, constituting a decentralized fiscal arena that enables numerous locations to finance infrastructure simultaneously (Municipal Securities Rulemaking Board 2020). Comparable fiscal powers/tools/arenas do not exist in Australia subnationally. Instead, fiscal powers are centralized into transfers which are subject to an egalitarian prioritization of existing settlements, resulting in the crystallization of the urban system. That is, despite a few instances of hierarchical dynamism (e.g., emergence of Canberra, Gold Coast, Sunshine Coast; Perth’s ascension over Adelaide in the 1980s), ‘it is difficult to escape the conclusion that the federal system has effectively locked-in the existing broad contours of Australia’s spatial structure’ (Stilwell and Troy Reference Stilwell and Troy2000: 928), the outcome being a scarcity of large non-capital cities.
We have argued that despite the federal government’s high OSRs an egalitarian agenda moderates Canberra’s aggrandizement, weakening the importance of the federal capital city coefficient. Conversely, with or without large OSRs, state capitals retained their centrality. The state capital city coefficient was strong in every period suggesting myopic state agendas by comparison. Importantly, states controlled large scale expenditure responsibilities which, due to their ‘entrenched legal powers and constitutional safeguards,’ they wield with absolute control over local governments (Burton et al. Reference Burton, Dollery and Wallis2002: 41), a top-down dynamic with a long history, more extreme than the federal-state imbalance (Wilkinson et al. Reference Wilkinson, McKenzie and Bolleter2022). Local weakness is illustrated by the proclivity of states to intervene, abolish, redraw and reorganize local governments, a heavy-handed power Australian states exercise frequently, resulting in ‘balkanized’ capital city regions, urban areas comprised of many small local governments, and states’ monopolistic metropolitan control (Sansom Reference Sansom, Kincaid and Steytler2009b). Thus, what little power local governments have to push an agenda is usually concentrated in capital city regions.
Can primacy be discussed of Australian states, a topic typically discussed of countries?
We provide two justifications. First, Australian states are geographically large and of comparable size with many countries. Tasmania, the smallest state, is approximately the size of Ireland, while Western Australia is larger than Mexico. Second, primacy describes economic geography within a polity. National scale is not a prerequisite of the phenomenon though countries have historically been the unit of analysis. More recent works have extended analyses to sub-national and regional scales, the results of which have complemented understandings of primacy (Short and Pinet-Peralta Reference Short and Pinet-Peralta2009; Kim and Law Reference Kim and Law2012; Garza Reference Garza2016; Kim and Law Reference Kim and Law2016). Our work is in the same vein, understanding that an interpretation of sub-national territories will be shaped by multiple layers of political factors.
Can Australia be compared with larger countries like United States and Canada?
Whilst Canada’s population (37 m) is marginally higher than Australia’s (25 m), the United States’s much larger population (>300 million) might appear to disqualify the comparison between American and Australian urbanization. However, the institutional perspective emphasizes foundations and origins – the suggestion that the current state (e.g., population) is in part a product of the institutions under review. It is this foundational view that led us to determine the three countries’ comparable origins in newly settled lands, now hosting divergent urban systems, makes the addition of Australia to the debate particularly interesting.
In summary, the results of our study contribute to a better understanding of the drivers of urban primacy in Australia and offer policy implications relative to “Planning for Australia’s Future Population,” the Commonwealth’s purported decentralization plan (Australian Government 2019). Specifically, our analysis suggests effective decentralization in Australia needs to address the political drivers of primacy, such as fiscal centralization and weak localism, and will likely entail reform to some degree; a consideration absent from current plans. Presuming the trends we identified continue, many of these centers, particularly those not adjacent to capital cities, are unlikely to experience the disproportionate population growth they need in order to alleviate congestion in the capitals and/or act as complementary second cities.
Conclusion
Measures of urban primacy in Australian states are profound, both their magnitude and the scale upon which primate cities cast their shadows. Our results identify extreme examples of primacy, particularly in New South Wales, Victoria, Queensland, and Western Australia. Are these examples of the politically derived excessive primacy typical of post-colonial countries in Latin America, Asia, and Africa? Australia’s history of fiscal federalism, our statistical results, and consideration of the population, geographic size, and wealth of these states support an institutional explanation consistent with other large-scale cases. Our population model statistically linked Australian major center populations with political factors, indicating that from 1911 to 2016 state capital city status strongly, positively correlated with population while natural factors were largely insignificant drivers of variation. Australian economic geography appears to be confined by political forces.
How can primacy in Australia be excessive amidst the country’s affluence? Livable primate cities make it difficult to roundly criticize primacy. However, the ABS has projected significant population gtowth in th 21st century (ABS 2013, 2017). Should population growth continue to concentrate in capital cities this will likely erode livability as the primate cities surpass 10 million people and expand into mega-cities (Weller and Bolleter Reference Weller and Bolleter2013). Furthermore, to judge primacy by the quality of life in the primate city overlooks the phenomenon’s territorial scale and underestimates the potential of second cities. Whilst Henderson (Reference Henderson, Aghion and Durlauf2005) found urban hierarchies to be stable, and Anthony (Reference Anthony2014) suggested primacy progressively grows inflexible, neither accounted for rare examples of hierarchical disruption, as has occurred in BrazilFootnote 6 twice, for example. Thus, theoretical recognition of untapped economic potential in the non-capital cities of vast, wealthy cases of excessive primacy (e.g., some Australian states) is necessary. These examples represent by definition the suppression of large non-capital cities, arguably future world cities (as per Taylor Reference Taylor2020). The existence of this potential answers primacy’s “so-what” question – primacy matters partly because of what is concealed in its shadow.


 Open access