
Abstract
Approximately half of global steel production is dedicated for manufacturing sheets. Due to global warming, geopolitical instabilities and rising raw material costs, recycling sheet metal is increasingly important. Conventional recycling has inefficiencies, therefore improving material efficiency and adopting circular economy strategies is necessary to halve CO2 emissions by 2050. This paper presents a review of sheet metal reuse techniques and introduces an innovative remanufacturing framework of curved steel sheet, with a special focus on the automotive sector and car-body panels. To support the framework presented, an experimental procedure on small-scale samples was carried out. The material tested was DC 0.4 steel parts (0.8 mm thick) characterized by different curvature radii. The material was reshaped and flattened under different conditions to understand the effect of the process variables onto the final quality of the remanufactured parts. The experiments showed that even parts with small curvatures can be flattened and reshaped with success. Lastly, to support the general remanufacturing framework presented, some flattening simulations of a large car-body are presented, revealing the importance of implementing a dwelling stage in the process and the advantage of performing such process with heated tools.
Introduction
Unsustainable exploitation of natural resources is the consequence of the economic progress and industrial development over the last 50 years [1]. Implementing eco-design processes into supply chain management can reduce the impact of automotive industry on the environment by reducing the use of the fuel, increasing the use of recycled materials [2]. Recycling of steel sheets has a direct positive impact on both costs and environment [3]. The iron and steel industry releases massive amounts of environmentally harmful substances, becoming the second largest energy user in the global industrial sectors [4]. Allwood [5] remembers that one fifth of the metal produced is cold rolled into thin sheets for subsequent forming. It is therefore crucial for engineers to examine the entire process chain of sheet metals, including recycling, looking for potential resource efficiency improvements.
Modern automotive recyclers use efficient processes to recover valuable materials like steel and aluminium alloys from end-of-life vehicles [6], whose extraction is highly energy demanding [7, 8]. Disassembly, shredding and separation techniques are used for car body parts at the end of their life [6]. The quantity of metal recycled from end-of-life vehicles is a result of the technology available and the extent to which the technology is used in the scrap processing industry [9]. The separated molten metal is then reintroduced in the primary production of metal parts.
Sheet metals represent a wide percentage of the global market [10] and the global steel demand is expected to increase further [11], with a predicted a growth from 1.6 Gton in 2020 to 2.4 Gton in 2100 [12]. As a consequence, the secondary steel production (i.e. from scrap) share is expected to increase as well [13]. For these reasons, the need for rapid implementation of joint supply- and demand-side mitigation measures around the world in consideration of regional conditions is becoming fundamental [14].
Steel can be produced through different routes and with different percentage of recycled material [15]. Making steel from virgin iron ore is energy-intensive, taking 15–24 GJ/t, (mostly from coal). Instead, producing new steel from scrap steel requires only 1.3–6.0 GJ/t, with the advantage of using renewable energy sources [16]. Harvey found relationships to calculate energy needs for producing hot metal (pig iron) in a blast furnace or direct reduced iron (DRI), and transforming hot metal and DRI into crude steel in a furnace using scrap iron or steel of varying purity [17].
Due to the limitedness of natural resources and geopolitical problems, the demand and the price of steel is increasing as well. Other factors leading to price and demand crisis in the last three years are connected to supply risk and dependency, import/export limitations, impossibility to substitute materials, technologies and suppliers [18].
The conventional metal recycling stages have demonstrated to be less energy-demanding than raw material extraction and production: roughly 40% of the world's steel is presently made from scrap sources [16, 19]. According to Raugei [20], the recycling gain in terms of kg CO2EQ emissions and cumulative energy demand avoided is for both indicators around 90% of the impacts associated to the raw material (excluding manufacturing). Broadbent [21] showed that for every kg of steel scrap that is recycled at the end of the products life, a saving of 1.5 kg CO2EQ emissions, 13.4 MJ primary energy and 1.4 kg iron ore can be achieved. This equates approximately to 74% and 90% reduction respectively, when compared to 100% primary production.
Despite the benefits of conventional recycling, the energy consumed for such process is still relevant: the resource consumption for remelting and subsequent milling is estimated to be on average 9.54 MWh/t for steel parts [22]. Furthermore, during remelting, a part of the liquid metal is lost due to oxidation and process inefficiencies. According to Cullen [11], overall, one-quarter of all liquid steel produced never makes it into end-use goods, but is discarded as scrap during casting, forming and fabrication. Developing a sustainable scrap management strategy and identifying compositional tighter recycling loops is therefore crucial [23].
To meet the 2050 climate change targets, a 75% reduction in CO2 emissions for every ton of steel produced is required [11]. According to Allwood [24] and Milford [25] this is unlikely and the belief that new technologies will eliminate the harms of climate change is only a dream that cannot be realized [26]. The authors highlighted that the reduction of emissions and energy achieved by using efficient manufacturing technologies is not enough: new “material & resource efficiency” techniques must be adopted to really face the problem. Improving material efficiency is defined as reducing the volume of new material production needed to deliver a specific material service [27].
In response to the issue above raised, the scientific community has been increasingly exploring and studying more energy efficient and “green” solutions for expanding the circular economy strategies of metals. The strategies studied the most are aimed at improving material efficiency and reduction of material use. For instance, Worrel et al. estimate that reductions of 50% of the material use could be achieved in the construction and packaging industry [27]. Eliminating process scrap at the downstream of the melting phase would reduce the liquid steel production by 26% [24].
According to several authors, the most effective way to improve material and resource efficiency is through reuse; Cooper stated that approximately 30% of steel and aluminium used in current products could be reused creating significant savings in carbon emissions [3, 11, 28]. The reuse techniques have been classified according to Table 1, while the main enablers and barriers for Reuse are reported in Table 2.
Focusing on the reuse of sheet metals, the general opinion of the scientific community is that there is margin to replace the conventional remelting and subsequent refinement of metal panels with more innovative, efficient and sustainable melt-less recycling techniques [28, 32]. These practices can be divided mainly in two approaches: solid state recycling and direct remanufacturing for reuse of metal panels.
Solid state recycling involves the formation of a billet starting from shredded particles and/or milled powders. Several routes are possible (Spark Plasma Sintering (SPS) with compaction, hot compression [38], hot rolling [39] and cold/hot extrusion of chips), which provide significant energy savings and substantial elimination of the metal loss typical of the conventional remelting process [6]. Paraskevas et al. [40] examined a powder metallurgy route as a solid state recycling technique for the fabrication of a two-phase material via Spark Plasma Sintering. This technology seems very promising to obtain net-shape components made of intermetallic alloys with a fine microstructure. Duflou et al. [41] performed an environmental assessment of solid state recycling techniques to manufacture high density aluminium alloy parts, focusing on spark plasma sintering (SPS), hot extrusion and screw extrusion. They estimated energy savings with a factor 2 for SPS and 3–4 for extrusion.
Another interesting route to recycle sheet metals is through friction consolidation. Baffari et al. [42] analysed the feasibility of a rotating die plunged into a hollow chamber containing the material to be processed, i.e. small metal chips obtained by shredding sheet metal. The work of frictional forces decays into heat, thus softening and bonding the material. Bendikiene et al. [43] found another way of recycling metal waste scraps in form of chips: they used the Submerged Arc Welding method (SAW) with metal waste (turnings, shavings, debris, and chips) to produce wear resistant hard-facings. Despite the technical feasibility, the solid-state routes mentioned seems suited to the recycling of small volumes.
Reshaping strategies are meant to directly use a metal panel avoiding shredding and compaction and providing new shape or directly performing new stamping operations on it. Ali et al. [44] proposed an innovative recovering strategy for sheet metal scrap from the automobile industry. The idea is to directly use the sizable sheet metal scrap generated from the car-body manufacturing process in the automobile industry to design and fabricate new metal facade systems for buildings exteriors. The authors estimated a cost reduction of approximately 40% (400 $/ton) and savings of approximately 67% (10 MJ/kg) of energy consumption. This could create a symbiosis between the auto industry and the construction industry, generating a secondary closed supply-chain loop to achieve both circular economy and energy savings. The authors used flat panels coming as post-industrial blank scrap, thus limiting the problem of remanufacturing and reshaping an already-stamped part.
Sheet Hydro-Forming technology (SHF) has been recently employed for reshaping end-of-life (EoL) components [45]. The technology showed promising results but at the same time more demonstrated to be more technically challenging than conventional forming.
Several studies addressed the suitability of Single Point Incremental Forming (SPIF) to reshape EoL parts. In general, it was found that the environmental impact of reshaping via SPIF brings benefits in terms of Cumulative Energy Demand and CO2-eq. emissions [7-46]. Other studies proved that SPIF is more sustainable than conventional recycling and Solid-State Recycling (SSR). Takano et al. exploited incremental forming [47] to achieve non-uniform and flattened sheet metals from metal cases wastes by dismantling and unbending alongside the edges. In a recent research, Nicholas et al. described a workflow that connects 3D scanning, design automation and fabrication methodologies for repurposing EoL metal via robotic incremental sheet metal forming [48].
Despite the promising environmental benefits of SPIF, the technology seems suited for small production runs, part development or prototyping due to the need of programming the toolpath depending on the specific case study considered [49].
An efficient example of secondary raw materials remanufacturing is the work of R. Haase [22], who presented a qualitative scheme of how the level of maintained value of product changes according to recycling, remanufacturing, reworking and reuse. Then a pre-used material (car roof) was used to obtain by stamping operations a brake disk cover part. Haase highlighted that secondary raw materials, being cold formed, experienced strain hardening which in turn induces a lower residual formability and higher stamping forces for the second forming cycle. Regarding this issue, Falsafi et al. [50] introduced a reformability index for addressing the problem of cold recyclability of sheet-metal products to assess a deterioration effect of the flattening process. The authors considered as predominant mechanisms of flattening an unbending process. The index represents possible levels of strains for deformation along different paths.
Z. Abdullah performed a sustainability assessment of a novel routine to remanufacture end-of-life passenger car waste sheet steel into mesh sheet [51]. The author computed five sustainability indexes considering management, economic, technical, environmental, and social aspects. Abdullah demonstrated that remanufacturing is a viable route that could bring substantial environmental benefits. The author demonstrated also that complex car designs require more challenging remanufacturing. The best component for remanufacturing is the roof, followed by the hood [52]. The typical materials used for body parts are shown in Fig. 1. Further technical details and economic analysis of such remanufacturing process were published in [53].

Example of first use component (car roof) [54]
Given the potential benefits for the environment and the possibility to initiate a circular economy business, more and more solutions for material reuse will soon be required. In the automotive sector, innovative cold-reforming and joining technologies, coupled with systems to retrieve material information, can allow a second life before melting through remanufacturing of car-bodies, providing added-value to customers as well as new market opportunities for equipment manufacturers [55]. Modern tools of inspection techniques can be used as supporting tool for classifying components suited for remanufacturing [56].
In this paper, the feasibility and the potential problems involved in the remanufacturing by flattening of thin automotive body steels will be investigated. This study represents a first step to assess, from a practical/technological point of view, the feasibility of the remanufacturing and flattening process.
In Sect. 2, a remanufacturing process chain based on flattening of automotive sheet metals is briefly proposed.
In Sects. 3 and 4, the results of experimental tests are presented and discussed. The tests are aimed at quantifying the feasibility and the environmental impact of the proposed process for a thin automotive steel. Section 4 will answer several research questions, such as which curvature radii can be flattened for a given sheet initial geometry, what are the differences between warm and cold flattening, which is the thickness distribution and elastic spring-back of a flattened part, how useful is the role of a dwelling phase while flattening.
In Sect. 5, the general feasibility of the proposed process and its scalability to a real size car panel is verified by means of Finite Element (FE) simulations. Section 5 will demonstrate what level of force is required according to a given realistic geometry to be flattened.
A process chain for reshaping outer car-bodies by flattening
Automotive production is a typical resource- and energy-intensive industrial sector, and is a prime market for remanufacturing and direct reuse [57]. In this Section a novel remanufacturing cycle for car body panels is proposed. The concept is to exploit EoL-car bodies (preferably large panels) to produce metal sheets reusable for a new life.
Process chain for flattening and reshaping car bodies
A description of the flow of activities for flattening car-bodies for a new use is reported in the following list.
-
STEP 1. Arrival of the input material: EoL car-body part.
-
STEP 2. Rapid geometry detection and material assessment through portable 3D scanners and ED-XRF portable guns respectively. The geometry and material detection could be used to perform rough FE simulations for the part to be flattened.
-
STEP 3. Remanufacturing cycle planning, i.e. determination of final flattened shape and process parameters. The largest car panels, having often a given curvature, should be first trimmed and then flattened to standard shapes, either flat or embossed or punched.
-
STEP 4. Blanking by Abrasive WaterJet (AWJ) or other 3D trimming methods.
-
STEP 5. Press forming, i.e. flattening. This process could be performed with a hydraulic press varying the temperatures of the tools, the dwell time and dwell force.
-
STEP 6. De-coating and/or descaling (if required), surface treatment (if required).
-
STEP 7. Final trimming (if required).
-
STEP 8. Characterization of flattened part. The flattened material will have non-uniform thickness and non-uniform strength. The strength and strain map must be characterized by experimental measurement or predicted by FE simulations.
The flattening process through pressing seems to be more flexible and better suited to industrialization than the other reshaping technologies. For instance, SPIF requires long time for shaping the parts and the tool path is function of the shape of the first use component. In this case, using a hydraulic press, the tools are simply hard steel plates able to flatten car bodies of different models in a “short” time. The tooling costs are expected to be reduced due to the simple geometry. Flattened parts, once characterised, can be then used as regenerated blanks for subsequent forming or shearing applications. The proposed cycle clearly produces blanks which are not uniform and perfect, which might have some defects, but final imperfections are not necessarily a problem for some final intended uses and applications [58]. Some possible problems and technological limitations of the proposed remanufacturing strategy are considered and reported in Table 3.
Adapting the suggestions provided by Dunant to this specific case study, the proposed remanufacturing process becomes profitable under some conditions [60]. The reshaping strategy should provide high-quality remanufactured parts and there must be a sufficient demand able to recover the expenses and to provide competitive prices for sheet metal panels. For improving process efficiency of the direct remanufacturing process, the following requirements should be verified: high recycling rates (i.e. flattening large panels without complex features), automated production line (warehouse, panel selection, flattening and final reshaping), small setup times, limited investment costs, flexibility in flattening and reshaping different first use components of different car models.
Experimental campaign
To understand the operative combinations of tool temperature, dwell force, dwell time to be applied for different curvature radii typical of car-body panels, some experimental trials were performed at small scale on small thin steel samples. This was needed to test the feasibility and influence of process parameters on the results of the flattening process. The experimental methodology is briefly described as follows:
-
STEP 1. Sample blanks (Fig. 2) are cut through Abrasive Waterjet cutting. The sample geometry has been designed similar to the one used in Nakazima tests [61]. It is a round specimen of diameter D = 55 mm where two circular regions of radius R = 20 mm have been removed. The test material is a 0.8 mm DC0.4 steel sheets (EN 10130/10139), a typical autobody material.
-
STEP 2. Forming stage of the samples (Fig. 3) by deep-drawing through a modified Erichsen [62] cupping test. Varying the punch stroke during the Erichsen cupping test, different geometrical features and curvatures are obtained. In this paper, the punch stroke applied to the specimens is indicated as EI.
Fig. 2 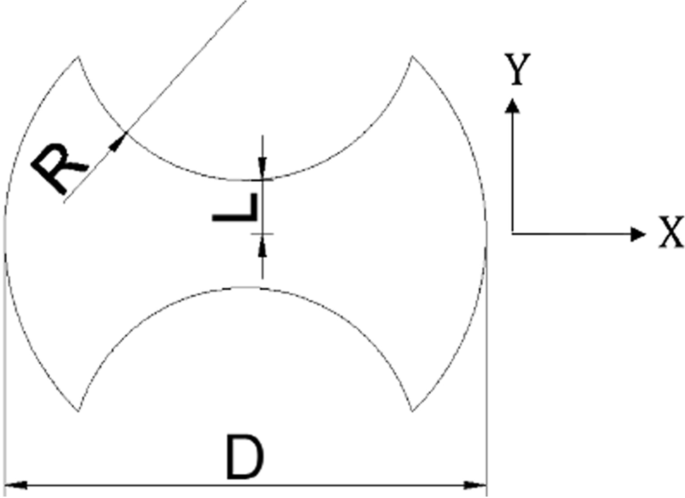
Geometrical parameters defining the shape of the Nakazima-like sample. The dimensions are D = 55 mm, R = 20 mm, L = 6 mm
Fig. 3 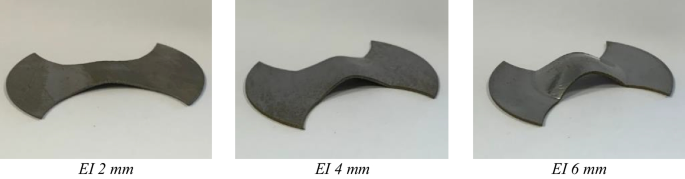
Different EI values for the Nakazima-like samples (geometry obtained after deep-drawing with the Erichsen machine)
-
STEP 3. Flattening was performed through a hydraulic press (a single action 150 tons press). The press is equipped with heated tools, which can reach up to 300 °C. A scheme of the press is reported in Fig. 4. STEP 3 was repeated twice: first, a screening experimental campaign was carried out to roughly define the suitable processing condition window, a refined Design of Experiments (DoE) was run, presented in Paragraph 3.2. In the experimental campaign, different conditions have been tested: in cold and warm flattening, changing the dwell force, the geometry tested and the dwell time.
The flattening cycle is implemented as the sequence of 4 steps, approaching, flattening, dwelling and releasing:
-
Approaching. The punch in Fig. 4 moves fast (> 10 mm/s) approaching the sample; when the punch is close to the sample to be flattened (but still not in touch), the vertical velocity of the piston is reduced to 1 mm/s.
-
Flattening. The displacement continues (at 1 mm/s) until the press tonnage exceeds the predefined set level. This force is reached when the sample is almost completely flattened.
-
Dwelling. When the tonnage has reached the set value, the piston is held in position for a given dwell time.
-
Releasing. After the dwell time, the tonnage is released, and the piston moves up. Figure 5 and Fig. 6 represent the typical shape of the flattening cycle in terms of punch displacement vs. time and punch force vs. time respectively.
Fig. 4 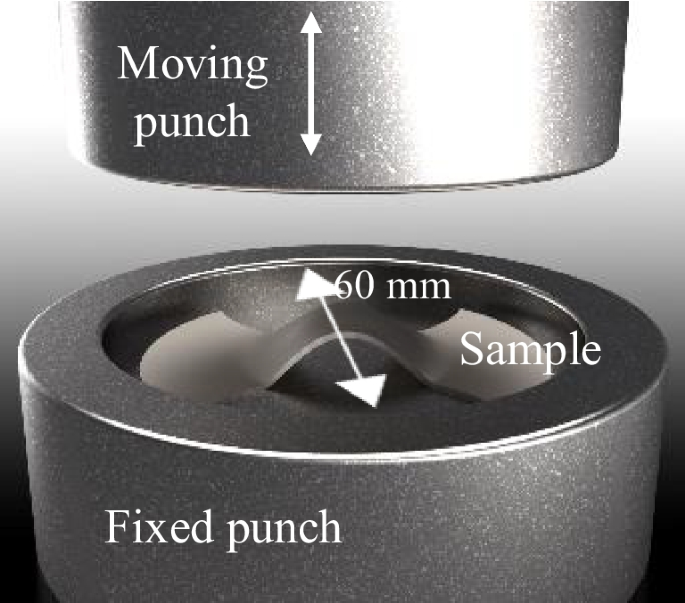
Qualitative description of the hydraulic press with heated tools. The largest sample that can be flattened must be inscribed in a 60 mm diameter circle
Fig. 5 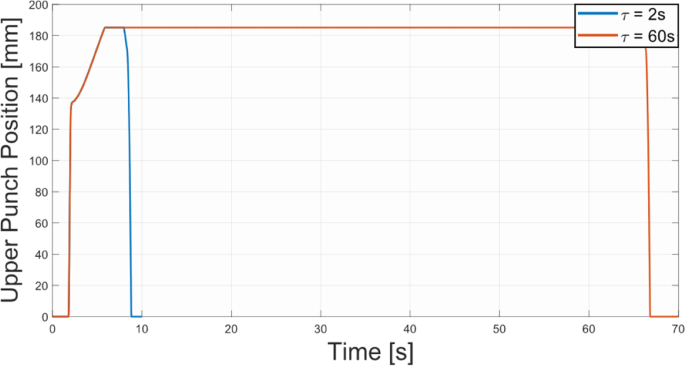
Punch position vs time for 2 s and 60 s of dwell time
Fig. 6 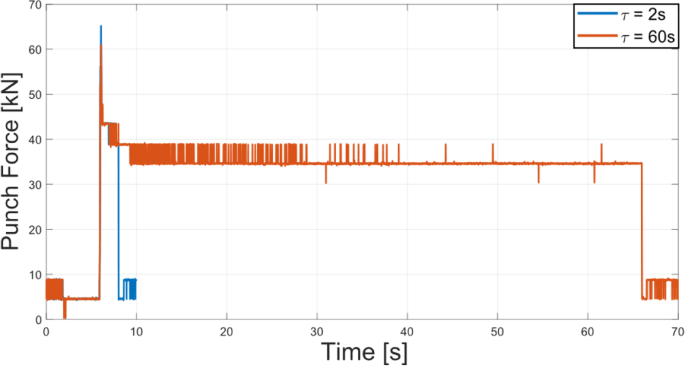
Punch force vs time for 2 s and 60 s of dwell time
-
-
STEP 4. Residual formability tests for the flattened specimen deriving from the DoE, thickness distribution measurements, defect characterization, additional FE simulations to characterise the stress and strain history in the material and final results analysis.


These samples, once deep-drawn with the Erichsen testing machine, emulate small features of car body panels. In fact, these parts are characterized by one preferential plane in which the radius of curvature RMIN ranges few millimeters to 30 mm. Instead, the curvature radius measured onto a plane orthogonal to the first one is at least one or two orders of magnitude bigger than RMIN, as visible in Fig. 3. The curvature radii of the formed sample along the X direction (Fig. 2) are close to the curvature radius of the punch of the Erichsen machine (\(\sim\) 10 mm at the top) and are almost independent on the EI applied. The curvature radii between the flange (planar portion) and the “cup” resembles typical curvature radii of bent car-bodies. By changing the EI from 2 to 6 mm, this curvature radius at the base of the specimen can be varied from about 32 mm to about 8 mm respectively. The geometry has been designed to avoid the formation of wrinkles during flattening and the tested EI values were selected not to induce any kind of failure.
Screening experimental campaign
A screening experimental campaign was carried out with the aim of understanding the process parameters mostly influencing the flattening. The results of the analysis have been used to properly define a DoE, as described in Paragraph 3.2. The samples have been deep-drawn with the Erichsen machine using EI from 2 to 5 mm, both with the tool at room temperature and at 240 °C, using different dwell times (2 s or 60 s) and different dwell forces. The blanks were not pre-heated, i.e. they were initially at room temperature, while they obviously received heat from the upper and lower tool and they heat-up during the flattening process.
In most of the conditions tested, the deformed specimens were flattened to a visually acceptable level, with almost no spring-back. Furthermore, due to the geometry chosen, no wrinkles nor buckling have been observed. All the tested geometries behaved quite similarly, and the results obtained were adequate even in cold forming and with a short dwell time. The results (summarised in Table 4) show that increasing the dwell force Dwf to very high tonnage the non-planarity is minimized even if the process is carried out at room temperature onto highly deformed specimens (specimen 6, Table 4). The parameter “flattening quality” (sixth column in Table 4) has been defined in a qualitative way by visual inspection, positioning the specimen in a predefined way. Such parameter is a binary variable: it assumes the value 1 for clearly non-planar and non-acceptable specimen (as in Fig. 10-e) and 0 for sample flattened to an acceptable quality.
Design of experiments
A full-factorial DoE was conducted on samples prepared as described in Paragraph 3.1. The samples were subjected to a constant dwell force (Dwf) equal to 3.68 tons, which corresponds to an average pressure of 30 MPa. Dwf was kept constant because during the screening experimental campaign it was observed that values lower than 3.68 tons occasionally gave control errors of the press and values significantly higher than 3.68 tons did not allow to discriminate well the role of the other three factors: dwell time τ, EI and tool temperature T (Table 4). The factors were varied at two levels, with a randomized sequence of tests.
The DoE results, including replicates, are presented in Table 5. The main response variables of interest are the planarity (flattening) of the flattened parts, evaluated with a binary variable (similarly to Table 4) and the visual quality of the flattened parts (punch marks, oxidation). Besides, thickness values of the flattened parts at specified locations was measured and the strength and formability after flattening was evaluated by tensile testing.
Tensile test of reshaped and as-received samples
To understand the impact of the reshaping cycle onto the residual formability, tensile tests onto the Nakazima-like samples (both as-received and flattened) were performed. During drawing and flattening the material undergoes a strain history, which alters the mechanical behaviour of the samples. Figure 7 describes the experimental setup used for testing the parts.

a) Tensile test machine and mounting of the specimen. The displacement speed imposed during the test is \(\dot{\Delta l}=5 mm/min\). b) Onset of plastic failure for the Nakazima-like sample
Press power measurements
Alongside with the DoE, the electric power consumed during the flattening operation was measured by means of suited “Hall-effect” current sensors. An example of the data acquired is reported in Fig. 8.

Power consumption for one flattening process (τ = 2 s, EI = 4 mm, tool temperature = 25 °C, Dwf = 3.68 ton). Between 0 s and 3.55 s the piston fast approaches the part (> 10 mm/s). From 3.55 s to 7.8 s the piston moves with a constant speed of 1 mm/s. At 4.4 s the punch touches the sample and starts flattening it. The dwelling stage lasts from 7.9 s to 9.9 s, then the punch moves upwards
FE simulations of the complete process chain
The entire forming cycle (deep drawing, flattening and residual formability test) has been simulated for sample P18 in Table 5. This condition of the DoE is interesting because characterized by the highest values of EI, τ and tool temperature. The FE simulations, implemented in FORGE NxT, were meant to have a better understanding of the stresses and strains experienced by the material during the complete process chain. The material for the sheet is isotropic DC04 and the mechanical properties implemented by the simulation software follow the σ-ε curve reported in Fig. 9. The curve is automatically generated once that the mechanical properties of the sheet are imported (Young’s modulus E = 200 GPa, Yielding stress \({\sigma }_{Y}\) = 250 MPa, Ultimate Tensile Strength UTS = 340 MPa and elongation at maximum force equal to 36.5%).

σ-ε for DC04 implemented in FORGE NxT
The sample is meshed with an initial mesh of tetrahedral elements with size of 0.4 mm (corresponding to 2 elements through the thickness) for the drawing stage and initial mesh size of 0.2 mm (corresponding to 4 elements through the thickness) for the flattening operation. Remeshing on deformation of the part is activated. In the flattening simulation, the tools were finely meshed to better model heat conduction. Self-contact option was activated to prevent the elements self-penetrating in case of folds. The actuator speed was set at 1 mm/s. Friction between the sheet, the punch and the die (Fig. 19) was assumed as “high” with Coulomb limited Tresca model with µ = 0.2 and \(\overline{\mu }\)=0.4 for the forming stage. The same conditions are applied between the sheet and dies during flattening. Regarding the cupping test, the nodes of the sheet at the interface with blank holder (Fig. 19) have a sticking contact condition in order to simulate a realistic and well-clamped drawing process. Thermal exchange between the tools and the sheet was assumed with a heat transfer coefficient of 20,000 W/m2K. Latham and Cockcroft normalized parameter was activated to detect shearing with a trigger value of 0.5, above which element deletion occurs. With these parameters, the drawing simulations lasted 10 and 6 min (EI 6 mm and EI 2 mm respectively, T = 25 °C), the flattening simulations lasted 1 h 20 min and 41 min (EI 6 mm and EI 2 mm respectively, T = 300 °C) and the simulation of the tensile tests of flattened sample lasted 3 h 37 min and 45 min (EI 6 mm and EI 2 mm respectively, T = 25 °C). The results of the simulations are reported in Paragraph 4.5.
Discussion of results
Qualitative visual inspection of flattening and punch marks
The results of the qualitative visual inspections were reported in Table 5. During this inspection, different defects have been visually characterized and detected. The main imperfections observed post flattening are highlighted in Fig. 10. In general, it was observed that:
-
Performing warm flattening, especially for higher values of τ, often alters the surface colour of the parts due to superficial oxidation (Fig. 10-a). The phenomenon is not present in cold flattening (Fig. 10-b), independently on the dwell time.
-
Surface defects such as localized thinning and punch marks can be present (Fig. 10-c, d). The amount of the defect is related to the severity of the plastic deformation during the first forming stage, lubrication conditions and blank holding force.
-
Uniform flattening, elastic-springback and thermal distortion are the result of the sequence of two plastic deformation processes (Fig. 10-e).

Visual defects observed in the samples post flattening
Regarding the flattening parameter, warm forming improves planarity of the flattened parts, i.e. helps flattening. However, the interactions of the dwelling time are statistically significant (according to the ANOVA test performed on the data) and particularly interesting: when flattening at T = 300 °C for a short dwelling time, the best quality can be obtained among the tested values. On the contrary, when a longer dwelling time is applied, the final shape of the samples may be distorted by thermal stresses.
Figure 11 shows the interval plots for punch marks, revealing that punch marks are present only for EI = 6 mm; therefore, they are entirely dependent on the drawing phase and in fact, EI is the only statistically significant factor, while the effect of T and τ is totally negligible. Although not statistically significant, warm flattening instead of cold flattening seems improving the scratch marks.

Interval plots for qualitative evaluation of aesthetical marks
Results of power consumption measurements
Measuring the power consumption of the hydraulic press provides crucial insights into the distribution of energy dissipation within the system. By quantifying the power input, one can gain a deeper understanding of the various factors that contribute to energy loss. The main contributions to power consumption measurements are:
-
heating the tools and maintain them at the set temperature,
-
electric consumption of the oil pump.
The results summarized in Table 6 show the relative importance of different energetic contributions such as performing the process in cold or warm conditions. Performing dwelling at different tonnages does not significantly influences power consumption.
Tensile tests for residual formability
Post-flattening strength and residual formability of the flattened components were evaluated by means of tensile tests (Fig. 7). The mechanical behaviour of three “as-recevied” Nakazima-like samples was compared with the one of the flattened parts. In Fig. 12 the average force–displacement diagrams of the tensile tests are shown for some relevant conditions. The graph shows that the flattened parts are characterized by higher strength (measured through the maximum force fmax, kN) and lower residual formability (measured through the displacement at the maximum force e(fmax), mm). From the force–displacement diagram it is possible to extract the stiffness K (kN/mm), defined as the ratio between the axial force applied and the corresponding extension measured in the linear portion of the curve. The elastic stiffness K also increases for flattened parts. This can be attributed to a combination of factors. The increase of the apparent yield point of the EI 6 mm sample can be explained with kinematic hardening due to a different strain history in the first forming stage, which is in line with other studies [22]. The slope change of the curve in the first part of the diagram is instead due to a geometrical effect: the flattened samples have a different geometry of their central portion, induced by the higher penetration during drawing, and this influences stiffness. The flattened samples characterized by EI 2 mm present a geometry almost equal to the as-received samples and the tensile response is almost identical. Instead, flattened samples with EI 6 mm, have a longer central portion (elongated while forming), hence the strain is less concentrated at the center during the tensile tests and the part stiffness is therefore larger in the elastic region.

Experimental force-extension curves of tensile tests, mean of three replicates for temperature (T) and dwell time (\(\tau\)) equal to 25 °C and 2 s respectively. The figure highlights the effect of EI onto the mechanical behaviour of the samples. On the right, a comparison between numerical and experimental results of the maximum values of force during the test
Figure 13 shows the relationship between the stiffness K and the severity of the Erichsen test: a very minor increase of stiffness occurs for samples tested at EI = 2 mm, while the stiffness increases of about 30% when the sample is drawn to EI = 6 mm and then flattened.

Interval plot for the stiffness K (kN/mm) as a function of the EI. EI = 0 mm means the sample has been tensile tested as-received, without any forming operation
Figure 14 shows that the maximum tensile force fmax is dependent on dwell time and more strongly on the forming temperature, but only when EI = 6 mm. To be more precise, the maximum force increases for longer dwelling time during warm-flattening. The explanation of this behaviour would require some microstructural analysis of the material. According to Wang et al. in low-carbon steels subjected to warm forming, dynamic strain aging (DSA) phenomena can lead to an increase of micro-hardness and peak stress [63]. Another explanation would be connected to the work hardening and thermal hardening experienced by the material during the cold plastic deformation and warm forming process respectively.

Interval plots for the maximum tensile force fmax (kN). The fmax of as-received samples is the baseline of the plots, 3.47 kN
Conversely, the residual formability, measured by the displacement e(fmax) in mm at the maximum tensile force decreases because of the Erichsen drawing. It is also negatively influenced by flattening at warm temperature (Fig. 15) and there is a negligible negative influence of the flattening dwelling time. The interactions among factors are not statistically significant.

Interval plots for the displacement e(fmax) in mm at the maximum tensile force fmax. The mean e(fmax) of as-received samples is the dashed line at 2.51 mm
In conclusion, the remanufacturing process by flattening at either room or warm temperature improves stiffness by 20% with respect to as-received samples. Flattening at room temperature improves strength by 1% and decreases formability by 8%, while flattening at warm temperature improves strength by 4% and decreases formability by 25%.
Thickness distribution
For all the 24 samples of the DoE, the thickness of the flattened parts was measured in different locations by means of a micrometer with conical heads (Fig. 16). This instrument has been used to reconstruct the post-flattening thickness profile (Fig. 17). The thickness has been measured in the same locations also onto three as-received samples and 6 samples just before flattening (three of them characterized by EI = 6 mm and three characterized by EI = 2 mm). At the top of the cup (Point C) a punch mark can be observed.

Location for the measured thickness with the micrometer

Experimental and numerical comparison of the thickness profile along different coordinates for the sample (T = 25 °C, EI = 6 mm and τ = 2 s)
Samples with EI = 6 mm are characterized by relevant plastic deformation and material stretching while forming. If the clamping force of the blank-holder is high enough to avoid the slippage of the flanges between the two dies, then the material undergoes high stretching, excessive localized thinning and increase in the final diameter post-flattening. On the other case, there is a material slippage from the flange towards the centre of the specimen while deep-drawing with the punch. This in turn ensures a lower level of stretching and thinning localization.
Figure 17 shows that the simulations predict quite well the final geometry of the sample, albeit small differences related to numerical and measurements errors. It can be observed that the thickness distribution of the sample is not uniform. As confirmed by Table 7, the thickness variation is mainly affected by the first forming stage and not by flattening. This suggests that the forming process plays a more critical role in determining the final thickness distribution of the samples: the force exerted by the blank holder onto the sample during the forming stage has a significant impact on the slippage of the sample and ultimately, the homogeneity of the thickness distribution.
In Table 7 the thinning percentage at the die corner after deep drawing and after flattening is reported. The thickness decreases by about 10% for EI = 6 mm because of the Erichsen drawing, while it does not change for EI = 2 mm. The thickness further decreases by only 0.6% because of the flattening operation, on average. A more detailed and statistical analysis on thinning at the die corner radius demonstrates that this response variable is influenced only by EI (in terms of overall thinning, as already shown in Table 7), while the additional thinning induced by the flattening operation is negligible and constant throughout the whole DoE. In other words, there is no geometrical consequence on thinning of the flattening parameters (dwelling time and temperature).
The thickness data have been analysed through Minitab using the tool “Regression analysis for factorial DoE”, using the final diameter after flattening as a covariate, which gives an indicator of the influence of the draw-in during drawing. The response variables were the average thickness of points F, G, H, I (at the die corner location), and the average thickness of points A & B (at the flange). The analysis showed that while the material mostly thins everywhere, some thickening might occur at the flange (Points A and B in Fig. 16), depending on the draw-in. In Points D, I, F, G and H the maximum thinning is observed.
The results also showed that the factor influencing the most the response variables is the EI. Furthermore, the only statistical factor which influences thickening at the flange is the temperature of the flattening operation (Fig. 18). Flattening at elevated temperature helps making the thickness distribution more uniform, compressing more the outer corners of the samples, where higher pressure values are localised, as also shown by the FE simulations. When reforming at 300 °C, the total thickness variation at the flange is negligible. When reforming at room temperature, the flange thickens by almost 2%.

Interval plot showing the trend between the average thickening at points A and B (the flange) vs. the reforming temperature T and the EI
Summary of experimental results
The factors considered in the DoE were tool temperature, sample geometry (EI), and dwelling time. With a first visual inspection (Paragraph 4.1) defects such as punch marks, non-planarity, thinning lines and oxidation were detected (Fig. 10). Apart from the oxidation marks, the severity of the defects is related to the severity of plastic deformation during the first forming stage. The study found that warm forming can improve the planarity of remanufactured parts (Fig. 10-e). Short dwelling times at 300 °C yield the best flattening quality, while longer dwelling times may result in distorted samples. Punch marks (Fig. 10-d) are only present in samples which were more severely deformed in the first phase (EI = 6 mm); warm flattening may reduce the presence of such defects (Fig. 11).
The thickness of 24 flattened parts was measured in different points (Fig. 16). In general, an uneven thickness distribution of the remanufactured parts (Fig. 17) was observed. The EI is the only factor that influences thinning at the die corner radius and in other locations (Table 7), while additional thinning induced by flattening is negligible and constant throughout all the experiments. A statistical analysis also showed that the material mostly thins everywhere, but thickening might occur at the flange by almost 2%, depending on the draw-in. Flattening with warm tools helps making the final thickness distribution more uniform (Fig. 18).
Tensile tests onto the reshaped parts were performed evaluating the post-flattening strength and residual formability of flattened components (Paragraph 4.3). Flattened parts showed higher strength (Fig. 14) and lower residual formability (Fig. 15), as well as an increase in elastic stiffness (Fig. 13). The severity of the deep drawing had a minor effect on stiffness for samples with EI = 2 mm, but a significant increase for samples drawn to EI = 6 mm and then flattened.
The power consumption measurements (Paragraph 4.2) conducted on the hydraulic press allowed to identify the main contributors to energy consumption (Table 6): the energy required for heating the tools to the desired temperature and maintaining them at the set temperature, as well as the electric consumption of the oil pump.
In conclusion, warm flattening with a short dwelling time seems to offer the best compromise among all competing objectives: it improves the geometrical uniformity of samples, but it generates a slight colour change by superficial oxidation, and it obviously requires more energy. Warm flattening also might help reducing the thickness non-uniformity of remanufactured parts.
FE simulations
In this Paragraph, the results of the FE simulations are reported, considering only half of the part because of symmetry. The results and contour plots can be visualized looking at the sample from the “die side” or the “punch side” (Fig. 19). The most critical surface of the Nakazima-like sample is the external one on the punch side.

Picture describing what “die side” and “punch side” mean
Figure 20 and Fig. 21 describe the evolution of the first and second principal strain components respectively in two different instants of the simulation: at the end of the drawing phase (before elastic spring-back) and at the end of the flattening stage (after elastic spring-back). The simulations of the residual formability test were run as well, confirming the ductile failure mode experienced by the part and its elongation at break: the crack nucleates at the centre of the specimen and propagates perpendicularly to the tensile forces (Fig. 7-b). Figure 20-a and Fig. 21-a indicate that the biggest deformations are localized at the centre of the specimen, in correspondence of the “cup” and in the localized thinning regions (Fig. 10-c). Instead, after flattening (Fig. 20-b and Fig. 21-b), the sample is characterized by plastic strains which explain the lower displacement at the maximum force with respect to the “as received” material (Fig. 12 and Fig. 15).

First principal strain component (punch side) of the P18 part: a) at the end of drawing operation before elastic spring-back; b) at the end of flattening. Elastic spring-back is active

Second principal strain component (punch side) of the P18 part: a) at the end of drawing operation before elastic spring-back; b) at the end of flattening. Elastic spring-back is active
Figure 22-a represents the Von Mises stresses of the external surface of the Nakazima-like sample (punch side). According to the simulations, residual stresses (which are also plastic) are present on the part, resulting in a local variation of the surface hardness on the real part. Finally, Fig. 22-b represents the strain εZZ evaluated in the mid-plane the part. According to the simulations, the thickening on the flange is negligible, as confirmed by Fig. 18, whereas a limited thinning is occurring in most of the surface of the sample with a non-uniform distribution. This agrees with the measurements reported in Fig. 17.

a) Von Mises stresses contour plot (punch side) after flattening of the P18 part. Elastic spring-back is active. Yellow, orange and red regions are plastically deformed (stress higher than Yielding stress = 210 MPa); b) εZZ contour plot evaluated in the mid-plane of the sample. The contour plot is extracted after flattening. The red zones represent thickening zones, while the other colours thinning. Elastic spring-back is active
FE simulation of the flattening of a large automotive component
The lab scale experiments have demonstrated that a pressure of about 30 MPa, applied to the small Nakazima-like samples is enough to generate a complete flattening in nearly all warm and cold forming conditions. However, real body parts have much larger dimensions and a pressure 30 MPa might require very high, unrealistic, tonnage values. Besides, in real size parts with complex geometry, there is a risk that wrinkles and thickness variations might prevent a uniform application of pressure during dwelling. For these reasons, to demonstrate the general feasibility of the proposed process, several FE simulations have been performed, flattening realistic car body parts. In Sect. 5.1, the flattening process of a bonnet with mild curvature is simulated, with the goal of estimating the tonnage requirement for a complete flattening. In Sect. 5.2, a more severe, stepped geometry is considered.
FE simulations of the flattening of a car bonnet
The simulation cycle is made of two stages, both performed by Transvalor Forge software with solid tetrahedral elements. The first stage is the stamping operation of a flat sheet. This simulation was needed to obtain the car bonnet with its strain history, which was in turn imported for a second simulative stage: the flattening.
The original thickness of the blank before forming was 1 mm and its material is C15 mild steel, whose hardening law is modelled through the Hansel & Spittel equation.
It is worth mentioning that in this analysis the service loading conditions such as creep, relaxation, fatigue by external or thermal loadings were not considered. According to the GRANTA EduPack Software, creep and relaxations are phenomena not activated at ambient temperature for mild steels. Regarding fatigue, autobody steels are characterized by a fatigue strength (evaluated at 107 cycles, un-notched sample, stress ratio R = -1) higher than 100 MPa. Therefore, it was assumed that in normal conditions of usage such levels of stresses are not reached by car-bodies.
Stamping stage simulation
The results of the car bonnet stamping simulation is reported in Fig. 23.

Stamped car bonnet simulated with FORGE (top view). The part seems damaged, but it is only an effect of rendering of a curved surface through tetrahedra
Flattening stage simulation
After the forming operation, the car panel was flattened with the setup shown in Fig. 24. In the flattening simulations, the car panel has an initial coarse tetrahedral mesh of 24 mm in order to shorten the simulation time needed. The area of the flattened car bonnet is 577114 mm2. The remeshing is performed automatically by the software whenever there is a strong deformation. Elastic spring-back is activated for the simulations. The friction criterion between the panel and the tools is assumed to be “oil lubrication” with Coulomb limited Tresca criterion where coulomb coefficient is 0.1 and Tresca 0.2. Ambient is air and the heat exchange between the tools and the panel is assumed to be “strong” where heat transfer coefficient is set to 20,000 W/m2K.

Car panel side (a-top) and front (b-bottom) views before the flattening operation
To understand the effect of tools temperature, panel temperature, dwell force and dwell time, the process parameters and the boundary conditions implemented for the flattening stage have been varied according to Table 8. When there is no dwell time, it means that the upper die is controlled by stroke, not by force: it is stopped at 1 mm distance from the bottom die and immediately reversed. The upper die completely flattens the panel, then the tool is removed, and the panel is free to springback.
This part does not exhibit very complex geometry features such as steps or sharp bumps. This is one of the reasons why very large forces were not required to achieve a successful flattening. Given the large dimension of the panel, we can consider it successfully flattened is the final springback is lower than a predetermined threshold. All the listed simulation runs registered a springback lower than 0.3 mm, which is a rather small value. To discriminate among different conditions the elastic springback variable (ESB) is used instead of a binary flattening quality variable. Table 8 suggests that the best flattening conditions are obtained when the tools are heated at warm temperature (300 °C), the car panel is initially at room temperature, and the dwell force is applied for some time (10 s in this case). Pre-heating the panel would induce some little further decrease of springback, but it would also require additional energy and cycle time. These results are well in agreement with the observations of Sect. 4, and an average pressure on the sheet much lower than 30 MPa is enough to completely flatten the parts.
FE simulations of the flattening of a stepped part
The interest of the simulations reported in the previous Paragraph was to start understanding the feasible conditions for the flattening process and to evaluate the required amount of press force for large parts. The part studied was a rather basic shape without complex geometrical features. However, this may not be the representative case of other car design, where car parts may have bent, curved, stepped sections.
In this Paragrah, a different car part was studied by FE simulations, with curved and stepped features, as seen in Fig. 25.

a) On the left, top view of the car-body panel considered (Chevrolet Camaro car roof obtained with a FE stamping simulation starting from a flat blank). This geometry will be the input for further flattening simulations. b) Virtual model of the Chevrolet Camaro highlighting the roof and its complexity
Since the objective was to investigate the effect of geometry on the flattening process, the part in Fig. 25 was cut into 350 × 350 mm; one with a stepped geometry and the other with a curved geometry as in Fig. 26.

a) On the left 350 mm x 350 mm stepped geometry. b) On the right 350 mm x 350 mm curved geometry
In all simulations the part was flattened to 1.2 mm even though the original sheet thickness was 1 mm. This was performed to compensate thickness irregularity since the thickness after the forming operation varied between 0.8 mm to 1.5 mm. The parts have an initial tetrahedral mesh of 20 mm. The numerical setup is the same described in the previous Paragraph, with the same material and tribology. Different temperature, dwell force, dwell time conditions were investigated for both stepped and curved geometry as can be seen in Table 9. The surface areas after flattening of the portions of the Chevrolet Camaro roof are 125,564 mm2 for the stepped geometry (Fig. 26-a) and 110,868 mm2 for the curved geometry (Fig. 26-b).
Simulation results
As it can be observed in Table 9, flattening of a part with a steplike geometry caused is very difficult. Even with an unrealistically high press force (6000 tons), the final part is not successfully flattened. While pressing the stepped parts, the top die is not able to reach the target position of 1.2 mm above the bottom die: the flattening is not successful even before springback takes place. This is because the part undergoes folding while flattening.
Conversely, the curved part was flattened without any issue, already with a small tonnage (250 tons). A comparison of the flattened parts can be seen in Fig. 27.

a) On the left, unsatisfying flattening of a stepped geometry (residual stepped features). b) On the right, successful flattening of a curved geometry (absence of residual stepped features)
In conclusion, the simulations demonstrated that gently curved parts can be successfully flattened, while parts with a stepped geometry (i.e. with a small radius of curvature) may require unpractical levels of tonnage. More generally, the success of flattening by either warm or cold forming depends on four factors mainly: dwell force, dwell time, radius of curvature and overall geometry to be flattened.
Conclusions
A novel remanufacturing cycle has been proposed, that involves flattening and reshaping EoL car bodies for producing regenerated flat sheet metal blanks, without remelting nor shredding. The proposed remanufacturing process chain seems more flexible and robust than other reshaping technologies. The flattened parts produced may have some defects, but final imperfections are not necessarily a problem for some final intended uses and applications.
The main objective of this research was to study the feasibility of reshaping DC04 steel through flattening, achieved by initially applying a given curvature via a forming stage, followed by cold / warm forming using a hydraulic press.
The success of flattening, either by warm or cold forming, depends on four main factors: dwell force, dwell time, radius of curvature, and overall geometry.
A screening experimental campaign considered the tool temperature, sample geometry (EI), and dwelling time as factors. Apart from the oxidation marks, the severity of the aesthetical defects observed on the sheets is related to the severity of plastic deformation during the first forming stage, lubrication conditions, and blank holding force. Punch marks are only present in samples more severely deformed in the first phase and warm flattening may reduce the presence of such defects. The surface oxidation phenomenon is more pronounced in warm flattening, especially for higher values of dwelling time. The study found that warm forming can improve the planarity of remanufactured parts. Short dwelling times with tools heated at 300 °C yield the best flattening quality, while longer dwelling times may result in distorted samples.
Flattened parts showed increased strength and reduced formability, as well as an increase in elastic stiffness, with respect to the virgin material. In general, an uneven thickness distribution of the remanufactured samples was observed, but the additional thinning induced by flattening is negligible and constant throughout all the experiments. Flattening with warm tools also helps making the final thickness distribution more uniform.
In conclusion, warm flattening with a short dwelling time seems to offer the best compromise among all competing objectives: it improves the geometrical uniformity of samples, but it generates a slight colour change by superficial oxidation.
The main contributors to energy consumption of the hydraulic press were ranked as follows. Firstly, heating the tools to the desired temperature (highest contributor be-cause of the duration of the stage). Then, excluding tools pre-heating and considering each flattening cycle, the second contributor to energy consumption is the utilization of the pump. The lowest contributor is the energy needed to hold the tools in temperature.
The FE simulations highlighted the presence of residual stresses and uneven thickness distribution of the reshaped parts. The observed variation in mechanical properties was attributed to the combination of the forming by drawing and flattening stages. Both simulations and measurements showed that the thickness distribution is mainly governed by the forming stage, whereas flattening has a negligible impact on it.
Finally, simulations of realistic size car body parts were performed, showing that warm forming with a dwell time of less than a minute is able to flatten out parts with a relatively large radius of curvature. Instead, parts with a stepped geometry required high levels of tonnage, which may be unpractical.
References
Zeng X (2023) Win-Win: anthropogenic circularity for metal criticality and carbon neutrality. Front Environ Sci Eng 17(2):23. https://doi.org/10.1007/s11783-023-1623-2
Staniszewska E, Klimecka-Tatar D, Obrecht M (2020) Eco-design processes in the automotive industry. Prod Eng Arch 26(4):131–137. https://doi.org/10.30657/pea.2020.26.25
Cooper DR, Gutowski TG (2017) The Environmental Impacts of Reuse: A Review. J Ind Ecol 21(1):38–56. https://doi.org/10.1111/jiec.12388
Sun W, Wang Q, Zhou Y, Wu J (2020) Material and energy flows of the iron and steel industry: status quo, challenges and perspectives. Appl Energy 268:114946. https://doi.org/10.1016/j.apenergy.2020.114946
Allwood J, Cullen J, Carruth M (2012) Sustainable materials: with both eyes open. Engineering Department, University of Cambridge, Cambridge
Cui J, Roven HJ (2010) Recycling of automotive aluminum. Trans Nonferrous Met Soc China (English Ed) 20(11):2057–2063. https://doi.org/10.1016/S1003-6326(09)60417-9
Ingarao G, Zaheer O, Fratini L (2021) Manufacturing processes as material and energy efficiency strategies enablers: The case of Single Point Incremental Forming to reshape end-of-life metal components. CIRP J Manuf Sci Technol 32:145–153. https://doi.org/10.1016/j.cirpj.2020.12.003
Duan H, Hou C, Yang W, Song J (2022) Towards lower CO2 emissions in iron and steel production: Life cycle energy demand-LEAP based multi-stage and multi-technique simulation. Sustain Prod Consum 32:270–281. https://doi.org/10.1016/j.spc.2022.04.028
Paul R (2009) End-of-life management of waste automotive materials and efforts to improve sustainability in North America. Soc Automot Eng Int USA 120:853–861. https://doi.org/10.2495/SDP090802
Cullen JM, Allwood JM (2013) Mapping the global flow of aluminum: From liquid aluminum to end-use goods. Environ Sci Technol 47(7):3057–3064. https://doi.org/10.1021/es304256s
Cullen JM, Allwood JM, Bambach MD (2012) Mapping the global flow of steel: From steelmaking to end-use goods. Environ Sci Technol 46(24):13048–13055. https://doi.org/10.1021/es302433p
Lopez G, Farfan J, Breyer C (2022) Trends in the global steel industry: Evolutionary projections and defossilisation pathways through power-to-steel. J Clean Prod 375(September):134182. https://doi.org/10.1016/j.jclepro.2022.134182
Wang P, Li W, Kara S (2017) Cradle-to-cradle modeling of the future steel flow in China. Resour Conserv Recycl 117:45–57. https://doi.org/10.1016/j.resconrec.2015.07.009
Wang P et al (2021) Efficiency stagnation in global steel production urges joint supply- and demand-side mitigation efforts. Nat Commun 12(1):2066. https://doi.org/10.1038/s41467-021-22245-6
Yellishetty M, Mudd GM, Ranjith PG, Tharumarajah A (2011) Environmental life-cycle comparisons of steel production and recycling: Sustainability issues, problems and prospects. Environ Sci Policy 14(6):650–663. https://doi.org/10.1016/j.envsci.2011.04.008
Harvey LDD (2021) Iron and steel recycling: Review, conceptual model, irreducible mining requirements, and energy implications. Renew Sustain Energy Rev 138(September 2019):110553. https://doi.org/10.1016/j.rser.2020.110553
Harvey LDD (2020) Analysis of the Theoretical and Practical Energy Requirements to Produce Iron and Steel, with Summary Equations that Can Be Applied in Developing Future Energy Scenarios. J Sustain Metall 6(2):307–332. https://doi.org/10.1007/s40831-020-00276-5
ALERT Centro Studi, Associazione Assolombarda (2022) Nuove tensioni su logistica e materie prime nel primo trimestre 2022. Lamiera pp 7–8
Ingarao G, Di Lorenzo R, Micari F (2011) Sustainability issues in sheet metal forming processes: An overview. J Clean Prod 19(4):337–347. https://doi.org/10.1016/j.jclepro.2010.10.005
Raugei M, El Fakir O, Wang L, Lin J, Morrey D (2014) Life cycle assessment of the potential environmental benefits of a novel hot forming process in automotive manufacturing. J Clean Prod 83:80–86. https://doi.org/10.1016/j.jclepro.2014.07.037
Broadbent C (2016) Steel’s recyclability: demonstrating the benefits of recycling steel to achieve a circular economy. Int J Life Cycle Assess 21(11):1658–1665. https://doi.org/10.1007/s11367-016-1081-1
Haase R (2020) Remanufacturing of metal components : reforming of sheet metal blanks. Fraunhofer IWU. [Online]. Available: https://www.careserviceproject.eu/wp-content/uploads/CarE-Service-Training-on-Metal-reforming-25th-of-May.pdf
Paraskevas D, Kellens K, Renaldi R, Dewulf W, Duflou J (2013) Closed and open loop recycling of aluminium: a life cycle assessment perspective. In: Proceedings of the 11th Global Conference on Sustainable Manufacturing-Innovative Solutions (pp 305–310). Technische Universität Berlin; Berlin, Germany
Milford RL, Allwood JM, Cullen JM (2011) Assessing the potential of yield improvements, through process scrap reduction, for energy and CO2 abatement in the steel and aluminium sectors. Resour Conserv Recycl 55(12):1185–1195. https://doi.org/10.1016/j.resconrec.2011.05.021
Milford RL, Pauliuk S, Allwood JM, Müller DB (2013) The roles of energy and material efficiency in meeting steel industry CO2 targets. Environ Sci Technol 47(7):3455–3462. https://doi.org/10.1021/es3031424
Allwood JM (2018) Unrealistic techno-optimism is holding back progress on resource efficiency. Nat Mater 17(12):1050–1051. https://doi.org/10.1038/s41563-018-0229-8
Worrell E, Allwood J, Gutowski T (2016) The Role of Material Efficiency in Environmental Stewardship. Annu Rev Environ Resour 41:575–598. https://doi.org/10.1146/annurev-environ-110615-085737
Cooper DR, Allwood JM (2012) Reusing Steel and Aluminum Components at End of Product Life. Environ Sci Technol 46(18):10334–10340. https://doi.org/10.1021/es301093a
Campbell-Johnston K, Vermeulen WJV, Reike D, Brullot S (2019) The Circular Economy and Cascading: Towards a Framework. Resour Conserv Recycl X 7(October):2020. https://doi.org/10.1016/j.rcrx.2020.100038
Allwood J, Ashby M, Gutowski T, Worrell E (2011) Material efficiency: a white paper. Resour Conserv Recycl 55(3):362–381. https://doi.org/10.1016/j.resconrec.2010.11.002
Allwood J, Ashby M, Gutowski T, Worrell E (2011) Material efficiency: a white paper. Resour Conserv Recycl 55(3):362–381. https://doi.org/10.1016/j.resconrec.2010.11.002
Ingarao G, Di Lorenzo R, Fratini L (2017) An Exploratory Study for Analyzing the Energy Savings Obtainable by Reshaping Processes of Sheet Metal Based Components. Procedia Eng 183:309–315. https://doi.org/10.1016/j.proeng.2017.04.044
Hauschild MZ, Kara S, Røpke I (2020) Absolute sustainability: Challenges to life cycle engineering. CIRP Ann 69(2):533–553. https://doi.org/10.1016/j.cirp.2020.05.004
Allwood JM, Cullen JM, Milford RL (2010) Options for achieving a 50% cut in industrial carbon emissions by 2050. Environ Sci Technol 44(6):1888–1894. https://doi.org/10.1021/es902909k
Dunant CF, Drewniok MP, Sansom M, Corbey S, Allwood JM, Cullen JM (2017) Real and perceived barriers to steel reuse across the UK construction value chain. Resour Conserv Recycl 126(August):118–131. https://doi.org/10.1016/j.resconrec.2017.07.036
DensleyTingley D, Cooper S, Cullen J (2017) Understanding and overcoming the barriers to structural steel reuse, a UK perspective. J Clean Prod 148(2017):642–652. https://doi.org/10.1016/j.jclepro.2017.02.006
Pacelli F, Ostuzzi F, Levi M (2015) Reducing and reusing industrial scraps: A proposed method for industrial designers. J Clean Prod 86:78–87. https://doi.org/10.1016/j.jclepro.2014.08.088
Yusuf N, Lajis M, Ahmad A (2017) Hot press as a sustainable direct recycling technique of aluminium: mechanical properties and surface integrity. MDPI. https://doi.org/10.3390/ma10080902
Kore AS, Nayak KC, Date PP (2017) Formability of aluminium sheets manufactured by solid state recycling. 36th IDDRG Conference – Materials Modelling and Testing for Sheet Metal Forming. https://doi.org/10.1088/1742-6596/896/1/012007
Paraskevas D, Vanmeensel K, Vleugels J, Dewulf W, Duflou JR (2015) The use of Spark Plasma Sintering to fabricate a two-phase material from blended aluminium alloy scrap and gas atomized powder. Procedia CIRP 26:455–460. https://doi.org/10.1016/j.procir.2014.07.074
Duflou JR et al (2015) Environmental assessment of solid state recycling routes for aluminium alloys: Can solid state processes significantly reduce the environmental impact of aluminium recycling? CIRP Ann Manuf Technol 64(1):37–40. https://doi.org/10.1016/j.cirp.2015.04.051
Baffari D, Buffa G, Ingarao G, Masnata A, Fratini L (2019) Aluminium sheet metal scrap recycling through friction consolidation. Procedia Manuf 29:560–566. https://doi.org/10.1016/j.promfg.2019.02.134
Bendikiene R, Ciuplys A, Kavaliauskiene L (2019) Circular economy practice: From industrial metal waste to production of high wear resistant coatings. J Clean Prod 229:1225–1232. https://doi.org/10.1016/j.jclepro.2019.05.068
Ali AK, Wang Y, Alvarado JL (2019) Facilitating industrial symbiosis to achieve circular economy using value-added by design: A case study in transforming the automobile industry sheet metal waste-flow into Voronoi facade systems. J Clean Prod 234:1033–1044. https://doi.org/10.1016/j.jclepro.2019.06.202
Piccininni A, Cusanno A, Palumbo G, Zaheer O, Ingarao G, Fratini L (2022) Reshaping End-of-Life components by sheet hydroforming: an experimental and numerical analysis. J Mater Process Technol 306:117650. https://doi.org/10.1016/j.jmatprotec.2022.117650
Ingarao G, Zaheer O, Campanella D, Di Lorenzo R, Fratini L (2020) An energy efficiency analysis of single point incremental forming as an approach for sheet metal based component reuse. Procedia CIRP 90:540–545. https://doi.org/10.1016/j.procir.2020.01.068
Takano H, Kitazawa K, Goto T (2008) Incremental forming of nonuniform sheet metal: Possibility of cold recycling process of sheet metal waste. Int J Mach Tools Manuf 48(3–4):477–482. https://doi.org/10.1016/j.ijmachtools.2007.10.009
Nicholas P, Chiujdea R, Sonne K, Scaffidi A (2021) Design and fabrication methodologies for repurposing end of life metal via robotic incremental sheet metal forming. Conference: eCAADe 2021. https://doi.org/10.52842/conf.ecaade.2021.2.171
Cooper DR, Rossie KE, Gutowski TG (2017) The energy requirements and environmental impacts of sheet metal forming: An analysis of five forming processes. J Mater Process Technol 244:116–135. https://doi.org/10.1016/j.jmatprotec.2017.01.010
Falsafi J, Demirci E, Silberschmidt VV (2016) Computational assessment of residual formability in sheet metal forming processes for sustainable recycling. Int J Mech Sci 119(October):187–196. https://doi.org/10.1016/j.ijmecsci.2016.10.013
Abdullah ZT (2021) Assessment of end-of-life vehicle recycling: Remanufacturing waste sheet steel into mesh sheet. PLoS One 16(12):1–17. https://doi.org/10.1371/journal.pone.0261079
Abdullah ZT (2022) Fuzzy-based sustainability modeling: Case study of remanufacturing waste sheet steel into angle mesh steel. Environ Qual Manag. https://doi.org/10.1002/tqem.21932
Abdullah ZT (2022) Economic Feasibility Assessment of Reclaiming Waste Sheet Steel from End-of-Life Vehicles. IEEE Eng Manag Rev 50(2):110–116. https://doi.org/10.1109/EMR.2022.3143436
Center for Automotive Research (2017) Technology roadmaps: intelligent mobility technology, materials and manufacturing processes, and light duty vehicle propulsion. https://doi.org/10.32964/tj16.6
Copani G, Shafinejad P, Hipke T, Haase R, Paizs T (2022) New metals remanufacturing business models in automotive industry. Procedia CIRP 112:436–441. https://doi.org/10.1016/j.procir.2022.09.033
Saiz F, Alfaro G, Barandiaran I (2021) An inspection and classification system for automotive component remanufacturing industry based on ensemble learning. MDPI. https://doi.org/10.3390/info12120489
Liu B et al (2018) The effect of remanufacturing and direct reuse on resource productivity of China’s automotive production. J Clean Prod 194:309–317. https://doi.org/10.1016/j.jclepro.2018.05.119
Ali AK, Kio PN, Alvarado J, Wang Y (2020) Symbiotic Circularity in Buildings: An Alternative Path for Valorizing Sheet Metal Waste Stream as Metal Building Facades. Waste Biomass Valor 11(12):7127–7145. https://doi.org/10.1007/s12649-020-01060-y
Cooper DR, Rossie KE, Gutowski TG (2017) An environmental and cost analysis of stamping sheet metal parts. J Manuf Sci Eng Trans ASME 139(4):1–14. https://doi.org/10.1115/1.4034670
Dunant CF, Drewniok MP, Sansom M, Corbey S, Cullen JM, Allwood JM (2018) Options to make steel reuse profitable: An analysis of cost and risk distribution across the UK construction value chain. J Clean Prod 183:102–111. https://doi.org/10.1016/j.jclepro.2018.02.141
Kasaei MM, Oliveira MC (2022) Influence of the contact with friction on the deformation behavior of advanced high strength steels in the Nakajima test. J Strain Anal Eng Des 57(3):193–207. https://doi.org/10.1177/03093247211021257
He H, Yang T, Ren Y, Peng Y, Xue S, Zheng L (2022) Experimental Investigation on the Formability of Al-Mg Alloy 5052 Sheet by Tensile and Cupping Test. Materials (Basel) 15(24):8949. https://doi.org/10.3390/ma15248949
Wang Z et al (2020) Warm Deformation and Dynamic Strain Aging of a Nb-Cr Microalloyed Low-Carbon Steel. Metall Mater Trans A Phys Metall Mater Sci 51(9):4623–4631. https://doi.org/10.1007/s11661-020-05855-5
Funding
Open access funding provided by Politecnico di Milano within the CRUI-CARE Agreement.
Author information
Authors and Affiliations
Corresponding author
Ethics declarations
Conflicts of interest
The authors declare that they have no conflict of interest.
Additional information
Publisher's note
Springer Nature remains neutral with regard to jurisdictional claims in published maps and institutional affiliations.
Rights and permissions
Open Access This article is licensed under a Creative Commons Attribution 4.0 International License, which permits use, sharing, adaptation, distribution and reproduction in any medium or format, as long as you give appropriate credit to the original author(s) and the source, provide a link to the Creative Commons licence, and indicate if changes were made. The images or other third party material in this article are included in the article's Creative Commons licence, unless indicated otherwise in a credit line to the material. If material is not included in the article's Creative Commons licence and your intended use is not permitted by statutory regulation or exceeds the permitted use, you will need to obtain permission directly from the copyright holder. To view a copy of this licence, visit http://creativecommons.org/licenses/by/4.0/.
About this article

Cite this article
Farioli, D., Fabrizio, M., Kaya, E. et al. Reshaping of thin steel parts by cold and warm flattening. Int J Mater Form 16, 35 (2023). https://doi.org/10.1007/s12289-023-01759-y
Received:
Accepted:
Published:
DOI: https://doi.org/10.1007/s12289-023-01759-y