


1. Introduction
Sentiment analysis or opinion mining is the task of predicting the sentiment polarity of a text (Pang, Lee, and Vaithyanathan, Reference Pang, Lee and Vaithyanathan2002). Recently, plenty of sentiment analysis research has already been conducted across different domains and at different levels (sentences, paragraphs, and documents) to motivate many natural language processing (NLP) applications and tools (Sadegh, Ibrahim, and Othman, Reference Sadegh, Ibrahim and Othman2012; Vinodhini and Chandrasekaran, Reference Vinodhini and Chandrasekaran2012; Medhat, Hassan, and Korashy, Reference Medhat, Hassan and Korashy2014; Araque et al., Reference Araque, Corcuera-Platas, SáNchez-Rada and Iglesias2017; Shayaa et al., Reference Shayaa, Jaafar, Bahri, Sulaiman, Wai, Chung, Piprani and Al-Garadi2018; Tedmori and Awajan, Reference Tedmori and Awajan2019). Predicting an opinion word is the main challenge of sentiment analysis. Once, it might be considered positive, while it might be negative in another context. A second challenge is that people express their opinions in different ways. However, most NLP applications are based on the fact that a bit of difference between two parts of a text might not significantly impact the meaning (Vinodhini and Chandrasekaran, Reference Vinodhini and Chandrasekaran2012; Hussein, Reference Hussein2018). Generally speaking, there are two main approaches used to build a sentiment analysis system: machine learning (ML) and lexicon-based (Biltawi et al. Reference Biltawi, Etaiwi, Tedmori, Hudaib and Awajan2016; Alrefai, Faris, and Aljarah, Reference Alrefai, Faris and Aljarah2018; Alayba et al. Reference Alayba, Palade, England and Iqbal2018; Mukhtar, Khan, and Chiragh, Reference Mukhtar, Khan and Chiragh2018; Verma and Thakur, Reference Verma and Thakur2018). A hybrid solution, which integrates the two approaches, has also been attempted (Zhang et al., Reference Zhang, Ghosh, Dekhil, Hsu and Liu2011; Alrefai et al., Reference Alrefai, Faris and Aljarah2018).
In the ML approach, the sentiment classification problem mainly depends on the prime ML algorithm. It is primarily based on extracting linguistic items with syntactic features (Taboada et al. Reference Taboada, Brooke, Tofiloski, Voll and Stede2011). In the corpus-based approach, also known as the supervised approach, decision tree (DT), k-nearest neighbor, Naïve Bayes (NB), and support vector machine (SVM) are applied to labeled datasets split manually into training and testing. The training dataset is used for building the model, while the testing dataset is used to evaluate its performance. For instance, the accuracy of a classification model is estimated by measuring the different types of errors made by a classifier (Abdulla et al., Reference Abdulla, Ahmed, Shehab and Al-Ayyoub2013). The lexicon-based approach involves summating the sentiment orientation of each word or phrase in the document (Turney, Reference Turney2002; Taboada et al., Reference Taboada, Brooke, Tofiloski, Voll and Stede2011).
A dataset with imbalanced class distributions is problematic to many real NLP applications (He and Garcia, Reference He and Garcia2008; Kumar and Sheshadri, Reference Kumar and Sheshadri2012; Bekkar and Alitouche, Reference Bekkar and Alitouche2013). When imbalanced datasets are applied to classification tasks, there is a significant degradation in the performance of the most well-known classification algorithms. ML algorithms assume that the class distribution is relatively balanced and all misclassification costs are equal (Sun et al. Reference Sun, Kamel, Wong and Wang2007). However, several approaches and solutions have been proposed to address this problem (He and Garcia, Reference He and Garcia2008; Ganganwar, Reference Ganganwar2012; Ramyachitra and Manikandan, Reference Ramyachitra and Manikandan2014). The attempts included enhanced approaches or models to handle imbalanced datasets (Bekkar and Alitouche, Reference Bekkar and Alitouche2013) or to find the proper evaluation metrics for model assessment (Weiss, Reference Weiss2004).
Arabic is one of the under-resourced languages suffering from lacking quality resources in many computational research areas. Therefore, the main purpose of this study is to complement the existing research on Arabic sentiment analysis in general and to provide a solution to Arabic datasets with imbalanced class distribution in particular. The two main objectives of this study can be summarized as follows:
-
1. Investigate the various information sources to understand the sentiment analysis of Arabic text clearly.
-
2. Propose a solution to the problem of multiclass sentiment classification for handling imbalanced datasets to motivate research in Arabic sentiment analysis to build an effective sentiment prediction system for Arabic documents.
To achieve the goals, this study incorporates five stages. The first three stages include data collection, selecting the essential features from Arabic texts, and data preprocessing, which consists of steps that take as input a plain text document and outputs a set of tokens fed into the classification algorithms. The fourth stage involves conducting experiments to assess the performance of the synthetic minority over-sampling technique (SMOTE) and the Cost-Sensitive classifier and how they might handle the imbalanced problem in multiclass sentiment classification. Also, in this stage, we propose our hybrid approach, which combines the CBUS method and a majority voting ensemble model to aid ML classifiers in building accurate models against highly imbalanced datasets. The merits of the proposed approach are that it does not remove the majority class instances from the data nor injects the dataset with artificial minority class instances. The CBUS method uses two standard clustering algorithms: K-means (KM) and the expectation–maximization (EM), to balance the ratio between the major and the minor classes by decreasing the number of the major class instances and maintaining the number of the minor class instances at the cluster level.
The resulting balanced datasets are used to train two ML classifiers, random forest (RF) and updateable Naïve Bayes (UNB), to develop prediction data models. The best prediction data models are selected based on the accuracy rates. We applied two techniques to test our approach and generate new predictions from the imbalanced test dataset. The first technique uses the best prediction data models. The second technique uses the majority voting ensemble learning model, which combines the best prediction data models to generate the final predictions. Finally, in the fifth stage, we discuss the experiments and their results. The key contributions of this research can be summarized as follows:
-
1. We introduce a multiclass sentiment classification approach for handling imbalanced class distribution of Arabic documents. The approach combines the advantages of a CBUS method with an ensemble learning model for improving the sentiment classification of Arabic documents (SCArD).
-
2. We evaluate the approach with state-of-the-art classification algorithms applied to imbalanced Arabic datasets of documents for automatic sentiment detection.
The rest of the paper is organized as follows. In Section 2, we provide a brief background and the related work on sentiment analysis for Arabic and English languages. Section 3 discusses the proposed model in more detail. In Section 4, we describe the conducted experiments to evaluate the performance of the proposed approach and discuss the results. Finally, we conclude our work and provide suggestions for future work.
2. Preliminaries and background
2.1 Preliminaries
Numerous clustering techniques for sentiment analysis have been proposed in the literature (Oueslati et al., Reference Oueslati, Cambria, HajHmida and Ounelli2020). Mainly, they fit into two categories: unsupervised lexicon-based and supervised ML. Both approaches rely on the bag-of-words model. In the lexicon-based approach, the unigrams from the lexicon are assigned a polarity score. The overall score of the text is computed as the sum of the polarities of the unigrams (Kolchyna et al., Reference Kolchyna, Souza, Treleaven and Aste2015; Bonta and Janardhan, Reference Bonta and Janardhan2019). While in the supervised ML, the classifiers use unigrams or a combination of n-grams as features to train and test the developed models. In addition, there is a hybrid approach, which combines the two approaches (Biltawi et al., Reference Biltawi, Etaiwi, Tedmori, Hudaib and Awajan2016; Alrefai et al., Reference Alrefai, Faris and Aljarah2018; Alayba et al., Reference Alayba, Palade, England and Iqbal2018).
Before we review the related work on sentiment analysis, we briefly describe the main methods and techniques used in this study to design and implement the multi-class sentiment classification model to handle the problem of imbalanced class distribution of Arabic documents.
Feature selection. The vast advancement of technology in recent years yields exponential data growth concerning both dimensionality and volume. Data management and automatic knowledge discovery of big data require the continual development of data mining and ML algorithms. Accordingly, the high dimensionality of data is considered a significant challenge to the ML algorithms (Tang, Alelyani, and Liu, Reference Tang, Alelyani and Liu2014). One of the main challenges is overfitting. It is usually due to a massive number of irrelevant features that affect the learning algorithms’ performance. Feature selection is necessary to address the problem of managing big data by reducing the dimensionality of features. The main feature selection task is to select a minimal subset of the relevant features from the original ones based on selection criteria. This will increase the performance of the learning algorithms, such as higher accuracy for classification, decrease the computational cost, and enhance model understanding (Tang et al., Reference Tang, Alelyani and Liu2014). In general, feature extraction for sentiment analysis tasks can be applied at different levels of a text, such as:
-
Document-level: predicting the sentiment of the whole document.
-
Sub-document level: predicting the sentiment within a document section.
-
Sentence-level: predicting the sentiment of a single sentence.
-
Sub-sentence level: predicting the sentiment within a sentence.
-
Title-level: predicting the sentiment of a title.
Morphological analysis and stemming. Morphological analysis and root extraction are essential for many Arabic NLP applications such as question answering, information retrieval, text summarization, and constructing Arabic corpora (Hammo et al., Reference Hammo, Abuleil, Lytinen and Evens2004; Hammo, Reference Hammo2009; Hammo et al., Reference Hammo, Yagi, Ismail and AbuShariah2016). In the literature, a plethora of work has tackled the problem of Arabic morphological analysis (Al-Sughaiyer and Al-Kharashi, Reference Al-Sughaiyer and Al-Kharashi2004; Boudlal et al., Reference Boudlal, Lakhouaja, Mazroui, Meziane, Bebah and Shoul2010; Pasha et al., Reference Pasha, Al-Badrashiny, Diab, El Kholy, Eskander, Habash, Pooleery, Rambow and Roth2014). In the morphological analysis and NLP applications, stemming is the process of reducing inflected and derived words to their word stem. Generally speaking, there are two approaches for Arabic stemming; a root-based approach described in (Khoja and Garside, Reference Khoja and Garside1999) and a shallow stemming approach described in (Larkey, Ballesteros, and Connell, Reference Larkey, Ballesteros and Connell2002).
Classification models. The RF (Breiman, Reference Breiman2001) and NB (Ridgeway et al., Reference Ridgeway, Madigan, Richardson and O’Kane1998) algorithms are widely used for text classification and sentiment analysis (Singh, Singh, and Singh, Reference Singh, Singh and Singh2017; Amrit et al., Reference Amrit, Paauw, Aly and Lavric2017; Hartmann et al., Reference Hartmann, Huppertz, Schamp and Heitmann2019; Kadhim, Reference Kadhim2019; Khanday et al., Reference Khanday, Rabani, Khan, Rouf and Mohi Ud Din2020; Charbuty and Abdulazeez, Reference Charbuty and Abdulazeez2021). Usually, they achieve high performance regarding the accuracy and F1-score rates. The Naïve Bayes updateable method is applied to improve the classification accuracy further. It is an updateable version of NB, also known as Flexible Bayes or Flex Bayes algorithm, and works in the same manner as the NB classifier (Mir et al., Reference Mir, Khan, Butt and Zaman2016).
Handling imbalanced datasets. In this study, we applied two techniques to deal with imbalanced datasets; the Oversampling via SMOTE and the cost-sensitive classification technique.
-
Oversampling via SMOTE . SMOTE is an over-sampling approach where the minority class is over-sampled by generating synthetic samples instead of oversampling with replacement (Chawla et al., Reference Chawla, Bowyer, Hall and Kegelmeyer2002). Its main principle is to create new minority-class examples by interpolation among many minority-class examples that occur together. SMOTE uses standard Euclidean distance to find the
 $k$
samples closest in the distance for each minority sample (He et al., Reference He, Bai, Garcia and Li2008). After that, new synthetic samples are created by performing certain operations like rotation and skew (Batista, Prati, and Monard, Reference Batista, Prati and Monard2004). By interpolation rather than replication, the overfitting problem can be avoided in SMOTE and causes the decision boundaries for the minority class to spread into the majority class space (Batista et al., Reference Batista, Prati and Monard2004).
$k$
samples closest in the distance for each minority sample (He et al., Reference He, Bai, Garcia and Li2008). After that, new synthetic samples are created by performing certain operations like rotation and skew (Batista, Prati, and Monard, Reference Batista, Prati and Monard2004). By interpolation rather than replication, the overfitting problem can be avoided in SMOTE and causes the decision boundaries for the minority class to spread into the majority class space (Batista et al., Reference Batista, Prati and Monard2004). -
Cost-sensitive classification . Cost-sensitive classification considers the associated cost of misclassified examples rather than balancing distributions. This is done by considering the representative proportions of class examples in the distribution applied in sampling methods (Elkan, Reference Elkan2001). The objective of the cost-sensitive classification is to build and generate a model with the lowest cost by considering the cost matrix during building the model (Sun et al., Reference Sun, Kamel, Wong and Wang2007; He and Garcia, Reference He and Garcia2008). Furthermore, the cost matrix is always domain-dependent, and the defined costs can be different based on the application (Fernández et al., Reference Fernández, García, Galar, Prati, Krawczyk and Herrera2018).

Ensemble learning. Ensemble classifiers improve predictive ML results using constituent algorithms. They can mitigate many challenges, such as class imbalance and concept drift, as in many real-time ML applications, the distribution of features and the labels tend to change over time. The key idea of ensemble learning is to take an ensemble of “weak” learners and aggregate their results into one “strong” learner. An ensemble is considered a supervised learning algorithm (Whitehead and Yaeger, Reference Whitehead and Yaeger2010; Xia, Zong, and Li, Reference Xia, Zong and Li2011; Bayoudhi et al. Reference Bayoudhi, Ghorbel, Koubaa and Belguith2015). It has been proven experimentally that ensembles typically generate better results when there is significant diversity among the combined algorithms (Xia et al., Reference Xia, Zong and Li2011; Bayoudhi et al., Reference Bayoudhi, Ghorbel, Koubaa and Belguith2015).
Clustering. Clustering is one of the most popular data mining tasks extensively studied in the context of the text to organize large volumes of text documents. It has a wide range of applications, including classification, visualization, and organization of text documents (AlMahmoud, Hammo, and Faris, Reference AlMahmoud, Hammo and Faris2020). Text document clustering is essential in data indexing, information retrieval, managing, and mining extensive text data on the Web and incorporating information systems (Jing, Reference Jing2008). Document clustering aims to group similar documents that form consistent clusters while differentiating the others. However, it is not a straightforward task to decide whether two documents are identical or not, as it mainly depends on the application (Huang, Reference Huang2008). Selecting an appropriate clustering algorithm and evaluation metrics depends on the clustering objects and applications. KM and EM are conventional algorithms commonly used for text clustering (Singh, Tiwari, and Garg, Reference Singh, Tiwari and Garg2011; Janani and Vijayarani, Reference Janani and Vijayarani2019).
Undersampling. Sampling is a class of methods that alters the size of training datasets. Undersampling and oversampling change a training dataset by sampling a smaller set of the majority of data and repeating instances in the minority data, respectively (Drummond and Holte, Reference Drummond and Holte2003). Undersampling is a popular method to deal with the imbalanced data problem. It uses only a subset of the majority class, and therefore it is very efficient (Liu, Wu, and Zhou, Reference Liu, Wu and Zhou2008).
2.2 Related work
Sentiment analysis for the Arabic language . In the following, we present the related work on sentiment analysis for the Arabic language. Next, the related work for English and other languages will be discussed. Table 1 compares the studies presented in this section. The related studies were organized based on the approaches they applied. They include lexicon-based, ML-based, hybrid, cluster-based, and CBUS. The other taxonomy that has been used consists of the language of the dataset, the evaluation metrics used to validate the efficiency of the approach, whether the dataset was balanced or not, and the techniques applied to solve the imbalanced problem if it existed.
Table 1. Comparison of sentiment analysis approaches for Arabic and other languages

Khoo and Johnkhan (Reference Khoo and Johnkhan2018) presented a survey of sentiment lexical construction approaches in detail. They classified them into four main techniques: (1) manual construction, (2) bootstrapping from a set of seed words, (3) adopting a lexicon from another domain using transfer learning, and (4) ML or probabilistic learning based on human sentiment coding.
Farra et al. (Reference Farra, Challita, Assi and Hajj2010) introduced two approaches for predicting the sentiments of Arabic sentences. The first one considered the grammatical structure of a sentence. The second lexicon-based approach considered words of known sentiment orientation and their frequencies. The authors used the sentiments of different sentences from the same document to determine the sentiment of the entire document. Additionally, they used a dataset of Arabic movie reviews to evaluate their approaches. Assiri, Emam, and Al-Dossari (Reference Assiri, Emam and Al-Dossari2018) and Al-Moslmi et al. (Reference Al-Moslmi, Albared, Al-Shabi, Omar and Abdullah2018) also proposed a lexicon-based approach to enhance sentiment analysis of the Arabic language.
Shoukry and Rafea (Reference Shoukry and Rafea2012) proposed a sentence-level sentiment analysis for Arabic based on ML algorithms. They applied the feature vectors to the NB and SVM Classifiers and compared the performance of the two classifiers to pick the classifier with the highest accuracy. Bayoudhi et al. (Reference Bayoudhi, Ghorbel, Koubaa and Belguith2015) proposed a supervised classification approach of Arabic documents. His approach embraced a multi-type feature set including opinion, stylistic, domain-dependent, and morpho-lexical features with discourse markers. A comparative study was conducted among a few state-of-the-art and ensemble-based classifiers with various combinations of algorithms. Alayba et al. (Reference Alayba, Palade, England and Iqbal2018) combined CNNs and LSTMs networks and investigated their benefits to process Arabic sentiment classification. Because of the complexity of the orthography and morphology of Arabic, they used different levels of sentiment analysis to explore the effectiveness of the process. Other machine-based approaches to enhance sentiment analysis for the Arabic language were presented by El-Affendi, Alrajhi, and Hussain (Reference El-Affendi, Alrajhi and Hussain2021) and Elfaik et al. (Reference Elfaik2021).
El-Halees (Reference El-Halees2011) proposed a hybrid approach made of three phases, including (1) applying a lexicon-based approach to classify documents, (2) using the classified documents from the lexicon-based method as a training set and then using the maximum entropy method to classify other documents, and (3) using the classified documents from the previous two phases as a training dataset. Finally, they applied the K-NN algorithm to classify the rest of the documents. Taha (Reference Taha2017) also proposed a hybrid approach for Arabic tweets sentiment analysis. The approach has two phases. The first phase used two weighting algorithms to assign high weights to the most significant features of the Arabic tweets. They include information gain and Chi-squared, and they were applied during the preprocessing phase along with stop-word removal, tokenization, and stemming. The second phase employed a learning technique to classify Arabic tweets as positive or negative. Their proposed approach was used on a dataset collected from Arabic tweets and has achieved higher accuracy and precision than other classification techniques such as SVM, DT, and NN. To address the problem of imbalanced data Al-Azani and El-Alfy (Reference Al-Azani and El-Alfy2017) applied the over-sampling technique on the minority class by adding synthetic samples using the SMOTE technique for Short Arabic Text.
Sentiment analysis for English and other languages . Taboada et al. (Reference Taboada, Brooke, Tofiloski, Voll and Stede2011) extended their proposed dictionary, semantic orientation-calculator, to give polarity and strength to an opinion word. They computed semantic orientation using a simple aggregate-and-average method, where the total score of all adjectives was divided by the total number of adjectives in the document. Aung and Myo (Reference Aung and Myo2017) proposed a lexicon-based approach to analyze students’ textual feedback to predict the performance of teaching faculty. The method was based on a manually created lexicon containing sentiment words and intensifiers. The presented results showed the sentiments of students at different levels of granularity.
In Yang and Chen (Reference Yang and Chen2017), the ML methods in sentiment analysis were summarized, and the formulas of traditional methods (such as SVM, NB, and ME) were also provided. In addition, they presented the latest ANN (BPN and CNN) methods. Finally, they gave the practical techniques and the challenges of emotion analysis. Ahmad et al. (Reference Ahmad, Aftab, Bashir, Hameed, Ali and Nawaz2018) proposed an optimized sentiment analysis framework. They used the SVM grid search technique and the 10-k fold cross-validation to classify text. The grid search technique changes the gamma and costs parametric values of SVM. These values continually keep changing until the highest accuracy rate for a given dataset is reached. Xu et al. (Reference Xu, Meng, Qiu, Yu and Wu2019) proposed a sentiment analysis system based on bidirectional long short-term memory (BiLSTM) and applied it to the comment sentiment analysis task. The authors suggested an enhanced word representation approach, incorporating sentiment information using the classical term frequency-inverse document frequency (TF-IDF) and creating weighted word vectors. The comment vectors were better represented when the weighted word vectors were passed to BiLSTM. A feedforward neural network classifier determined the sentiment trend of BiLSTM the comment. Under identical conditions, the suggested sentiment analysis approach was compared against the sentiment analysis methods RNN, CNN, LSTM, and NB. The proposed approach has greater accuracy, recall, and F1-score rates based on the experimental results.
Many techniques were proposed to address the problem of imbalanced data (Li et al. Reference Li, Zhou, Wang, Lee and Wang2011; Satriaji and Kusumaningrum, Reference Satriaji and Kusumaningrum2018; Ghosh et al., Reference Ghosh, Banerjee, Chatterjee and Sen2019). In addition, Rupapara et al. (Reference Rupapara, Rustam, Shahzad, Mehmood, Ashraf and Choi2021) proposed a regression vector voting classifier, which is an ensemble strategy for identifying toxic comments on social media platforms. The ensemble combined the logistic regression with the support vector classifier using soft voting rules. They applied SMOTE for data balancing and TF-IDF and BoW for feature extraction. Kim, Koo, and Kim (Reference Kim, Koo and Kim2021) used an oversampling technique for imbalanced data.
George and Srividhya (Reference George and Srividhya2022) applied SMOTE for data balancing and combined ensemble-based bagging with SVM to enhance the classification performance.
Imran et al. (Reference Imran, Yang, Kastrati, Daudpota and Shaikh2022) used text generation models, CatGAN and SentiGAN, to generate new samples for minority groups. Also, they used deep learning and ML models to investigate the influence of synthetic text generation on the sentiment classification task for the highly imbalanced dataset.
Madabushi, Kochkina, and Castelle (Reference Madabushi, Kochkina and Castelle2020) proposed a strategy that used cost-sensitivity with BERT to allow for improved generalization. They proposed a simple measure of corpus similarity to decide whether their approach was likely effective. Also, they reported that while BERT could handle imbalanced classes without extra data enrichment, it did not generalize effectively when the training and testing data were sufficiently diverse.
Shaikh et al. (Reference Shaikh, Daudpota, Imran and Kastrati2021) proposed a method that used text sequence-generating methods to solve the data imbalance problem. They combined GPT-2 with the LSTM-based text creation model to create artificial data. In the study, they examined three severely imbalanced datasets from various fields. They concluded that while GPT-2 works far better at the paragraph or document level than LSTM, LSTM performed well at the sentence level while producing synthetic text.
Li et al. (Reference Li, Guo, Zhang, Gu and Yang2018) presented a sentiment classification model to overcome two main challenges in sentiment classification; domain-sensitive categorization and data imbalance. The authors proposed a sentiment lexicon generation method using a label propagation algorithm. They utilized the generated lexicon to obtain synthetic samples for the minority class by randomly replacing a set of words with words of similar semantic content.
In the text classification literature, clustering was used either as an alternative approach for term selection to reduce the dimensionality (Dhillon, Mallela, and Kumar, Reference Dhillon, Mallela and Kumar2003) or as a technique to enhance the training dataset. In the second case, clustering was used to discover a structure in the training examples and to expand the feature vectors with new attributes extracted from the clusters (Kyriakopoulou and Kalamboukis, Reference Kyriakopoulou and Kalamboukis2006; Yong, Youwen, and Shixiong, Reference Yong, Youwen and Shixiong2009; Onan, Reference Onan2017). Kyriakopoulou and Kalamboukis (Reference Kyriakopoulou and Kalamboukis2006) proposed an algorithm to combine supervised and unsupervised classification. In the unsupervised case, the aim was to extract a structure from a sample of objects or rephrase it appropriately to learn a concise representation of these data. The training and testing examples were clustered before the classification process to extract the structure of the whole dataset. Roul, Gugnani, and Kalpeshbhai (Reference Roul, Gugnani and Kalpeshbhai2015) proposed a clustering-based feature selection technique for text classification. First, the traditional KM clustering algorithm was applied to each dataset to generate k sub-clusters. Next, the important features of each sub-cluster were extracted using WordNet and TF-IDF scores. Finally, the top features were combined to generate the final reduced feature vector. The feature vector was used to train the ELM and ML-ELM classifiers. Chang, Chen, and Lin (Reference Chang, Chen and Lin2021) proposed the modified cluster-based over-sampling method for imbalanced sentiment classification. Jiang et al. (Reference Jiang, Zhou, Xiong, Du, Ou and Zhang2022) proposed the KSCB model, which combined K-means++, SMOTE, CNN, and Bi-LSTM. The proposed model employed CNN-Bi-LSTM to extract local features of text sentiment and capture context dependencies in sentences. It employed K-means++-SMOTE (a combination of K-means++ and SMOTE) to cluster the text sentiment and reduce between-class and within-class imbalances. The Kmeans++-SMOTE operation in KSCB was used to cluster sentiment text and then to build new corpora using an imbalance ratio to adjust data distribution. End-to-end learning was constructed using the loss function between K-means++-SMOTE and CNN-Bi-LSTM (combining CNN and Bi-LSTM).
Mountassir, Benbrahim, and Berrada (Reference Mountassir, Benbrahim and Berrada2012) proposed three different methods to under-sample the majority class of documents. These methods include removing similar, removing farthest, and removing by clustering. Almas and Ahmad (Reference Almas and Ahmad2007) proposed sentiment analysis methodologies for Arabic, Urdu, and English languages using computational linguistics. They discussed a local grammar method for extracting specialized terms automatically. Their experiments used a financial news dataset to evaluate their approaches. Abbasi et al. (Reference Abbasi, Chen and Salem2008) proposed a genetic algorithm for multilanguage sentiment classification. Document statistics and features measuring aspects of the writing style were used with word vectors to enhance a baseline classifier applied to a dataset of film reviews. These measures used syntactic and stylistic features such as word-length distributions, vocabulary richness measures, special-character frequencies, and character and word-level lexical features. They concluded that an entropy-weighted genetic algorithm could perform better than the standard feature reduction approach.
Despite the intensity of recent studies on sentiment analysis for the under-resourced Arabic language, as shown in Table 1, the biggest challenge is the lack of publicly available balanced benchmark datasets to validate newly developed methods or implemented software sentiment analysis systems. Recent work shows that researchers collected and built sentiment datasets from various social media platforms and manually analyzed them to extract sentiments. Although these efforts ended up with numerous solutions to the problem of sentiment analysis of the Arabic language, most datasets were imbalanced. Significant imbalanced data can affect the quality of the classification algorithms. Hence, most studies could not provide good generalizations for poorly represented classes.
To fill this gap in the Arabic language, this research presents the SCArD algorithm to handle the problem of imbalanced data in the SCArD. To test the efficacy of the SCArD algorithm, we used two sentiment classification datasets; the Gulf crisis and the Morocco-2016. Both datasets were appropriately annotated and human-verified (AlMahmoud et al., Reference AlMahmoud, Hammo and Faris2020). In addition, we tested the performance of SCArD on two publicly available datasets: the large-scale Arabic book review (LABR) dataset and the hotel Arabic-reviews dataset (HARD). Finally, we used the LABR and HARD datasets to compare the performance of SCArD using two feature extraction schemes; TF-IDF and the Arabic-BERT pre-trained language model. To the best of our knowledge, this is the first work combining CBUS and ensemble learning to solve this problem. This research can be helpful in advancing the research efforts in the field of sentiment analysis.
3. Research methodology
In this study, we followed a methodology made of five stages. It incorporated: (1) data collection, (2) feature extraction, (3) data preprocessing, (4) handling of imbalanced class distribution and model development, and (5) evaluation. Figure 1 shows the flow diagram of this methodology, whereas the following subsections discuss each stage in more detail.

Figure 1. The flow diagram of the research methodology.
3.1 Data collection
We used four datasets to test the SCArD algorithm; the Gulf crisis, the Morocco-2016, and two publicly available datasets; LABR and HARD. Subsection 3.2 describes the four datasets in more detail.
3.2 Datasets
The following is a description of the datasets we used to test the performance of the SCArD algorithm.
The Gulf crisis dataset. The dataset is about the Gulf crisis conflict that involved Qatar, United Arab Emirates, Saudi Arabia, and other regional countries. The dataset was collected and prepared by TooT,Footnote a which is a digital media company located in Amman, Jordan. The data collection was part of an ongoing research and investigation project on this conflict, and it is used in this research with their permission. A set of primary online news sources was selected to collect the related articles effectively based on their popularity. The sites were searched for relevant articles through two commonly used search engines: Google and Bing. Table 2 shows the online sources, which are websites of news agencies such as Reuters, news channels such as Aljazeera, or online versions of printed newspapers such as the Middle East. The number of the collected articles was (20,000). The articles that contain one of the search phrases in the title or the first two paragraphs were considered relevant and passed to the second phase for further processing and filtering. TooT’s subject-matter experts categorized a set of (3161) relevant articles under one of the topics shown in Table 2. Next, the articles were manually labeled into negative, neutral, or positive sentiments. Two annotators annotated each article, and a supervisor monitored the annotation quality and discussed labeling disagreements as they arose. The inter-annotator agreement was 68%. This percentage is considered slightly reasonable because determining an article’s sentiment is usually subjective to the judgment of the annotator. Detailed statistics of the dataset are shown in Table 3.
Table 2. Sources and topics of news articles
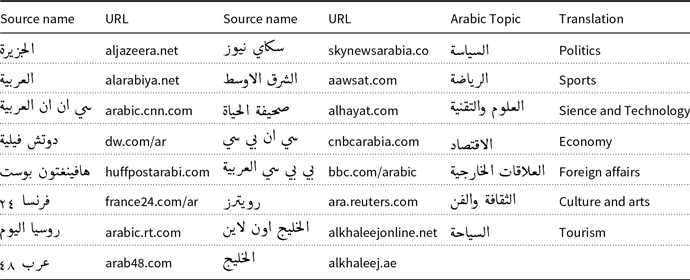
Table 3. Datasets

The Morocco-2016 dataset. The Morocco-2016 dataset is about the Morocco stereotype. The dataset is also the property of TooT. The data collection was part of ongoing research and investigation on the topic, and it was created for The Maghreb Center.Footnote b Further detail about the dataset can be found in (AlMahmoud et al., Reference AlMahmoud, Hammo and Faris2020). The dataset has (3520) articles, and they have been manually labeled into negative, neutral, and positive sentiments. Two subject-matter annotators from the Maghreb Center labeled each article, and a supervisor was available to mediate any labeling disagreements. The agreement between the annotators was 92%. Detailed statistics of the dataset are shown in Table 3.
The LABR dataset. The LABR dataset was collected from the Goodread.comFootnote c website in March 2013 and is publicly available (Aly and Atiya, Reference Aly and Atiya2013). It contains over 63,000 book reviews in Arabic. The distribution of the imbalanced dataset of LABR is depicted in Table 3.
The HARD. The dataset was collected from the Booking.comFootnote d website during June/July 2016 and is publicly available (Elnagar et al., Reference Elnagar, Khalifa and Einea2018). The reviews were expressed in modern standard and colloquial Arabic. The imbalanced dataset of HARD contains over 409,000 reviews, and its distribution is depicted in Table 4. Unfortunately, because the HARD dataset was so large that our computer machine could not handle it, we had to sample about 111,000 (27%) of the original dataset as given in Table 4.
Table 4. The HARD dataset

Unlike the work of (Aly and Atiya, Reference Aly and Atiya2013) on the LABR dataset and the work of (Elnagar et al., Reference Elnagar, Khalifa and Einea2018) on the HARD dataset where the researchers decided to neglect the neutral sentiments from all experiments, in this study, the neutral sentiments were found to be important and should not be neglected. The decision was also based on similar arguments discussed in (Koppel and Schler, Reference Koppel and Schler2006; Kaji and Kitsuregawa, Reference Kaji and Kitsuregawa2007).
3.3 Feature extraction
3.3.1 The TF-IDF
Feature extraction is a process of knowledge discovery and dimensionality reduction. Features are extracted from documents according to their calculated weights in the collection. Many techniques can be used to extract features from a data collection (Gupta and Lehal, Reference Gupta and Lehal2010). This study used two feature selection schemes; the statistical weighting scheme TF-IDF, and the Arabic-BERT pre-trained language model. TF-IDF determines the keywords that can identify or categorize some specific documents. It is defined as the product of
 $\text{TF}(t,d)$
and
$\text{TF}(t,d)$
and
 $\text{IDF}(t)$
, where
$\text{IDF}(t)$
, where
 $\text{TF}(t,d)$
is the number of times the word
$\text{TF}(t,d)$
is the number of times the word
 $t$
occurs in document
$t$
occurs in document
 $d$
, and
$d$
, and
 $\text{IDF}(t)$
is the inverse document frequency. It is calculated by Equation (1) (Jing, Huang, and Shi, Reference Jing, Huang and Shi2002).
$\text{IDF}(t)$
is the inverse document frequency. It is calculated by Equation (1) (Jing, Huang, and Shi, Reference Jing, Huang and Shi2002).
 \begin{equation} \text{IDF}(t) = \text{log}\!\left(\frac{N}{\text{DF}(t)}\right) \end{equation}
Where
 $N$
represents the total number of documents in the collection and the document frequency
$N$
represents the total number of documents in the collection and the document frequency
 $\text{DF}(t)$
is the number of documents in which the word
$\text{DF}(t)$
is the number of documents in which the word
 $t$
occurs at least once. The inverse document frequency is the highest if the word occurs only in one document, while its value is lowered if it occurs in too many documents. The value
$t$
occurs at least once. The inverse document frequency is the highest if the word occurs only in one document, while its value is lowered if it occurs in too many documents. The value
 $\text{TF-IDF}(t, d)$
of features
$\text{TF-IDF}(t, d)$
of features
 $t$
for document d is then calculated as a product value by Equation (2) (Jing et al., Reference Jing, Huang and Shi2002).
$t$
for document d is then calculated as a product value by Equation (2) (Jing et al., Reference Jing, Huang and Shi2002).
 \begin{equation} \text{TF-IDF}(t,d) = \text{TF}(t,d) \times \text{IDF}(t) \end{equation}
 $\text{TF-IDF}(t, d)$
is called the weight of word
$\text{TF-IDF}(t, d)$
is called the weight of word
 $t$
in document
$t$
in document
 $d$
. This heuristic weighting scheme for a word says that if a word
$d$
. This heuristic weighting scheme for a word says that if a word
 $t$
frequently occurs in a document
$t$
frequently occurs in a document
 $d$
(i.e., the term frequency is high), it is considered an effective indexing term for a document
$d$
(i.e., the term frequency is high), it is considered an effective indexing term for a document
 $d$
. However, words that occur frequently but have low inverse document frequency are considered insignificant indexing terms (Jing et al., Reference Jing, Huang and Shi2002).
$d$
. However, words that occur frequently but have low inverse document frequency are considered insignificant indexing terms (Jing et al., Reference Jing, Huang and Shi2002).
3.3.2 The Arabic-BERT pretrained language model
BERT stands for Bidirectional Encoder Representations from Transformers. It is a neural network architecture introduced by Google in 2018 (Devlin et al., Reference Devlin, Chang, Lee and Toutanova2018). It is considered a state-of-the-art pretrained deep learning model for NLP tasks such as text classification, sentiment analysis, and question answering. BERT is an unsupervised learning model pretrained on large datasets such as Wikipedia and BookCorpus. It can be used directly, or it can be fine-tuned using a smaller labeled dataset to perform a specific supervised NLP task. Many transformers similar to BERT have been developed for different languages.
In this research, we used the Arabic-BERT-base model, which is an Arabic-BERT model pre-trained on 8.2 billion words to learn contextualized representations of Arabic words and phrases (Safaya, Abdullatif, and Yuret, Reference Safaya, Abdullatif and Yuret2020). The data were collected from different resources, including the Arabic version of open super-large crawled aggregated coRpus,Footnote e Arabic Wikipedia,Footnote f and other Arabic resources. The final dataset was about 95 GB of text. The development of Arabic BERT has greatly improved the ability of NLP systems to understand and generate Arabic text (Emami et al., Reference Emami, Nugues, Elnagar and Afyouni2022; Aftab and Malik, Reference Aftab and Malik2022).
The representation generated by Arabic-BERT is a vector that captures the meaning and context of the input text. This vector contains a lot of information about the words and their relationships to each other in the sentence. Algorithm 1 depicts how the vector representations for the input text were extracted from the output of the pretrained Arabic-BERT model.

3.4 Data preprocessing
Data preprocessing includes a set of processes such as normalization of some Arabic letterforms, tokenization of words, removal of stop words, and stemming. In this phase, we applied the preprocessing steps described in a previous study of the first author (AlMahmoud et al., Reference AlMahmoud, Hammo and Faris2020) and the work of (Aref et al. Reference Aref, Al Mahmoud, Taha and Al-Sharif2020; Al-Laith and Shahbaz, Reference Al-Laith and Shahbaz2021). All preprocessing tasks were handled automatically, and they include the following:
-
1. Normalization A set of normalization steps are usually applied to reduce the huge number of extracted terms. These steps include:
-
Removing non letters and special characters ($,&,%,
$\ldots$
) -
Removing non-Arabic letters
-
Replacing initial
, or with bare alef -
Replacing final
with -
Removing
from the beginning of a word -
Replacing final
with
-
-
2. Tokenization Tokenization usually analyzes the text and splits it into a stream of individual tokens (words). It involves determining the boundaries of words, such as whitespaces and punctuation marks.
-
3. Removal of stop-words Natural languages have their lists of stop words. For instance, in English, these words include articles such as “the, a, and an” and demonstratives like “this,” “that” and “those,” etc. Removing these high-frequency words from documents would decrease the number of indexed words and significantly improve the searching/retrieving time in many applications such as information retrieval. Likewise, the Arabic stop-words list includes words belonging to closed-class categories such as prepositions (
), demonstratives (), adverbs (), etc. -
4. Stemming In this study, we adapted a shallow stemming approach, which removes the common affixes (i.e., prefixes and suffixes) from derivative words to extract their roots. It performs better than the root-based approach, which applies deep analysis to pull the roots.

3.5 The SCArD algorithm
The SCArD is given in Algorithm 2. It is mainly based on converting the imbalanced dataset into multiple balanced datasets and then training the classifiers separately on each of the new balanced datasets. This approach clusters the majority of class instances into several clusters using the CBUS method. It applied two commonly used clustering algorithms: KM and EM. Then it combines the instances of the minority classes with each cluster from the previous step. Each dataset should have a more balanced ratio of minority–majority classes. Finally, two classifiers (RF and UNB) are trained separately using the new balanced datasets to generate the best prediction data models based on accuracy rates. We applied two techniques to test our approach and generate new predictions from the imbalanced testing dataset. The first one uses the best prediction data models. The second uses the majority voting ensemble model, which combines the best prediction data models to generate the final predictions (Su et al., Reference Su, Zhang, Ji, Wang and Wu2012; Rojarath, Songpan, and Pong-inwong, Reference Rojarath, Songpan and Pong-inwong2016). Figure 2 shows the workflow of the proposed approach, while the SCArD algorithm is given in Algorithm 2.

Figure 2. The workflow of the SCArD algorithm.
3.5.1 The clustered-based under-sampling
The merit of the CBUS technique is to balance the ratio between the majority and the minority classes of the imbalanced training dataset by decreasing the number of the majority class instances and maintaining the number of minority classes at the cluster level. As shown in Figure 2, the KM and the EM clustering algorithms were applied separately to the imbalanced training dataset of the majority class to cluster it into appropriate subsets of majority clusters to be merged with the instances on the minority classes. The number of clusters is determined experimentally based on the training dataset.
The workflow of SCArD, based on Figure 2 and Algorithm 2, can be summarized as follows:
-
1. The data split-phase. The imbalanced dataset (shown in Table 3) is split into two datasets; training (66%) and testing (34%). The two datasets are drawn using stratified sampling of the original dataset.
-
2. The initial training phase. The RF and the UNB classifiers are trained separately on the imbalanced training dataset. Both algorithms are trained using 10-fold cross-validation. The RF is trained 30 times, and the average of all evaluation metrics is taken, while the UNB is trained only once.
-
3. The training data split-phase. The imbalanced training dataset is divided into two datasets; the first one includes the majority class instances (positive class (1)), while the second dataset has all instances of the minority classes (neutral class (0) and negative class (−1)).
-
4. The CBUS phase. The CBUS method uses two common clustering algorithms: KM and EM. They are applied separately to the majority dataset. This phase developed six clusters; three clusters per each algorithm. The value k = 3 was determined experimentally.
-
5. The merge phase. The balanced datasets are generated after combining the dataset of the minority classes with each of the resulting clusters.
-
6. The training phase. The RF classifier is applied to each dataset using 10-fold cross-validation for 30 runs and taking the average of all evaluation metrics. Because the UNB is a deterministic algorithm, it takes only one run using 10-fold cross-validation. This phase developed 12 prediction data models, six models per classifier.
-
7. The testing phase. The best prediction data models (determined experimentally) from the training phase are selected based on accuracy rates. Next, they are applied to the imbalanced test dataset to generate new predictions. In addition, a majority voting ensemble model, which combines the best prediction models and the models from the initial training phase, is applied to generate the final predictions from the imbalanced test dataset.

3.5.2 SCArD complexity analysis
The overall complexity analysis of the SCArD algorithm is collectively based on running the classification algorithms shown in Table 5. The detailed phases and their complexities for running SCArD are given below.
Table 5. Time Complexity of the SCArD algorithm

 ${}^{*}$
d: number of features, k: number of clusters, n: number of documents, r: number of decision trees, t: number of iterations.
${}^{*}$
d: number of features, k: number of clusters, n: number of documents, r: number of decision trees, t: number of iterations.
-
1. Training–Testing splitting phase takes
$O(n)$
, where n is the number of documents. -
2. The split phase takes
$O(n)$
, where n is the number of documents. -
3. The clustering phase takes
$O(knt)$
+
$O(k^2 n)$
as shown in Table 5. -
4. The merging phase takes
$O(n)$
, where n is the number of documents. -
5. The classification phase takes
$O(nlog(n)dr)$
+
$O(nd)$
as shown in Table 5. -
6. The Ensemble phase takes
$O(n)$
, where n is the number of documents.


3.6 Evaluation metrics
To evaluate the performance of the developed classification models, we used two evaluation metrics; the F1-score and the cost-sensitive. The F1-score rate is the most common evaluation metric used in the literature for imbalanced datasets. In contrast, the cost-sensitive evaluation depends on a cost matrix. Because we are using an imbalanced dataset, the accuracy rate is not our concern for evaluating the proposed models.
The F-measure. For a class (C), the F1-measure value, also known as F1-score or simply F-score, is a composition of precision and recall. It is a consistent average of the two metrics which is used as an accumulated performance score. It is calculated by Eq. 3, which has been adapted from the general macro F1-score equation (Sokolova and Lapalme, Reference Sokolova and Lapalme2009; Aref et al., Reference Aref, Al Mahmoud, Taha and Al-Sharif2020).
 \begin{equation} \text{F1-score (C)} = \frac{2*\text{Precision(C)}*\text{Recall(C)}}{\text{Precision(C)}+\text{Recall(C)}} \end{equation}
Cost-sensitive measures. The objective of the cost-sensitive classification is to build and generate a model with the lowest cost by considering the cost matrix during building the model. The cost-sensitive evaluation value is calculated as the summation of all misclassified instances. Table 6 shows the most effective cost matrix depending on the evaluation metrics and the judgment of the subject-matter experts of Toot. The numbers −1, 0, and 1 represent the negative, neutral, and positive classes.
Table 6. The cost matrix of the Gulf Crisis problem

4. Experiments and results
In this section, we present the performance of the SCArD algorithm and compare it with other classification models. Also, we shed some light on the practical implications of this study on the future research of Arabic sentiment classification. First, we present the experimental setup. Next, the four main experiments conducted on the dataset are discussed. Finally, we discuss the evaluation performance of the SCArD algorithm.
4.1 Experimental setup
All experiments were conducted using a personal computer with Intel
 $^{\circledR}$
core
$^{\circledR}$
core
 $^{TM}$
i5-5500U CPU @ 2.53 GHz/4 GB RAM. The algorithms were implemented using the Java programing language. The WEKA library was used to run the classification algorithms and estimate the evaluation metrics.
$^{TM}$
i5-5500U CPU @ 2.53 GHz/4 GB RAM. The algorithms were implemented using the Java programing language. The WEKA library was used to run the classification algorithms and estimate the evaluation metrics.
4.2 Extraction of the best subset of features
Features (
 $tokens$
) could be anywhere in a document. They were extracted experimentally from titles and content of documents after being preprocessed. The following discussion illustrates the approach we followed to extract the best features representing all documents in the dataset. For each document, we started with 40 features, 80, and 160. We ended up trying all document’s features. Figure 3 shows the performance of the RF classifier using a different number of features. At 40 features, the F1-score rate for the negative class was (0.37) and for the neutral class was (0.09). At 80 features, the F1-score rate slightly improved to (0.39) and (0.1) for the same classes, respectively. However, there was a degradation in the F1-score rates when we selected a higher number of features. After all, we compiled four feature sets from the Gulf crisis dataset. Table 7 presents the characteristics of the feature sets. The first feature set FS
$tokens$
) could be anywhere in a document. They were extracted experimentally from titles and content of documents after being preprocessed. The following discussion illustrates the approach we followed to extract the best features representing all documents in the dataset. For each document, we started with 40 features, 80, and 160. We ended up trying all document’s features. Figure 3 shows the performance of the RF classifier using a different number of features. At 40 features, the F1-score rate for the negative class was (0.37) and for the neutral class was (0.09). At 80 features, the F1-score rate slightly improved to (0.39) and (0.1) for the same classes, respectively. However, there was a degradation in the F1-score rates when we selected a higher number of features. After all, we compiled four feature sets from the Gulf crisis dataset. Table 7 presents the characteristics of the feature sets. The first feature set FS
 $_{1}$
was extracted from the titles of the documents, FS
$_{1}$
was extracted from the titles of the documents, FS
 $_{2}$
from titles and content, FS
$_{2}$
from titles and content, FS
 $_{3}$
from title, content, and source, and finally, FS
$_{3}$
from title, content, and source, and finally, FS
 $_{4}$
was extracted from title and source. The average number of features in the training dataset was 279. In this experiment, we did not report on the results of the UNB classifier because they were unsatisfactory.
$_{4}$
was extracted from title and source. The average number of features in the training dataset was 279. In this experiment, we did not report on the results of the UNB classifier because they were unsatisfactory.

Figure 3. Performance of the RF classifier based on the number of extracted features.
Table 7. Feature sets characteristics

4.3 Experiments
The experiments were conducted in four practical scenarios as follows:
-
Experiment I: The effect of feature subset extraction on the classification process.
-
Experiment II: Classification with SMOTE oversampling technique.
-
Experiment III: Classification with a classifier combining cost-sensitive learning, RF, and UNB algorithms.
-
Experiment IV: Classification with the SCArD algorithm.
-
Experiment V: Classification with the SCArD algorithm: Comparing TF-IDF and Arabic-BERT pre-trained language model for feature extraction.
Experiments I, II, and III were conducted on the imbalanced Gulf crisis dataset, while experiment IV was conducted on four imbalanced datasets; the Gulf crisis, Morocco-2016, and the publicly available datasets: LABR and HARD. Experiment V was conducted only on the LABR and HARD datasets. In all experiments, the RF algorithm was trained using 10-fold cross-validation 30 times, then the average of all evaluation metrics was taken, while the UNB algorithm was trained only once. In the following subsections, we discuss the experiments in more detail.
4.3.1 Experiment I: The effect of feature subset extraction on the classification process
The first experiment was conducted on the imbalanced Gulf crisis training dataset. We ran the RF and UNB classifiers using the four feature sets described in Table 7 after fixing the number of features, experimentally, at 80. Table 9 shows the results of the two classifiers. The best results are in bold typeface. In this experiment, we observed that using the feature set (FS
 $_{4}$
), which contains an article’s title and source, provides the best F1-score rates for both classifiers and all classes (i.e., positive, neutral, and negative). For instance, the UNB classifier achieved an F1-score rate of (0.602) for the negative class, while the RF classifier achieved (0.867) for the positive class. The UNB classifier achieved (0.446) for the neutral class using the feature set (FS
$_{4}$
), which contains an article’s title and source, provides the best F1-score rates for both classifiers and all classes (i.e., positive, neutral, and negative). For instance, the UNB classifier achieved an F1-score rate of (0.602) for the negative class, while the RF classifier achieved (0.867) for the positive class. The UNB classifier achieved (0.446) for the neutral class using the feature set (FS
 $_{3}$
). This experiment indicates that the title gives a good sentiment about the article. This observation was investigated with the Gulf crisis dataset annotators and by taking samples from the documents. It was determined that Arabic titles usually use meaningful words, and unlike other languages, English, for example, Arabic titles rarely have abbreviations. Accordingly, combining the source of the text and the title enhanced the classification results.
$_{3}$
). This experiment indicates that the title gives a good sentiment about the article. This observation was investigated with the Gulf crisis dataset annotators and by taking samples from the documents. It was determined that Arabic titles usually use meaningful words, and unlike other languages, English, for example, Arabic titles rarely have abbreviations. Accordingly, combining the source of the text and the title enhanced the classification results.
Table 8. The imbalanced training dataset after applying the SMOTE oversampling technique

Table 9. The evaluation metrics of the RF and the UNB classifiers applied to the Gulf crisis feature sets

The best results are in bold typeface.
4.3.2 Experiment II: Classification with SMOTE oversampling technique
The purpose of the second experiment is to study the effect of the SMOTE oversampling technique on the imbalanced training dataset. SMOTE was applied to the minor classes (negative class (−1) and the neutral class (0)). Table 8 shows the oversampling ratios applied to the minor classes and the produced instances. Table 10 shows the effect of the SMOTE oversampling technique on the RF and UNB classifiers. The best results are in bold typeface. We observed that oversampling using SMOTE did not significantly improve the F1-score rates for both tested classifiers. However, the RF classifier showed a slight improvement in the F1-score rates for all classes using the feature set (FS
 $_{4}$
). For instance, RF achieved an F1-score rate of (0.581) for the negative and (0.869) for the positive classes. The UNB classifier achieved (0.29) for the neutral class as shown in Table 10. The reported results were achieved at an oversampling ratio of 500% for the negative and 300% for the neutral classes.
$_{4}$
). For instance, RF achieved an F1-score rate of (0.581) for the negative and (0.869) for the positive classes. The UNB classifier achieved (0.29) for the neutral class as shown in Table 10. The reported results were achieved at an oversampling ratio of 500% for the negative and 300% for the neutral classes.
Table 10. The evaluation metrics of the RF and the UNB classifiers using SMOTE.

The best results are in bold typeface.
4.3.3 Experiment III: Classification with a classifier combining cost-sensitive learning, RF, and UNB algorithms
The third experiment aims to study the effect of combining the cost-sensitive classifier with RF and UNB on the imbalanced training dataset. The results of this experiment using the cost matrix (shown in Table 6) are given in Table 11. The best results are in bold typeface. A closer look at Table 11 shows that combining the cost-sensitive classifier with the RF algorithm achieved the best F1-score rates when using the feature set (FS
 $_{4}$
). For instance, RF achieved an F1-score rate of (0.624) for the negative and (0.868) for the positive classes. For the neutral class, when combined with UNB, it achieved an F1-score rate of (0.438) using the feature set (FS
$_{4}$
). For instance, RF achieved an F1-score rate of (0.624) for the negative and (0.868) for the positive classes. For the neutral class, when combined with UNB, it achieved an F1-score rate of (0.438) using the feature set (FS
 $_{3}$
) as shown in Table 11. The results we obtained complied with the lowest calculated cost-sensitive values (Total Cost), shown in the third column of Table 11. Combining the cost-sensitive classifier with RF produced the lowest cost at (531.8) when using the feature set (FS
$_{3}$
) as shown in Table 11. The results we obtained complied with the lowest calculated cost-sensitive values (Total Cost), shown in the third column of Table 11. Combining the cost-sensitive classifier with RF produced the lowest cost at (531.8) when using the feature set (FS
 $_{4}$
), while for the UNB, the lowest cost was at (443) for (FS
$_{4}$
), while for the UNB, the lowest cost was at (443) for (FS
 $_{3}$
). This experiment reveals that using the cost-sensitive classifier combined with RF and UNB on the imbalanced training dataset slightly improved the F1-score rates of the negative class and moderately lowered them for the neutral class.
$_{3}$
). This experiment reveals that using the cost-sensitive classifier combined with RF and UNB on the imbalanced training dataset slightly improved the F1-score rates of the negative class and moderately lowered them for the neutral class.
Table 11. The evaluation metrics of the RF and the UNB classifiers using the cost-sensitive classifier.

Best results are in bold typeface.
4.3.4 Experiment IV: Classification with the SCArD algorithm
Figure 2 describes the workflow of SCArD, while Algorithm 2 describes the training and testing processes. The CBUS method uses KM and EM clustering algorithms and applies them to the imbalanced training dataset. As discussed earlier, this step produces three clusters for each clustering algorithm. The number of clusters (K) was determined experimentally, and the best number was fixed at three. Nevertheless, we tried different values of K such as 5, 7, and higher; however, we always ended with either empty clusters or clusters with a few instances. The balanced datasets were generated after combining the dataset of the minor classes with each of the resulting six clusters.
Table 12 shows the number of instances of each cluster for both clustering algorithms (i.e., KM and EM) applied to the Gulf crisis dataset. In a similar way, the Morocco-2016 dataset is given in Table 13, the LABR dataset is given in Table 14, and the HARD dataset is given in Table 15.
Table 12. Number of instances per each cluster after applying the CBUS method to the Gulf crisis training dataset

Table 13. Number of instances per each cluster after applying the CBUS method to the Morocco-2016 dataset

Table 14. Number of instances per each cluster after applying the CBUS method to the LABR dataset

Table 15. Number of instances per each cluster after applying the CBUS method to the HARD dataset

As for the performance of the SCArD algorithm, Table 16 presents the RF, and the UNB classifiers applied to each balanced dataset resulting from the Gulf crisis dataset after using the CBUS method. As shown in Table 16, a few models showed better performance in terms of accuracy rates than the others. For example, models RFKM
 $_{C2}$
, and RFEM
$_{C2}$
, and RFEM
 $_{C1}$
were among the best models achieving the highest accuracy rates. Therefore, those two models can be used in the ensemble classification to improve the results further. After all, we applied the following steps to the imbalanced Gulf crisis test dataset:
$_{C1}$
were among the best models achieving the highest accuracy rates. Therefore, those two models can be used in the ensemble classification to improve the results further. After all, we applied the following steps to the imbalanced Gulf crisis test dataset:
Table 16. The evaluation metrics of the RF and the UNB classifiers using the CBUS method applied to the Gulf crisis dataset.

The best results are in bold typeface.
-
1. The majority voting ensemble classifier combined the best two data models achieving the highest accuracy rates from Table 16 (i.e., RFKM
$_{C2}$
and RFEM
$_{C1}$
) with the RF and UNB models, applied separately to the imbalanced training dataset, to build an ensemble model. The reason behind selecting only two models from the 12 potential models was determined experimentally. Initially, we started building the ensemble using the best two models, four models, a combination of best models, and all twelve models, in addition to the RF and UNB models. However, the best performance of the majority voting ensemble model, shown in Table 20 and Figure 4, was achieved using the best two models combined with the RF model. The results obtained from the UNB model were unsatisfactory. Therefore, the UNB model was ignored. -
2. The best two models from Table 16; RFKM
$_{C2}$
and RFEM
$_{C1}$
were separately applied to the imbalanced test dataset. We noticed that the RFEM
$_{C1}$
model slightly outperformed the RFKM
$_{C2}$
in terms of F1-score rates for both the negative and neutral classes. In addition, both models show superiority over the majority voting ensemble model in terms of accuracy and F1-score rates. Table 20 and Figure 4 show the final results of the Gulf crisis dataset.


Figure 4. The evaluation metrics of the balancing algorithms, majority voting ensemble model, and the best prediction data models applied to the Gulf crisis dataset.
Similarly, we repeated the same procedure on the Morocco-2016 dataset. The best data models achieving the highest accuracy rates from Table 17 were RFKM
 $_{C3}$
and RFEM
$_{C3}$
and RFEM
 $_{C1}$
. The ensemble combined the two models with the RF model to build the final prediction from the imbalanced test dataset. The final results and the performance of the majority voting ensemble model are shown in Table 21 and Figure 5. Next, the best two models, RFKM
$_{C1}$
. The ensemble combined the two models with the RF model to build the final prediction from the imbalanced test dataset. The final results and the performance of the majority voting ensemble model are shown in Table 21 and Figure 5. Next, the best two models, RFKM
 $_{C3}$
and RFEM
$_{C3}$
and RFEM
 $_{C1}$
, were separately applied to the imbalanced test dataset. We observed that the RFKM
$_{C1}$
, were separately applied to the imbalanced test dataset. We observed that the RFKM
 $_{C3}$
slightly outperformed the RFEM
$_{C3}$
slightly outperformed the RFEM
 $_{C1}$
. However, the majority voting ensemble model outperformed the two individual models in terms of accuracy and F1-score rates.
$_{C1}$
. However, the majority voting ensemble model outperformed the two individual models in terms of accuracy and F1-score rates.

Figure 5. The evaluation metrics of the majority voting ensemble model and the best prediction data models applied to the Morocco-2016.
Table 17. The evaluation metrics of the RF and the UNB classifiers using the CBUS method applied to the Morocco-2016 dataset.

The best results are in bold typeface.
Whilst for the publicly available LABR dataset, the performance of the SCArD algorithm was compared to all algorithms applied to the original LABR dataset. The algorithms included SVM, MNB, and BNB (Aly and Atiya, Reference Aly and Atiya2013). After running the experiment on the imbalanced LABR test dataset, we noticed that the SVM algorithm achieved the highest accuracy rate of (0.674). While for the SCArD algorithm, as shown in Table 18, the best data models achieving the highest accuracy rates were the RFKM
 $_{C2}$
and RFKM
$_{C2}$
and RFKM
 $_{C3}$
, respectively. Consequently, those two models were used in the ensemble classification step. After all, we noticed that the majority voting ensemble model outperformed all classification models in terms of accuracy and F1-score rates for negative, neutral, and positive classes. The final results and the performance of all algorithms applied to the LABR dataset are shown in Table 22 and Figure 6. Consequently, the SCArD algorithm outperformed all algorithms applied to the original LABR dataset.
$_{C3}$
, respectively. Consequently, those two models were used in the ensemble classification step. After all, we noticed that the majority voting ensemble model outperformed all classification models in terms of accuracy and F1-score rates for negative, neutral, and positive classes. The final results and the performance of all algorithms applied to the LABR dataset are shown in Table 22 and Figure 6. Consequently, the SCArD algorithm outperformed all algorithms applied to the original LABR dataset.
Table 18. The evaluation metrics of the RF and the UNB classifiers using the CBUS method applied to the LABR dataset.

The best results are in bold typeface.

Figure 6. The evaluation metrics of the majority voting ensemble model and the best prediction data models applied to the LABR.
Finally, for the HARD dataset, which is another publicly available dataset, we tested the performance of the SCArD algorithm and compared it to all algorithms applied to the original HARD dataset. The algorithms included Logistic Regression, AdaBoost, SVM, Passive-Aggressive, and Perceptron (Elnagar et al., Reference Elnagar, Khalifa and Einea2018). After conducting the experiment on the imbalanced dataset sampled from HARD as described in Table 4, we noticed that the SVM and the Logistic Regression algorithms achieved the highest accuracy rates of (0.84). While for the SCArD algorithm, as shown in Table 19, the best data models achieving the highest accuracy rates were the RFKM
 $_{C1}$
and RFKM
$_{C1}$
and RFKM
 $_{C3}$
, respectively. Therefore, those two models were used in the ensemble classification step. After all, we noticed that the majority voting ensemble model outperformed all classification models in terms of accuracy and F1-score rates for negative, neutral, and positive classes. The final results and the performance of all algorithms applied to the HARD dataset are shown in Table 23 and Figure 7. Accordingly, the SCArD algorithm outperformed all algorithms applied to the sampled HARD dataset.
$_{C3}$
, respectively. Therefore, those two models were used in the ensemble classification step. After all, we noticed that the majority voting ensemble model outperformed all classification models in terms of accuracy and F1-score rates for negative, neutral, and positive classes. The final results and the performance of all algorithms applied to the HARD dataset are shown in Table 23 and Figure 7. Accordingly, the SCArD algorithm outperformed all algorithms applied to the sampled HARD dataset.

Figure 7. The evaluation metrics of the majority voting ensemble model and the best prediction data models applied to the HARD.
Table 19. The evaluation metrics of the RF and the UNB classifiers using the CBUS method applied to the HARD dataset.

The best results are in bold typeface.
Table 20. The evaluation metrics of the RF classifier, balancing algorithms, majority voting ensemble, and the best prediction data models applied to the Gulf crisis test dataset.

The best results are in bold typeface.
The results of the fourth experiment indicated that using the SCArD algorithm, achieved the best F1-score rates and outperformed the other balancing algorithms applied to the four datasets. Table 24 depicts a comparison of the evaluation metrics of the four experiments on all datasets. The following behaviors were observed:
-
First, for the Gulf dataset, we observed that the RFEM
$_{C1}$
model significantly outperformed the conventional RF, SMOTE, and cost-sensitive models based on the F1-score rates for the minor classes. The RFEM
$_{C1}$
model achieved F1-score rates of (0.663) and (0.451) for the negative and neutral classes, respectively. In comparison, the positive class achieved an F1-score rate of (0.859). -
Secondly, we observed that the proposed SCArD algorithm using the majority voting ensemble model achieved the best results for three datasets (Morocco-2016, LABR, and HARD) based on F1-score rates for the minority sentiment classes as well as for the positive class. For instance, in the Morocco-2016 dataset, shown in Table 24, the voting ensemble achieved F1-score rates of (0.48) and (0.23) for the negative and neutral sentiments classes, while it achieved an F1-score rate of (0.76) for the positive class. While for the LABR dataset, the SCArD voting ensemble outperformed all classification models applied to the dataset, as described in Table 22. Table 24 shows that the voting ensemble applied to the LABR dataset achieved F1-score rates of (0.230) and (0.57) for the negative and neutral classes, respectively, and (0.860) for the positive class. On the other hand, for the HARD dataset, the SCArD voting ensemble also outperformed all classification models applied to the dataset, as described in Table 23. Table 24 shows that the voting ensemble applied to the HARD dataset achieved F1-score rates of (0.730) and (0.80) for the negative and neutral classes, respectively, and (0.930) for the positive class.


Intuitively, this was expected because the SCArD algorithm did not remove the majority of class instances from the dataset. Yet, it did not inject the dataset with artificial minority class instances or change the class distribution.
4.3.5 Experiment V: Classification with the SCArD algorithm: Comparing TF-IDF and Arabic-BERT pre-trained language model for feature extraction
For tasks that require a deep understanding of the language, BERT, in general, is a more complex and powerful technique for feature extraction compared to TF-IDF. However, TF-IDF remains a simple, useful, and computationally efficient technique for tasks that require a simple bag-of-words representation of the text. Training Arabic-BERT from scratch on a new text dataset requires powerful computing resources; usually, a cloud TPU or GPUs are used, which is extremely expensive for academic research groups. A way around this problem was to extract vectors directly from the Arabic-BERT model. Therefore, in this experiment, we used the knowledge learned from the Arabic-BERT model to encode the input text from each of the LABR and HARD datasets into a fixed-length vector representation, which captures the contextual meaning of the input text as described by Algorithm 1. This approach can save significant time and resources compared to training the model from scratch.
Table 21. The evaluation metrics of the RF classifier, majority voting ensemble, and the best prediction data models applied to the Morocco-2016 test dataset.

The best results are in bold typeface.
Table 22. The evaluation metrics of the RF classifier, majority voting ensemble, and the best prediction data models applied to the LABR test dataset.

The best results are in bold typeface.
Table 23. The evaluation metrics of the RF classifier, majority voting ensemble, and the best prediction data models applied to the HARD test dataset.

The best results are in bold typeface.
The results of using the Arabic-BERT data model for feature extraction are in Table 25. As shown from this table, using the SCArD voting ensemble with the Arabic-BERT pretrained model for feature extraction achieved the best F1-score rates for both datasets, LABR and HARD. As expected, the Arabic-BERT model should outperform the TF-IDF statistical model for feature extraction. However, the SCArD voting ensemble gave its best F1-score results using the TF-IDF model, as discussed earlier in experiment IV and shown in Table 24. It is usually not uncommon to observe that the performance of BERT and its variances, such as the Arabic-BERT, might be affected based on the similarity of the new datasets to the original pre-training data. Here are two main reasons why the results of using the Arabic-BERT model for feature extraction did not perform well compared to TF-IDF on the two datasets:
Table 24. Summarization of the best classification models applied to all datasets based on the F1-score rates for negative (−ve), neutral (N), and positive (+ve) sentiment classes

Table 25. Summarization of the best models of the LABR and HARD datasets trained on Arabic-BERT based on the F1-score rates for negative (−ve), neutral (N), and positive (+ve) sentiment classes

-
1. The LABR and HARD datasets contain words that might not be present in the original Arabic-BERT pretrained model. Therefore, the model might have difficulty understanding these out-of-vocabulary words as it may not have learned their representations.
-
2. The domain of the new datasets significantly differs from the data in the original Arabic-BERT pretrained model; however, fine-tuning the model on the new datasets to adapt their language representations becomes necessary to achieve good performance.
For future research, we plan to train the Arabic-BERT model on all datasets used in this research.
5. Conclusions and future directions
The main task of text data mining is to extract hidden knowledge from text using techniques borrowed from NLP and data mining fields. In this study, we tackled the problem of Arabic multi-class sentiment classification. We implemented several models to address the issue of imbalanced datasets. We also presented their impacts on the classification problem. The experiments conducted on the Gulf crisis dataset showed that selecting the title and the source of an article decreased the required features. Consequently, they increased the performance of the classification measures. After analyzing the results of the experiments, we concluded that the cost-sensitive classifier, which depends on a cost matrix to handle the imbalanced datasets, performed better than the SMOTE oversampling method. The clustered-based Undersampling method, incorporated in the proposed clustering approach, balanced the ratio between the major and the minor classes. This was achieved by decreasing the number of major class instances and maintaining the number of minor class instances at the cluster level. Also, we concluded that the clustered-based undersampling method outperformed the other tested models. We applied two techniques to test our approach and generate new predictions from an imbalanced test dataset: (1) Using the best prediction data models or (2) Using the majority voting ensemble model, which combines the best prediction data models to generate the final predictions. The best prediction data models effectively outperformed the majority voting ensemble model for the Gulf crisis dataset. However, the majority voting ensemble model performed better for the Morocco-2016 dataset and the publicly available datasets, LABR and HARD. Finally, we experienced two feature extraction schemes; the statistical TF-IDF and the Arabic-BERT pre-trained language model. Arabic-BERT is a pretrained language model that can generate high-quality numerical embeddings of text data. Although we expected the Arabic-BERT model to have superiority over TF-IDF, however, the results were in favor of TF-IDF. The main reason behind this behavior was that the Arabic-BERT model was not appropriately trained on the test datasets. For future work, more investigations of the proposed approach will be considered. This would include carrying out the following tasks:
-
Concentrating on the behavior of the instances in the minority classes to better understand the main learning difficulties.
-
Applying the proposed algorithm to other sentiment classification platforms like Twitter.
-
Introducing other clustering algorithms that could enhance the sentiment classification results.
-
Training the Arabic-BERT model from scratch for better performance.
Acknowledgments
The authors would like to thank Eng. Khaled Taha, CEO & Founder of Toot for Media Solutions & Services, kt@tootvs.com for permission to use the Gulf crisis conflict and the Morocco-2016 datasets. Also, we would like to thank Toot’s experts for annotating and evaluating the Gulf crisis dataset. The work of Bassam Hammo was on sabbatical leave from 2021 to 2022 from the King Abdullah II School of Information Technology, The University of Jordan, to the Department of Software Engineering, King Hussein School of Computing Sciences, Princess Sumaya University for Technology, Amman, Jordan.
Funding
This research did not receive any specific grant from funding agencies in the public, commercial, or not-for-profit sectors.
Declaration of competing interest
The authors declare that they have no known competing financial interests or personal relationships that could have appeared to influence the work reported in this paper.


 Open access