
Abstract
To safeguard the quality of river water, a comprehensive approach is required within the European Water Framework Directive. It is vital to conduct non-target screening of the complete chemical fingerprint of the aquatic ecosystem, as this will help to identify chemicals of emerging concern and uncover their unusual dynamic patterns in river water. Achieving this goal calls for an advanced combination of two measurement paradigms: tracing the potential pollution path through the river network and detecting the numerous compounds that constitute the chemical composition, both known and unknown. To address this challenge, we propose an integrated approach that combines the preprocessing of ongoing Gas Chromatography Mass Spectrometry (GC-MS) measurements at nine sites along the Rhine using PARAllel FActor Analysis2 (PARAFAC2) for non-target screening, with spatiotemporal modelling of these sites within the river network using a statistical path modelling algorithm called Process Partial Least Squares (Process PLS). With an average explained variance of 97.0%, PARAFAC2 extracted mass spectra, elution, and concentration profiles of known and unknown chemicals. On average, 76.8% of the chemical variability captured by the PARAFAC2 concentration profiles was extracted by Process PLS. The integrated approach enabled us to track chemicals through the Rhine catchment, and tentatively identify known and as-yet unknown potential pollutants, including methyl tert-butyl ether and 1,3-cyclopentadiene, based on non-target screening and spatiotemporal behaviour.
Introduction
The EU Water Framework Directive (WFD) is a highly comprehensive European environmental legislation to shift the paradigm from monitoring on the level of individual target chemicals toward a holistic understanding of the aquatic ecosystem1,2. Current chemical monitoring takes place on the level of individual target chemicals, limiting a thorough understanding of the aquatic ecosystem3 and the chemical diversity that affects it. While targeted analysis is invaluable in environmental health and safety monitoring, untargeted screening is essential for a holistic WFD-proof approach, as it detects as-yet unidentified chemicals, including chemicals of emerging concern4, providing a complete chemical fingerprint of the aquatic ecosystem. Modern analytical platforms allow sensitive, untargeted detection of thousands of chemicals5,6. These untargeted analyses are, however, mostly used to detect and quantify priority target chemicals, and the information on molecules that are not prioritized is often left untapped7,8.
The number of continuously released anthropogenic chemicals far exceeds what is feasible to analyze9, therefore existing prioritization schemes mainly focus on specific contaminants10,11, prioritized according to exposure and risk assessment12,13. They rarely consider spatiotemporal contamination patterns. Evaluating temporal variations in concentration patterns of yet-unidentified chemicals at a single measurement station may already provide valuable insights into which chemicals are of emerging concern14. However, even higher insights may be obtained by integrating spatiotemporal variation15 among untargeted water monitoring measurements across several sampling sites.
Chemicals that enter the water system at one point could potentially be either carried through, evaporated, deposited, or broken down16,17. Multiple factors influence chemical spatiotemporal concentration patterns, including distance, river topology and flow connectivity18, further than anthropogenic and natural forces19. Water monitoring measurements in interconnected sites along the river are necessary to characterize these patterns20. Harmonizing monitoring measurements with advanced statistical modelling is essential to capture the complexity of such patterns: by incorporating the system knowledge into predictive modelling21, path modelling allows unveiling causal relationships between chemicals monitored throughout the stream, ultimately revealing their spatiotemporal dynamics in the riverine.
Path modelling assumes a process consists of interrelated steps that can be modelled through a latent structure22. Mathematical properties of untargeted water quality data, multicollinearity and multidimensionality, make Process PLS most suited23 to capture the water system complexity throughout connected sampling sites. As this paper will show, with the aid of suitable preprocessing and PARAFAC2 for automated feature extraction, Process PLS21 allows for the inclusion of spatiotemporal information among different sampling sites with predictive modelling in untargeted monitoring. This makes it possible to track pollution along the watershed, monitor suspicious patterns, and even hint toward sources of contamination.
Results and discussion
Data and analysis description
232-5738 samples were collected between 2012 and 2014 at regular intervals on eight sites located on the river Rhine, and one site on the Lippe, a tributary of the Rhine. Figure 2 specifies the sampling sites and their distances on the Rhine (\(\Delta d\)); a map showing the sampling sites location on the Rhine and the Lippe is reported in the Supplementary Information (Supplementary Fig. 1). The samples were analysed by German and Dutch water authorities with purge and trap gas chromatography-mass spectrometry (GC-MS). GC-MS is a common technique for monitoring water quality, as it detects volatiles and small organic chemicals24,25,26, that may be tentatively identified by comparing their spectra to a reference database of reference spectra27. Calibration makes it possible to quantify target chemicals28; however, true identification of a measured ion involves measuring a standard for the originating chemical on the same machine, which is unfeasible for all unknowns. Process PLS aids in prioritizing unknown chemicals to be identified by adding spatiotemporal behaviour to their risk assessment. To do so, relevant chemical features need to be extracted from GC-MS samples, after only retaining samples that are synchronized over time. Figure 1 reports a workflow indicating the relevant steps of the analysis, addressed in detail in the remainder of this section.

Workflow of the analyses presented in this paper.
Temporal synchronization
Temporal synchronization is necessary to correlate occurrences of chemicals at different sites within the same water volume. We calculated flow durations between sites based on recorded water levels and corresponding flow times. Samples rarely exactly matched the time the volume of water reaches the next site, yet point-source contaminations are broadened downstream through diffusion so that we defined a flow time-match tolerance of 1–3 hours, based on site-to-site distances. Water volumes tracked from Bad Honnef to Bimmen required matching sampling times for all in-between sites, resulting in 71 water volumes that were sampled at all sites.
Extracting chemical features from raw GC-MS data
We used the PARADISe software29, based on PARAllel FActor Analysis2 (PARAFAC2), from the methods available to extract features from raw GC-MS spectra30,31,32. PARADISe divides the GC-MS spectra into retention time windows, each decomposed by PARAFAC2 into modes of mass spectra, retention time profiles and relative concentrations of PARAFAC2 components33. Although PARAFAC2 may handle slight retention time shifts within each window, our data required additional chromatographic alignment by Correlation Optimized Warping34, after baseline correction with Alternating Least Squares35.
For each time window, we selected the number of components based on fit percentage and core consistency36: 156 components were first selected for Bad Honnef, and 206 at the other sites, with an average fit percentage of 97.0% (fit percentage = 97.0 ( ± 5.07)%), and an average core consistency of 94.3% (core consistency = 94.3 ( ± 9.16)%). A Convolutional Neural Network built into PARADISe identifies components related to chemicals from those related to analytical artefacts37: after visual inspection, we discarded the components classified as baseline, finally retaining 85 components at Bad Honnef and 109 components at the other sites. The selected PARAFAC2 components are the mathematical representation of chemicals, or mixtures of chemicals, in the measured GC-MS samples. Matching the mass spectra of the PARAFAC2 components with a reference database, such as the National Institute of Standards and Technology (NIST) database, makes it possible to tentatively identify such chemicals29. PARADISe has integrated the NIST search engine and the NIST mass spectral library, facilitating the step of tentative identification.
We extracted the relative concentrations of the selected components, which we normalized to average concentrations of internal standards to eliminate differences in overall signal intensity between samples. Note that PARAFAC2 measures relative concentrations among samples: although comparable, they should be thought of as concentration levels, rather than absolute molar chemical concentrations, and for this reason, we will refer to them as concentration profiles. An example of the PARAFAC2 decomposition of the chemical tentatively identified as methyl tert-butyl ether (MTBE) at Bimmen is provided in Supplementary Fig. 2 of the Supplementary Information. While we visually evaluated the elution profiles to assess the reliability of the PARAFAC2 decomposition, we did not incorporate them into the Process PLS modelling and tentative identification procedure. Instead, we employed the concentrations profiles and mass spectra throughout the analysis presented in this paper.
A path model of the Rhine
Process PLS extends Partial Least Squares (PLS) regression to analyse multiple multicollinear datasets that can be described as a pathway21, and is specified using an outer and inner model. The outer model assigns the extracted concentration profiles (organized as matrices \({\bf{X}}\)) as variables to their respective sampling site (‘blocks’) in the model. The inner model specifies relations between sampling sites, connecting each site to those directly downstream. Figure 2 shows a graphical representation of the Process PLS model, with outer and inner model. Water enters our model in Bad Honnef and Wesel Lippe and flows to Bimmen, which is the model end-point. We treat Lobith and Bimmen as separate proximal sites (\(\Delta d\) = 2 km), since on opposite sides of the river and thus might be separated in a laminar river flow. Furthermore, Orsoy Left connects to Bimmen as its first downstream site on the left side and might share the laminar flow.
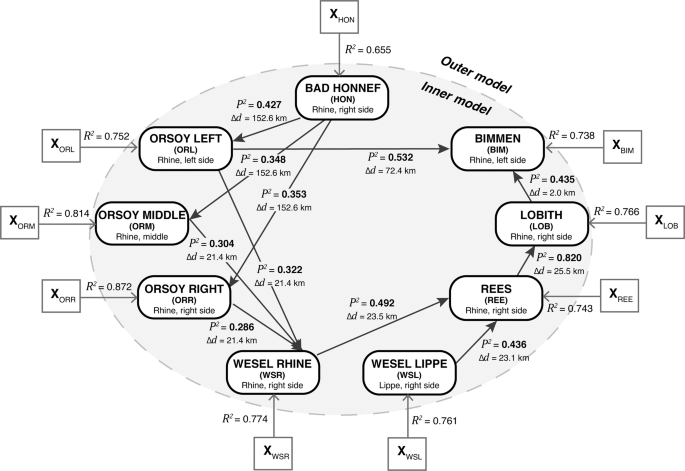
The matrices \({\bf{X}}\) in the outer model hold the concentration profiles measured with PARAFAC2 in each sampling site. In the inner model (grey shade), each block holds the Process PLS Latent Variables (LVs) for each sampling site. The arrows in the inner model connect the sites that are spatially related, separated by a distance \(\Delta d\) (estimated on the Rhine). Right and left sides refer to the location of the sites relative to the Rhine. \({R}^{2}\) and \({P}^{2}\) are the explained variances in the outer and inner model.
A Process PLS model can be most easily interpreted using two statistics: \({R}^{2}\) and \({P}^{2}\), which are obtained by two consecutive steps in the modelling procedure21. In a Process PLS model, \({R}^{2}\) (Fig. 2) indicates the amount of information extracted by the model from the measured variables at each site. This information is represented by sets of latent variables (LVs) that describe how much chemical variation in the water composition at a site is related to the chemical variation at other connected sites. As a result, high \({R}^{2}\) indicates high similarity in the water composition of one site with the composition of sites connected in the model specification. In the second step, the extracted chemical variation at a site is then predicted by the upstream sites that are connected to it. The power of such prediction is also quantified as explained variance, noted \({P}^{2}\), rho-squared (Fig. 2). High \({P}^{2}\) indicates that the modelled chemical variation at a site is highly predictable from the connected upstream sites. Through \({P}^{2}\), it is possible to reveal and differentiate potential contamination patterns.
The amount of chemical variability shared among connected sampling sites, as predictive power \({P}^{2}\) and river topology, may be investigated. Low \({P}^{2}\) (Fig. 2) indicates that chemical patterns in the predictor site are not observed at downstream sites: chemicals may have been broken down, or new chemicals may have been introduced between sites. Distances between sites are relevant in quantifying relations in their contamination: larger distances imply a higher possibility for chemicals to react, break down, or be introduced in between, hence reducing the predictive power of upstream sites. For instance, the three sampling sites in Orsoy are located downstream to Bad Honnef with a distance of ~150 km (Fig. 2): the low \({P}^{2}\) confirm that the connected sites do not share similar contamination patterns. Reasons for this dissimilarity can be that most of the river pollution occurred in between these sites, that chemicals have evaporated (note that we focus on (semi-) volatile compounds in this study), or that chemicals have reacted or broken down to form new chemicals.
The high \({P}^{2}\) between Rees and Lobith, which are on the same side of the river and at a relatively short distance (25.5 km), indicates that these sites share similar contamination patterns. Similar conclusions hold true for the three sampling sites in Orsoy and Wesel Rhine: 77.4% of the chemical variability in Wesel Rhine was extracted from the observed data, and 91.2% of this variability was observed in the three sites in Orsoy, which all lay on the same kilometer of the Rhine. The comparable \({P}^{2}\) of the three sites in Orsoy (\({P}_{{\rm{WSR}},{\rm{ORL}}}^{2}\) = 32.2%,\(\,{P}_{{\rm{WSR}},{\rm{ORM}}}^{2}\) = 30.4%,\(\,{P}_{{\rm{WSR}},{\rm{ORR}}}^{2}\) = 28.6%) suggest that they share similar contamination patterns with Wesel Rhine.
When a site is predicted by multiple sites, it is possible to differentiate sources of contamination, indicating where the pollution at the considered site was introduced. In our model, we can exploit this information to evaluate differences between the left and right sides of the river (in Bimmen), and the influence of a Rhine tributary on the monitored chemical variability on the main stream (in Rees) (Fig. 2). In Bimmen, 73.8% of all observed chemical variability in the water was included in the model (\({R}^{2}\)). More than half of this variability can be predicted from information in Orsoy Left (i.e., \({P}_{{\rm{BIM}},{\rm{ORL}}}^{2}\) = 53.2%) and about 44% can be predicted from Lobith (\({P}_{{\rm{BIM}},{\rm{LOB}}}^{2}\) = 43.5%), which is on the right side. Although the distance between Lobith and Bimmen is much shorter (2.0 km) than between Orsoy Left and Bimmen (72.4 km), Orsoy Left predicts a higher percentage of the chemical variability in Bimmen, suggesting that a few of the monitored chemicals follow pattern on the same river bank. In Rees, 74.3% of chemical variability was extracted from the observed data, and 93% of this variability was either observed in Wesel Rhine, located on the Rhine, and in Wesel Lippe, on the tributary Lippe. Wesel Rhine explains a higher percentage of this variability (\({P}_{{\rm{REE}},{\rm{WSR}}}^{2}\) = 49.2%, \({P}_{{\rm{REE}},{\rm{WSL}}}^{2}\) = 43.6%), indicating that a few of the monitored chemicals were not present in the Lippe, but only in the Rhine.
Tracking patterns of suspicious pollutants
Coupling Process PLS with PARAFAC2 allows tracking pollution patterns of yet-unidentified chemicals, to for instance prioritize unidentified chemicals of concern, which might show suspicious behaviour. Process PLS can predict concentration profiles at a site from data collected upstream. Such predictions can be validated by comparing the concentration profiles for PARAFAC2 components as predicted by Process PLS from upstream sites with the concentration profiles measured at the to-be predicted site. The Normalized Root Mean Square Error (NRMSE), as RMSE normalized by the standard deviation of the measured profiles, is employed as a scale-invariant quality metric for predictions of individual profiles at a given site. Low NRMSE values indicate a low model error, hence an accurate model prediction of individual profiles, while higher values indicate a higher model error between measured and predicted profiles. Note that quantitative comparison of Process PLS results with the measured concentration profiles requires reversion of the preprocessing steps to scale them proportionally. In this work, we were mainly interested in predicting concentration profiles from site to site, therefore we accounted for all samples in each site in our prediction.
The model predictive ability can be first evaluated by comparing measured with predicted concentration profiles for all PARAFAC2 components for each time point. We show such a comparison in Lobith and Bimmen, the model end-points on the right and left sides of the river, for a single time point (Fig. 3). The predicted profile for Bimmen (Fig. 3b) shows some mismatching peaks and a higher NRMSE (0.92) than Lobith (0.15, Fig. 3a), indicating that not all chemicals in Bimmen were accurately predicted by the model. Specifically, the PARAFAC2 components 56 and 107 presented the highest mismatch between observations and predictions (Fig. 3b); such components did not match with any of the chemicals in the NIST database and their identity remains unknown.

Process PLS predicted concentration profiles (red) of the 109 PARAFAC2 components for one time point (nr. 15), and respective PARAFAC2 measured profiles (black) in Lobith (a) and Bimmen (b), with the fractions of the Process PLS model involving the sites.
The model connections impact the model predictive ability for individual profiles: chemical concentration profiles in Lobith are predicted by Rees, which has no connections to other sites, whereas the prediction in Bimmen is based on Orsoy Left, optimized to predict also the chemical variability in Wesel Rhine (Fig. 2). Such connection implies that in Bimmen not all the individual profiles were optimally predicted, and the model prediction is less reliable in this sampling site.
Evaluating concentration profiles of target chemicals in the river connections pinpointed by \({P}^{2}\) makes it possible to validate the Process PLS results as indicative of suspicious behaviour. We show the results for cumene (benzene, (1-methylethyl)-, Fig. 4) and MTBE (methyl tert-butyl ether, Fig. 5) as a benchmark for already monitored chemicals. Cumene and MTBE were selected as benchmark because they were known to be present in the Rhine: their analysis allows us to verify that PARAFAC2 can reliably detect already monitored chemicals. Furthermore, MTBE is known to be persistent. The concentration profiles measured with PARAFAC2 for the chemical identified as MTBE should therefore repeat similarly at all sampling sites across the Rhine. This assumption was validated in our findings, supporting the value of this approach for unknown components as well.

a Cumene concentration profile measured by PARAFAC2 in Rees (orange) and Lobith (black). c Measured cumene concentration profile in Orsoy Left (green), Lobith (yellow), and Bimmen (black). b and d Measured (black) and predicted (red) cumene concentration profile in Lobith (b) and Bimmen (d). e Matching of PARAFAC2 cumene mass spectrum with NIST reference (matching probability = 54.9%).

a MTBE concentration profile measured by PARAFAC2 in Wesel Rhine (blue), Wesel Lippe (yellow) and Rees (black). b Measured (black) MTBE concentration profile in Lobith and predicted profile by Rees (red). c Matching of PARAFAC2 MTBE mass spectrum with NIST reference (matching probability = 83.0%).
Figure 4a, c display the measured concentration profiles of cumene in representative sampling sites on the right and left sides of the river. Compared to Lobith, Orsoy Left explains a higher chemical variability in Bimmen (\({P}_{{\rm{BIM}},{\rm{ORL}}}^{2}\) = 53.2%, \({P}_{{\rm{BIM}},{\rm{LOB}}}^{2}\) = 43.5%). In Lobith, a high percentage of chemical variability (\({P}_{{\rm{LOB}},{\rm{REE}}}^{2}\) = 82.0%) is explained by Rees. Here, \({P}^{2}\) suggests that a few chemicals follow pollution patterns on the same river bank. The measured concentration profiles of cumene in Bimmen is much more similar to that in Orsoy Left, on the same left side, than in Lobith (Fig. 4c), and the concentration profile in Lobith to that in Rees (Fig. 4a), on the same right side. Hence, \({P}^{2}\) captures such variability. Figure 4b, d show the predicted concentration profiles of cumene in Lobith and Bimmen respectively. Although not accurate due to some mismatching peaks, in Lobith the predicted profile has a lower NRMSE (NRMSE = 0.81) than Bimmen (NRMSE = 0.99), confirming the lower model predictive ability in Bimmen discussed above (Fig. 3). We can finally verify that the PARAFAC2 mass spectrum of cumene corresponds to its NIST reference (Fig. 4e), although the matching probability is not particularly high. Note that the prediction accuracy may be improved by imposing the non-negativity constraint on the predicted concentration profiles: the reported NRMSE value might be inflated because we did not impose this constraint in our work. Furthermore, the time between measurements was not uniform: throughout the paper, we report the concentration profiles for equally spaced time points. We provide the exact dates for each time point in Supplementary Table 1, and an example of cumene concentration profiles with the actual temporal spacing in the Supplementary Information (Supplementary Fig. 3) for completeness.
We considered MTBE as target chemical to evaluate the influence of multiple pollution sources in Rees. Figure 5a displays the concentration profiles measured with PARAFAC2 of MTBE in Wesel Rhine, Wesel Lippe and Rees. The MTBE profile in Rees overlaps with the profile measured in Wesel Rhine, with a few higher peaks indicating the occurrence of pollution events in between the sites. Wesel Rhine, compared to Wesel Lippe, explains a higher chemical variability in Rees (\({P}_{{\rm{REE}},{\rm{WSR}}}^{2}\) = 49.2%,\(\,{P}_{{\rm{REE}},{\rm{WSL}}}^{2}\) = 43.6%). These results support the notion that the majority of MTBE in Rees was introduced from Wesel Rhine, and not from Wesel Lippe. To substantiate the possibility to employ the model in Early Warning Systems for preventive protection of river water quality, we can now predict whether such contaminant continues travelling downstream to Lobith. The model’s predictive ability can be assessed with the NRMSE obtained by comparing the concentration profile of MTBE as measured by PARAFAC2 in Lobith with its concentration profile predicted by using data observed at Rees. Figure 5b shows that the model accurately predicts the concentration profile of MTBE in Lobith with NRMSE = 0.60. The matching of the PARAFAC2 mass spectrum with the NIST database confirms that the monitored chemical is MTBE (Fig. 5c). Such results confirm that, by differentiating chemical sources through descriptive statistics, Process PLS enables prioritization of sources of contamination and identification of suspicious patterns of pollution, further allowing to predict contamination downstream. It is worth noting, however, that the water discharge levels for the Rhine are higher compared to the Lippe: dilution effects should be carefully evaluated to reach definitive conclusions on the effective concentration of MTBE in the Rhine and in the Lippe. Future analyses may consider loads instead of concentrations14. Loads can be calculated by multiplying chemical concentration by the amount of water passing by the sampling site (i.e., water discharge), if the latter information is available.
Through further analysis of the GC-MS data, we were able to prioritize and tentatively annotate non-target chemicals. Figure 6a illustrates a chemical with comparable concentration profiles in Wesel Rhine and Rees, but not in Wesel Lippe. As MTBE, this chemical was introduced upstream to Wesel Rhine and not from the Lippe: this finding supports what was indicated by \({P}^{2}\). The measured values in Rees show a peak three times higher than in Wesel Rhine, suggesting a pollution event between the three sampling sites. By matching its PARAFAC2 mass spectrum with the NIST database (Fig. 6c), we tentatively identified this chemical as 1,3-cyclopentadiene, a pollutant found in environmental samples26. Although the prediction in the downstream station Lobith was not accurate (Fig. 6b, NRMSE = 0.94), our model can still be used to tentatively identify the source of pollution and provide evidence that this unknown chemical warrants further investigation.

a Untargeted chemical concentration profile measured by PARAFAC2 in Wesel Rhine (blue), Wesel Lippe (yellow) and Rees (black). b Measured (black) chemical concentration profile in Lobith and predicted profile by Rees (red). c Matching of PARAFAC2 mass spectrum of untargeted chemical with NIST reference spectrum of 1,3-cyclopentadiene (matching probability = 92.9%).
In Fig. 7a, we present the measured concentration profiles of a chemical tentatively annotated as benzene, 1,2,4,5-tetramethyl- (durene), with a 19.4% matching NIST probability (Fig. 7c). The low probability value is due to the isomers benzene, 1,2,3,5-tetramethyl- (iso-durene, 16.4% matching probability) and benzene, 1,2,3,4-tetramethyl- (prehnitene, 14.5%), which have very similar mass spectra. Durene and iso-durene are (semi-) volatile petroleum hydrocarbons (PHs)38 and potential toxic environmental pollutants. Our model shows that the concentration pattern of this chemical is comparable across the sampling sites on the Rhine, with two higher peaks in Rees indicating an emission between the sampling sites. The high peak in Wesel Lippe suggests that this chemical was also present in the Lippe, and travelled to Rees, where we observe a corresponding peak (time point 65, Fig. 7a). In Fig. 7b, we successfully predicted the concentration profile of the tentatively identified chemical in Lobith from Rees. Supplementary Fig. 4 (Supplementary Information) also reveals that the pattern is similar in the three sampling sites in Orsoy, suggesting an effective presence of this chemical in the Rhine basin. However, since we are dealing with relative concentrations and the observed patterns may be influenced by dilution effects in water, further analyses are needed to investigate whether this chemical is a human-produced pollutant in river water or simply a naturally occurring substance. If it is human-produced, this chemical should be prioritized for further investigations.

a Chemical concentration profile measured by PARAFAC2 in Wesel Rhine (blue) Wesel Lippe (yellow), and Rees (black). b Measured (black) chemical concentration profile in Lobith and predicted profile by Rees (red). c Matching of PARAFAC2 untargeted chemical mass spectrum with NIST reference spectrum of benzene, 1,2,4,5-tetramethyl- (19.4% matching probability). The low probability value is due to the isomers benzene, 1,2,3,5-tetramethyl- (16.4%) and benzene, 1,2,3,4-tetramethyl- (14.5%), which have very similar mass spectra.
Table 1 reports an overview of the chemicals that we were able to tentatively identify from Orsoy Left to Bimmen, for which we were provided with a table of already monitored chemicals. The PARAFAC2 analysis extracted some (9) chemicals as multiple components, albeit with varying matching probabilities. If these are indeed the same chemicals, this may lead to multicollinearity in the data. While Process PLS is designed to analyze multicollinear data, certain model details (e.g., variable loadings) should be interpreted carefully, but this is outside of the scope of the current paper.
Overall, we tentatively identified 16 chemicals that were not previously monitored in the Rhine. Several chemicals could not be identified, and thus still remain unknown. Figure 8a–c show the measured concentration profile, the predicted profile, and the mass spectrum of a still-unknown chemical in the Rhine and in the Lippe. This chemical shows a consistent pattern throughout the sampling sites, hence might represent a suitable candidate for prioritization.

a Measured untargeted chemical concentration profile in Wesel Rhine (blue), Wesel Lippe (yellow), and Rees (black). b Measured (black) chemical concentration profile in Lobith and predicted profile by Rees (red). c PARAFAC2 mass spectrum of unidentified untargeted chemical.
Opportunities and challenges of predictive monitoring on untargeted analysis
Process PLS combined with PARAFAC2, temporal and spectral alignment, provides a breakthrough way to analyse pollution throughout the Rhine watershed, enabling detection and prediction of concentration profiles of unidentified volatile and semi-volatile organic chemicals between monitoring sites that remain elusive from conventional analyses on single chemicals and/or measurement sites. While not perfect for all chemicals, the approach enabled us to find, explain, and predict suspicious spatiotemporal patterns of known and unknown chemicals at different measurement sites, tentatively identifying chemicals of emerging concern.
Several chemicals cannot be assessed within the current prioritization schemes due to a lack of sufficient information; gathering this information might require considerable effort12. By inspecting suspicious spatiotemporal patterns throughout multiple sites and differentiating pollution sources, our approach adds a complementary priority attribute of great environmental relevance to select (unidentified) chemicals to be investigated, to finally take effective mitigation measures.
To obtain robust results, we chose to consider only repeated measurements of the same water volume travelling downstream in all sampling sites. This represented a limiting factor in our analysis due to a lack of harmonization between sampling schedules at different monitoring sites—for which there has until now been no imminent need. Harmonizing sampling times according to river flow will greatly increase the amount of data available to monitoring approaches like ours. The strength of suspicious spatiotemporal patterns may be discovered in as-yet non-priority compounds. The possibilities to analyze disharmonious measurements in many sampling sites could also be investigated in future work.
Path modelling supports an integrated modelling approach in which different parts of the ecosystem are combined in a single model39,40,41, which further substantiates the WFD holistic approach. The Process PLS Latent Variable representation allows for fusing data from complementary sources, including other chemical platforms (such as Liquid Chromatography Mass Spectrometry (LC-MS)), meteorological conditions, and point and diffuse discharges. This will allow a wider range of chemical, metabolic and ecological patterns in the river water to be studied.
This study employed path modelling to explore correlations within a defined network of observations, focusing on detecting chemical variability in water samples. However, not all detected chemicals are relevant to monitoring freshwater pollution, as some may simply be extraction solvents used in the chromatographic column, such as ethyl acetate. Inclusion of expert knowledge and selective analysis of chemicals of interest from the tentative identification step can improve the model’s sensitivity to actual changes in concentration profiles, increasing the interpretability of results and enhancing insights into river pollution dynamics.
Ensuring sustainable clean water on a global scale is the major ambition set by the Sustainable Development Goal (SDG) 642. Early Warning Systems are nowadays required in drinking water management to predict the impact of contamination in real-time, avoiding further pollution and regularly protecting river water quality43,44. GC-MS instruments can measure water chemistry in near real-time45, and path modelling can investigate and predict its variations among several, interconnected, sampling sites. Further extending this integrated approach by including online measurements will support the model implementation as an automated on-line sensor in river monitoring to detect sudden changes in river water quality downstream, upholding the SDG 6.
We proposed path modelling with Process PLS as a breakthrough method to combine untargeted water quality data with spatiotemporal information for chemical prioritization in river water quality analysis. We were able to differentiate pollution sources and confirm the suspicious behaviour of known pollutants, giving insights into other chemicals with similarly suspicious behaviour, including those chemicals that were yet unidentified, such as cyclopentadiene and isomers of tetramethyl benzene, and others that remain unknown. Due to its intrinsic predictive ability, path modelling offers the opportunity to develop evidence-based early warnings for downstream pollution events in comprehensive watershed management.
Methods
Dataset
Water samples were collected at eight sampling sites along the river Rhine and at one site on the river Lippe, which is a tributary of the Rhine. Table 2 reports the number of samples collected for each site, together with the river kilometer. Purge and trap gas chromatography-mass spectrometry (GC-MS) measurements of such samples were performed by German and Dutch authorities: the water samples were spiked with a mixture of deuterated internal standards (deuterochloroform, toluene, chlorobenzene, 1,4-dichlorobenzene, and naphthalene) to a final concentration of 0.1 μg/L. Samples for Bad Honnef were measured in the monitoring station of Bad Honnef, while samples from the remaining eight sampling sites were measured at the international measuring station Bimmen-Lobith (IMBL). A Bruker Varian Saturn ion trap instrument (in single MS mode) was employed to obtain GC-MS spectra. Volatile compounds were extracted from the sample matrix by purging with an inert gas. Chemicals were separated based on chemical and physical properties through polar and apolar interaction with the stationary phase of the GC column. For further identification, fractions of the GC column were injected into the mass spectrometer, and separated according to the m/z ratio. The mass scans were acquired with 0.1 m/z resolution.
Preprocessing: temporal synchronization and chromatographic alignment
Temporal synchronization
Temporal synchronization is necessary to correctly correlate chemicals monitored at multiple sampling sites over time, by tracking the same column of water in each site. We estimated the time the river water flows from one site to another according to a table of recorded water levels (cm) and flow time values (h), provided by the German Federal Institute of Hydrology through personal correspondence46. Flow time values were not available for all the water samples, thus we fitted a third-degree polynomial to the available flow times and water levels in each corresponding river section and we used the obtained fitting coefficients, together with the available water levels, to estimate the flow times for all the samples. We estimated the time at which the water travelled throughout connected sampling sites according to Eq. (1), finally retaining only the matching samples.
where \({t}_{{\rm{A}}}\) is the time the water sample was collected at site A, \({t}_{{\rm{B}}}\) the corresponding time at the connected site B and \({t}_{{\rm{f}}}\) is the flow time value resulting from the previous extrapolation, which accounts for an additional tolerance time of 1–3 h, estimated according to the distance between the sampling sites, and reported in Table 2. We repeated this operation consecutively from Bad Honnef (site 1) to Bimmen (site 9), retaining any time the matching samples. In total, we selected 71 water samples synchronized among all the sampling sites (Supplementary Table 1). We employed such samples in the next analysis step, which consisted in extracting relevant chemical features from the GC-MS spectra, after spectral preprocessing.
Chromatographic alignment
GC-MS data are often affected by spectral artefacts that hinder proper feature extraction, such as background noise, overlapping and shifting peaks, which might derive from experimental conditions, variations in the chromatogram or the mass detector47. Although PARAFAC2 may handle such artefacts to a certain extent33, our data required three preliminary spectral preprocessing steps.
We aligned the GC-MS spectra according to the Total Ion Current (TIC). To compensate for different time-scales of TIC in retention times, the first step required aligning the TIC values to an equally spaced vector \({{\bf{v}}}_{{\rm{ref}}}\) of \(r\) retention times, defined as (Eq. (2)):
where \({{\max}}({rt})\) is the maximum retention time value assessed among the samples. For each sample, we assigned each retention time to its closest value in the reference vector. Due to the higher resolution of the spectra measured in Bad Honnef compared to the other measurements, we defined a reference vector of 7000 time points for Bad Honnef, and a vector of 4300 time points for the remaining eight sampling sites. Due to this difference, we analyzed the chromatograms in Bad Honnef separately from the ones collected in the remaining sampling sites. The second and third preprocessing steps consisted of baseline correction through Alternating Least Squares35, followed by Correlation Optimized Warping (COW)34 to correct for peak shifting.
PARAFAC2 to extract relevant chemical features
We employed the software PARADISe29, based on PARAllel FActor Analysis2 (PARAFAC2), to extract pure mass spectra, elution profiles and concentration profiles from the GC-MS spectra. PARAFAC2 allows to deconvolute pure mass spectra of peaks and to integrate areas of deconvoluted peaks (extracting relative concentrations) for all samples simultaneously while handling co-eluted, retention time shifted and low signal-to-noise ratio chromatographic peaks48,49.
For each sample \(k\), PARAFAC2 decomposes the GC-MS matrix \({{\bf{T}}}_{k}\) (\({I}\) x \(J\)), with \({I}\) mass spectra and \(J\) retention times in three matrices (Eq. (3)), each corresponding to ‘modes’ of the GC-MS spectra when several measurements from a set of samples are stacked together33.
Where \({\bf{A}}\) (\(I\) x \(F\)) is the matrix of the mass spectra-mode of the resolved analytes \(F\), which are the PARAFAC2 components. \({{\bf{D}}}_{k}\) (\(F\) x \(F\)) is the diagonal matrix that holds the \({k}^{{\rm{th}}}\) row of the sample-mode loading matrix \({\bf{C}}\), which holds the chemical relative concentration profiles. \({{\bf{B}}}_{k}\) (\({I}\) x \(F\)) is the matrix of the elution profiles-mode for each component \(F\), and the matrix \({{\bf{E}}}_{k}\) holds the model residuals33.
PARADISe divides the chromatogram into retention time windows, and builds a PARAFAC2 model for each investigated region, after defining the number of PARAFAC2 components for each model. We manually selected the retention time intervals, and we imposed the non-negativity constraint on all the models, which implies positive mass-loadings. We constructed the models from 1 to 7 components as software-default, and for each model we selected the number of optimal components according to the criteria of core consistency and fit percentage36.
Due to the difference in resolution, we processed the spectra measured in Bad Honnef separately from the other sampling sites in PARADISe. This led to select a total of 185 PARAFAC2 components for Bad Honnef and 206 for the remaining sampling sites. Once the models are determined, a Convolutional Neural Network built into the software classifies the components as baseline or (mixture of) chemicals37. We excluded the components classified as baseline to only select components corresponding to chemicals29. After such selection, we finally obtained 85 components for Bad Honnef and 109 for the remaining sampling sites. The resolved peaks of such components could be then tentatively identified using their deconvoluted mass spectra and the NIST reference database.
We extracted relative concentration profiles for each component in each sampling site, obtaining nine different concentration matrices, of dimension (71 × 85) for Bad Honnef, and (71 ×109) for the eight remaining sampling sites. Before Process PLS, we standardized such profiles to average concentrations of internal standards (deuterochloroform, toluene-d8, chlorobenzene-d5, dichlorobenzene-d4, naphthalene-d8) to eliminate differences in overall signal intensity between samples, a standard practice in analyzing GC-MS data.
Process PLS to track pollution patterns
Process PLS is a path modelling tool that makes it possible to find relationships between multivariate data matrices connected throughout a structure. The workhorse of Process PLS is the Partial Least Squares method (SIMPLS algorithm50), which is performed in two rounds to find the relationships between the measured data matrices. A Process PLS model consists of two sub-models: the outer and inner models. In the outer model, the relationships between the measured variables and the Latent Variables estimated by PLS are explored, while the inner model is used to analyze the relationships between the blocks of the estimated Latent Variables21. A brief description of the method is here provided, supported with a schematic flowchart (Fig. 9); we refer to the reference article21 for further details.

The main steps involved in the Process PLS modelling are displayed, integrated with a visual example for three blocks. \({{\bf{X}}}_{1},\,{{\bf{X}}}_{2},\,{{\bf{X}}}_{3},\) are the matrices holding the measured variables for blocks 1, 2, and 3; \({\hat{{\boldsymbol{\xi }}}}_{1}\), \({\hat{{\boldsymbol{\xi }}}}_{2}\), \({\hat{{\boldsymbol{\xi }}}}_{3}\) are the matrices holding the sets of Latent Variables estimated for each block in the first PLS regression model, \({R}^{2}\) and \({P}^{2}\) represent the explained variance in the outer and inner model, respectively.
The first step in Process PLS consists in specifying the model: the outer model is specified by assigning the measured variables to the corresponding blocks in the model. The inner model is then specified, by connecting the blocks according to defined relationships21. We specified the outer model by assigning the concentration profiles extracted by PARAFAC2 to the sampling sites (our model ‘blocks’), and we specified the inner model by connecting the sampling sites according to the river topology. After specifying the model, the outer and inner model are computed, and the defined relationships can be interpreted through two statistics: the explained variances \({R}^{2}\) and \({P}^{2}\).
Outer model
In the outer model, the first round of PLS is performed: the variables measured in each block predict the variables of the blocks connected through the inner model, obtaining a set of Latent Variables \({\hat{{\boldsymbol{\xi }}}}_{m}\) for each block \(m\). The number of estimated Latent Variables varies per block, and is computed by double cross-validation. The amount of significant information extracted by the Latent Variables is quantified, for each block \(m\), by the explained variance \({R}^{2}\), estimated as (Eq. (4)):
for all the blocks that predict other blocks (all the sites except Bimmen in our model), and as (Eq. (5)):
for the block that only functions as a target (Bimmen in our model). In Eqs. (4) and (5), \({{\bf{L}}}_{m}\) is the \({\bf{X}}\)-loadings matrix for block \(m\), \(N\) is the number of observations, and \({{\bf{Q}}}_{m}\) is the \({\bf{Y}}\)-loadings matrix for block \(m\)21. \({\bf{X}}\) is the matrix of predictor variables, while \({\bf{Y}}\) is the matrix or variables that are being predicted.
Inner model
After each set of Latent Variables \({\hat{{\boldsymbol{\xi }}}}_{m}\) per block \(m\) is estimated, the second round of PLS is performed, where each block \(m\) is predicted by the \(n\) blocks that are connected to it in the inner model. The explained variance of such prediction is calculated by subtracting the sum of squared errors between the estimated LVs \({\hat{{\boldsymbol{\xi }}}}_{m}\) and the PLS prediction \({{\boldsymbol{\chi }}}_{m}{{\bf{B}}}_{m}\) from the total sum of squares of \({\hat{{\boldsymbol{\xi }}}}_{m}\)21 (Eq. (6)).
Where \({SS}\) indicates the sum of squares, \({{\boldsymbol{\chi }}}_{m}\) is the regression matrix, which combines the Latent Variables of the \(n\) predictor blocks, according to the connections defined in the inner model21 (Eq. (7)):
And \({{\bf{B}}}_{m}\) is the matrix of the PLS regression coefficients (Eq. (8)):
Since the variance obtained in Eq. (6) is not specific for single connections between blocks, the partial explained variance for each specific predictor block \(z\) is finally computed as (Eq. (9)):
which is indicated as \({P}^{2}\) (‘rho-squared’) in the connections in Fig. 2.
After the outer and inner model are computed, individual concentration profiles can be predicted from the \({\bf{X}}\)- and \({\bf{Y}}\)- loadings and scores PLS matrices, accounting for the steps of autoscaling, mean centering and block scaling performed by the Process PLS algorithm.
Software
Python 3.9.7 (package: processPLS51) was employed to train the Process PLS model and for Latent Variables estimation. Matlab R2020b was employed for temporal and spectral preprocessing of raw GC-MS data, and for processing the output of Process PLS, including chemical profiles prediction. The software PARADISe (version 3.9) was employed to perform the PARAFAC2 analysis of GC-MS data. PARADISe integrates MS Search (version 2.3.), the NIST Mass Spectra Search Program which was employed for the tentative identification of chemicals.
Data availability
The datasets generated and analysed during the current study are available in the Mendeley Data repository, https://data.mendeley.com/datasets/jcdxmvj76k (https://doi.org/10.17632/jcdxmvj76k.5).
Code availability
The codes generated and employed during the current study are available in the Mendeley Data repository, https://data.mendeley.com/datasets/jcdxmvj76k (https://doi.org/10.17632/jcdxmvj76k.5).
References
Collins, A., Ohandja, D. G., Hoare, D. & Voulvoulis, N. Implementing the water framework directive: a transition from established monitoring networks in England and Wales. Environ. Sci. Policy 17, 49–61 (2012).
Voulvoulis, N., Arpon, K. D. & Giakoumis, T. The EU Water Framework Directive: from great expectations to problems with implementation. Sci. Total Environ. 575, 358–366 (2017).
Altenburger, R. et al. Future water quality monitoring—adapting tools to deal with mixtures of pollutants in water resource management. Sci. Total Environ. 512, 540–551 (2015).
Reichenbach, S. E., Tian, X., Cordero, C. & Tao, Q. Features for non-targeted cross-sample analysis with comprehensive two-dimensional chromatography. J. Chromatogr. A 1226, 140–148 (2012).
Schmidt, T. C. Recent trends in water analysis triggering future monitoring of organic micropollutants. Anal. Bioanal. Chem. 410, 3933–3941 (2018).
Hollender, J., Schymanski, E. L., Singer, H. P. & Ferguson, P. L. Nontarget screening with high resolution mass spectrometry in the environment: ready to go? Environ. Sci. Technol. 51, 11505–11512 (2017).
Hollender, J. et al. High resolution mass spectrometry-based non-target screening can support regulatory environmental monitoring and chemicals management. Environ. Sci. Eur. 31, 1–11 (2019).
Schwarzbauer, J. & Ricking, M. Non-target screening analysis of river water as compound-related base for monitoring measures. Environ. Sci. Pollut. Res. 17, 934–947 (2010).
González-Gaya, B. et al. Suspect and non-target screening: The last frontier in environmental analysis. Anal. Methods 13, 1876–1904 (2021).
Brack, W. The challenge: Prioritization of emerging pollutants. Environ. Toxicol. Chem. / SETAC 34, 2181 (2015).
Thomsen, M. QSARs in Environmental Risk Assessment: Interpretation and Validation of SAR/QSAR Based on Multivariate Data Analysis (National Environmental Research Institute, Department of Environmental Chemistry, 2015).
von der Ohe, P. C. et al. A new risk assessment approach for the prioritization of 500 classical and emerging organic microcontaminants as potential river basin specific pollutants under the European Water Framework Directive. Sci. Total Environ. 409, 2064–2077 (2011).
Finckh, S. et al. A risk based assessment approach for chemical mixtures from wastewater treatment plant effluents. Environ. Int. 164, 107234 (2022).
Ying, Y. et al. Evaluating anthropogenic origin of unidentified volatile chemicals in the river Rhine. Water Air Soil Pollut. 233, 1–14 (2022).
Fairbairn, D. J. et al. Sources and transport of contaminants of emerging concern: a two-year study of occurrence and spatiotemporal variation in a mixed land use watershed. Sci. Total Environ. 551, 605–613 (2016).
Schweitzer, L. & Noblet, J. Water contamination and pollution. in Green Chemistry 261–290 (Elsevier, 2018).
Sijm, D. T. H. M. et al. Transport, accumulation and transformation processes. Risk Assessment Chem. https://doi.org/10.1007/978-94-015-8520-0_3 (2007).
Santos-Fernandez, E. et al. Bayesian spatio-temporal models for stream networks. Comput Stat. Data Anal. 170, 107446 (2022).
Fernandes, A., Ferreira, A., Fernandes, L. S., Cortes, R. & Pacheco, F. Path modelling analysis of pollution sources and environmental consequences in river basins. WIT Trans. Ecol. Environ. 228, 79–87 (2018).
Lee, C., Paik, K., Yoo, D. G. & Kim, J. H. Efficient method for optimal placing of water quality monitoring stations for an ungauged basin. J. Environ. Manag. 132, 24–31 (2014).
van Kollenburg, G. et al. Process PLS: Incorporating substantive knowledge into the predictive modelling of multiblock, multistep, multidimensional and multicollinear process data. Comput Chem. Eng. 154, 107466 (2021).
Tenenhaus, M., Vinzi, V. E., Chatelin, Y. M. & Lauro, C. PLS path modeling. Comput Stat. Data Anal. 48, 159–205 (2005).
Offermans, T. et al. Improved understanding of industrial process relationships through conditional path modelling with process PLS. Front. Anal. Sci. 1, 1–10 (2021).
Hao, C., Zhao, X. & Yang, P. GC-MS and HPLC-MS analysis of bioactive pharmaceuticals and personal-care products in environmental matrices. TrAC Trends Anal. Chem. 26, 569–580 (2007).
Loos, R. et al. Analysis of emerging organic contaminants in water, fish and suspended particulate matter (SPM) in the Joint Danube Survey using solid-phase extraction followed by UHPLC-MS-MS and GC–MS analysis. Sci. Total Environ. 607–608, 1201–1212 (2017).
Peñalver, R. et al. Non-targeted analysis by DLLME-GC-MS for the monitoring of pollutants in the Mar Menor lagoon. Chemosphere 286, 131588 (2022).
Gorrochategui, E., Jaumot, J., Lacorte, S. & Tauler, R. Data analysis strategies for targeted and untargeted LC-MS metabolomic studies: overview and workflow. TrAC Trends Anal. Chem. 82, 425–442 (2016).
Müller, A., Düchting, P. & Weiler, E. W. A multiplex GC-MS/MS technique for the sensitive and quantitative single-run analysis of acidic phytohormones and related compounds, and its application to Arabidopsis thaliana. Planta 216, 44–56 (2002).
Johnsen, L. G., Skou, P. B., Khakimov, B. & Bro, R. Gas chromatography—mass spectrometry data processing made easy. J. Chromatogr. A 1503, 57–64 (2017).
Meyer, M. R., Peters, F. T. & Maurer, H. H. Automated mass spectral deconvolution and identification system for GC-MS screening for drugs, poisons, and metabolites in urine. Clin. Chem. 56, 575–584 (2010).
Spicer, R., Salek, R. M., Moreno, P., Cañueto, D. & Steinbeck, C. Navigating freely-available software tools for metabolomics analysis. Metabolomics 13, 1–16 (2017).
Smith, C. A., Want, E. J., O’Maille, G., Abagyan, R. & Siuzdak, G. XCMS: Processing mass spectrometry data for metabolite profiling using nonlinear peak alignment, matching, and identification. Anal. Chem. 78, 779–787 (2006).
Amigo, J. M., Skov, T., Bro, R., Coello, J. & Maspoch, S. Solving GC-MS problems with PARAFAC2. TrAC Trends Anal. Chem. 27, 714–725 (2008).
Tomasi, G., Van Den Berg, F. & Andersson, C. Correlation optimized warping and dynamic time warping as preprocessing methods for chromatographic data. J. Chemom. 18, 231–241 (2004).
Eilers, P. H. C. & Boelens, H. F. M. Baseline correction with asymmetric least squares smoothing. Leiden. Univ. Med. Cent. Rep. 1, 5 (2005).
Bro, R. & Kiers, H. A. L. A new efficient method for determining the number of components in PARAFAC models. J. Chemom. 17, 274–286 (2003).
Risum, A. B. & Bro, R. Using deep learning to evaluate peaks in chromatographic data. Talanta 204, 255–260 (2019).
Sjøholm, K. K. et al. Linking biodegradation kinetics, microbial composition and test temperature-Testing 40 petroleum hydrocarbons using inocula collected in winter and summer. Environ. Sci. Process Impacts 24, 152–160 (2022).
Le Page, M., Fakir, Y. & Aouissi, J. In Water Resources in the Mediterranean Region 157–190 (Elsevier, 2020).
Bouraoui, F. & Grizzetti, B. An integrated modelling framework to estimate the fate of nutrients: Application to the Loire (France). Ecol. Model. 212, 450–459 (2008).
Welsh, W. D. et al. An integrated modelling framework for regulated river systems. Environ. Model. Softw. 39, 81–102 (2013).
Herrera, V. Reconciling global aspirations and local realities: challenges facing the Sustainable Development Goals for water and sanitation. World Dev. 118, 106–117 (2019).
Che, H. & Liu, S. Contaminant detection using multiple conventional water quality sensors in an early warning system. Procedia Eng. 89, 479–487 (2014).
Hou, D., Ge, X., Huang, P., Zhang, G. & Loáiciga, H. A real-time, dynamic early-warning model based on uncertainty analysis and risk assessment for sudden water pollution accidents. Environ. Sci. Pollut. Res. 21, 8878–8892 (2014).
Storey, M. V., van der Gaag, B. & Burns, B. P. Advances in on-line drinking water quality monitoring and early warning systems. Water Res. 45, 741–747 (2011).
Data source. ‘German Federal Waterways and Shipping Administration (WSV)’. https://bmdv.bund.de/SharedDocs/EN/Articles/WS/federal-waterways-and-shipping-administration.html (2023).
García, I., Sarabia, L., Cruz Ortiz, M. & Manuel Aldama, J. Building robust calibration models for the analysis of estrogens by gas chromatography with mass spectrometry detection. Anal. Chim. Acta 526, 139–146 (2004).
Skov, T. & Bro, R. Solving fundamental problems in chromatographic analysis. Anal. Bioanal. Chem. 390, 281–285 (2008).
Murphy, K. R., Wenig, P., Parcsi, G., Skov, T. & Stuetz, R. M. Characterizing odorous emissions using new software for identifying peaks in chemometric models of gas chromatography-mass spectrometry datasets. Chemometr. Intell. Lab. Syst. 118, 41–50 (2012).
de Jong, S. SIMPLS: an alternative approach to partial least squares regression. Chemometr. Intell. Lab. Syst. 18, 251–263 (1993).
Teng, S. Y. tsyet12/ProcessPLS: An implementation of ProcessPLS in Python, Zenodo release. Zenodo. https://doi.org/10.5281/zenodo.7074754 (2022).
Acknowledgements
This project is co-funded by TKI-E&I with the supplementary grant ‘TKI-Toeslag’ for Topconsortia for Knowledge and Innovation (TKI’s) of the Ministry of Economic Affairs and Climate Policy. The authors thank all partners within the project ‘Measurement for Management (M4M)’ (https://ispt.eu/projects/m4m/), managed by the Institute for Sustainable Process Technology (ISPT) in Amersfoort, the Netherlands. Part of this work was supported by NWO-TA-COAST (grant 053.21.114). Part of this work was supported by the ECSEL Joint Undertaking (JU) under grant agreement No 826589.
Author information
Authors and Affiliations
Contributions
M.C.: Validation, Formal analysis, Investigation, Data curation, Writing—original draft, Visualization. A.v.d.D.: Conceptualization, Methodology, Validation, Investigation, Writing—original draft, Supervision, Visualization. B.P.: Methodology, Validation, Formal analysis, Investigation, Data curation. T.O.: Formal analysis, Investigation, Data curation, Writing—review and editing. H.Z.: Resources, Project administration, Funding acquisition. G.S.: Supervision, Resources, Project administration, Funding acquisition. L.B.: Supervision, Project administration, Funding acquisition. G.v.K.: Conceptualization, Methodology, Software, Validation, Writing—review and editing, Visualization, Supervision. J.J.: Methodology, Writing—review and editing, Supervision, Project administration, Funding acquisition. M.C. and A.v.d.D. equally contributed as first co-authors to this work.
Corresponding author
Ethics declarations
Competing interests
The authors declare no competing interests.
Additional information
Publisher’s note Springer Nature remains neutral with regard to jurisdictional claims in published maps and institutional affiliations.
Supplementary information
Rights and permissions
Open Access This article is licensed under a Creative Commons Attribution 4.0 International License, which permits use, sharing, adaptation, distribution and reproduction in any medium or format, as long as you give appropriate credit to the original author(s) and the source, provide a link to the Creative Commons license, and indicate if changes were made. The images or other third party material in this article are included in the article’s Creative Commons license, unless indicated otherwise in a credit line to the material. If material is not included in the article’s Creative Commons license and your intended use is not permitted by statutory regulation or exceeds the permitted use, you will need to obtain permission directly from the copyright holder. To view a copy of this license, visit http://creativecommons.org/licenses/by/4.0/.
About this article

Cite this article
Cairoli, M., van den Doel, A., Postma, B. et al. Monitoring pollution pathways in river water by predictive path modelling using untargeted GC-MS measurements. npj Clean Water 6, 48 (2023). https://doi.org/10.1038/s41545-023-00257-7
Received:
Accepted:
Published:
DOI: https://doi.org/10.1038/s41545-023-00257-7
This article is cited by
-
Non-target screening in water analysis: recent trends of data evaluation, quality assurance, and their future perspectives
Analytical and Bioanalytical Chemistry (2024)
