


A key ingredient of the industrialization process is the accumulation of scientific and technological capabilities (Mokyr Reference Mokyr1990). This typically leads to the emergence of a “technology gap” between the leading country and its followers, ultimately shaping the patterns of economic growth (Gerschenkron Reference Gerschenkron1962; Abramovitz Reference Abramovitz1986). Abramovitz (Reference Abramovitz1986) suggested that successful catching up is the combination of three factors: (i) the technology flows from the leading economy (“interaction between followers and leaders”); (ii) the “social capabilities” of the receiving economy; and (iii) the “congruity” between the technology of the leader and the resource endowment of the follower.
These insights represent a useful framework to study how the rest of Europe caught up with Britain in terms of industrialization. In fact, the early phases of French industrialization are extremely interesting, with French science being prominent internationally during the eighteenth and nineteenth centuries. This prominence underscores the significant influence of French scientific advancements on technological developments during that period (Fox Reference Fox2012). Belhoste (Reference Belhoste2011) provides a compelling account of the rise and consolidation of Paris as a “European capital of science” throughout the eighteenth century. However, success in terms of scientific discoveries and inventions does not automatically translate into the adoption and diffusion of innovations. Mokyr (Reference Mokyr1990) notes that England’s technological leadership in this period was not so much in science, but rather in effectively combining scientific knowledge and engineering capabilities.Footnote 1
Whether French scientific achievements played a significant role in the assimilation and adaptation of British technologies is thus an interesting question. In fact, there is a general consensus that the technological transfer from Britain represented a critical source of innovation during the early phases of French industrialization.Footnote 2 Crouzet (Reference Crouzet2003) describes the French industrial revolution as a “foreign transplant” that rapidly becomes “naturalized.” For instance, Henderson (Reference Henderson1972) and Crouzet (Reference Crouzet, Teich and Porter1996) studied several revealing instances of the successful importation of technology from Britain to France.Footnote 3
Crucial innovations of the Industrial Revolution, such as textile, steam power, and iron-making techniques, were transferred from Britain to France using patent protection. In most cases, technology transfer occurred as a result of British citizens relocating to France and establishing companies and production facilities there.Footnote 4 In other cases, French entrepreneurs acquired technological experience from England in various ways and adapted it to the French context.Footnote 5
The main goal of this paper is to provide a quantitative assessment of the patterns of technology transfer from Britain to France adopting the framework introduced by Abramovitz, explicitly considering the role of social capabilities and the “congruity” of the French economy. To this aim, we measure inventive activities using patent data.Footnote 6
Our dataset of French historical patents represents a unique opportunity to provide a detailed account of the technology transfer from Britain to France by identifying all the British patents granted in France, evaluating their quality, and looking at how involvement with British inventors impacted the quality of French patents themselves.
Our results show that, in this key historical phase, technology transfer from Britain represented a key source of technical progress for France. In a broader perspective, our results also highlight how French inventors and entrepreneurs successfully adapted British technology to the French context.
This paper also contributes to the debate on the performance of French industrialization, which can be broadly characterized in terms of two opposing views.Footnote 7 On the one hand, the “pessimist” perspective of Khan (Reference Khan2020), who, following the traditional account by Landes (Reference Landes1949, Reference Landes1969), suggests that the French innovation system was excessively dominated by the role of the State with detrimental effects on inventive activities. In contrast, the more “optimist” interpretation of French industrialization by O’Brien and Keyder (Reference O’Brien and Keyder1978, p. 21) highlights how particular the French path to industrialization was since “it took place in a different legal, political and cultural tradition.”Footnote 8 Indeed, when these contextual specificities are fully taken into account, the French economic performance compares quite well with that of Britain (Crafts Reference Crafts1984).Footnote 9 Our findings suggest that, at least from this technological standpoint, pessimistic accounts of French industrial retardation seem wide off the mark.
THE FRENCH PATENT SYSTEM
During the Ancien Regime, France encouraged both inventive activities and the transfer of technologies from abroad through a rather complicated system of “exclusive privileges.” Requests for privileges had to endure a taxing examination process led by the Bureau du Commerce in collaboration with other institutions such as the Académie des Sciences or artisans from specific guilds (Hilaire-Perez Reference Hilaire-Perez2000; Baudry Reference Baudry2020). The function of this examination process, which led to its approval by the Parlement, was to ascertain the genuine utility of each invention from the point of view of the French state. This institutional configuration made the granting of privileges uncertain and highly discretionary.
The aim of the 1791 patent law was to introduce a radically new approach.Footnote 10 The philosophical underpinning was the “natural right” of inventors to enjoy the fruits of their ingenuity. Accordingly, the first objective was to create a system not subject to the discretionary power of the state. In this respect, the inspiration was the English system, where, since the early eighteenth century, patents were liberally granted without examination (Bottomley Reference Bottomley2014).Footnote 11
The law contemplated three main types of patents: (i) patents for invention (brevets d’invention), covering “every new discovery or invention” (art. 1, Law 7th January); (ii) patents for improvement (perfectionnement), covering improvements of existing technologies (art. 2, Law 7th January); and (iii) patents of importation (brevets d’importation), covering the first introduction in France of foreign discoveries (art. 3, Law 7th January). Footnote 12 The law established that patents had a duration of 5, 10, or 15 years (art. 8, Law 7th January), according to the fee paid by the inventor upfront. The fee structure (which was the same for all types of patents) was the following: 300, 800, and 1,500 francs for patents with a 5, 10, and 15-year duration, respectively (titre 3, n. IV, Law 25th May).Footnote 13 The granting of each patent also involved the payment of an additional administrative fee amounting to 50 francs. Upon request, the law offered the possibility of paying the fee in two installments: about half of the amount when the patent was granted and the second half after six months (Perpigna Reference Perpigna1832, p. 57). It was also possible to introduce improvements (certificats d’addition) to an already existing patent by paying a fee amounting to 24 francs (titre 3, n. IV, Law 25th May). The patenting of these “improvements” did not alter the expiration date of the original patent. Finally, the law gave the possibility to extend an already existing patent by paying a costly fee equal to 600 francs plus 12 francs for the registration (titre 3, n. IV, Law 25th May). Despite being technically possible, these extensions were only granted in very special cases and had to undergo a very demanding examination by the government.Footnote 14 The 1791 laws defined the legal framework pertaining to patenting activity in France until they were replaced by a law passed on 5 July 1844; in fact, only minor changes were made in the period 1791–1844. Of these changes, it is worth noting that, in 1806, the prohibition for joint stock companies to register a patent was removed (Empotz and Marchal Reference Empotz and Marchal2002, pp. 202–203; Baudry Reference Baudry2019).
The level and structure of patent fees were key parameters regulating the accessibility of a patent system. According to Khan (Reference Khan2005, pp. 43–44), the relatively high level of French patent fees severely limited access to patent protection for ordinary inventors. As a result, she argues that, even if the system was rhetorically founded on the notion of the “natural right” of the inventors, in practice it granted the opportunity to patent inventions only to a restricted number of individuals. The assessment of the French patent system by Baudry (Reference Baudry2020) is more nuanced. In the absence of a stringent examination, the level of patent fees aimed to discourage inventors from patenting trivial inventions, making the entire system self-regulatory without further governmental or administrative interventions: “In the 1791 law, the patent tax worked as an apparatus designed to incentivize the inventor into becoming a good calculator of his own interest, which was subsequently turned into the general public interest, into the common good” (Baudry Reference Baudry2020, p. 16).Footnote 15
Figure 1 compares French patent fees with those prevailing in England and the United States according to different measures in the period 1825–30. It examines the costs for the maximum possible patent duration within each system, that is, 15 years in France and 14 years in both England and the United States. The histograms on the left-hand side provide a comparison by means of a simple conversion of the fees of each country in U.S. dollars, while those in the middle and on the right-hand side express fees in terms of the prevailing daily wages of skilled workers (respectively a mechanic and a mason). Two points deserve attention: first, the extremely low level of U.S. patent fees corroborates the idea that the U.S. patent system was widely accessible and “democratic” (Khan Reference Khan2005). Second, French fees are significantly lower than the English ones—almost half when considering dollar conversions and between 30 and 45 percent according to wage-related computations. Thus, although Khan (Reference Khan2020, p. 164) considers both the English and French systems as biased against inventors with limited financial resources, this evidence suggests that the 1791 French law, despite having been inspired by English practice, introduced a significantly lower bar for accessing patent protection.
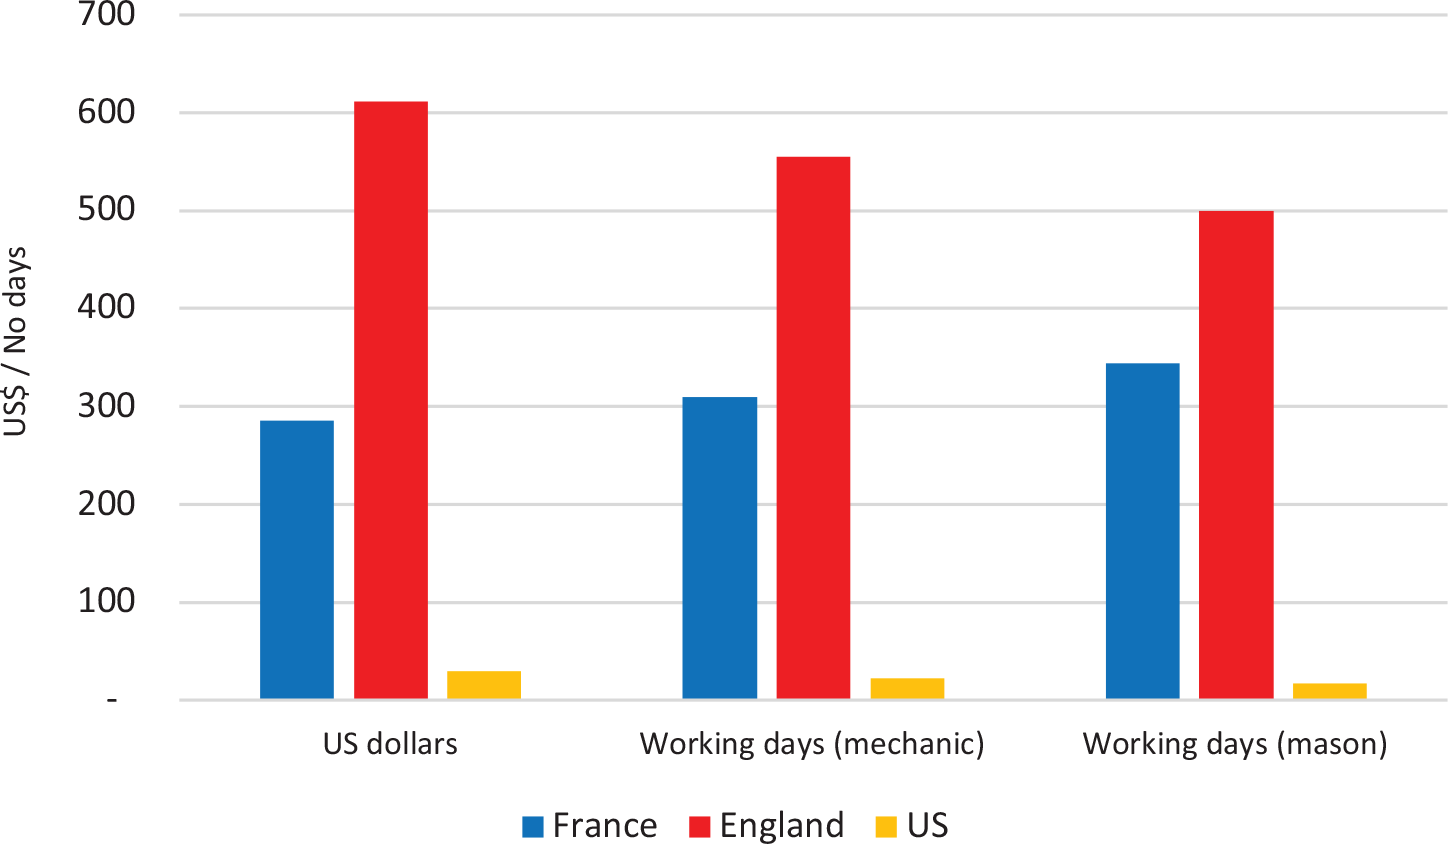
Figure 1 COST OF PATENTING BY COUNTRY, CIRCA 1825–30
Notes: The figure reports the cost—in U.S. dollars and in working days—for a patent granted for 15 years in France and for 14 years in England and the United States.
Sources: The cost for a patent in England and the United States is from Khan (Reference Khan2005), while for France it is based on the 25 May 1791 patent law. The conversion rate in dollars is based on Rosenberg (Reference Rosenberg1967). The wages of a mechanic are from Rosenberg (Reference Rosenberg1967). The wage of masons in England (London) and in France (Paris) are from Allen (https://www.nuffield.ox.ac.uk/people/sites/allen-research-pages/), while for the United States (Philadelphia) are from Adams (Reference Adams1968).
The law also provided for the withdrawal of granted patents (art. 16, Law 7th January). The most obvious case pertained to patents that were not actually new but were deemed so by a court trial. Similarly, patents could be revoked if their specifications were found to be obscure or incomplete in court judgments. Should a patentee fail to pay the second installment of the initial fee, a patent would also be revoked. Finally, the law contemplated a working clause of two yearsFootnote 16 : if the patentee had not put the invention into practice within this term, the patent could be annulled. Importantly, the failure to put the invention into practice also had to be established formally in court (Perpigna Reference Perpigna1832, pp. 62–81).Footnote 17
PATENTING ACTIVITY IN FRANCE
Since the seminal contribution by Schmookler (Reference Schmookler1966),Footnote 18 patents have become one of the preferred sources used to investigate inventive activities.Footnote 19 However, patent data have two well-known limitations: (i) not all inventions are patented, and (ii) patents differ considerably in quality, ranging from small improvements to major radical innovations (Streb Reference Streb, Diebolt and Haupert2016). In relation to the issue that not all inventions are necessarily patented, datasets comprising both patented and non-patented inventions, such as those constructed using international exhibition catalogues (Moser Reference Moser2005), are currently lacking for the specific period under examination in this paper.Footnote 20 Regarding quality differences, we have developed a number of patent quality indicators so that we can reconstruct the impact of technology transfer from Britain to France by means of a systematic comparison between the quality of patents of British origin and domestic ones.
Historical Sources
Our paper is based on a digitized dataset covering all the patents deposited and granted in France from 1791 to 1844.Footnote 21 The dataset was compiled by the Institut National de la Propriété Industrielle (hereafter INPI) and comprises 12,575 patents containing fully detailed information on patent and patentee characteristics. Footnote 22 Although it has been used in some important contributions (Galvez-Behar Reference Galvez-Behar2008, Reference Galvez-Behar2019; Baudry 2014; Khan Reference Khan2016), this source still remains largely unexplored.
The dataset allows us to trace the exact date on which a patent was deposited, granted and withdrawn, how long each patent was initially filed for (5, 10, or 15 years), the total number of subsequent additions to the original invention, and a detailed description of the patent itself. A preliminary industry classification of each patent is also available. The name, surname, residence address, and occupation of the patentees are also available. While about a sixth of all patents were deposited by groups of (up to six) individuals, single-patentee inventions are by far the most common. Companies were also permitted to patent inventions, which represented 6 percent of the observations.Footnote 23 Crucially, the data uncover historical evidence on patent agents, that is, intermediaries that handled the bureaucratic procedures on behalf of the patentees themselves. We substantially complemented these data by: (i) geo-referencing each patent and assigning it to a historical department in France; (ii) singling out foreign inventors (and their country of residence); (iii) reclassifying occupations for each patentee; and (iv) categorizing all patents according to the 1853 technological classification (Empotz and Marchal Reference Empotz and Marchal2002, p. 70). We also introduced three different measures of patent quality. Finally, we corrected some data errors by looking at the original source and amending the number of additions, residences of patent agents, and company names.Footnote 24 The analysis is organized around the following periodization, which reflects the main institutional changes of the period: 1791–1815, from the founding of the French patent system to the end of the Napoleonic wars; 1816–1830, from the Congress of Vienna to the 1830 July Revolution (Révolution de Juillet) with Louis Philippe ascending the throne; 1831–1844, throughout the reign of Louis Philippe and until the patent system was drastically reformed in 1844, a few years before the 1848 Revolution.
A Preliminary Snapshot
Between 1791 and 1844, patenting activity in France was quite intense; 12,575 patents were registered. To put this figure into perspective, within the same timeframe in the United States, although registration was much cheaper, 13,833 patents were granted (Khan Reference Khan and Whaples2008). On the other hand, in England, where the system was comparatively more expensive, 8,663 patents were registered (Woodcroft Reference Woodcroft1854).Footnote 25
Table 1 shows the number of patents granted in France between 1791–1844 based on patentee residences at the time of the deposit.Footnote 26 In cases where a patent was deposited by individuals who were resident in different countries, we assigned a fractional number to each one: for instance, whenever a patent was associated with two people residing in different countries, each was given a value of 0.5.
Table 1 DISTRIBUTION OF PATENTS BY COUNTRY AND SUB-PERIODS

Notes: We use fractional numbers to take into account when a patent was assigned to two or more patentees resident in different countries. For Belgium, Germany, Ireland, Italy, and The Netherlands, we consider current borders.
Source: Institut National de la Propriété Industrielle (INPI) dataset.
Table 1 offers two main takeaways. First, patentees who were residents of France account for about 90 percent of the total. Second, among foreigners, patentees who were residents of Britain represented the bulk of the contribution, totaling over 70 percent of foreign patents. Clearly, the flow of technologies from Britain embodied in patents overwhelmingly took place after the end of the Revolutionary and Napoleonic wars. Until 1843, the technology transfer between England and France was still severely disrupted by British legislation, which prohibited the export of machinery and the emigration of skilled workers (Jeremy Reference Jeremy1977).
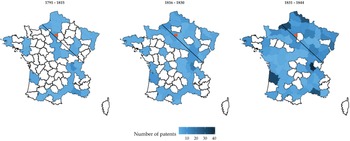
We assigned a latitude-longitude pair to each location associated with a patent. Footnote 27 We then allocated these places to French historical departments by plotting their coordinates over the 1830 French administrative map. Footnote 28 Figure 2 shows the geographical distribution by departments using the periodization previously introduced.Footnote 29 The three maps suggest that French patenting activity was always concentrated around a single hub: Paris.Footnote 30 Considering the entire period, the Seine department (in red) Footnote 31 was by far the most active, since 6,363.5 (50.6 percent) patents were granted to individuals or companies residing there—excluding Seine-Inférieure, Seine-et-Oise, and Seine-et-Marne, which together amounted to an additional 4.2 percent of the total.Footnote 32

Figure 2 NUMBER OF PATENTS GRANTED IN FRANCE BY DEPARTMENT (1791–1844)
Notes: Darker areas indicate a higher number of patents. The maps also report the Rouen-Geneva line.
Sources: Institut National de la Propriété Industrielle (INPI) dataset for patents and http://www.datavis.ca/gallery/guerry/maps.html for the map of France Department boundaries of 1830.
Other departments show much lower numbers—for example, the Rhône comes in second with only 533 patents (4.2 percent); the Gironde is the fourth most active department with 271 patents (2.2 percent). The geographical distribution is therefore very skewed. Footnote 33 Another interesting feature of the maps in Figure 2 is the concentration of patenting activity in the North-Eastern regions of the country. This is consistent with the idea of a regional divide in the French economic and social geography along the notional line, traced in black in the figure, running from Rouen to Geneva, as suggested by Braudel (Reference Braudel1984, pp. 337–43) and other scholars.Footnote 34
In order to analyze the distribution of patenting across technological fields, we expanded the original version of the INPI data by assigning each patent to a homogeneous technological classification for the entire period (1791–1844). We used a total of 20 technological classes according to the pre-1853 coeval classification reported by INPI (see Online Appendix Figures A3 and A4, which present the disaggregation of technological classes by countries and periods, respectively).

Figure 3 NUMBER OF PATENTS GRANTED IN FRANCE BY PATENTEES’ OCCUPATION (1791–1844)
Notes: The occupational HISCO categories and ownership status are the following: 0_1 = small proprietor; 0_2 = large proprietor; 1 = higher manager; 2 = higher professionals; 3 = lower manager; 4 = lower professionals, and clerical and sales personnel; 5 = lower clerical and sales personnel; 6 = foremen (artisans); 7 = medium skilled workers; 8 = farmers and fishermen; 9 = lower skilled workers; 10 = lower skilled farm workers; 11 = unskilled workers.
Sources: Institut National de la Propriété Industrielle (INPI) dataset for patents and Van Leeuwen, Maas, and Miles (Reference Van Leeuwen, Maas and Miles2002) for HISCO occupations.
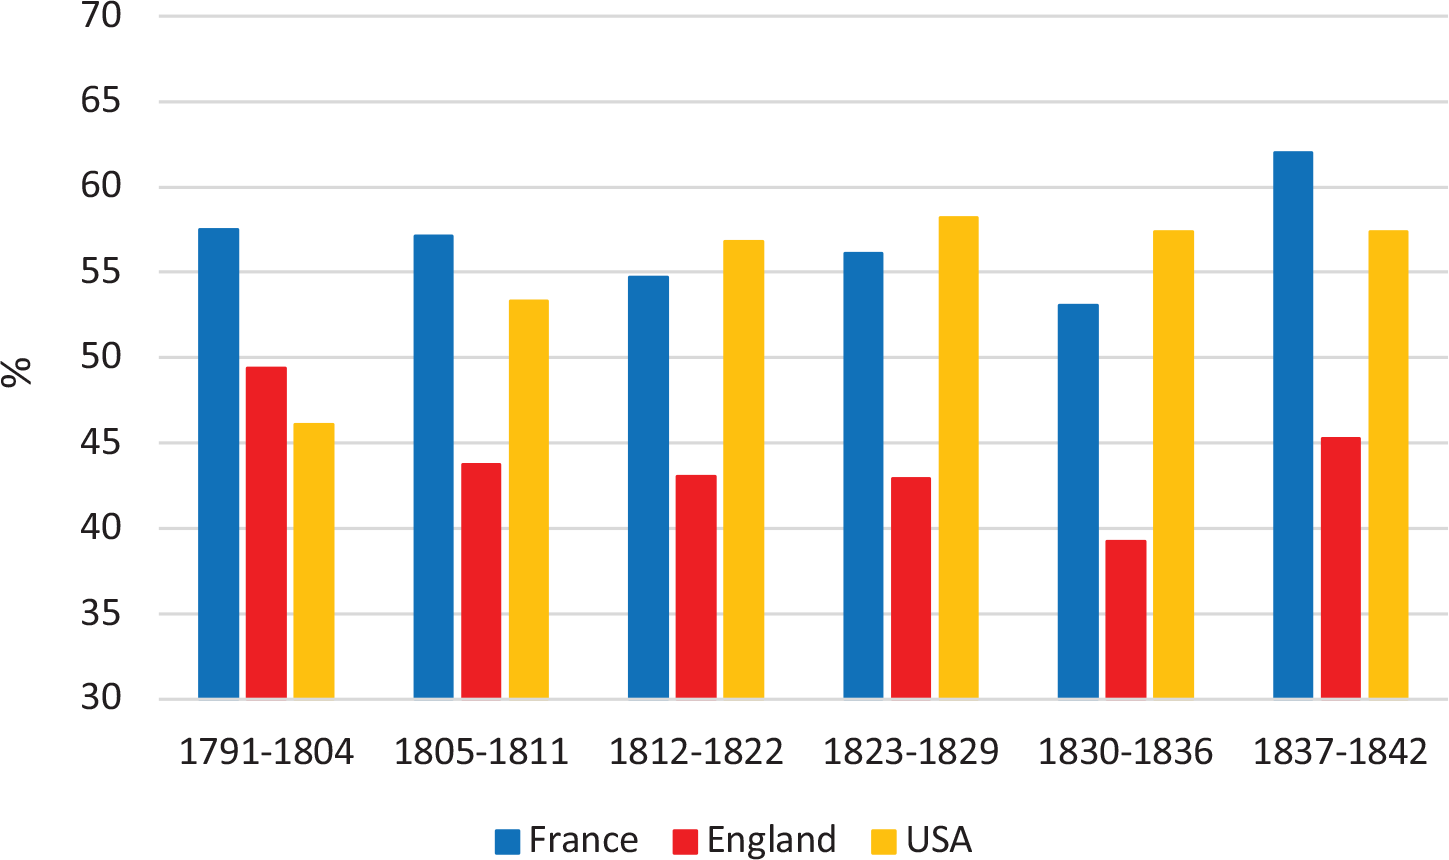
Figure 4 SHARE OF “ONE-OFF” PATENTEES OVER TOTAL PATENTS BY COUNTRIES (1791–1842)
Notes: Data for France and England consist of the total number of patents granted in the period 1791–1844. Instead, data for the United States consist of patents granted from 1790 to 1846. Sources: Our own elaboration of the Institut National de la Propriété Industrielle (INPI) dataset for France and Woodcroft (Reference Woodcroft1854) for England. Sokoloff and Khan (1990, table 1) for the United States.
Finally, to assess the social background of the patentees, we classified the patentees’ occupations and, indirectly, their social class.Footnote 35 We adopted the Historical International Classification of Occupations (HISCO) (Van Leeuwen, Maas, and Miles Reference Van Leeuwen, Maas and Miles2002, p. 57), which classifies occupations according to the manual/non-manual skill level (high, medium, low, and unskilled), supervision (yes or no), and sector (primary or other).Footnote 36 Since, the original source contains titles such as proprietaire, negociant, fabricant, and so on, we complemented the original 11 classes by adding a marker of ownership, distinguishing between small (0_1) and large proprietors (0_2).Footnote 37
Figure 3 shows that four occupations account for more than three-quarters of the total in all the sub-periods. The most represented class is always that of the “large proprietor” (0_2), while the others are: “higher professional” (2), which includes engineers and other individuals with formal scientific or technical education; foremen (artisans) (6), which comprises skilled workers for key technologies in the eighteenth–nineteenth centuries; and “medium skilled workers” (7).Footnote 38 Notably, the share of artisans and low-skilled/unskilled workers amounts to 34.8 percent of the total number of patents. This value is large and much higher than the 18.8 percent estimated by Khan (Reference Khan2020, p. 165) for artisans with a reduced sample of 849 patents for 1791–1855.
In the case of the United States, Sokoloff and Khan (1990) interpreted the share of patentees with only one career patent as an indicator of the accessibility (“democratization”) of the patent system, with the intuition being that a system widely open to “one off” patentees did not have significant barriers to entry.
Figure 4 compares the shares of patentees with only one career patent for France, England, and the United States, using the same sub-periods as Sokoloff and Khan (see Table A3 in the Online Appendix for the full comparative data). When considering this indicator of accessibility, France seems remarkably similar to the United States across all sub-periods.Footnote 39 This characterization is also in contrast with Khan (Reference Khan2020), who painted an essentially elitist picture of the French patent system, claiming that it was only accessible to the wealthy classes. In this respect, our findings cast the functioning of the French patent system in a much more favorable light.
Overall, the occupational disaggregation of patentees and their long-term commitment to patenting suggest that the accessibility of the French patent system was significantly wider than previously suggested by Khan (Reference Khan2005, Reference Khan2020).
DATA AND METHODS
This section provides a discussion of our dataset and the methodology used in the econometrics exercises. Notwithstanding the large success of patents as a measure of inventive activities, one of their most notable shortcomings is that “[…] the inventions that are patented differ greatly in quality” (Griliches Reference Griliches1990, p. 1669). Accordingly, simple patent counting might provide a misleading picture of the intensity of innovative activities. In this paper, we tackle this issue, by developing sophisticated quality measures capturing the “magnitude of inventive output” for each patent (Griliches Reference Griliches1990, p. 1669).
Patent Quality
Economic historians have constructed patent quality indicators by implementing two main strategies (for two useful surveys, see Streb Reference Streb, Diebolt and Haupert2016, Reference Streb2023). Mainly inspired by the American system, which prescribed the documentation of “prior art” by means of citations, the first approach adopts the number of citations received by a patent as a measure of its relative significance; important inventions are likely to attract the interest of many follow-up inventors (Nicholas Reference Nicholas2010).Footnote 40 The second approach exploits renewal data and draws on the idea that inventors will pay renewal fees only as long as the economic returns of the patent exceed the cost of maintaining it in force (Streb, Baten, and Yin Reference Streb, Baten and Yin2006).
In our context, neither approach is feasible: French patents were not yet systematically cited in the United States and, as mentioned previously, renewals were not contemplated by the law. However, following Nuvolari and Vasta (Reference Nuvolari and Vasta2015, Reference Nuvolari and Vasta2017), we maintain that patent duration can still be used as an informative proxy for its value, which is similar to the intuition of the use of renewal data (Schankerman and Pakes Reference Schankerman and Pakes1986). In this case, we assume that ground-breaking inventions are more likely to be associated with longer and more costly patents than more limited contributions.
As previously mentioned, each patentee—or team of patentees—was required to declare upfront how long they wished to secure the legal protection related to the patenting of their inventions. According to the legal framework, they could only choose among three patent durations: 5, 10, or 15 years. We therefore argue that duration is a good approximation of patent quality because it is likely to reflect the expected economic value of the patent for the inventor at the time of the application.Footnote 41 Thus, we develop three measures based on patent duration, considering both improvements introduced by the inventors and withdrawals.
First, we simply classify patents with respect to their duration and assign a progressive quality score from 1 to 3 to each observation, proportional to patent duration: 5, 10, and 15 years. Table 2, panel on the left, summarizes the distribution of this variable: more than half of all the patents were originally filed for 5 years; 27.2 percent were filed for 10 years; while the remaining one-fifth (20.8 percent) was supposed to last 15 years.
Table 2 DISTRIBUTION OF DIFFERENT PATENT QUALITY INDICATORS (1791–1844)
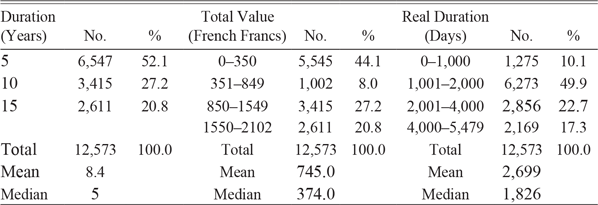
Source: Institut National de la Propriété Industrielle (INPI) dataset.
Second, we exploit the steep fee structure of the French patent system and introduce a monetary measure of patent quality. As already noticed, patentees who wished to register 5-, 10-, or 15-year patents incurred an initial cost of 300, 800, or 1500 francs, respectively. After the initial deposit (handled by the patent administration for 50 francs), inventors could file additions against the payment of a moderate fee (24 francs); most patents do not have any additions (the median is 0, the mean is 0.42, and the maximum is 23). Taken together, this evidence enabled us to assign a total monetary value to each patent: for example, a 5-year patent with 5 additions would have a monetary value of 470 francs (50 + 300 + 24 * 5); a 10-year patent with only one addition would have a monetary value of 874 francs (50 + 800 + 24). Table 2, the panel in the center, bins observations into four classes: 0–350 francs, capturing 5-year patents with no additions; 351–849 francs, capturing 5-year patents with additions up to (but excluding) 10-year patents with no additions; 850–1,549 francs, capturing 10-year patents with additions up to (but excluding) 15-year patents with no additions; 1,550–2,102 francs, capturing 15-year patents with additions. The distribution of this variable largely retraces that in the left panel and confirms that 5-year patents, with or without additions, accounted for about half the total number.
Third, we consider the number of days in which each patent was actually in force, taking into account information on withdrawals.Footnote 42 For example, a 5-year patent is associated with a value of 1,825 days Footnote 43 ; should the same 5-year patent be withdrawn after a year from its grant date, its value would then become 365 days. Following Nuvolari and Vasta (Reference Nuvolari and Vasta2015, Reference Nuvolari and Vasta2017), this indicator captures the “real” duration of a patent since it considers its genuine life-time, defined as the temporal difference between the granting date and the precise moment in which it ceased to be legally binding, whatever the actual reason (expiration or an early withdrawal). Thus, this indicator is our favorite measure—that is, the baseline of our econometric exercise.
Table 2, the panel on the right, gathers observations into four bins, considering their duration measured in days. Compared with the other panels, it reveals that considering withdrawn patents considerably increases the variability, contributing to a more nuanced view of the patent value as patents could be withdrawn independently of their initial duration. Finally, Table 3 breaks down the distribution of the patent’s “real duration” by patentees’ residence. Interestingly, foreign patents and, in particular, British patents are concentrated in the longest-duration classes.
Table 3 DISTRIBUTION OF REAL DURATION (DAYS) BY PATENTEES’ RESIDENCE (1791–1844)
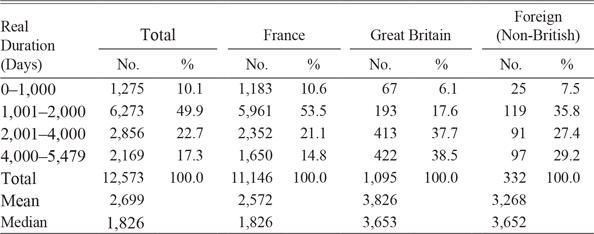
Source: Institut National de la Propriété Industrielle (INPI) dataset.
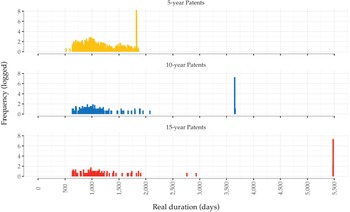
Figure 5 shows three panels where we plot the frequency of actual patent durations within each patent class. Footnote 44 The highest bars relate to the natural expiration date of each patent: 1,825, 3,650, and 5,475 days, respectively. Shorter bars on the leftmost part of the figure show the distribution of withdrawn patents. Although they are most represented in the 5-year class, withdrawals are not uncommon among 10- and 15-year patents either. This suggests that our preferred indicator (“real” duration) offers a more precise assessment of patent quality than the 5-10-15 year disaggregation.
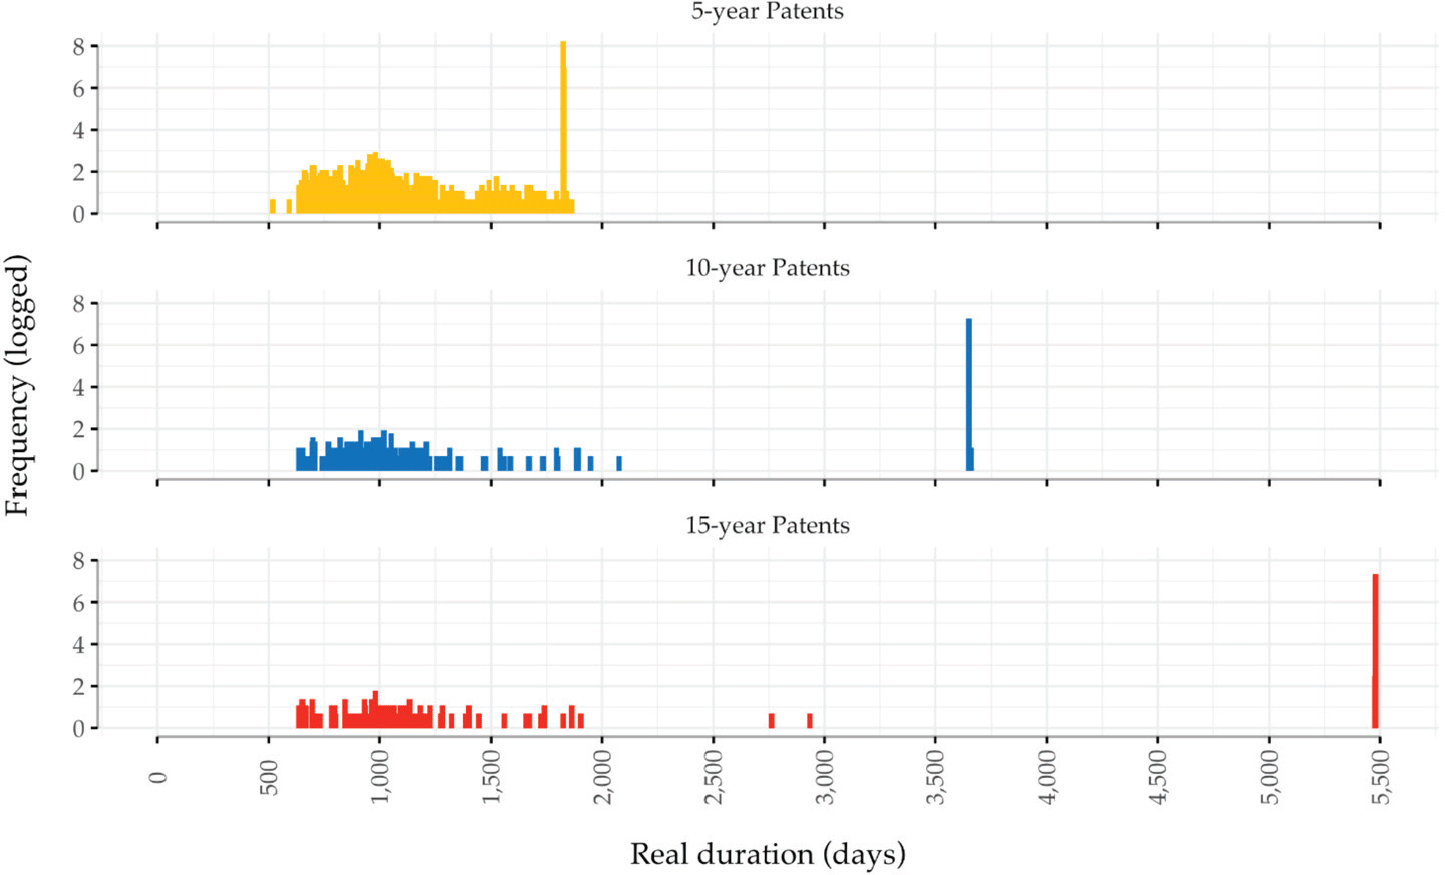
Figure 5 REAL DURATION (DAYS) FOR DIFFERENT TYPES OF PATENTS (5, 10, AND 15 YEARS)
Notes: The figure reports the distribution of patents “real” duration (in log) by three permitted levels of initial duration (5, 10, and 15 years).
Source: Institut National de la Propriété Industrielle (INPI) dataset for patents.
Figure 6 maps the geographical distribution of high-quality patents, defined as those that have been active for more than 4,000 days. In addition to the stylized facts already noted in Figure 2—that is, the Seine department being a clear hub and the existence of a regional divide marked by the Rouen-Geneva line—these maps also reveal that high-value patents were deposited where the innovative activity was most intensive, as charted in Figure 2. While the number of departments without high-quality patents decreases over time, not all of France was covered by 1844, suggesting that certain departments experienced an agglomeration in terms of both quantity and quality.
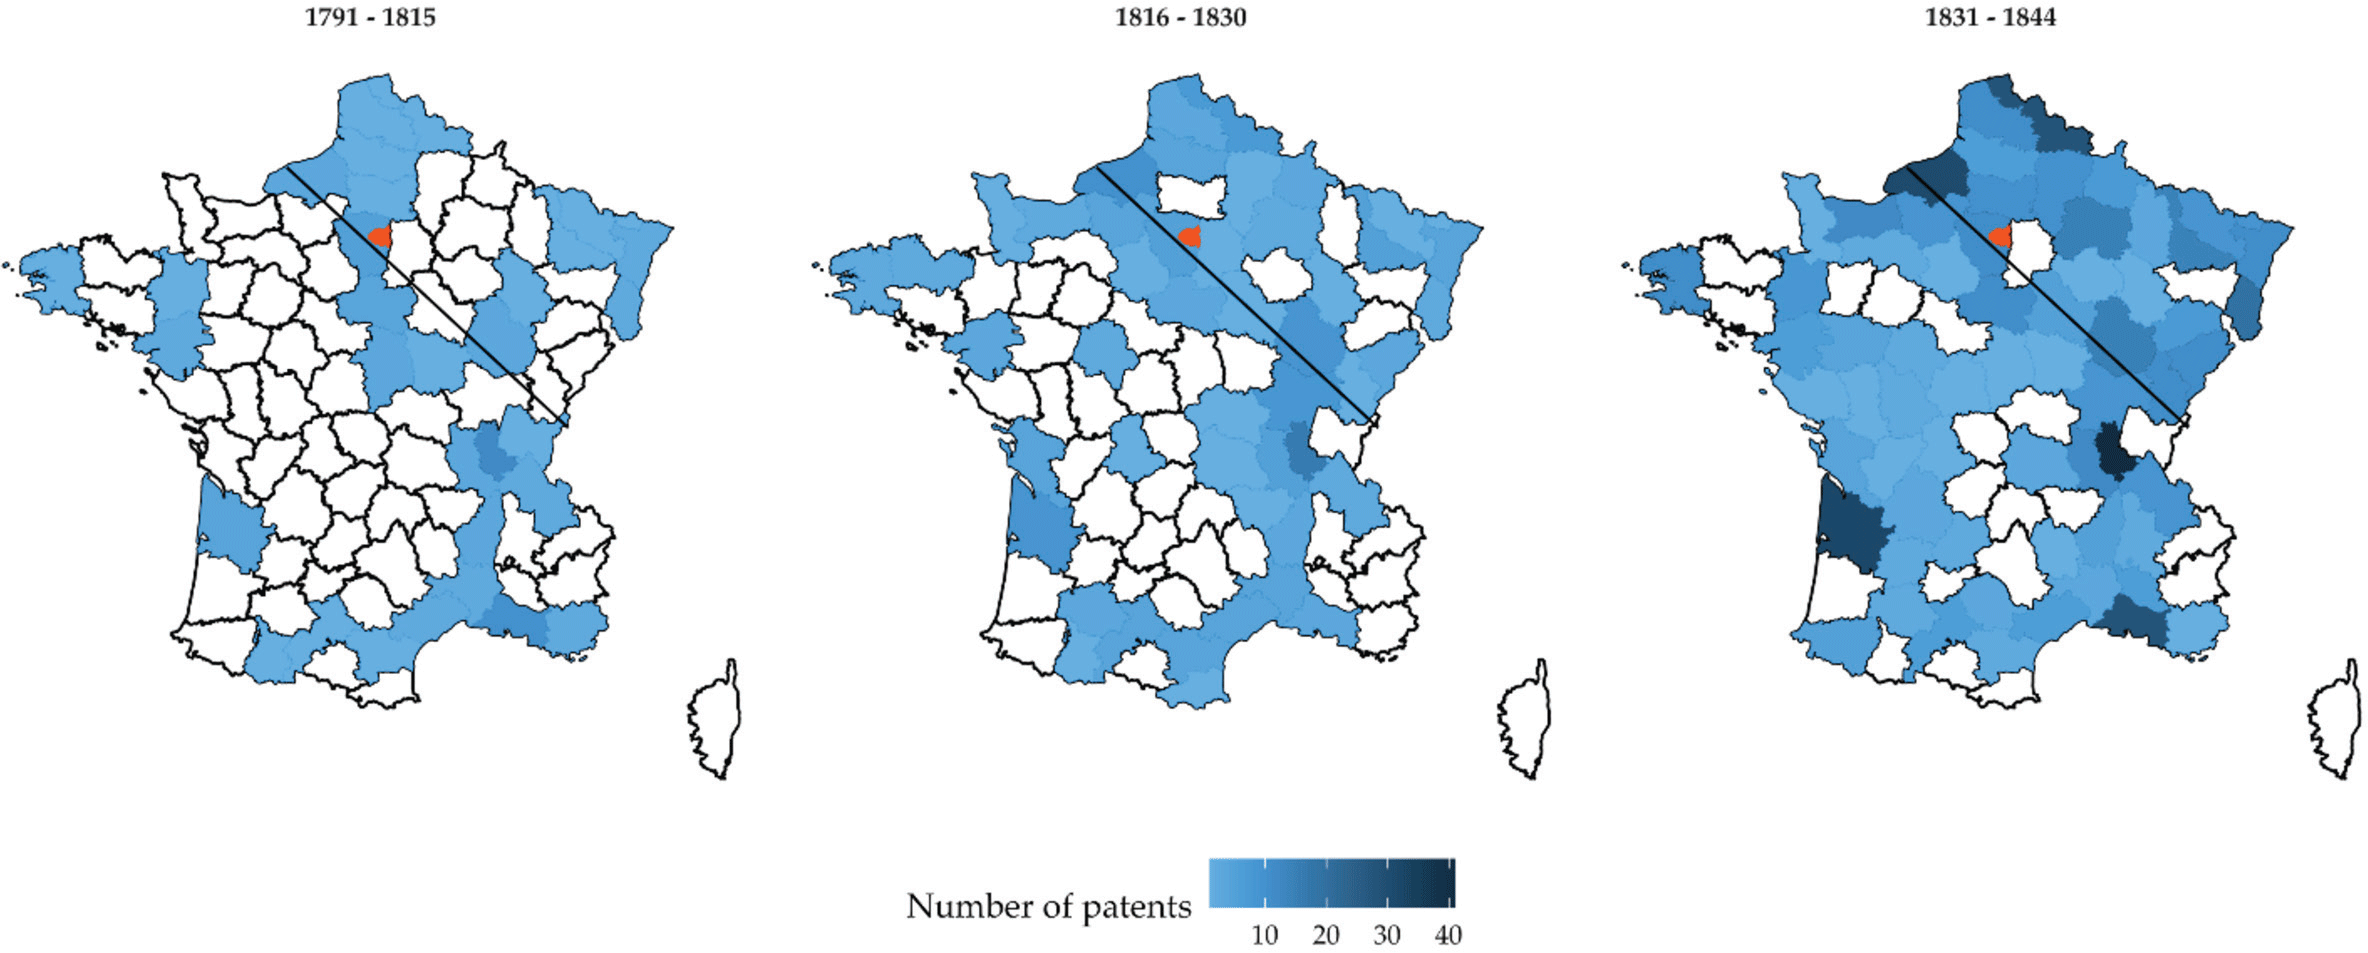
Figure 6 NUMBER OF “HIGH QUALITY” PATENTS GRANTED IN FRANCE BY DEPARTMENT (1791–1844)
Notes: Darker areas indicate a higher number of patents. “High quality” patents are those with real duration (days) greater than 4,000. The maps also report the Rouen-Geneva line.
Sources: Institut National de la Propriété Industrielle (INPI) dataset for patents and http://www.datavis.ca/gallery/guerry/maps.html for the map of France department boundaries of 1830.
The “real” duration measure of patent quality is based on the idea that the choice of patentees in terms of patent duration was not affected by their financial resources, but was related to the intrinsic quality of the invention. Reassuringly, the distribution of patent durations registered by the whole population of patentees and that of individuals of a high social class (identified using the HISCO classification) are very similar. The same pattern is also visible for withdrawn patents (see Online Appendix Figures A5, A6, and A7).
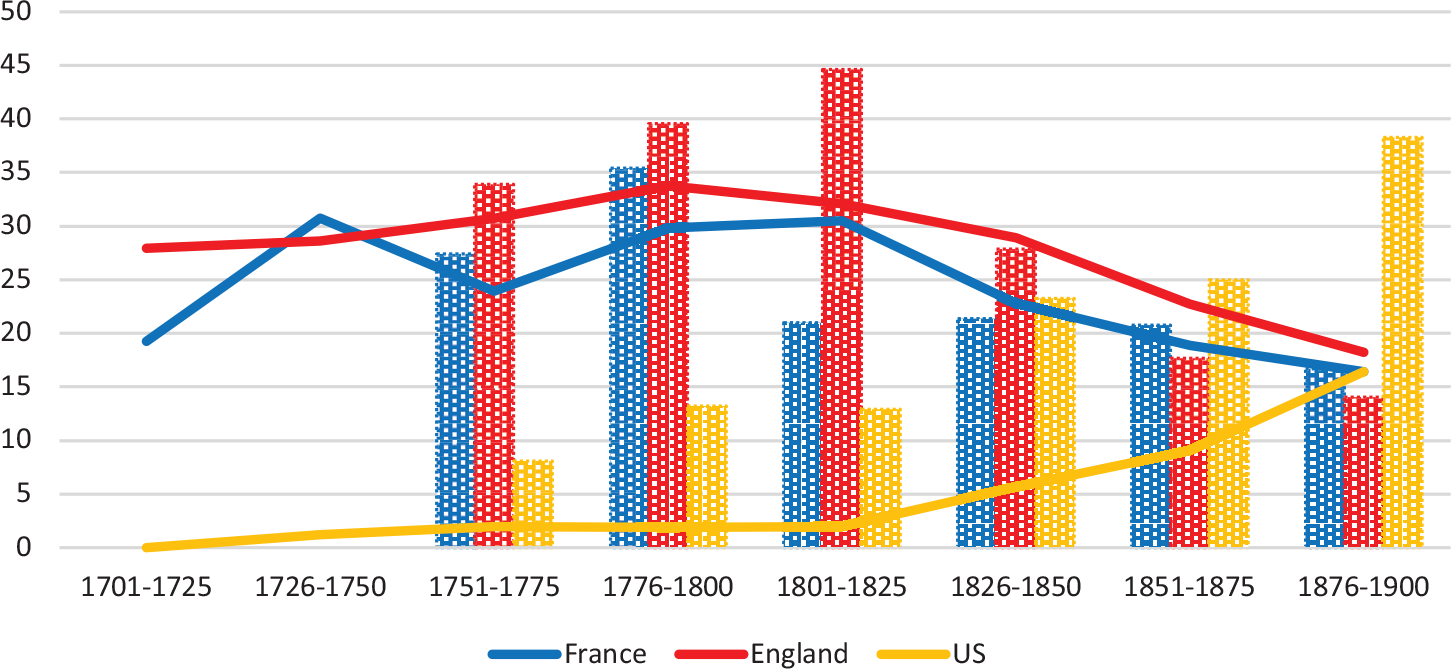
Figure 7 SHARE OF WORLD IMPORTANT SCIENTIFIC DISCOVERIES AND INVENTIONS BY COUNTRIES (1700–1900)
Sources: Sorokin (Reference Sorokin1937, vol. II, p. 150) lines and authors’ elaborations from Streit (Reference Streit1954, annex I, table I) bars.
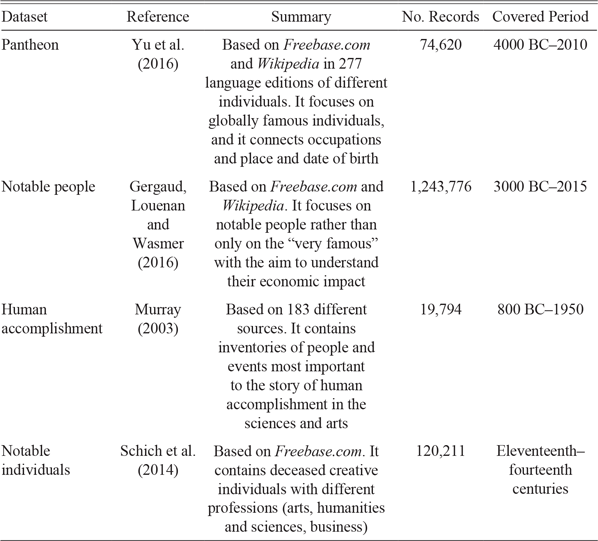
In order to further validate our quality indicator, we cross-matched our data with four recently compiled datasets that seek to identify the most important figures in human history, including inventors. Footnote 45 Pioneered by Khan and Sokoloff (1993) in the context of U.S. patents, this approach employs independent compilations or lists of “famous inventors” as an indicator of patent quality. We used the following sources: Pantheon (Yu et al. Reference Yu, Shahar Ronen, Lu and Hidalgo2016); Notable people dataset (Gergaud, Louenan, and Wasmer Reference Gergaud, Louenan and Wasmer2016); the Human accomplishment dataset (Murray Reference Murray2003); and the Notable individuals dataset (Schich et al. Reference Schich, Chaoming Song, Alexander Mirsky, Barabási and Helbing2014). Table 4 summarizes the most important characteristics of these sources.
Table 4 BIOGRAPHICAL SOURCES USED TO IDENTIFY HISTORICALLY RENOWNED PATENTEES
We identified historically renowned patentees in our data and ranked them according to a 0 to 4 scale, depending on how many times they appear in the previously mentioned sources. We then evaluated whether patents by the most renowned patentees were of higher quality—in terms of our own measures—with respect to the rest of the sample.
Table 5 shows comforting results. The leftmost column specifies how many biographical datasets contain information on a given patentee. The average and median duration of patents deposited by historically renowned patentees are much higher, suggesting that our approach captures patent quality reasonably well. With the exception of a handful of patents with a value of 3, the ordinal fame index increases hand in hand with the average and median patent duration.
Table 5 REAL DURATION (DAYS) FOR PATENTS GRANTED TO FAMOUS AND AWARDED INVENTORS
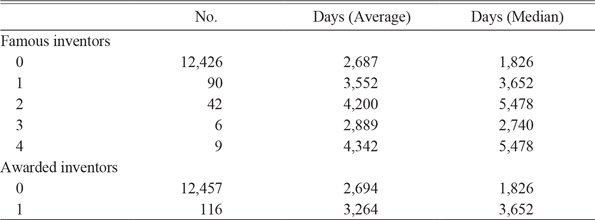
Notes: The table was constructed by matching the names of patentees contained in the INPI dataset with the lists of famous inventors included in the sources of Table 4 and the list of awards granted in the period 1801–1844 by the Société d’encouragement pour l’Industrie Nationale.
Sources: Institut National de la Propriété Industrielle (INPI) dataset for patents. Murray (Reference Murray2003), Schich et al. (Reference Schich, Chaoming Song, Alexander Mirsky, Barabási and Helbing2014), Gergaud, Louenan, and Wasmer (Reference Gergaud, Louenan and Wasmer2016), and Yu et al. (Reference Yu, Shahar Ronen, Lu and Hidalgo2016) for famous inventors and Annuarie de la Société d’encouragement pour l’Industrie Nationale (1852) for awards.
Lastly, following Moser (Reference Moser2012), who used prizes as quality indicators, in order to perform an additional test of patent quality, we digitized the information contained in the Annuarie de la Société d’encouragement pour l’Industrie Nationale (1852).Footnote 46 This publication contains detailed information on all the French inventors who were granted a monetary prize or a medal (bronze, silver, and gold) for a particularly ground-breaking invention. We also cross-matched our data with this information. In the bottom part of Table 2, we split the sample according to whether a patentee received any sort of prize and computed the same statistics as before. The results of this exercise were again in line with our expectations: whenever patents were filed by (a posteriori) more successful inventors, the average and median patent duration were definitively higher.
Empirical Strategy
For our empirical analysis, we first explored the impact of different determinants on patent quality by performing some econometric exercises. Second, we examined the issue of technological congruity by studying the similarities and differences in the patenting activities in France and Britain using a measure of technological distance.
Our econometric exercise is designed to systematically compare the quality of patents with different characteristics. We thus ran a set of regressions, modeling the mean value of patent quality as a function of a number of observables. The aim of this was to assess the role of technology transfer, both via social contact or geographical proximity, as well as social capabilities and other factors. We estimated the following equation:
 $${q_i} = \alpha + \beta \cdot B{O_i} + \gamma \cdot B{C_i} + \delta \cdot S{C_i} + {\rm{\zeta }} \cdot GE{O_i} + {\rm{\;\eta }} \cdot {\rm{\;}}{X_i} + {\varepsilon _i}$$
where q i is the quality of patent i measured using its real duration, BO i indicates a patent of British origin, BC i indicates a patent granted to a French inventor with British contacts, both representing our measure of technology flows, SC i is a vector of variables capturing social capabilities, in particular various forms of education and skills, GEO i represents a geographical control, and X i is a vector of control variables portraying further characteristics of the patent, while ε i is the error term. We include period and technological class fixed effects in all specifications and present results that both include and exclude department fixed effects.Footnote 47 In the following, we present the construction of the model covariates.Footnote 48
TECHNOLOGY TRANSFER
British Origins (BO): this variable is a dummy indicating either that the patentee has British residence or that the patentee (of whatever nationality) had taken an English patent for the period 1791–1852, before or within five years of the granting of the French patent in question. This is done in order to identify those inventors who were more likely to be in close contact with the techniques developed in Britain.Footnote 49
To provide a clearer understanding of the notion of BO patent, we report some examples. The first, the case of a British inventor patenting in France, is represented by the patent for “perfectionnements apportés dans la construction des locomotives” granted (via the patent agent Antoine Perpigna) on 5 October 1843 to James Nasmyth, the Scottish inventor of the steam hammer.Footnote 50 The second example, concerning a foreign inventor patenting both in Britain and in France, is epitomized by the patent granted to the American Robert Fulton, the inventor of the steam boat, on 17 February 1798 for the “canaux navigables sans écluses, au moyen de plans inclinés et de petits bateaux de forme nouvelle.” Indeed, Fulton was awarded an English patent (in this particular case, for a similar invention) in 1794. He actually worked in England between 1786–1797 and in France from 1797 to 1804.Footnote 51
British connection (BC): this variable is a dummy indicating, in the case of all patents not of British origin, that the patentee was a French resident who had already been involved in a patent with British origin, either collaborating with the inventors of the BO patent or via a patent agent involved in a BO patent. Considering the patent agent as a possible channel of technology transfer is fully in line with accounts of French industrialization, which have stressed their critical role as technology brokers in this period. Footnote 52 For example, the variable includes the patent granted on 12 May 1842 for the “perfectionnements apportés aux machines à vapeur fixes ou locomotives” granted to Benoit Fourneyron, the famous inventor of a successful hydraulic turbine. By that time, Fourneyron had already taken several patents via the mediation of the patent agent, Antoine Perpigna, who, in turn, had been involved in several BO patents. On the other hand, the famous patent on the hydraulic turbine (“roue à pression universelle et continue, ou turbine hydraulique de Fourneyron”) granted to Fourneyron on 24 October 1832 is not considered a BC patent, because it was taken before this inventor had had any contact with Antoine Perpigna.Footnote 53
SOCIAL CAPABILITIES
Engineer/Scientist: this is a dummy variable that indicates whether at least one patentee was an engineer or a similar professional (HISCO class 2). In this period, the profession of engineer was already characterized by a formal education. There were two main types of engineering education in France: the famous grandes écoles that supplied engineers mostly for the army and other state departments, and the écoles d’arts et métiers (introduced in 1803), which were more focused on the training of engineers who would be employed in the private sector (Day Reference Day1978). In both schools, the curricula were closely supervised by the State and consisted of highly intensive theoretical training. In contrast, Britain did not set up a formal national system of engineering education, and the training mainly took place by means of on-the-job apprenticeships (Hanlon Reference Hanlon2021).
Skilled worker: this is a dummy variable that indicates whether a patentee was a foreman, an artisan, or a similarly skilled worker (HISCO class 6). In the English context, a significant stream of literature has emphasized the critical role played by artisans in developing incremental inventions with a large productivity impact (Kelly, Mokyr, and O’Grada Reference Kelly, Mokyr, O’Grada, Bruland, Gerritsen, Hudson and Riello2020). In contrast, in France, there are no quantitative analyses of the contribution of skilled workers to inventive activities.
Literacy rates: this variable considers the possible effect of the diffusion of basic education on inventive activity. It is measured as grooms’ literacy rates in 1790, taken from the Maggiolo Inquiry.Footnote 54 The variable is constructed at the department level, since we assign the corresponding literacy rate to all patents registered in a given department. In the case of multiple inventors, we considered the department with the highest literacy rate.
GEOGRAPHY
Rouen-Geneva line: this variable, which was designed to capture the effect of geographical proximity to England, has a value of 1 when at least one of the patentees was resident north of the Rouen-Geneva line.
Port distance: this variable, which again was designed to capture the effect of geographical proximity to England, measures the distance from the residence of patentees to the nearest major Atlantic port (Brest, Calais, Cherbourg, Le Havre, and Saint Malo).Footnote 55 In the case of multiple inventors, we considered the shortest distance.
These two variables are meant to assess whether the geographical proximity to Britain played a determinant role in the technology transfer process.
FURTHER CONTROLS
Number of patentees: this variable denotes the number of patentees who registered a given patent. The aim is to capture the possible influence of scale effects on the inventors’ team.
Experience: this variable measures the number of patents taken by the patentee before the patent in question. In the case of multiple patentees, this variable takes the value of the patentee with the maximum experience.
Famous inventor: this variable measures the “historical significance” of the patentee, ranging between 0 to 4 as explained in the previous section. Again, in the case of multiple patentees, the variable captures the highest score.
High tech sector: this is a dummy that indicates whether the patent belongs to sectors characterized by rapid rates of technical progress, namely steam engines and engines (class 3), textile machines and fabrics (class 4), navigation (class 6), and metallurgy (class 8).
Award: this variable is a dummy that considers whether the patentee received an award from the Societe d’Encouragement pour l’Industrie Nationale.
After having characterized the main determinants of technology transfer by means of our econometric exercise, we explore the process of adaptation of British technologies to the French context by assessing the technological congruity between the two countries. To this aim, we used the indicator of technological distance introduced by Bar and Leiponen (Reference Bar and Leiponen2012). This indicator measures the distance between two patent “portfolios” distributed over K different industries. It is computed as follows:
 $$T{D_{ij}} = 1 - \sum\limits_{k = 1}^K {\min ({p_{i,k}}{p_{j,k}})}$$
where TD ij denotes the technological distance between the patent portfolios i and j, while p i,k and p j,k indicate the share of patents in industry k in portfolios i and j, respectively. The indicator is equal to 0 when the sectoral distribution of the patent portfolio is perfectly equal, while it is equal to 1 (which is the maximum distance) when there is no overlap in the sectoral distribution of the two patent portfolios.
RESULTS
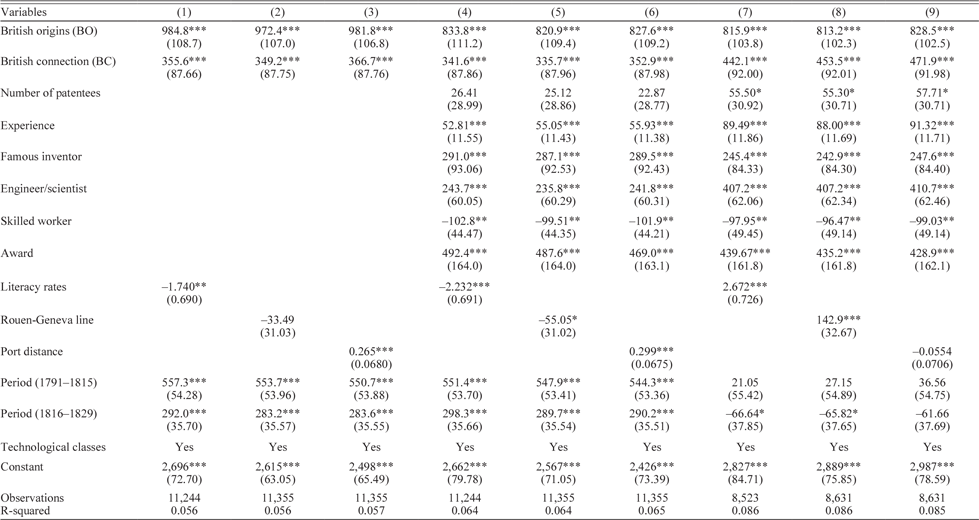
Table 6 presents a number of regressions in which the dependent variable is the real duration (measured in days) of a patent. Columns (4) and (8) contain regressions that do not include withdrawn patents (in this case, the sample amounts to 9,698 patents instead of 12,573 in the total sample). Columns (5), (6), (7), and (8) contain specifications controlling for department-fixed effects absorbing all unobserved characteristics that do not vary over time.
Table 6 DETERMINANTS OF PATENT QUALITY IN FRANCE

Notes: Dependent variable is “real” patent duration in days. OLS regressions with robust standard errors in parentheses. *** p<0.01, ** p<0.05, * p<0.1. Models (4) and (8) do not include withdrawn patents.
Source: Institut National de la Propriété Industrielle (INPI) dataset.
The results show that British origins (BO) are significant and positive in all specifications. The estimated effect ranges between 747 and 1,204 days. This intensive technology transfer from Britain took place by virtue of the activities of patent agents: 80 percent of the patents with British Origins featured the active involvement of a patent agent; thus, for domestic patents, the share is limited to 20 percent. The coefficient of the variable British connection (BC) is also positive and significant in all the specifications. In this latter case, the estimated effect ranges between 352 and 537 days, highlighting the very sizeable impact of British connections on patent quality—albeit lower than in the BO case.Footnote 56
Concerning the other co-variates, we find that the size of the team that registered a patent (number of patentees) is generally not a significant predictor of patent quality. This is in line with the findings of Nuvolari and Tartari (Reference Nuvolari and Tartari2011) on English patents in the same period. The coefficient of the variable experience is positive and significant, although this result does not seem very robust, and the effect is relatively small. The coefficient of the variable famous inventor is positive and significant, and relatively robust across specifications, with a sizable effect—between 320 and 380 days. This result, obtained with a multivariate regression, confirms the descriptive statistics reported in Table 5, further corroborating our indicator of patent quality. The coefficient of the variable engineer/scientist is positive and significant, indicating an important role for relatively sophisticated engineering competences in the development of high-quality innovations. On the other hand, the coefficient of the variable skilled worker is negative and significant, which may suggest a scarcity of skilled workers acquainted with the implementation of modern industrial machinery, as also testified by the intense migration flows of high-quality craftsmen from Britain to France.Footnote 57 This picture is also consistent with the view that the crucial needs of modern manufacturing, even before the rise of the science-based sectors in the second half of the nineteenth century, were met more by a growing science-oriented and highly educated elite than through more traditional models of apprenticeship (Fox Reference Fox2012). The coefficient of the variable high-tech sectors is positive and significant, as expected. Footnote 58
Table 7 presents a number of regressions in which the sample includes only patents granted to at least one French resident (i.e., it excludes patents taken exclusively by foreign residence patentees). In general, all the results presented in Table 6 carry through in this setting. The coefficient of award is positive and significant in all specifications, confirming, in a multivariate framework, the positive relation between award and patent quality emerging from Table 5. Somewhat surprisingly, the coefficient of literacy rates has a small impact on patent quality: an increase of 1 percentage point in literacy rates results in a reduction of 1–2 days in terms of patent duration. Notably, while remaining relatively small, this effect becomes positive when the sample excludes withdrawn patents. A possible interpretation could be that patenting activity was relatively more dynamic in departments where basic education was more widespread. In these locations, competition was also fiercer, possibly leading to a higher rate of withdrawn patents due to more intense litigation. A similar pattern is also visible for the two geographical covariates (Rouen-Geneva line and Port distance). Both coefficients point to a positive effect only in settings without withdrawn patents.
Table 7 DETERMINANTS OF PATENT QUALITY IN FRANCE (ONLY DOMESTIC PATENTS)
Notes: Dependent variable is “real” patent duration in days. OLS regressions with robust standard errors in parentheses. *** p<0.01, ** p<0.05, * p<0.1. Models (4) and (8) do not include withdrawn patents.
Source: Institut National de la Propriété Industrielle (INPI) dataset.
The limited impact and instability of the coefficients of these two latter variables, when compared to the magnitude and robust significant effect of British Connection (BC), suggest the prominent role played in technology transfers by direct social contacts rather than geographical proximity.
As a general robustness check for our analysis, Online Appendix Table A8 presents a number of regressions that use alternative indicators of patent quality as dependent variables. The results confirm our findings in terms of the significance and magnitude of the estimated effects of our two key explanatory variables, British Origins (BO) and British Connection (BC).
The literature on French industrialization (Crouzet Reference Crouzet, Teich and Porter1996) has pointed out that before being adopted in France, British technologies had to be tailored and non-trivially modified because factor endowments differed in the two countries. We thus provide new insights regarding this issue by studying the relationship between the distribution of patents across technologies in the “exporting” country (Britain) and that in the “receiving” country (France). Table 8 reports the Bar-Leiponen measure of technological distance between all patents granted in Britain to: (i) patents granted in France with British origin (BO); (ii) patents granted in France with British connections (BC); and (iii) domestic French patents.
Table 8 BAR-LEIPONEN MEASURE OF TECHNOLOGY DISTANCE

Notes: The table reports the Bar-Leiponen measure of technological distance between the sets of patents listed in the first column. See the main text for full details.
Sources: Institut National de la Propriété Industrielle (INPI) dataset for French patents and Nuvolari and Tartari (Reference Nuvolari and Tartari2011) for British ones.
In the upper panel of Table 8, a 17-industry classification enables us to match the 21-industry classification for English patents constructed by Nuvolari and Tartari (Reference Nuvolari and Tartari2011) with the 20-industry classification for French patents adopted in this paper. The matching is not perfect because the criteria used to allocate patents in the different classes reflect the features of the original sources.Footnote 59 Even with this caveat, the results are interesting. Indeed, the technological distance is minimal between the English technological frontier (represented by all English patents) and British origins (BO) patents in France; it is intermediate between the English technological frontier and the British connections (BC) patents; and it is maximum between the English technological frontier and the entire distribution of domestic patents in France. The lower panel of Table 8 shows a study of technological distance using only the French patent sample (organized into 20 patent classes). In this case, given that the criteria for allocating patents to different classes are homogeneous, the results might be more accurate. The reference point from which the distance is computed is the entire French patent sample. Reassuringly, the results reported in the upper and lower panels of Table 8 are consistent. Indeed, the lower panel shows that the distance between the entire French patent sample and British connection (BC) patents is minimal and that between the entire French patent sample and British origin (BO) patents it is much higher. Furthermore, the distance between the entire French patent sample and that of foreign (non-British) patents is the maximum. In general, these findings hold when breaking down the sample according to different patent quality levels.
A possible interpretation of Table 8 is that patents of British origin mirrored the sectoral distribution of the English technological frontier, and, for this reason, they were probably an attempt to directly transfer British inventions to France. Instead, British connection patents, in terms of sectoral distribution, had an intermediate position between the English technological frontier and French patenting overall. This suggests that British-connected inventors were actually involved in attempts to adapt British technologies to local conditions. For example, several French inventors focused on the improvements and development of water-power technologies, expanding on the work carried out by John Smeaton and John Rennie during the eighteenth century in England. These efforts culminated in the development of the water turbine by Benoit Fourneyron in 1837, which provided an effective alternative solution to steam power in coal-expensive regions such as France and New England (Mokyr Reference Mokyr1990, pp. 90–92). Even in the case of an iconic British technology such as the steam engine, French inventors made significant improvements that enhanced the fit of this technology to the French context. In the first half of the nineteenth century, the most common engine in French mills was the high-pressure Woolf compound engine, which was imported from England by Humphrey Edwards with a French patent of importation granted on 17 May 1815. In comparison with Watt’s low-pressure engine—which remained the standard technology in British manufacturing districts until the 1840s—the Woolf engine permitted substantial fuel savings. By 1824, some 300 Edwards-Woolf engines had already been installed in France. This design was further improved during the 1820s and 1830s (Nuvolari Reference Nuvolari2010). It is also interesting to note that, according to Fox (Reference Fox and Carnot1986), the adaptation of British technology to the French context stimulated major scientific developments such as Carnot’s theorem of thermodynamics. A similar pattern of rapid introduction followed by streams of domestic improvements characterized the importation into France of steel-making technologies based on coke. In this case, the patent of importation granted to James Jackson on 26 January 1819 was flanked by a special grant from the government. According to Horn (Reference Horn2006, p. 256), the investment “paid impressive dividends for national industrial performance and international competitiveness.”
DISCUSSION
Overall, our analysis of French patenting activity highlights the effectiveness of the French national innovation system, which was characterized by intense flows of technology from the leading country (Britain), coupled with a robust capacity to absorb innovations and adapt them to the domestic context. This picture is consistent with other measures of innovative performance not based on patents. Indeed, Figure 7 provides an exploratory sketch of the evolution of scientific and technological capabilities in Britain, France, and the United States using two sources containing lists of major scientific discoveries and inventions (Sorokin Reference Sorokin1937, p. 150; Streit Reference Streit1954, p. 239 ff.). Interestingly, although constructed independently, the two sources offer similar results. Looking at Sorokin’s data, represented by lines in the figure, France is never far from the English level over the entire period considered. Streit’s data, represented in bars, show a somewhat larger gap between England and France; however, France performs notably and visibly better than the United States, at least from the mid-nineteenth century.Footnote 60
Further evidence of a creditable French technological performance is also provided by Moser (Reference Moser2002), who shows that France outperformed all other visiting countries in terms of number of medals per capita at the Crystal Palace Exhibition in 1851. At the same Exhibition, as far as the high-tech industry of scientific instruments is concerned, France was the leading country after Britain (Brenni Reference Brenni2010).Footnote 61 Relatedly, trade data indicate that France was the largest importer of machinery from Britain in the early 1840s, confirming that by that period, France had managed to adopt and use sophisticated industrial technologies initially engineered abroad (Bruland Reference Bruland1989, p. 149).
CONCLUSIONS
In this paper, we have provided fresh evidence that corroborates a more optimistic view of French industrialization. In particular, we have examined a crucial aspect of the catching-up process of a follower country, which is the capability to absorb and adapt technologies developed by the leaders. Our study of French patent activity reveals the existence of a significant volume of high-quality British inventions imported into France. We have also shown that the French inventors who engaged with these technology flows were also capable, in turn, of developing significant innovations.
Overall, this assessment confirms the conjecture by Crouzet (Reference Crouzet2003, p. 234), who noted that “The French managed to learn British technology and adapt it to local conditions; […] so that French scientists and engineers made a considerable contribution in this field and France became at mid-century [1850] a center of invention and diffusion for modern technologies.” From a broader perspective, according to Mokyr (Reference Mokyr2021, p. 241), England and France embodied two different traditions of knowledge generation within the Industrial Enlightenment. The English were more specialized in tacit knowledge, empirical skills, and learning-by-doing, while the French were mainly oriented towards codified knowledge and theoretical understanding. In line with this conjecture, we offer a positive assessment of the French accumulation of social capabilities by means of investments in scientific and engineering education (Fox Reference Fox2012).Footnote 62 Indeed, our results show that inventors with this formalized educational background were more likely to produce valuable patents than artisans or skilled workers. In this respect, Mokyr (2019) argues that upper-tail human capital consisted of a tiny elite of two overlapping groups: “intellectuals” and “top-rated artisans.” Our results reveal that in France, the former played a predominant role in fostering innovative activities during a period of rapid expansion of the technological frontier.Footnote 63
Our study also shows that French inventors who had personal contacts with their British counterparts developed innovations that were close to the technological frontier, notwithstanding the different resource endowments. At the same time, these inventors also successfully adapted British technologies to local conditions.
Our analysis also contributes to the debate on the comparative performance of patent systems in their early phases of development (MacLeod and Nuvolari Reference MacLeod and Nuvolari2016). In the case of the industrialization of the United States, several papers have emphasized the role of discriminatory clauses against foreign inventors, while American inventors were incentivized to patent small adaptations and modifications of British technologies (Mowery Reference Mowery, Odagiri, Goto, Sunami and Nelson2010).Footnote 64 Rather than adopting discriminatory clauses, France’s policy was to try and foster technology inflows by granting complete access to the patent system to foreign inventors. Our results indicate that this strategy was effective since France was able to import high-quality technologies from Britain through this non-discriminatory approach.Footnote 65
This is not a trivial finding since, in the same period, foreign technologies imported into Britain, where access to the patent system was much more expensive and selective, were of lower quality than domestic inventions (Nuvolari and Tartari Reference Nuvolari and Tartari2011). This evidence also suggests the general attractiveness of the French context, which was characterized by both the crucial role of patent agents—who selected valuable technologies and helped foreign inventors effectively navigate the patent system—and the ability of French engineers to put foreign technologies into practice.
Although our findings support a more optimistic view of French industrialization, further research is needed to reassess this issue. First, a comprehensive investigation of the effectiveness of interventionist policies à la Chaptal adopted by the French state is still lacking. Second, a quantitative analysis of the French patent system in the second half of the nineteenth century could lead to a broader understanding of French technological performance in the long run.


 Open access