


Introduction
In today's globalized economy, governments compete against each other to attract new foreign direct investment (FDI) projects to their constituencies.Footnote 1 One policy instrument that governments use to win over new foreign companies are firm-specific discretionary investment incentives. These are financial commitments by governments to targeted firms that involve the provision of direct subsidies (e.g., cash grants) or tax breaks (e.g., property tax abatement) in return for their investments. Discretionary investment incentives are common. In the United States alone, thirty-nine states have programs that allow governors to make discretionary investment incentive decisions.Footnote 2 Slattery and Zidar estimate that between 2002 and 2017, US states granted $82 billion in firm-specific subsidies.Footnote 3
There are two major rationales to explain the use of discretionary incentives. First, investment incentives can increase the competitiveness of governments as an investment location.Footnote 4 Attracting new foreign companies can promote job growth and enhance technology transfers, which will improve the productivity of domestic firms.Footnote 5 Second, there are political motives. Attracting new businesses has distributive consequences that may favor the supporters of an incumbent politician.Footnote 6 By distributing investment incentives, politicians can pander to voters and showcase that they promote economic growth.Footnote 7 Moreover, politicians can use investment incentives for rent-seeking purposes—for example, to reward campaign donors with incentive packages.Footnote 8
Given the anticipated economic and political benefits of investment incentives, we would expect that politicians are unlikely to reject a company if it shows interest in investing in the politician's locality. Nevertheless, there are examples where politicians actively refuse to hand out incentives. The mayor of the city of Commerce, Georgia, stated in an interview with the New York Times that there were multiple companies that were interested in investing in Commerce.Footnote 9 The city (and the county), however, did not support these investments with incentives because the companies were offering only low-paying jobs. The city eventually attracted a multibillion-dollar investment from SK Innovation, a South Korean electric car battery manufacturer, in 2019 with a $300 million incentive deal. Why would a politician not support every possible investment if it provides them with the opportunity to score easy political points and promote job growth?
In this article, I explore the micro-foundations behind an overlooked explanation for the selective use of investment incentives: politicians’ concerns about backlash from voters.Footnote 10 We know relatively little about voters’ attitudes toward investment incentives. Existing work assumes that voters tend to enable and not discourage the disbursement of investment incentives.Footnote 11 One reason for this is that voters associate the provision of investment incentives with an activity that stimulates economic growth.Footnote 12 Another reason is that politicians can justify the disbursement of investment incentives by stating the presence of external competition for private investment. Thus, voters may believe that investment incentives are simply the price of doing business.Footnote 13
These arguments, however, do not recognize that FDI projects are not equally effective in improving the economic situation of a community. Some investors will make long-term investments that produce well-paying jobs in industries of the future. The SK Innovation project, for instance, created manufacturing jobs in the rapidly growing electric vehicle sector. Other projects may be less likely to generate these benefits for voters. This can be because most of the economic benefits may not trickle down to the community; because of the presence of large negative externalities, such as higher levels of pollution or higher costs of living; or because an investor has a reputation as an unreliable business partner. I call this project-level characteristic quality—that is, the effectiveness of an FDI project in improving the living standards of a community as perceived by voters.
I argue that voters will condition their support for investment incentives on FDI project quality. While voters cannot observe a project's true quality, they can make inferences about quality from observable project characteristics. I contend that voters will be more likely to support investment incentives if they are given to high-quality projects rather than to low-quality projects. The reason is twofold. On the one hand, voters may believe that tax dollars spent on a low-quality project would yield greater returns for a community if spent on a different economic development activity. On the other hand, when observing low-quality projects, people are more likely to assume that their tax dollars are misappropriated for rents to politicians and corporations. From this preference for high-quality projects, I derive that project quality limits the use of investment incentives as an instrument for politicians to gain political support.Footnote 14 I expect that investment incentives yield political benefits only when given to high-quality projects and create political backlash when given to low-quality projects.
I test this theory with a survey experiment conducted in the United States. The experiment consisted of two parts. First, respondents participated in a conjoint experiment in which I exposed them to hypothetical FDI project profiles. Second, respondents completed a factorial survey experiment in which they read a fictional scenario about a possible FDI investment that receives support from their local government council. I randomly manipulated the quality of the investment as well as whether the local government council provides larger or smaller investment incentives than competing municipalities.
The results provide evidence for the idea that project quality affects people's support for investment incentives. Findings from the factorial experiment demonstrate that giving any type of investment incentive to a low-quality project significantly decreases the level of support for the politician's incentive decision. Furthermore, I observe that outbidding competitors with larger investment incentive packages only increases a politician's support conditional on the investment project being of high quality. Pandering with investment incentives does not work when dealing with low-quality projects. While politicians do not experience the expected backlash, large investment incentives for low-quality projects also do not increase a politician's political support.
The conjoint experiment provides additional evidence about the project attributes that are most salient to respondents. I find that people are more likely to approve investment incentives if they target projects that create many jobs and hire mostly locals. This speaks to the idea that voters want their government to endorse projects from which their communities are most likely to benefit. Furthermore, I find that respondents care about the reputation of a company as well as the endorsements from local small business associations. Respondents expressed higher levels of support for investment incentives if handed out to well-regarded companies that receive support from local small business associations.
To strengthen the connection of these findings to the behavior of politicians, I first discuss how voters learn about incentives from local news, citing evidence from a recent survey by Slattery.Footnote 15 I also present anecdotal evidence of cases in which investment incentives to low-quality projects backfired. Moreover, I provide descriptive evidence from a large-N analysis that investigates which factors affect the likelihood that greenfield FDI projects in the United States receive investment incentives. In the analysis, I combine FDI project-level data for the period from 2010 to 2019 with Wavteq's IncentivesFlowFootnote 16 dataset. I find evidence that is consistent with the results of the conjoint experiment.
This article makes several contributions. First, it challenges the idea that external constraints imposed by competition for private capital reduce electoral accountability for poor economic decisions.Footnote 17 I find that voters are not duped into believing that they need every investment. Second, this is the first study that systematically analyzes and assesses voters’ preferences for investment incentives. This helps further advance research on the political economy of investment incentives. Third, the results suggest that transparency about project characteristics can minimize politicians’ benefits of abusing investment incentives for their own political gains.Footnote 18 This is in line with findings from the pandering literature that suggest that transparency can disincentivize politicians from expanding government spending for political motives.Footnote 19 Fourth, I contribute to the growing literature on credit claiming that suggests that credit claiming is not always effective but depends on project-specific characteristics.Footnote 20
Political economy of investment incentives
Explaining the use of investment incentives
Discretionary investment incentives are a major policy instrument available to governments to support their economic development activities.Footnote 21 Slattery and Zidar estimate that US states and local governments spent $82 billion on discretionary investment incentives between 2002 and 2017—that is, around $5 billion a year.Footnote 22 Discretionary incentives are firm-specific incentives that aim to lower the cost of entry for firms as well as their tax rate in return for a company's commitment to invest and create jobs in a community. These incentives come in various shapes, but they are usually a bundle of varying incentive types tied to certain investment and job creation goals. These bundles can include direct cash grants, tax credits (such as property tax reductions), and the provision of insurance for damages to the company's property.
Existing work highlights several reasons why politicians use investment incentives. First, there are economic motives. Politicians must hand out investment incentives because they are in competition with other governments to attract FDI projects. In our globalized economy, companies can choose to invest in different locations. This mobility creates an auctioning dynamic whereby governments compete for investments through tax policy.Footnote 23 One strategy to improve a government's competitiveness in this bidding process is to offer targeted investment incentives.Footnote 24 While there is a debate over whether investment incentives are effective in promoting economic development,Footnote 25 there is an entrenched belief among certain political actors that incentives are necessary to attract new investors.Footnote 26
Second, politicians have electoral motives to provide investment incentives.Footnote 27 Attracting new FDI projects has distributive consequences that can benefit the standing of politicians. For instance, Owen finds that Brazilian mayors from towns that attracted FDI projects performed better electorally than mayors from towns without FDI projects.Footnote 28 Pinto demonstrates that leftist governments are more likely to implement FDI-friendly policies since, on average, FDI projects tend to benefit labor.Footnote 29 Moreover, the use of incentives is a signaling opportunity.Footnote 30 Voters generally believe that investment incentives are necessary to attract business and effective for spurring economic growth. Thus, by handing out investment incentives, politicians demonstrate to voters that they promote economic policies that voters perceive as effective. Lastly, incentives can also be weaponized to garner political favors from donors. For instance, politicians with selfish motives can promise investment incentives to companies if they invest and make contributions to their campaign. Several studies have documented a decline in a company's tax rate as campaign contributions and lobbying activity increase.Footnote 31 This suggests that the disbursement of investment incentives is also linked to rent-seeking behavior by politicians and corporations.
Overall, existing work suggests that politicians should not be very picky when granting incentives to investors. There are economic and political rationales that make it very appealing to politicians to generously disburse incentives and to not discriminate across investors. Empirically, however, we observe a different pattern. Politicians are selective in the projects they engage with. Bauerle Danzman and Slaski, for instance, find that investment projects with lower capital mobility are more likely to receive incentives.Footnote 32 The selective use of investment incentives is further underscored when we look at the universe of greenfield FDI projects in the United States between 2010 and 2019. Figure 1 shows the correlation between the log number of jobs that an FDI project creates and the probability of receiving an incentive.Footnote 33 The plot highlights that even among the projects that create most jobs, only approximately 40 percent of projects receive incentives. What explains politicians’ selective use of investment incentives?

Figure 1. Log number of jobs and probability of receiving incentives. The rug plot represents the distribution of all greenfield FDI projects in the US between 2010 and 2019. FDI project data comes from fDi Markets platform. Projects on the top of the plot have received incentives and projects on the bottom have received no incentives. I retrieved incentive data from Wavteq's IncentivesFlow dataset. The red line represents a local linear regression that estimates the probability of receiving an incentive deal conditional on the log number of jobs that a project creates.
Constraints on the use of investment incentives
Selectivity in the disbursement of investment incentives suggests that politicians face constraints. Previous work has discussed multiple constraints that shape politicians’ investment incentive decisions. First, there are strategic and economic constraints. For instance, governments’ economic development priorities can influence the types of projects they want to attract and the types of incentives they want to put in place.Footnote 34 Second, politicians face limitations in terms of their political ability to disburse incentives and claim credit for them. Politicians have limited financial resources to fund incentives and limited time to publicly promote their involvement in the attraction of new FDI projects. Furthermore, they may face opposition from investment promotion bureaucrats that oppose the use of investment incentives to attract new businesses.Footnote 35 Third, firms vary in their bargaining strength. There are findings that suggest that politicians are more likely to hand out incentives when they have a weak bargaining position vis-à-vis investors. This may be the case when governments have to compensate for a risky investment environment or when a type of FDI project is very appealing to governments.Footnote 36
I argue that an overlooked constraint explaining the selective use of investment incentives is that politicians are concerned about backlash from voters. Anecdotally, investment incentives can become controversial topics that can cause protests from voters. Consider the reactions of residents in Grand Forks, North Dakota, to a new project by the Chinese animal feed company Fufeng. In 2021, Fufeng announced that it would invest $700 million in a new corn mill that would create 200 permanent jobs and 1,000 construction jobs.Footnote 37 The Grand Forks City Council supported the project with investment incentives that would give Fufeng a 90 percent discount on its local property taxes.Footnote 38 The project did not receive a warm welcome by Grand Forks residents.Footnote 39 People expressed concerns about the environmental impact of mill wastewater. Local farmers believed the incentive package would give the mill an unfair competitive advantage against them.Footnote 40 Moreover, people were concerned that the project could be a front for Chinese spy operations.Footnote 41 This strong opposition to the project from voters led to multiple investigations questioning the viability of the deal. Eventually, the city council was forced to reverse its incentive decision and stop the project from proceeding in February 2023.Footnote 42
This voter-based explanation requires that we reconsider how voters view investment incentives. Existing work assumes that voters implicitly or explicitly agree with politicians’ investment incentive decisions. This is in line with existing work that depicts voters as individuals who overestimate the utility of investment incentives.Footnote 43 There is the argument that voters generally perceive investment incentives as a desirable policy instrument because they aim to attract businesses.Footnote 44 This allows for the emergence of pandering with investment incentives. Another view is that due to international competition for private capital, voters may believe that investment incentives are necessary to attract businesses to their community. As a result, they do not critically challenge the need for investment incentives because they see it as the “price of doing business.”Footnote 45
I propose that voters do not fall for every incentive deal but have more nuanced views on incentives. One piece of evidence for this argument comes from public opinion data. When Foxconn, a Taiwanese electronics manufacturer, decided to invest $10 billion in southeastern Wisconsin to build a new factory complex that would create 13,000 jobs, the State of Wisconsin promised to give the company an incentive package worth approximately $4 billion. However, this deal was not supported by a majority of people in Wisconsin. A poll by Marquette University's Law School found that approximately 46 percent of Wisconsinites disapproved of the deal, while only 38 percent approved of it.Footnote 46 Another piece of evidence is that political challengers want to highlight bad incentive deals made by the incumbent. A good example of this is the debate that took place during the 2022 gubernatorial election in Michigan. Tudor Dixon, the Republican candidate, criticized the incumbent Democratic governor Gretchen Whitmer for giving a $846 million incentive package to Gotion, a Chinese car battery manufacturer. Dixon claimed, “Your taxpayer dollars should be used to make sure your kids are getting a world-class education, you have a reliable infrastructure, that you have safe cities, but now we're seeing taxpayer dollars go into an adversary, a Chinese corporation.”Footnote 47
Project quality and voter support for investment incentives
To fill the gap in our understanding of voter preferences toward investment incentives, I develop a simple theory explaining how voters evaluate incentive deals and how this affects the ability of politicians to increase their public support with the use of investment incentives.
Investment incentive approval depends on project quality
FDI projects vary along a dimension that I call project quality. Quality is the perceived effectiveness of an FDI project in promoting higher living standards in a community by voters.Footnote 48 Put simply, quality describes a project's capacity to improve people's lives. Not all FDI projects are equally effective in achieving that. For example, a data center in a rural town is unlikely to provide large-scale economic benefits because it requires specialized skills to maintain and operate data centers that few people in rural areas possess. In contrast, a project that takes over an old car manufacturing plant to build car windshields is more effective in providing economic benefits to a community since this investor can hire the people who previously worked at the car manufacturing plant.
The concept of project quality consists of two general components. The first component is the net economic benefits that a project will provide to the people in a community if a project is perfectly implemented.Footnote 49 People will benefit from an FDI project's stimulation of economic activity in a community. This includes the number and type of jobs that a project will create, tax revenue, and network effects, such as the colocation of suppliers. At the same time, people may suffer costs from negative externalities, such as environmental pollution, traffic, immigration, and rising prices, that diminish the economic benefits of a project. The higher the net benefits, the more likely it is that a project will be effective in elevating people's living standards.
The second component is a necessary condition for a project to have any economic impact on a community. An investor must be able to successfully implement a proposed project. FDI projects often come with great promise, but there are many instances in which they do not deliver.Footnote 50 Consider the Foxconn case in Wisconsin. As of December 2022, Foxconn “only” employed around 1,000 people.Footnote 51 While 1,000 employees is a significant number of jobs, there is a massive discrepancy between the announcement of 13,000 jobs and what Foxconn was able to deliver.
Project quality depends on the perception of voters.Footnote 52 Since there is not one objective assessor that assigns a quality grade to a project, voters must infer the quality from observed project characteristics. These characteristics serve as heuristic shortcuts to make predictions about FDI project quality. Voters may not be able to perfectly assess the costs and benefits of an FDI project, but using project characteristics, they can gauge the net economic gains for their community and the probability that a project will be implemented. For example, the number of jobs will give people information on the growth in economic opportunities that an FDI project will generate.
The main source of information for voters to learn about project characteristics are local media outlets. As recorded in a survey by Slattery, a majority of US residents state that they learn about incoming investment projects and the associated investment incentive deals from local news.Footnote 53 From these sources, voters can derive fundamental information about the investing company and type of the project. In addition, people may learn about the opinion of local political leaders and interest groups.
I argue that project quality affects voters’ level of support for investment incentive deals. All else being equal, I expect that voters are more likely to support investment incentives for high-quality than for low-quality FDI projects. Project quality feeds into the expected utility of an investment project. High-quality projects signal to voters that the expected benefits of attracting an FDI project with investment incentives will likely exceed the costs of the incentive deal. In contrast, when voters observe that a low-quality project receives an investment incentive deal, they can make two types of inferences. First, they can perceive it as wasteful government spending because it is likely that the tax dollars invested in incentive deals would have had a greater effect on other types of projects. Second, it can signal that the government misappropriates tax dollars for rents to corporations. In either situation, voters are worse off than if there was no project, as the costs of the incentives likely exceed the benefits.Footnote 54 Thus, voters should have more favorable views toward the use of incentives when governments award them to high-quality projects. This expectation is summarized as follows:Footnote 55
Hypothesis 1: Voters are more likely to approve investment incentives if an investment project is of high quality than of low quality.
Political returns of investment incentives
This argument has implications for the effectiveness of investment incentives as a policy instrument to pander to voters. According to Jensen and Malesky, the promise of incentives signals to voters that a politician is committed to policies that promote economic development.Footnote 56 Even if politicians are not successful in attracting investments, the act of promising incentives can avoid blame because it demonstrates to voters that politicians used all the instruments at their disposal to convince an investor. Similar to more general game-theoretic models of pandering,Footnote 57 the underlying assumption is that voters have a clear policy preference—that is, voters believe that investment incentives are an effective tool to promote economic development. The introduction of information about project quality changes the pandering dynamic.Footnote 58 When learning about quality, voters prefer politicians that differentiate between projects conditional on their quality. In other words, I expect that the signal that the use of investment incentives sends about a politician's ability differs between high- and low-quality FDI projects.
Consider first a scenario in which people observe a high-quality investment project. As outlined in the previous section, voters want these types of projects come to their community. As a result, they are more likely to approve of politicians who offer investment incentives to high-quality projects. By offering investment incentives, politicians demonstrate that they are in line with people's preferences and that they promote projects that voters deem effective in improving their livelihoods. Thus, following Jensen and Malesky, I expect that voters evaluate politicians more positively when politicians offer investment incentives to a high-quality project than when they offer no incentives to these projects.Footnote 59
Hypothesis 2: Among high-quality investment projects, voters will have more positive job evaluations of politicians if politicians offer investment incentives to investors than if they do not offer investment incentives.
In the alternative scenario in which citizens are exposed to low-quality investment projects, I contend that voters will punish politicians for giving investment incentives. The reason is that voters will realize that their elected officials endorse policies that are not aligned with their preferences. The act of supporting a low-quality FDI project sends the signal that a politician is not interested in promoting economic development but instead is more interested in helping corporations. Investment incentives in this context should attract more blame rather than diffuse blame. Thus, I hypothesize that politicians will have lower standing among voters if they offer incentives to low-quality investment projects compared to offering no incentives.
Hypothesis 3: Among low-quality investment projects, voters will have more negative job evaluations of politicians if politicians offer investment incentives to investors than if they do not offer investment incentives.
Research design
Setup
Since it is difficult to cleanly measure project quality in observational data, I test the three hypotheses in a survey experiment. The survey experiment targets adults living in the United States. I launched it on 21 January 2022, using Lucid Theorem, an online survey platform.Footnote 60 The sample includes 1,999 respondents and is relatively representative of the US population.Footnote 61 The main difference from the general US population is that the sample is skewed toward people earning less than the median income. Only 32.7 percent earn more than the US median income. In addition, the sample is slightly older than the US mean and more educated.Footnote 62 Otherwise, the sample closely resembles the national population on most other variables, such as party ID, gender, and race.
The survey experiment consists of two main tasks. After filling out a series of pre-treatment questions capturing demographics and views on tax incentives, participants are asked to walk through a conjoint experiment exploring which investment attributes matter to voters when assessing the quality of a project as well as their support for an incentive package. After the conjoint experiment, respondents complete a factorial survey experiment that follows the design by Jensen et al.Footnote 63 This second task aims to demonstrate the importance of quality for determining the political utility of investment incentives. Randomization for each experiment is independent from each other. Respondents took 9.2 minutes on average to complete the survey.
Conjoint experiment
The conjoint task follows the design described by Hainmueller, Hopkins, and Yamamoto.Footnote 64 I chose this type of survey design because it accounts for the multidimensional nature of the concept of quality, disentangles which project attributes are important to voters, and captures how people learn about investment incentives in the news. Each respondent must complete five tasks. In each task, they see one randomly generated investment project profile. I decided to present respondents with only one profile per task since people usually only see one investment project at a time in reality. In total, this design yields 9,995 respondent-profile observations. Each profile consists of ten different attributes. Every attribute contains a set of three project characteristics (levels). After a respondent completes a task, a new profile is generated by randomly picking one level per attribute. The dimensions of this conjoint experiment are well within the limits of what is recommended in the literature.Footnote 65
The attributes included in the profile consist of two groups. The first group of attributes presents contextual information about the type of investment. Specifically, respondents learn about the investor's country of origin, the investment's industry, and the type of investment.Footnote 66 These three attributes can inform people about a project's quality, but they are rather noisy pieces of information that may correlate with other considerations, such as national security concerns. For this reason, I do not place great emphasis on these three attributes to understand the effect of quality on investment incentive approval.
Instead, I put the main focus on the seven attributes listed in Table 1. These are basic pieces of information that are available to voters when a new project comes to a community. Some of this information can be read in the news. For instance, the investment size, the number of jobs, the size of the investor company, and the reputation of the investor are likely discussed in local media outlets. Information about wages, community endorsements from local interest groups, and the hiring of locals may be revealed to voters over time as the project is implemented or during town hall meetings where the company presents its vision for a project. These seven attributes directly relate to quality, as they affect the possible economic gains for a community and can inform voters about the credibility of an investor to successfully implement a project.Footnote 67
Table 1. Expectations on the effect of quality on tax incentive support

Following each investment project profile, people answer two outcome questions. First, to understand whether the described attributes are capturing the concept of quality, I ask respondents, “How likely do you think it is that this investment project will improve the living standards for you and your community?”
Second, to get at the core question of whether quality moderates the preferences of tax incentives, I ask the following outcome question: “If your local government had decided to give a reduction in property taxes to the investor to attract the investment, would you support the local government council's decision?” The answers to both questions are placed on a five-point Likert scale.Footnote 68 Table 1 describes how each quality attribute should affect the approval of the investment incentive decision.
Factorial survey experiment
The factorial experiment builds on the experiment by Jensen et al.Footnote 69 Respondents receive an information vignette that informs them that their municipality is competing for an investment project with other municipalities.Footnote 70 The vignette includes three distinct treatments with two levels. There are eight treatment groups in total. Each respondent is randomly assigned with equal probability to one of these eight treatments, which means that there are approximately 250 participants per treatment group.
Two of the three treatments are the same as in Jensen et al. Respondents learn about whether the investor decides to invest in their municipality or not. In addition, I inform respondents about the size of the incentive package. As in the original experiment, one group will read that the package offered by their local government council is larger than the packages of competing locations, and the other group will learn that the package was smaller.
The third treatment introduces project quality into the experiment. In the original experiment, respondents read that their government is competing for a generic manufacturing project. I deviate from this approach by showing people a table with the same project attributes as in the conjoint task.Footnote 71 To manipulate quality, I created two bundles of project characteristics that represent a high-quality and a low-quality project. The formation of these bundles was informed by theoretical considerations as well as preliminary results from a pilot conducted on 21 November 2021. The attribute bundle depicting the high-quality project is a factory built by a large and highly innovative German pharmaceutical company that will create many jobs and offer high wages to locals. The factory will only hire locals and is supported by the local small business association. The respondents assigned to the low-quality project condition see a bundle that describes a warehouse project by a logistics company from China with 1,000 employees. The company has a history of paying bribes to officials. The project will create 40 jobs and offer the same wages as domestic companies. The local small business association opposes this investment project.Footnote 72
The outcome measure of interest is how respondents evaluate the investment incentive decision by their local government. I ask respondents to rate the tax incentive decision on a scale from 0 to 10, where 0 is a terrible decision and 10 is a great decision. This measure deviates from Jensen et al., who ask respondents how likely it would be that they change their vote for the governor given the information presented. I opted for a more constrained measure that asks respondents to only evaluate the decision. While it is not identical to a voting decision, policy evaluations can affect vote choice.Footnote 73
Results
Effect of project quality on investment incentive decision approval
The first piece of evidence to assess the three hypotheses comes from the factorial experiment. Figure 2 describes the mean approval of the local government council's incentive decision conditional on the incentive package's size and the project's quality. Descriptively, the results in Figure 2 suggest support for two of the three hypotheses. First, as predicted in hypothesis 1, there is a large, significant drop in approval from high- to low-quality projects (6.39 [6.24, 6.55] versus 4.36 [4.18, 4.54]). Second, respondents express higher levels of approval when their local government council offers large investment incentives for high-quality projects than small incentives (6.61 [6.40, 6.82] versus 6.19 [5.97, 6.40]). Third, in contrast to the expectations in hypothesis 3, politicians are not punished for offering large investment incentives to low-quality projects (4.34 [4.07, 4.61] versus 4.38 [4.13, 4.63]).Footnote 74

Figure 2. Mean approval of investment incentive decision by treatment group. Figure shows the mean level of approval per treatment condition. The bar plot also includes the 95% confidence interval of each mean.
To formally test the three hypotheses, I run an ordinary least squares regression that includes two independent variables. An indicator of whether a large investment incentive was offered is denoted as II and an indicator of whether a respondent received a high-quality project is called Quality.Footnote 75

In model 1, i denotes an individual respondent, and Xi denotes a set of pre-treatment covariates. I run three confirmatory hypothesis tests with this model. These tests are formally defined as followFootnote 76:


The results of the regression analysis, displayed in Table 2, are in line with the descriptive evidence from Figure 2. I find that in the main specification including covariates, approval increases by 2.01 [1.77, 2.25] when giving investment incentives to high-quality projects. This coefficient is statistically significant (p < .001) even after correcting the p-value for multiple comparisons using the Holm correction. In line with Hypothesis 2, offering large investment incentives increases the approval of the local government council. The average treatment effect (ATE) of large investment incentives among high-quality projects on approval is 0.52 [0.21, 0.83] in the model with covariate adjustment. I do not find any evidence that large investment incentives produce backlash among low-quality projects. The ATE of investment incentives on approval in this subset of projects is −0.06 [−0.43, 0.30] and is statistically indistinguishable from 0.Footnote 77 This null result may be due to a floor effect—that is, people perceived the low-quality project as not worthy of any incentives because it is such a low-quality project. In that case, the effect of quality captures the backlash. A more “desirable” low-quality project may therefore solicit a backlash, as hypothesized in Hypothesis 3.
Table 2. Treatment effects of quality on approval

Notes: Table shows robust standard errors. Covariate adjustment includes the following variables: party ID, income, education, age, gender, tax incentive preferences, White dummy, Black dummy, and Hispanic dummy. The full results are presented in Table G.1 in Appendix G. ∗∗∗ p < .001; ∗∗ p < .01; ∗ p < .05.
I conduct several robustness tests to validate the results.Footnote 78 Since a relatively large share of respondents (43 percent) did not pass both attention check questions, I checked whether the results remained consistent after dropping individuals who did not pass the attention check questions.Footnote 79 Despite the smaller sample size, the results become even stronger. Additionally, I explored whether context effects matter. For instance, economic conditions can shape how people perceive investment incentives. To test this possibility, I compared the results between people who live in states that receive few and high FDI inflows. The findings suggest that FDI presence does not significantly affect the observed pattern in the main results. In both samples, respondents expressed higher support for investment decisions given to high-quality projects. This provides some reassurance that the findings describe general patterns across different contexts.
Exploratory analysis about whether politicians can claim credit for attracting an investment project and avoid blame if the investor invests in a different location strengthens the finding that people perceive investment incentives differently depending on the quality of a project.Footnote 80 I find that people tend to be more forgiving of the local government council when it tried to attract a high-quality investment with a large investment incentive package but the investment did not materialize. Similarly, people gave the local government council more credit when it attracted an investor with large tax incentives. However, when dealing with low-quality projects, investment incentives help neither to avoid blame nor to claim credit.
We can derive two main conclusions from these findings. First, providing any incentives to low-quality FDI projects immediately causes a decrease in approval. With a Cohen's d of 0.7, this is a substantially large effect. This implies that politicians face problems when they engage with low-quality projects independent of the size of the incentive package. Second, pandering to voters with investment incentives only works when dealing with high-quality projects. With a Cohen's d of 0.18, the political upside is, however, relatively small compared to picking the right project. In sum, if politicians believe that they encounter a high-quality project, they should offer the best deal possible.
Which project attributes affect support?
In the factorial survey experiment, I present respondents with a bundle of characteristics. This raises the question about the relative salience of each attribute within the bundle. I disentangle the relative effect of each quality attribute on investment incentive approval through the conjoint experiment. To analyze the conjoint experiment, I estimate the marginal means of each attribute level.Footnote 81 In contrast with the commonly used average marginal component effect (AMCE), marginal means present the average outcome for each attribute level averaged across all attributes and do not rely on an arbitrarily selected reference level. This makes it easier to interpret the result and less malleable to reference level selection.Footnote 82
Figure 3 describes the effects of each project attribute on respondents’ support for investment incentives.Footnote 83 Overall, there are two types of project characteristics that are important to people when considering the approval of investment incentives: (1) the effect of a project on the job market and (2) cues about the credibility of an investment. Both of these factors relate to the effectiveness of an incoming FDI project in improving people's living standards.
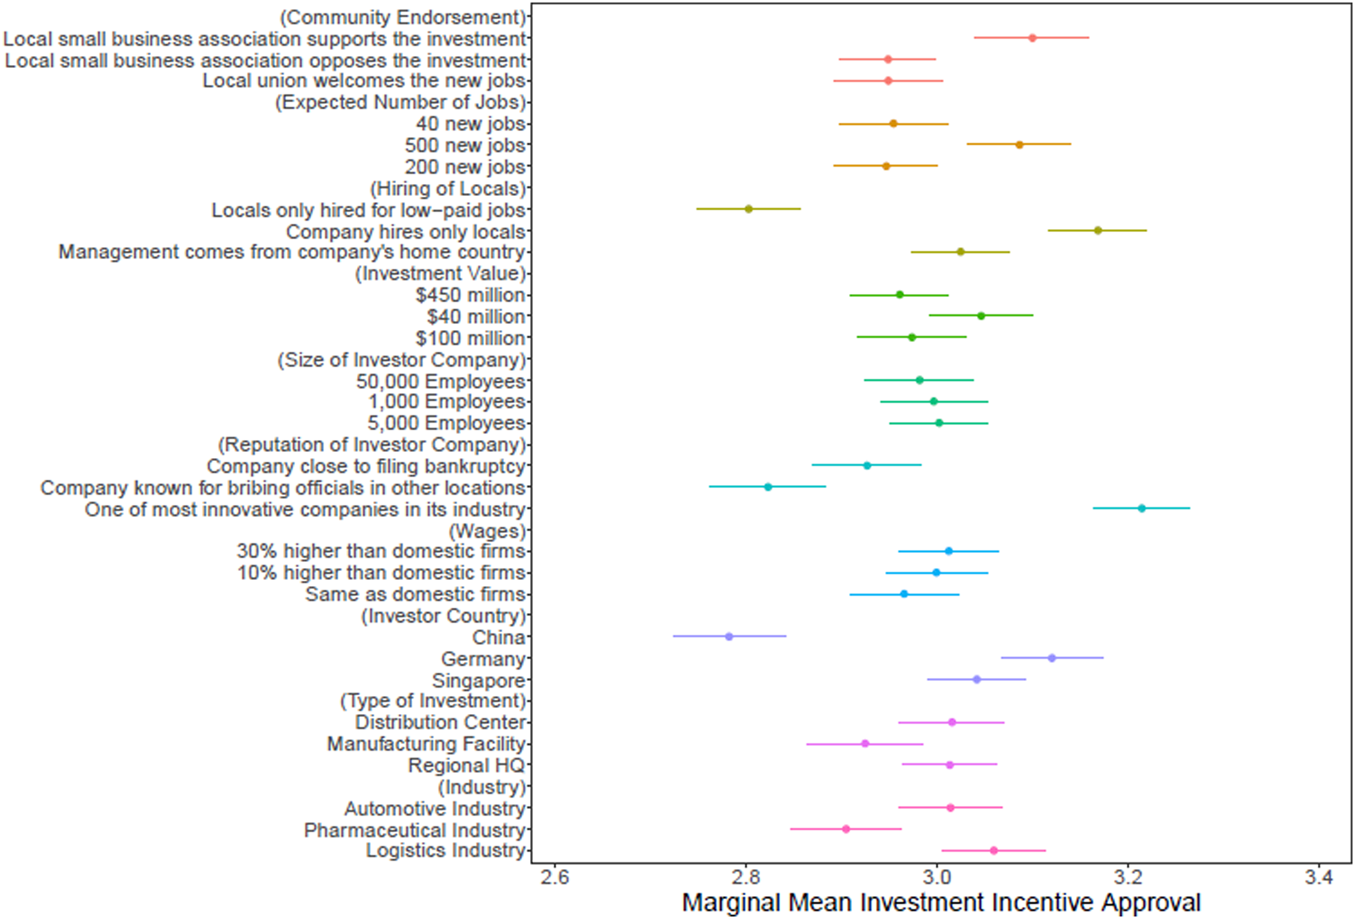
Figure 3. Effect of project quality on investment incentive support. The plot shows marginal mean estimates for each attribute. Each estimate is displayed with a 95% confidence interval with robust standard errors clustered by respondent.
When evaluating their support for investment incentives, people consider the type and number of jobs that a project creates. One of the strongest predictors of support for investment incentives is when a company promises to only hire locals (β = 3.17 [3.12, 3.22]). Support for investment incentives increases by 0.37 compared to projects in which locals are only hired for low-paid jobs. This is a 0.29 standard deviation increase in support.Footnote 84 A less salient but still significant factor is the number of jobs. There is stronger support for investment incentives when a project generates 500 new jobs (β = 3.09 [3.03, 3.14]) compared to only 200 (β = 2.95 [2.89, 3.00]) or 40 (β = 2.95 [2.90, 3.01]). The standardized effect size of 500 jobs vis-à-vis 200 jobs, however, is relatively small with 0.11. Surprisingly, the wage level at a new project does not strongly affect people's support for investment incentives. Average support for incentives to projects that offer 30 percent higher wages (β = 3.01 [2.96, 3.06] is very similar to the support for incentives to projects that offer the same wages as domestic companies (β = 2.97 [2.91, 3.02]). This suggests that people care about whether incentive deals promote projects in which a large share of the added value trickles down to the community. This is why the type of jobs is significantly more relevant to people than the number of jobs and the wage level.
In addition to jobs, people also care about indirect cues that provide information about potential negative externalities and the credibility of an investor. One of these cues is the investor's reputation. Reputation had the largest effect on respondents’ support for incentives. Respondents are significantly more likely to support investment incentives if the company is highly innovative (β = 3.21[3.16, 3.26]) than if it is involved in corruption (β = 2.82[2.76, 2.88]) or close to bankruptcy (β = 2.93[2.87, 2.98]). The standardized effect size between projects with innovative and corrupt investors is 0.31. The second cue that matters to respondents are positive endorsements from local small business associations (SBAs). I find a higher level of support for investment incentives (β = 3.1[3.04, 3.16]) if a local SBA supports a project than if there is opposition from local SBAs (β = 2.95[2.90, 3.00). With 0.12, the effect size is similar to the effect of a larger number of jobs.
Factors such as investment size and company size did not strongly affect the respondents’ level of support for incentives. There is no significant difference across the size of investors. Furthermore, respondents tend to weakly prefer smaller investments in terms of dollar value. One potential reason for this is that company size and investment volume do not provide respondents with much information on whether they can directly benefit from an incoming project. For instance, large investment volumes can be the result of capital investments, such as buying machinery, which do not yield direct benefits to locals. Additionally, the effect of large companies can cut both ways. Large companies may be more productive, which means they are more likely to generate high profits for the locality. However, productivity means that most locals will not benefit from the company because they are not qualified.
Among the remaining variables, we find some interesting results as well. It is important to note that these variables may also relate to other explanations in addition to quality, such as nationalism. First, an investor's country of origin plays a central role for respondents. People express strong objections to giving investment incentives to Chinese investments, whereas they are more supportive of investment incentives if given to German or Singaporean companies. This further confirms the unique nature of Chinese FDI across the world and the public's distrust in Chinese companies, as reported in previous studies.Footnote 85 Second, people are less likely to support incentives to projects that build manufacturing facilities compared to a headquarters or distribution center project and less likely to support incentives to companies from the pharmaceutical industry. I speculate that these attitudes may reflect people's concerns about environmental degradation in the case of manufacturing facilities and people's mistrust in drug companies.
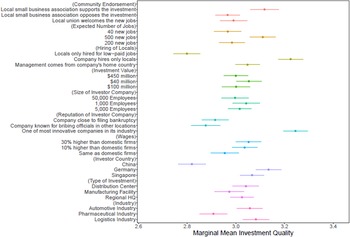
My argument suggests that these investment incentive preferences correlate with people's assessment of a project's quality. I evaluate this part of the argument using the second outcome question in the conjoint experiment, which asks respondents to rate the likelihood that a given project profile will have a positive impact on their living standards. The results displayed in Figure 4 show high congruence with the results in Figure 3. We can see that local SBA endorsements, company reputation, the number of jobs, and hiring practices are strong determinants of project quality. In contrast, there is not too much variation in perceived quality conditional on investment and company size.

Figure 4. Determinants of investment project quality. The plot shows marginal mean estimates for each attribute. Each estimate is displayed with a 95% confidence interval with robust standard errors clustered by respondent.
Do voter preferences affect investment incentive disbursements?
These results are important because according to my argument, voter preferences are among the various factors that affect politicians’ decisions to offer investment incentives. However, for this to hold, two central conditions need to be satisfied. First, voters need to have access to information that allows them to judge the quality of a project. Second, assuming that people have access to information and are able to infer the quality of a project, voters still need to act and hold their politicians accountable. While a thorough investigation of these two assumptions would exceed the scope of this article, this section provides evidence to bolster the experimental findings’ external validity.
Voters’ access to information
Voters are not informed about every possible incentive deal. Many deals are too small to make it into the local news. In some instances, the government may even want to undermine transparency by using code names to hide the identity of incentive recipient companies.Footnote 86 Nevertheless, voters should possess sufficient information about discretionary incentive deals that are locally salient, as these are likely discussed in the local news and may even lead to public town hall meetings. While these public discretionary incentive deals represent a limited number of deals, they still account for a large share of investment incentive spending. According to Slattery, around 20 firms received $6 billion in discretionary incentive deals by states in 2017, representing a third of these states’ economic development budget.Footnote 87
Empirically, there is survey evidence that people are not left in the dark about incentive deals but that they possess information about projects that involve discretionary incentive deals to make inferences about quality. Slattery conducted a survey in the United States probing people's knowledge about five investment projects that received discretionary incentive deals.Footnote 88 The first important finding is that people's knowledge about deals depended on their location. Respondents living in the county where the project was happening had far superior knowledge about the deal than people in the neighboring county. The second main result is that a large share of people from the county where the project was implemented could identify key characteristics of the project. Around 50 percent could correctly identify the investor company, and 12 percent could correctly identify the number of jobs promised by the investor. This suggests that the findings in this study can at least explain the local effects of investment incentives.
Voters’ reactions to support for low-quality projects
How do voters react to incentive deals that they perceive as bad deals? It is rare that voters will observe an incentive deal before the government reaches an agreement with an investor. However, voters can still exercise pressure in the post-deal period that can cause problems for politicians. In the past, we saw examples of two types of voter backlash. First, voters can express their discontent by voting for an incumbent politician. For instance, in the case of Foxconn in Wisconsin, some political pundits argued that the Foxconn deal was one of the reasons why Scott Walker lost his reelection bid in 2018.Footnote 89 The Foxconn case may be an outlier because it does not often occur that an incentive deal reaches the salience to be a state-level issue. Yet, we can still observe that deals perceived as low-quality by people can have a local electoral effect. Consider the Republican gubernatorial primary in Georgia in 2022. The challenger, David Perdue, criticized incumbent governor Brian Kemp for his incentive deal with Rivian, an electric truck manufacturer.Footnote 90 In 2021, Rivian announced an investment of $5 billion in Rutledge, Georgia, to build a new electric truck factory. Despite creating thousands of jobs, the investment has caused significant local protests. Perdue used these protests as an opportunity to highlight Kemp's mismanagement of taxpayer money. Even though Kemp won the primary election in a landslide by 51.9 percentage points, Kemp's margin of victory in the county where Rutledge is located was 7 percentage points smaller than his average margin of victory in rural counties in Georgia. These types of local effects can eventually be important in closer elections.
Second, voters can take actions that slow down the implementation of an investment. In situations in which voters encounter a perceived low-quality project, there is often collective action to stop the project through the legal system or protests. For example, in the case of Fufeng in Grand Forks, voters started a petition to demand a citywide vote and even filed a lawsuit when the city council rejected the petition.Footnote 91 These types of actions are costly to politicians. Politicians are forced to spend financial and political resources defending a deal. Local protests can delay projects and eventually dissuade companies from further investing. It could make a location less attractive for future investors. Even if an incentive decision does not negatively affect the electoral performance of a politician, politicians still want to avoid these types of costs.
Determinants of investment incentive decisions
If voters can impose costs on politicians, we should observe that their preferences are to some extent reflected in politicians’ investment incentive decisions. To test this, I analyze factors that affect the likelihood that an FDI project receives an incentive deal. I use the universe of greenfield FDI projects from 2010 to 2019 in the United States as reported by the fDi Market platform. I match this data with investment-incentive-level data from Wavteq's IncentivesFlow dataset.Footnote 92 Wavteq has one of the most comprehensive datasets on incentives across the globe. While the dataset is not without its flaws, Wavteq has good coverage of publicly discussed incentive deals. According to my theory, these are the deals most likely influenced by voter preferences. Overall, the dataset includes 11,318 projects representing around $408 billion in FDI inflows. A total of 7.8 percent of these FDI projects have received investment incentive deals based on the IncentivesFlow dataset.
I implemented a simple linear probability model in which I regressed a binary variable on whether a project received incentives on a set of project-specific covariates aligned with the variables from the conjoint, two county-level and three state-level variables.Footnote 93 The results are shown in Figure 5 and display similarities with the conjoint findings. First, the higher the number of new jobs that a project creates, the higher the chance of receiving an incentive deal. This is in line with the main result of the conjoint experiment that highlights that respondents were most concerned about jobs. Second, as in the conjoint experiment, larger projects in terms of investment value are not necessarily more likely to land an investment deal. In fact, an increase in investment value significantly reduces the probability of receiving an incentive deal. This is a surprising result given that “mega-projects” are an attractive target for credit claiming. Lastly, we can observe that country of origin is significantly correlated with disbursement of investment incentives. In line with the conjoint experiment, investors from Germany are more likely to receive investment incentives.

Figure 5. Determinants of FDI projects with incentive deals. Each estimate is displayed with a 95% confidence interval with robust standard errors clustered by state.
There are, however, a few findings that are inconsistent with the conjoint task. The experiment suggests that people are not fond of giving incentives to manufacturing projects. However, manufacturing is significantly correlated with a higher probability of receiving incentives. In fact, a manufacturing project is the strongest predictor of receiving incentives. The result on capital intensity is also interesting. Although it is not part of the experiment, it suggests that the receipt of incentives is not dependent on the value of capital investment but on whether an investor works in a sector that is highly capital intensive.Footnote 94 Both of these findings highlight that investment incentive decisions are multidimensional and involve not only the preferences of voters, but also economic calculations. Manufacturing projects, for instance, are worthwhile promoting because they can attract investments from suppliers and indirectly create jobs. Nevertheless, this analysis provides suggestive evidence that politicians anticipate what type of projects are perceived as high quality by voters and incorporate this in their investment incentive decision.
Conclusion
This work represents a first step toward understanding voter preference in the policy arena of investment incentives and its implications for the behavior of politicians in granting investment incentives. In contrast with previous work that assumes that voters encourage the use of investment incentives, I contend that voters have project-specific preferences. They want their politicians only to support projects that are of high quality—that is, projects that voters perceive to be effective in improving their community's living standards. Using a factorial survey experiment, I show that project quality affects people's approval politicians’ investment incentive decisions and limits the ability of politicians to use investment incentives as a policy to score political points with voters. Evidence from a conjoint experiment highlights that voters use information about jobs and indirect cues about an investor's credibility to assess the quality of an FDI project.
This study makes the important point that project quality matters to voters when assessing the support of investment incentives. Yet, there are limitations that future work is encouraged to address. The scope of this article is restricted to FDI projects. An extension of this study should also consider whether the logic applies to domestic firms. Voters may be more forgiving when handing out incentives to small domestic firms. Another study extension should consider expanding the dimensions of the conjoint experiment to also include non-economic externalities, such as environmental pollution, and to replicate the findings in countries outside the United States. A final consideration for future work is to elaborate the trade-off between quality and the costs of investment incentives. In other words, what are voters “willing to pay” for a project of high versus low quality?
The findings of this study have several policy implications that demand further scrutiny. First, the study highlights that high-quality FDI projects will yield greater political utility than others. This means that when analyzing the electoral effect of investment incentives, it is necessary to differentiate between high- and low-quality projects. Second, politicians have strong incentives to campaign for projects and manipulate people's beliefs about an investment's quality. This implication can be tested by analyzing how politicians claim credit for incoming FDI projects. Third, the findings imply that greater political accountability in the form of transparency can improve the allocation of government resources to more effective projects, which will ultimately benefit voters. Finally, the results highlight that the nationality of investors significantly influences support for incentives. It is, however, unclear why people's negative attitudes toward China, for instance, bias their assessment of FDI project quality? Is it because of the potentially inferior quality of Chinese investments, national security concerns, reciprocity, or xenophobia? Answers to these questions will also underscore whether transparency may be counter-productive because it can lead to cases in which nationality concerns overshadow the true quality of a project.
Competing interest
The author declares none.
Acknowledgments
I would like to thank Vincent Arel-Bundock, Ana Carolina Garriga, Danielle Jung, Eric Reinhardt, Miguel Rueda, Renard Sexton, Jason Yackee, and all participants at the 2022 Midwest Political Science Association Annual Conference, the 2022 American Political Science Association Annual Meeting, and the 2022 Joint IPE Conference of Austrian, German, and Swiss Political Science Associations for their invaluable comments on this article.
Supplementary material
To view supplementary material for this article, please visit https://doi.org/10.1017/bap.2023.20


 Open access