


Introduction
Organic farmers often rely on mechanical weed management, primarily soil tillage and cultivation (Bàrberi Reference Bàrberi2002; Lowry and Brainard Reference Lowry and Brainard2019; Peigné et al. Reference Peigné, Ball, Roger-Estrade and David2007; Teasdale et al. Reference Teasdale, Coffman and Mangum2007). However, tillage can lead to soil erosion and degrades soil health (Magdoff and Van Es Reference Magdoff and Van Es2021; Montgomery Reference Montgomery2012; Pimentel and Burgess Reference Pimentel and Burgess2013). In cover crop–based organic no-till soybean [Glycine max (L.) Merr.] production, cover crops are used to reduce weed germination and emergence (Mirsky et al. Reference Mirsky, Curran, Mortensen, Ryan and Shumway2009; Mischler et al. Reference Mischler, Curran, Duiker and Hyde2010; Vincent-Caboud et al. Reference Vincent-Caboud, Peigné, Casagrande and Silva2017). In this system, a fall-planted winter cover crop, often cereal rye (Secale cereale L.), is mechanically terminated in the spring with a roller-crimper to create a weed suppressive mulch on the soil surface (Ashford and Reeves Reference Ashford and Reeves2003; Mirsky et al. Reference Mirsky, Curran, Mortensen, Ryan and Shumway2009). Soybeans are no-till planted before cover crop termination or at the same time as cover crop termination part of a single-pass operation. Benefits of the system include increased soil health, weed suppression, and lower labor and fuel costs compared with tillage-based production (Ashford and Reeves Reference Ashford and Reeves2003; Davis Reference Davis2010; Mirsky et al. Reference Mirsky, Curran, Mortensen, Ryan and Shumway2009; Ryan et al. Reference Ryan, Curran, Grantham, Hunsberger, Mirsky, Mortensen, Nord and Wilson2011a, Reference Ryan, Mirsky, Mortensen, Teasdale and Curran2011b).
Cereal rye mulch has the potential to provide adequate weed suppression in organic, no-till planted soybean, depending on cereal rye management, environmental conditions, and weed infestation levels (Mirsky et al. Reference Mirsky, Curran, Mortensen, Ryan and Shumway2011; Ryan et al. Reference Ryan, Mirsky, Mortensen, Teasdale and Curran2011b). Previous research has focused on several aspects of cereal rye management, including planting and termination dates, seeding rates, cultivar selection, and fertilizer application (Crowley et al. Reference Crowley, Van Es, Gómez and Ryan2018; Mirsky et al. Reference Mirsky, Curran, Mortensen, Ryan and Shumway2009, Reference Mirsky, Curran, Mortensen, Ryan and Shumway2011, Reference Mirsky, Ryan, Teasdale, Curran, Reberg-Horton, Spargo, Wells, Wells, Keene and Moyer2013; Ryan et al. Reference Ryan, Curran, Grantham, Hunsberger, Mirsky, Mortensen, Nord and Wilson2011a, Reference Ryan, Caldwell, Crowley, Liebert, Menalled, Pelzer, Pickard and Wayman2021; Teasdale and Mohler Reference Teasdale and Mohler2000; Wells et al. Reference Wells, Brinton and Reberg-Horton2016). Studies that evaluated fall-planting dates found that planting cereal rye in late August to early September allows the crop to reach optimal biomass for weed suppression (more than 8,000 to 9,000 kg ha−1) at time of roller-crimping (Mirsky et al. Reference Mirsky, Curran, Mortensen, Ryan and Shumway2009, Reference Mirsky, Curran, Mortensen, Ryan and Shumway2011; Ryan et al. Reference Ryan, Caldwell, Crowley, Liebert, Menalled, Pelzer, Pickard and Wayman2021; Teasdale and Mohler Reference Teasdale and Mohler2000). In addition, seeding cereal rye between 135 to 269 kg ha−1, depending on planting date and location, can provide a thick stand in the spring, leading to cereal rye competition with early-emerging weeds and reduced weed biomass (Mirsky et al. Reference Mirsky, Ryan, Teasdale, Curran, Reberg-Horton, Spargo, Wells, Wells, Keene and Moyer2013; Ryan et al. Reference Ryan, Curran, Grantham, Hunsberger, Mirsky, Mortensen, Nord and Wilson2011a, Reference Ryan, Caldwell, Crowley, Liebert, Menalled, Pelzer, Pickard and Wayman2021). While mulch from a cereal rye cover crop can often effectively suppress weeds (Menalled et al. Reference Menalled, Pethybridge, Pelzer, Smith, DiTommaso and Ryan2021; Mirsky et al. Reference Mirsky, Ryan, Teasdale, Curran, Reberg-Horton, Spargo, Wells, Wells, Keene and Moyer2013; Ryan et al. Reference Ryan, Curran, Grantham, Hunsberger, Mirsky, Mortensen, Nord and Wilson2011a; Silva and Delate Reference Silva and Delate2017), suboptimal management can limit biomass production and weed suppression. Weeds that are not suppressed can compete with soybean for resources, reduce yield and quality, and complicate harvesting (Keene et al. Reference Keene, Curran, Wallace, Ryan, Mirsky, VanGessel and Barbercheck2017; Mirsky et al. Reference Mirsky, Ryan, Teasdale, Curran, Reberg-Horton, Spargo, Wells, Wells, Keene and Moyer2013; Silva and Delate Reference Silva and Delate2017; Teasdale and Mohler Reference Teasdale and Mohler2000). Therefore, supplemental weed management strategies are needed in cover crop–based organic no-till soybean (Mirsky et al. Reference Mirsky, Ryan, Teasdale, Curran, Reberg-Horton, Spargo, Wells, Wells, Keene and Moyer2013; Vincent-Caboud et al. Reference Vincent-Caboud, Peigné, Casagrande and Silva2017).
Planting soybean at a high density is a cultural weed management tactic that has been widely studied (DeBruin and Pedersen Reference DeBruin and Pedersen2008; Liebert and Ryan Reference Liebert and Ryan2017; Liebman et al. Reference Liebman, Mohler and Staver2001; Menalled et al. Reference Menalled, Pethybridge, Pelzer, Smith, DiTommaso and Ryan2021; Ryan et al. Reference Ryan, Curran, Grantham, Hunsberger, Mirsky, Mortensen, Nord and Wilson2011a, Reference Ryan, Mirsky, Mortensen, Teasdale and Curran2011b). Increased soybean density leads to faster soybean canopy closure, which reduces light penetration—both between and within soybean rows—and enhances crop–weed competition (Liebert and Ryan Reference Liebert and Ryan2017; Liebman et al. Reference Liebman, Mohler and Staver2001; Mohler Reference Mohler1996). Previous work has shown that seeding soybean above 500,000 pure live seeds ha−1 can provide maximum economic return in organic no-till soybean production (Liebert and Ryan Reference Liebert and Ryan2017; Menalled et al. Reference Menalled, Pethybridge, Pelzer, Smith, DiTommaso and Ryan2021), which is substantially greater than recommended seeding rates for conventional production (Cox et al. Reference Cox, Cherney and Sorrells2019; Menalled et al. Reference Menalled, Pethybridge, Pelzer, Smith, DiTommaso and Ryan2021). Disadvantages of seeding soybean at higher rates include higher production costs, increased potential for soybean lodging, and an increased risk of disease (Cooper Reference Cooper1971; Lee et al. Reference Lee, Renner, Penner, Hammerschmidt and Kelly2005; Liebert and Ryan Reference Liebert and Ryan2017)
Mowing between crop rows is a weed management practice used by farmers; however, research on interrow mowing is lacking (Abdulai and Clark Reference Abdulai and Clark2018; Donald Reference Donald2000). Interrow mowers often have individual mower units that are positioned between crop rows and directly cut weeds close to the soil surface. Donald (Reference Donald2000) suggested that interrow mowing can reduce soil erosion by not disturbing the soil surface and covering the soil with residue from cut weeds. Early work in soybean by Donald (Reference Donald2000) and Donald et al. (Reference Donald, Kitchen and Sudduth2001) demonstrated that the combination of interrow mowing and herbicides that were band-applied at planting could manage annual broadleaf weeds and increase yields compared with a weedy check. Field trial results in no-till soybean without herbicides showed that interrow mowing in combination with a cereal rye cover crop reduced weed biomass when compared with traditional tillage and cultivation (Abdulai and Clark Reference Abdulai and Clark2018). Researchers found that mowing twice during the critical period of weed control, the period of early crop growth when weed competition can cause yield loss, can substantially decrease weed biomass and prevent yield loss (Donald Reference Donald2000; Zimdahl Reference Zimdahl1980). This period for soybean occurs between growth stages V2 to V4, although this period may vary based on location and soil type (Eyherabide and Cendoya Reference Eyherabide and Cendoya2002). Management decisions, such as crop fertilization and seeding rates, could influence timing of mowing, as soybean canopy closure limits the ability to mow between rows (Donald Reference Donald2000).
Perennial and grass weeds may be more difficult to manage with mowing compared with annual broadleaf species. Abdulai and Clark (Reference Abdulai and Clark2018) reported that interrow mowing generally controlled broadleaf weeds better than grasses, likely because monocot species recover faster than dicot species following mowing operations due to the position of the meristems (Donald Reference Donald2000; Thompson Reference Thompson2005). Perennial weeds can be difficult to control, because many perennials quickly regrow by way of resources in storage organs (Mohler et al. Reference Mohler, Teasdale and DiTommaso2021). Farmers can manage perennial weeds by exhausting nutrient stores through repeated mowing, which forces weeds to allocate resources toward foliar regrowth rather than toward resource competition, storage organs, or seed production (Mohler et al. Reference Mohler, Teasdale and DiTommaso2021). Interrow mowers have recently become commercially available with the advent of the Row Shaver® (Row Shaver Systems, Great Bend, KS, USA) and the IRM-X4 Inter-Row Mower (R-Tech Industries, Homewood, MB, Canada).
Another physical weed management tactic is weed electrocution, a method patented in the late 1800s (Opp and Opp Reference Opp and Opp1952). The technology was investigated in sugar beets (Beta vulgaris L.) in the 1970s (Diprose et al. Reference Diprose, Fletcher, Longden and Champion1985; Rasmusson et al. Reference Rasmusson, Dexter and Warren1980; Vingneault and Benoît Reference Vigneault, Benoît, Vincent, Panneton and Fleurat-Lessard2001), and there has recently been renewed interest, likely due to the increase in herbicide-resistant weeds (Heap Reference Heap2023) and the development of new electrical weeding machines (Bloomer et al. Reference Bloomer, Harrington, Ghanizadeh and James2022; Lati et al. Reference Lati, Rosenfeld, David and Bechar2021; Lehnhoff et al. Reference Lehnhoff, Neher, Indacochea and Beck2022). The flow of electricity through a plant generates heat, which causes water molecules inside the plant vasculature to vibrate at a high intensity, resulting in damage to cell walls and destruction of tissues, ultimately leading to plant death (Lati et al. Reference Lati, Rosenfeld, David and Bechar2021; Vingneault and Benoît Reference Vigneault, Benoît, Vincent, Panneton and Fleurat-Lessard2001). Several studies have documented effective electric suppression of weeds under laboratory conditions (Bloomer et al. Reference Bloomer, Harrington, Ghanizadeh and James2022; Lati et al. Reference Lati, Rosenfeld, David and Bechar2021; Lehnhoff et al. Reference Lehnhoff, Neher, Indacochea and Beck2022; Şahin and Yalınkılıc Reference Şahin and Yalınkılıc2017). However, high capital costs, energy needs, and safety concerns have limited in-field experiments using electricity (Bond and Grundy Reference Bond and Grundy2001; Lehnhoff et al. Reference Lehnhoff, Neher, Indacochea and Beck2022; Rask and Kristofferson Reference Rask and Kristoffersen2007). Studies have reported high rates of weed necrosis when high voltage (<13 kV) was applied to weeds for several seconds (Diprose et al. Reference Diprose, Fletcher, Longden and Champion1985; Schreier et al. Reference Schreier, Bish and Bradley2022). Electric weed control studies have produced varied results, as weed response to electricity depends on weed morphology, age, and lignin content (Vingneault and Benoît Reference Vigneault, Benoît, Vincent, Panneton and Fleurat-Lessard2001). Weeds with a higher water content tend to be more susceptible to electricity, whereas weeds with woody stems are less susceptible (Moore et al. Reference Moore, Jennings, Monks, Boyette, Leon, Jordan, Ippolito, Blankenship and Chang2023; Schreier et al. Reference Schreier, Bish and Bradley2022). In addition, grass weed species tend to display fewer signs of damage, likely because of the morphology of the plants allowing them to evade prolonged contact with the electric boom (Schreier et al. Reference Schreier, Bish and Bradley2022).
Integrated weed management (IWM) is a systematic, proactive approach of using multiple weed management strategies to reduce the negative impacts of weeds while preserving ecological benefits of a cropping system (Riemens et al. Reference Riemens, Sønderskov, Moonen, Storkey and Kudsk2022; Storkey and Neve Reference Storkey and Neve2018). IWM seeks to manage weed communities in a way that will reduce selection for dominant weed species that may become resistant to a single weed management tactic (Liebman and Gallandt Reference Liebman, Gallandt and Jackson1997; Riemens et al. Reference Riemens, Sønderskov, Moonen, Storkey and Kudsk2022). Using a variety of weed management strategies also decreases risk; if one tactic fails, others may be able to fill gaps in weed management (Benaragama and Shirtliffe Reference Benaragama and Shirtliffe2013; Liebman and Gallant Reference Liebman, Gallandt and Jackson1997; Liebman et al. Reference Liebman, Mohler and Staver2001). Combining multiple tactics also has potential to lead to synergism, where weed management is achieved at a higher level than expected based on performance of a tactic in isolation (Liebman and Gallant Reference Liebman, Gallandt and Jackson1997; Swanton and Murphy Reference Swanton and Murphy1996).
Planting soybean at a high seeding rate, interrow mowing, and weed electrocution are weed management tactics that are compatible with cover crop–based organic no-till systems, as they create little disturbance of the cereal rye mulch. These strategies target weeds in the cropping system spatially and temporally, with the high seeding rate suppressing within-row weeds at planting, the interrow mower cutting between-row weeds in the middle of the season, and weed electrocution controlling weeds that grow above the soybean canopy later in the season. To the best of our knowledge, no other studies have tested these tactics in an organic no-till system as part of an IWM program. To this end, an experiment was conducted in a cover crop–based, organic no-till soybean system to determine whether three weed management tactics (high soybean seeding rate, interrow mowing, and weed electrocution) used independently and in combination would affect weed biomass, weed community structure, and soybean yield. We hypothesized that the combination of all three tactics would result in the lowest weed biomass and greatest soybean yield. Costs of weed management tactics were also assessed to estimate their impact on profitability.
Materials and Methods
Study Site and Experimental Design
The experiment was established at the Cornell University Musgrave Research Farm in Aurora, NY, USA (42.73°N, 76.66°W) from 2020 to 2022. The soil in the fields used for this experiment was a Honeoye (fine-loamy, mixed, semiactive, mesic Glossic Hapludalfs) and Lima (fine-loamy, mixed, semiactive, mesic Oxyaquic Hapludalfs) silt loam. Soil conditions and field history can be found in Table 1. The experiment was repeated in five fields with different cereal rye mulch levels ranging from 0 to more than 10,000 kg ha−1. All fields were managed without the use of herbicides to simulate the constraints imposed under organic management. Two fields without cereal rye (Fields 1c and 2b) were left in a bare winter fallow until soybean planting and were used to represent a scenario with insufficient mulch for weed suppression. Three fields (Fields 1a, 1b, and 2a) were planted with cereal rye in autumn. Cereal rye ‘Aroostook’ was planted in Field 1a and cereal rye ‘ND Gardner’ was planted in Fields 1b and 2a (Albert Lea Seed, Albert Lea, MN, USA; Table 1). Before cereal rye planting in autumn, all fields were tilled with a moldboard plow, followed by cultivation with disk and rolling harrow and a cultimulcher. Cereal rye was planted on September 29, 2020, and October 13, 2021, using a John Deere® 1590 no-till drill (John Deere, Moline, IL, USA) at 168 kg (3 million) pure live seeds ha−1 with 19-cm row spacing. Fields 1a and 1b received 1,121 kg product ha−1 of Kreher’s 5-4-3 fertilizer (Kreher’s Family Farm, Clarence, NY, USA) at cereal rye planting. Field 2a did not receive fertilizer, because the previous crop was red clover (Trifolium pratense L.), which provided adequate fertility for cereal rye establishment (Table 1).
Table 1. Field specifications, history, experiment operations, and sampling events of soybean weed integrated management experiment 2021 and 2022. a
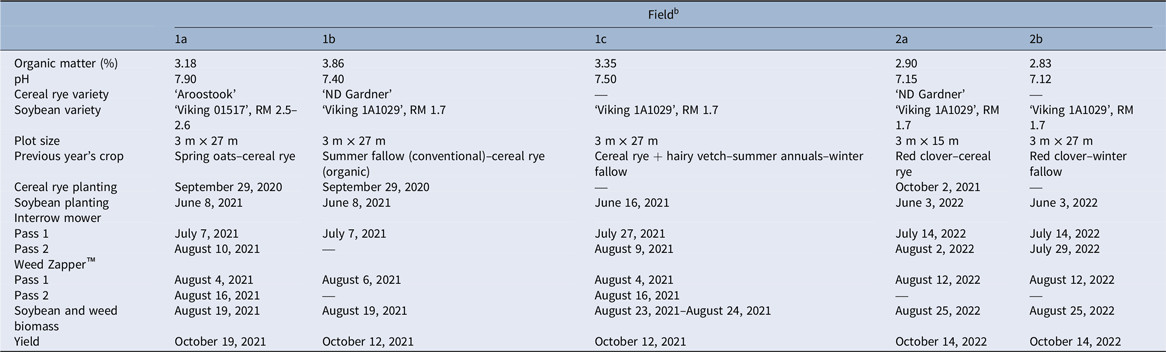
a Cereal rye planting, soybean planting, interrow mowing, and weed electrocution are field operations. Soybean and weed biomass, and yield are sampling events.
b Spring oats, Avena sativa L.; hairy vetch, Vicia villosa Roth; summer annuals: black bean, Phaseolus vulgaris L.; corn, Zea mays L.; soybean; sunflower, Helianthus annuus L.; and sorghum, Sorghum bicolor (L.) Moench. RM, relative maturity (months).
Cereal rye was terminated at anthesis on June 8, 2021, and June 3, 2022, with a 3-m-long, water-filled I&J crop roller (I&J Manufacturing, Gordonville, PA, USA) weighing approximately 1,195 kg. Soybean was planted with a four-row (76-cm width) John Deere® 1755 planter (John Deere) as part of single-pass operation at rolling in fields with cereal rye (Fields 1a, 1b, and 2a) (Table 1). The planter was modified for no-till planting into cover crop mulch, with hydraulic downforce, double disk openers before the planting tube, a seed-firmer behind the seed tube, and cast-iron notched closing wheels (Ryan et al. Reference Ryan, Caldwell, Crowley, Liebert, Menalled, Pelzer, Pickard and Wayman2021). Fields without cereal rye (Fields 1c and 2b) were disked and cultimulched before soybean planting, but no secondary cultivation (i.e., tine weeding, rotary hoeing, or interrow cultivation) was used after soybean establishment (Table 1). The baseline soybean seeding rate was 432,000 pure live seeds ha−1. A spatially balanced randomized complete block design was used with four blocks in each field. Each block had nine treatment plots. Minimum plot size was 3 by 15 m (Table 1).
Treatments
Nine experimental treatments were compared: (1) nontreated control, (2) high soybean seeding rate (SR), (3) interrow mower (IM), (4) Weed Zapper™ (WZ), (5) SR + IM, (6) SR + WZ, (7) IM + WZ, (8) SR + IM + WZ, and (9) weed-free (WF). The high seeding rate (SR), and all treatment combinations that included SR, were planted at a density of 680,000 pure live seeds ha−1. The SR was chosen to be slightly above the organic, no-till recommended feed-grade soybean rate (530,000 pure live seeds ha−1) (Menalled et al. Reference Menalled, Pethybridge, Pelzer, Smith, DiTommaso and Ryan2021), while minimizing risk of soybean lodging and disease at high rates (Cooper Reference Cooper1971; Mohler et al. Reference Mohler, Teasdale and DiTommaso2021). The baseline seeding rate (432,000 pure live seeds ha−1) is closer to rates used in tillage-based organic production (370,500 seeds ha−1) (Cox et al. Reference Cox, Cherney and Sorrells2019; Delate et al. Reference Delate, McGuire, Lenahan and Sailer2003), although the baseline rate may be considered a high rate compared with recommended seeding rates for conventional production (296,000 to 345,000 seeds ha−1) (Conley and Santini Reference Conley and Santini2007; Rees et al. Reference Rees, Thompson, Stepanović, Luck and Mueller2019).
The IM treatment was applied using an IRM X4 system (R-Tech Industries, Homewood, MB, Canada), which has five individual mower units that mow between soybean rows (Figure 1). The IM mower was attached to the front of a John Deere® 5100R tractor with a three-point hitch. Each mower unit was powered with a hydraulic motor system that spins four swing blades attached to a central disk at 1,800 rpm. The individual mower units have shields to protect crops from the blades that are narrow at the top and extend outward at the bottom to a width of 56 cm. Cutting height is adjustable, ranging from 5 to 18 cm above the soil surface. The interrow mower was used twice each year when weeds were at least 15 cm above the cereal rye mulch and before the soybean canopy formed. Cutting height was adjusted during operations to target weeds of different heights. In 2021, mowing occurred on July 20 (1a, 1b) and July 27 (1c) for the first pass and August 9 (1c) and August 10 (1a) for the second pass (Table 1). Field 1b did not receive a second pass in 2021 because there were almost no weeds growing through the mulch to be targeted by the interrow mower. In 2022, the first mowing occurred on July 14 and the second mowing occurred on July 29 (2b) and August 2 (2a) (Table 1). Soybean growth stages ranged from V2 to V5 at times of mowing. The tractor traveled at 2.7 km h−1 for all passes.

Figure 1. The interrow mower used in this experiment, attached to a John Deere® 5100R tractor with a three-point hitch. The mower is powered with a hydraulic system and was custom made by IRM X4, R-Tech Industries (Homewood, MB, Canada).
The WZ treatment was applied using a 6R30 Weed Zapper™, which uses a rear-mounted power take-off (PTO)-powered generator to generate and deliver electricity to weed plants through a front-mounted copper boom (6R30 Weed Zapper™, Old School Manufacturing, Sedalia, MO, USA) (Figure 2). The machine is commercially available and is used by farmers in the United States. The generator can produce up to 200,000 W of electricity and 225 and 275 A. The WZ system was attached to a John Deere® 5100R tractor using a front and rear three-point hitch. The boom was trimmed to a 3-m length for compatibility with width of experimental plots. The generator has a PTO shaft that is attached to the tractor and approximately 7,500 W of tractor power is needed for every 30 cm of electrified boom width. The copper boom was positioned above the soybean canopy using a hydraulic top-link control to target weeds that grow taller than the crop canopy. In this experiment, the “broadleaf” setting was used for all passes, which is the recommended setting for the first pass and for all weeds that are approximately 0.6 m or taller. The tractor traveled at a speed of 2.7 km h−1, and boom height was adjusted during treatment application to contact weeds of differing heights above the soybean canopy. In 2021, electric weed control treatments were applied on August 4 (1a, 1c) and August 6 (1b) for the first pass and August 16 for the second pass (Table 1). Field 1b did not receive a second pass in 2021, because there were almost no weed species growing through the mulch to be targeted by the Weed Zapper™. In 2022, electric weed control treatments occurred on August 12. No second pass was performed in 2022 in any fields, because heavy rainfall precluded timely weed electrocution operations and subsequent soybean canopy closure risked excessive soybean damage from Weed Zapper™ operations.

Figure 2. The model 6R30 Weed Zapper™ used in this experiment. The generator is attached to the back of a John Deere® 5100R tractor with a three-point hitch. The 4.6-m electric copper boom is attached to the front of the tractor with a three-point hitch. The Weed Zapper™ was purchased from Old School Manufacturing (Sedalia, MO, USA).
For the weed-free (WF) treatment, a 3 by 4.5 m microplot was randomly established within each WF plot at soybean planting and was hand weeded on a weekly basis until soybean canopy closure. All data collected in the WF treatment were collected from within the microplot area.
Data Collection
Aboveground cereal rye and weed biomass were sampled at the block level (n = 4) in each field on June 4, 2021, and May 31, 2022, before termination of cereal rye with a roller-crimper. Samples were taken to characterize fields before treatment implementation. At a random location within each block, one 0.76 by 0.66 m quadrat was placed to encompass four cereal rye rows. All stems rooted in the quadrat were clipped at soil level and separated by species. All samples were dried at 55 C for 7 to 10 d, and their dry weight recorded.
Aboveground soybean and weed biomass were sampled at the plot level on August 19 (1a, 1b), August 23 (blocks 1 and 2, 1b), and August 24 (blocks 3 and 4, 1b) in 2021 (Table 1). In 2022, biomass was sampled on August 25. In 2021, biomass was sampled 9 to 14 d after the last mowing event and 3 to 8 d after the last weed electrocution event. In 2022, biomass was sampled 23 to 27 d after the last mowing event and 13 d after weed electrocution (Table 1). Differences in sampling dates relative to treatment application was due to weather constraints. Soybean stands were consistent within each plot. At a random location within each plot, one 0.76 by 0.66 m quadrat was placed with the 0.76-cm side perpendicular over either the second or third soybean row, with the 0.66-cm edge of the quadrat flush against the soybean row. Within each quadrat, soybean plants with pods were clipped at the soil surface and counted. Within the same quadrat, weed biomass was clipped and separated by species. Samples were placed in separate bags and dried at 55 C for at least 10 d. Rows 1 and 4 were avoided during sampling to reduce edge effects on data.
Specific guidelines were followed when sampling weed biomass in any treatment that included WZ. Any weed that had a main stem that was still green (live tissue) and was flowering or producing seed after electrocution was collected for total weed biomass, even if that weed had originally been electrocuted.
Soybeans were sampled to quantify yield on October 12 (1b, 1c) and October 19 (1a) 2021, and October 14, 2022, approximately 5 d after 95% of pods were brown and dry with no green or yellow leaf tissue left on plants (Table 1). Two 1-m row lengths were randomly sampled: one from row 2 and the other from row 3. Soybean plants from both rows were clipped at the soil surface and placed in a single canvas bag. Samples were dried at 55 C for 10 d and then threshed with a Wintersteiger LD 350 (Wintersteiger, Salt Lake City, UT, USA) to separate seeds from pods. Seeds were weighed immediately after threshing. Yield data were adjusted to 13% moisture.
Statistical Analysis
All statistical analyses were carried out using R software v. 4.1.2 (R Core Team 2022). Soybean density, weed biomass, soybean yield, weed species richness, and Pielou’s evenness (Pielou Reference Pielou1966) were analyzed. Weed biomass was separated into total, monocot, dicot, annual, and perennial biomass data, and the TRY plant trait database was used to classify weed traits (Kattge et al. Reference Kattge, Bönisch, Díaz, Lavorel, Prentice, Leadley, Tautenhahn, Werner, Aakala, Abedi, Acosta, Adamidis, Adamson, Aiba and Albert2020). All response variables were described with separate linear mixed models (Bates et al. Reference Bates, Maechler, Bolker and Walker2015) that included treatment as a fixed effect and field and block nested within field as random effects. The weed-free treatment was removed from each analysis apart from soybean yield, because weed biomass was less than 5 g m−2 in all plots and would result in almost no variance. The model residuals for all weed biomass variables (total, monocot, dicot, annual, perennial) violated the assumption of homogeneity of variance. All weed biomass models were log(x + 1) transformed to correct for assumptions of normality and homogeneity of variance and to account for zeros in the data. After confirmation of model fit, fixed effects were assessed with a type III ANOVA test. Treatment levels were compared with least-squares means comparisons using Fisher’s LSD test (Lenth Reference Lenth2022). However, arithmetic means from untransformed data and standard errors are used for presentation in graphics and text. The ggplot2 package was used for all graphics (Wickham Reference Wickham2016).
For each field, the four blocks were pooled, and the average weed biomass for each individual species in each treatment was determined. The average individual species biomass was divided by the average total weed biomass for each treatment. The result was a number that indicates the percent biomass of a particular species in each treatment. The weed species that made up the top 70% of the average total weed biomass were labeled as dominant species and recorded (Table 2).
Table 2. Percent biomass of dominant weed species in all treatments, split by field and averaged across all blocks.

a %B, percent biomass; B, biomass (g m−2); Total, sum of %B and B of individual species in each treatment. Only weed species that make up at least 70% of the average total weed biomass per treatment are reported. Weed species are identified using EPPO codes: ACCVI, Acalypha virginica L.; AMBEL, Ambrosia artemisiifolia L.; ANGAR, Anagallis arvensis L.; ARISE, Arenaria serpyllifolia L.; CERVU, Cerastium vulgatum L.; CHEAL, Chenopodium album L.; HIBTR, Hibiscus trionum L.; MEDLU, Medicago lupulina L.; MEDSA, Medicago sativa L.; PLAMA, Plantago major L.; POAAN, Poa annua L.; POLCO, Polygonum convolvulus L.; POLPE, Polygonum persicaria L.; SECCE, Secale cereale L.; SETFA, Setaria faberi Herrm.; SETIT, Setaria italica (L.) P. Beauv.; SETPU, Setaria pumila (Poir.) Roem. & Schult.; SETVI, Setaria viridis (L.) P. Beauv.; SINAR, Sinapis arvensis L.; SONAR, Sonchus arvensis L.; STEME, Stellaria media (L.) Vill.; TAROF, Taraxacum officinale F.H. Wigg.; TRFCA, Trifolium campestre Schreb.; TRFPR, Trifolium pratense L.; VICVI, Vicia villosa Roth.
b NC, nontreated control; SR, seeding rate; IM, interrow mower; WZ, Weed Zapper™.
Species richness and Pielou’s evenness indices were calculated with the vegan package (Oksanen et al. Reference Oksanen, Simpson, Blanchet, Kindt, Legendre, Minchin, O’Hara, Solymos, Stevens, Szoecs, Wagner, Barbour, Bedward, Bolker and Borcard2022) to assess weed community diversity by treatment. Species richness (S) represents the number of unique species in a given community and Pielou’s evenness (J) is an indicator of biodiversity that accounts for the relative species abundance in each weed community (Pielou Reference Pielou1966). Species richness was calculated as the number of weed species per 0.5-m2 quadrat in each plot. Pielou’s evenness (J) was calculated from biomass data as:
 $J = H'/{\rm ln(S)} $
where S is the total number of species in the treatment, and H′ is Shannon’s diversity index value. Species evenness is constrained between 0 and 1, with 0 being no evenness (all biomass is from a single species), and 1 being complete evenness (all species having equal biomass in a community) (Pyron Reference Pyron2010).
Results and Discussion
Temperature was similar during both site-years; however, precipitation was above the 30-yr average for most of the growing season in 2021 and below the 30-yr average in 2022 (Figure 3). Cereal rye biomass averaged 7,913 ± 426.6 kg ha−1 in Field 1a, 10,165 ± 440.4 kg ha−1 in Field 1b, and 7,255 ± 349.8 kg ha−1 in Field 2a. Cereal rye biomass of 8,000 kg ha−1 is recommended to maximize weed suppression (Mirsky et al. Reference Mirsky, Ryan, Teasdale, Curran, Reberg-Horton, Spargo, Wells, Wells, Keene and Moyer2013; Silva and Delate Reference Silva and Delate2017). Before soybean planting, weed biomass averaged 70.4 ± 32.1 kg ha−1 in Field 1a, 17.1 ± 4.1 kg ha−1 in Field 1b, and 27.3 ± 9.7 kg ha−1 in Field 2a. Fields without cereal rye (1c and 2b) had no weed biomass before soybean planting due to tillage. Presence or absence of cereal rye did not differentially affect results; therefore, fields were pooled for all variables.

Figure 3. Monthly temperature and precipitation in Aurora, NY, USA, in 2021 and 2022. Pink lines indicate 30-yr average.
Soybean Density
Soybean density was quantified after treatments were imposed to (1) confirm that the high seeding rate treatment was successful in achieving a higher soybean density and (2) to determine whether soybean density was affected by interrow mowing or weed electrocution. As intended, soybean density was higher in treatments that included the high seeding rate (P < 0.001) (Figure 4). IM and WZ treatments did not impact soybean density relative to the nontreated control (Figure 4). Across fields, the baseline seeding rate (432,000 pure live seeds ha−1) in the nontreated control treatment resulted in 30.8 plants m−2 (308,000 plants ha−1) and the SR treatment (680,000 pure live seeds ha−1) resulted in 46.0 plants m−2 (460,000 plants ha−1). Soybean densities were slightly lower than expected, with 71% percent plant emergence for the baseline rate and 68% plant emergence for the high seeding rate. Lower percent emergence could have been the result of inadequate seed placement through cereal rye mulch, inconsistent seeding depth, low soil moisture impacting germination in 2022, or intraspecific competition between soybean plants (resulting in self-thinning) (Fehr et al. Reference Fehr, Burris and Gilman1973; Klimek-Kopyra et al. Reference Klimek-Kopyra, Bacior, Lorenc-Kozik, Neugschwandtner and Zając2021; Liebert and Ryan Reference Liebert and Ryan2017; Mirsky et al. Reference Mirsky, Ryan, Teasdale, Curran, Reberg-Horton, Spargo, Wells, Wells, Keene and Moyer2013). Other soybean seeding rate experiments in organic no-till systems have also reported reduced plant establishment at high seeding rates (Liebert and Ryan Reference Liebert and Ryan2017; Menalled et al. Reference Menalled, Pethybridge, Pelzer, Smith, DiTommaso and Ryan2021).

Figure 4. Soybean density in August after all weed management treatments were applied. Data were pooled across all site-years. Similar letters above bars indicate no significant difference using Fisher’s LSD test (P > 0.05). Error bars are standard errors, and treatments are abbreviated: NC, nontreated control; SR, seeding rate; IM, interrow mower; WZ, Weed Zapper™.
Weed Biomass
End-of-season weed biomass in nontreated control plots ranged from 4 g m−2 (Field 1b) to 284 g m−2 (Field 1c), and weed biomass differed among treatments (P < 0.001). The high seeding rate treatment (SR) did not decrease weed biomass (Figure 5). Although increasing crop seeding rate can be an effective cultural weed management practice, as increased soybean densities lead to increased soybean leaf cover (Yelverton and Coble Reference Yelverton and Coble1991) and light competition with weeds within the crop row (Liebman et al. Reference Liebman, Mohler and Staver2001; Mohler et al. Reference Mohler, Teasdale and DiTommaso2021), the effect largely depends on the baseline rate. This is because crop–weed competition relationships are hyperbolic, such that the greatest decrease in weed biomass (y axis) occurs with an initial increase in seeding density (x axis). As seeding rate increases, the proportional reduction in weed biomass decreases as light interference and competition from soybean is maximized (i.e., diminishing returns on the investment in higher seed density) (Menalled et al. Reference Menalled, Pethybridge, Pelzer, Smith, DiTommaso and Ryan2021; Steckel and Sprague Reference Steckel and Sprague2004). Thus, the baseline seeding rate may have already been providing a high level of weed suppression; however, this was not verified, because a no-soybean treatment allowing for maximum weed growth was not included in the experiment.

Figure 5. Weed biomass in each weed management treatment pooled across all site-years. Biomass was sampled in mid-August after all management tactics had been applied. Similar letters above bars indicate no significant difference using Fisher’s LSD test (P > 0.05). Error bars are standard errors, and treatments are abbreviated: NC, nontreated control; SR, seeding rate; IM, interrow mower; WZ, Weed Zapper™.
When used alone, the interrow mower reduced weed biomass by 60% compared with the nontreated control (Figure 5). In both years of the experiment, at least one mowing event occurred during the critical period of weed control (i.e., V2 to V4 stage of soybean), when weeds were most likely to negatively impact soybean growth (Eyherabide and Cendoya Reference Eyherabide and Cendoya2002; Liebman et al. Reference Liebman, Mohler and Staver2001; Table 2). After the first mowing event, weeds likely allocated resources toward foliar regrowth, which was then mowed again. The second mowing likely limited the ability of the weeds to acquire resources and produce more biomass (Mohler et al. Reference Mohler, Teasdale and DiTommaso2021). Personal observations indicated that the interrow mower directly reduced the biomass of weeds within the 56-cm width of each individual mowing unit, a distance that was 74% of the 76-cm row spacing. Weeds that grow farthest from the soybean canopy, such as those between crop rows, tend to produce the highest biomass, because they are not shaded by the soybean crop until late in the season and can thus capture soil nutrients that may not be as accessible to the crop (Barnes et al. Reference Barnes, Jhala, Knezevic, Sikkema and Lindquist2018; Korres et al. Reference Korres, Norsworthy and Mauromoustakos2019; Mohler et al. Reference Mohler, Teasdale and DiTommaso2021; Monks and Oliver Reference Monks and Oliver1998; Willard et al. Reference Willard, Griffin, Reynolds and Saxton1994). In this experiment, the interrow mower removed a large proportion of weeds in the area between rows, which could explain the substantial reductions in weed biomass after interrow mowing compared with other treatments where interrow mowing did not occur. Visual observations indicated that late-emerging weed species produced some regrowth after the second mowing event, which contributed to the weed biomass recorded for the interrow mowing treatments. In addition, the interrow mower chopped the cereal rye mulch during operations in fields where cereal rye biomass experienced lodging and was not rolled flat (Fields 1a and 2a). The cut mulch did not impede interrow mower operations; however, observations indicated cut mulch led to increased cereal rye reseeding in mowed treatments in September and October due to mature inflorescence at time of cereal rye termination.
When used alone, weed electrocution did not reduce weed biomass compared with the nontreated control (Figure 5). The Weed Zapper™ requires a large height differential (>30 cm) between the top of the soybean canopy and the top of a weed to effectively electrocute the unwanted plant (Schreier et al. Reference Schreier, Bish and Bradley2022; Vigneault and Benoît Reference Vigneault, Benoît, Vincent, Panneton and Fleurat-Lessard2001). In both years, visual observations indicated that few weeds grew at least 30 cm above the soybean canopy before canopy closure. Several weeds reached heights greater than or equal to 30 cm above the canopy after the canopy closed, when the Weed Zapper™ could no longer travel through the field without damaging soybean. In regions that have higher populations of tall weed species that grow faster than the crop, such as giant ragweed (Ambrosia trifida L.) or Amaranthus spp., the Weed Zapper™ would likely be more effective.
No support was observed for the hypothesis that combinations of tactics would improve weed management. When additional tactics were added to interrow mowing, weed biomass was not reduced further compared with the interrow mower when used alone (60% compared with the nontreated control) (Figure 5). Success of multi-tactic weed management has varied in no-till systems. Snyder et al. (Reference Snyder, Curran, Karsten, Malcolm, Duiker and Hyde2016) found that an IWM program with delayed cover crop termination, herbicide banding, and high-residue cultivation did not reduce weed biomass or increase soybean yield compared with a continuous tillage and full herbicide use program. However, Ryan et al. (Reference Ryan, Mirsky, Mortensen, Teasdale and Curran2011b) reported that combining the cultural practices of increased cereal rye biomass and high soybean planting density in organic no-till systems reduced weed biomass compared with standard practices of no mulch and conventional seeding rates. It is likely that the method of weed management (i.e., mechanical, chemical, or cultural practices) and the weed communities in a particular site-year can influence multi-tactic management outcomes (Cordeau et al. Reference Cordeau, Baudron, Busset, Farcy, Vieren, Smith, Munier-Jolain and Adeux2022) Mirsky et al. Reference Mirsky, Ryan, Teasdale, Curran, Reberg-Horton, Spargo, Wells, Wells, Keene and Moyer2013; Mohler Reference Mohler1996).
Weed Community
Species evenness, but not richness, differed (P < 0.05) in response to treatments. The treatment that combined all three weed management tactics (SR + IM + WZ) had a higher species evenness index (0.74) than the nontreated control (0.63) (Figure 6). The observation of a weed community with greater evenness emerging after multiple weed management tactics were used is likely because a combination of stressors had a higher likelihood of targeting dominant weed species’ traits (Cordeau et al. Reference Cordeau, Baudron, Busset, Farcy, Vieren, Smith, Munier-Jolain and Adeux2022; Liebman and Gallandt Reference Liebman, Gallandt and Jackson1997). However, the combination of SR + WZ had the same species evenness as the nontreated control. Thus, the different combinations of weed management tactics evaluated in this study vary in their potential to foster diverse weed communities that have more equal population densities, do not threaten yields, and may promote resilience to pests and pathogens (Cordeau et al. Reference Cordeau, Baudron, Busset, Farcy, Vieren, Smith, Munier-Jolain and Adeux2022; MacLaren et al. Reference MacLaren, Storkey, Menegat, Metcalfe and Dehnen-Schmutz2020; Storkey and Neve Reference Storkey and Neve2018). Comparable work has found that diverse cropping systems with varied disturbance regimes can promote richer weed communities while preserving crop profitability and environmental health (Liebman et al. Reference Liebman, Nguyen, Woods, Hunt and Hill2021; Murphy et al. Reference Murphy, Clements, Belaoussoff, Kevan and Swanton2006).

Figure 6. Diversity indices of weed communities for all treatments. Weed by species biomass was pooled across fields. Similar letters above bars indicate no significant difference using separate Fisher’s LSD tests (P > 0.05). Error bars are standard errors and treatments are abbreviated: NC, nontreated control; SR, seeding rate; IM, interrow mower; WZ, Weed Zapper™.
Functional Groups
Weed biomass data were separated into monocot and dicot species to describe which functional traits were targeted by the interrow mower. Treatments affected dicot weed biomass (P < 0.001) but not monocot weed biomass (Figure 7). All treatments that included the interrow mower reduced dicot weed biomass by an average of 67% compared with the nontreated control. The weed community was dominated by dicot weeds, as mean dicot weed biomass was approximately 85 g m−2 and monocot was biomass 24 g m−2 in nontreated control treatments, averaged across all fields. Monocots present in the experiment included giant foxtail (Setaria faberi Herrm.) and yellow foxtail [Setaria pumila (Poir.) Roem. & Schult.], which emerge after dominant dicot weeds, such as common ragweed (Ambrosia artemisiifolia L.) and common lambsquarters (Chenopodium album L.) (Mohler et al. Reference Mohler, Teasdale and DiTommaso2021). The delayed emergence suggests some monocots may have escaped management. In addition, S. faberi and S. pumila can regrow after mowing because of the presence of underground growing points (Abdulai and Clark Reference Abdulai and Clark2018; Donald Reference Donald2000; Martin Reference Martin2018). Consequently, the interrow mower may have substantially reduced the biomass of dicot weeds because of their dominance in the weed community, earlier emergence time, and lack of underground growing points to allow for regrowth (Everman et al. Reference Everman, Burke, Clewis, Thomas and Wilcut2008; Mohler et al. Reference Mohler, Teasdale and DiTommaso2021). The experimental interrow mowing results align with those of Abdulai and Clark (Reference Abdulai and Clark2018), who found that an interrow mower was more effective at managing dicot weeds than monocots in organic, no-till planted soybean.

Figure 7. Annual, perennial, dicot, and monocot weed biomass in each weed management treatment pooled across fields. Similar letters above bars indicate no significant difference using separate Fisher’s LSD tests (P > 0.05). Error bars are standard errors, and treatments are abbreviated: NC, nontreated control; SR, seeding rate; IM, interrow mower; WZ, Weed Zapper™.
Weed biomass data were also separated into annual and perennial species categories. Treatment differences were observed for annual weed biomass (P < 0.001), but not perennial weed biomass (Figure 7). Treatments that included the interrow mower reduced annual weed biomass by an average of 65% compared with the nontreated control (Figure 7). Annual weed species, such as C. album, A. artemisiifolia, and Setaria spp. dominated the weed community, with annual biomass at 92 g m−2 in nontreated control treatments. Perennial weed biomass was lower at 17 g m−2 in nontreated control treatments, which were dominated by species such as dandelion (Taraxacum officinale F.H. Wigg.) and common plantain (Plantago major L.). These findings are consistent with those of Donald (Reference Donald2000), who reported that annual species were managed with interrow mowing, but management of perennial species was more difficult because of their underground storage organs that allowed for rapid foliar regrowth after tissue loss (Donald Reference Donald2007; Liebman et al. Reference Liebman, Mohler and Staver2001; Mohler et al. Reference Mohler, Teasdale and DiTommaso2021). Mowing can be an effective management strategy for perennial weeds if the practice is performed multiple times within a season to deplete energy reserves in belowground organs (Liebman et al. Reference Liebman, Mohler and Staver2001; Mohler et al. Reference Mohler, Teasdale and DiTommaso2021; Sheley et al. Reference Sheley, Goodwin and Rinella2003). The results of our experiment demonstrate that in organic no-till planted soybean, interrow mowing during the critical period of weed control can be an effective tactic for reducing annual dicot weed biomass. However, additional mowing events may be necessary for perennial weed control.
Dominant Weed Species
The dominant weed species in each treatment were determined to assess the potential for the various tactics to select specific weed species. The dominance table was divided by site-year to obtain a higher resolution of each individual weed community (Table 2). Annual dicot species that are competitive in soybean-cropping systems, such as C. album and A. artemisiifolia, were dominant in the nontreated control treatment and the SR treatment. In four out of five fields, the IM treatment reduced upright annual dicot species in favor of prostrate growth forms or monocots, such as black medick (Medicago lupulina L.) and the early-season rosette form of field sowthistle (Sonchus arvensis L.). A weed species that can be dominant in organic, no-till systems, A. artemisiifolia (Cowbrough et al. Reference Cowbrough, Brown and Tardif2003; Mirsky et al. Reference Mirsky, Curran, Mortensen, Ryan and Shumway2011), was not present in most WZ treatments, suggesting that electric management may have controlled this fast-growing, competitive species. Schreier et al. Reference Schreier, Bish and Bradley2022 reported similar results, with >80% control of A. artemisiifolia at flowering or beyond. In two combinations of tactics that included the interrow mower (SR + IM and IM + WZ), annual dicot dominance was reduced in favor of annual monocot or perennial species, such as S. pumila, foxtail millet [Setaria italica (L.) P. Beauv.], and S. arvensis. Dominance of annual monocots and perennials in the IM treatments aligns with the decrease in annual dicots post–interrow mowing (Figure 7). The dominant species for the SR + IM + WZ treatment was A. artemisiifolia in three of the five fields. Yet, in fields where A. artemisiifolia was present, this weed species made up less than 30% of the total biomass in the three-tactic treatment, whereas in the nontreated control treatments, A. artemisiifolia made up a higher proportion of the total. Therefore, species dominance was reduced when combining three weed management tactics, a finding consistent with increases in species evenness observed in our study.
Soybean Yield
Soybean yield varied between treatments (P < 0.001) (Figure 8). The interrow mowing treatment (IM) alone resulted in a yield of 2,639 kg ha−1, which was greater than the yield for the nontreated control (2,314 kg ha−1) (Figure 8). All combinations of tactics with the IM treatment also produced yields greater than the nontreated control. However, treatments without IM were not different from the nontreated control (Figure 8). The use of the interrow mower during the critical period of weed control, and its ability to reduce biomass of competitive weeds present in organic no-till systems, namely A. artemisiifolia (Cowbrough et al. Reference Cowbrough, Brown and Tardif2003; Mirsky et al. Reference Mirsky, Curran, Mortensen, Ryan and Shumway2011; Table 2), likely contributed to the increased yield. The ability of the interrow mower to increase soybean yield when used alone suggests that higher seeding rates and weed electrocution may not be needed in our specific cropping system. However, use of the interrow mower did not result in yields comparable to those of the weed-free treatment (Figure 8), likely because of regrowth of some weed species after interrow mowing.

Figure 8. Soybean yield from each weed management treatment pooled across fields. Yield is dry weight corrected to 13% moisture. Similar letters above bars indicate no significant difference using Fisher’s LSD test (P > 0.05). Error bars are standard errors, and treatments are abbreviated: NC, nontreated control; SR, seeding rate; IM, interrow mower; WZ, Weed Zapper™.
The high seeding rate (SR) alone treatment led to higher plant densities (Figure 4) but did not increase soybean yield compared with the nontreated control treatment (Figure 8). Soybean yield will increase asymptotically with increasing seeding density (Liebert and Ryan Reference Liebert and Ryan2017; Menalled et al. Reference Menalled, Pethybridge, Pelzer, Smith, DiTommaso and Ryan2021), attaining a plateau at high plant densities, a concept also referred to as “the law of constant final yield” (Ball et al. Reference Ball, Purcell and Vories2000; Liebman et al. Reference Liebman, Mohler and Staver2001; Weiner and Freckleton Reference Weiner and Freckleton2010). The yield plateau can be attributed to intraspecific competition between soybean plants and reduced light use efficiency when plants are at a higher density (Corassa et al. Reference Corassa, Amado, Strieder, Schwalbert, Pires, Carter and Ciampitti2018; Luca and Hungría Reference Luca and Hungría2014). High planting rates can also lead to soybean lodging and potential for yield declines; however, minimal soybean lodging was observed in this experiment. It is likely that the baseline seeding rate of 432,000 pure live seeds ha−1 and the high seeding rate of 680,000 pure live seeds ha−1 produced similar yields because the upper yield limit had already been attained at the lower baseline seeding rate (DeBruin and Pedersen Reference DeBruin and Pedersen2008; Liebert and Ryan Reference Liebert and Ryan2017; Menalled et al. Reference Menalled, Pethybridge, Pelzer, Smith, DiTommaso and Ryan2021).
The WZ treatment did not produce soybean yields greater than the nontreated control (Figure 8). Visual observations indicated few weeds grew above the soybean canopy that could be targeted by the WZ treatment; therefore, the weeds the Weed Zapper™ did not control likely contributed to soybean yield loss. In addition, the WZ treatment was applied late in the season relative to other treatments. Therefore, even if some weeds were controlled above the soybean canopy, the competitive interactions that led to yield loss had likely already occurred.
The weed-free treatment produced the highest yield of 3,419 kg ha−1. In the United States, the average yield for conventional soybean in 2022 was 3,300 kg ha−1; therefore, the weed-free treatment produced yields comparable to the national average (USDA-NASS 2022). The high yield of the weed-free treatment demonstrates that organic no-till soybean has the potential to be as productive as conventional systems and sets a benchmark for future work. Future studies could integrate additional weed management strategies, such as harvest weed seed control or precision weeding, with the interrow mower in organic no-till planted soybean to achieve higher yields.
Experimental Considerations
Several outcomes beyond weed biomass and soybean yield may be useful to consider when assessing the value of the tactics tested. IWM can reduce the likelihood that a dominant weed species will become resistant to a particular tactic, because varied stresses across time and space will target differential weed species traits (Liebman and Gallandt Reference Liebman, Gallandt and Jackson1997; Storkey and Neve Reference Storkey and Neve2018). The species evenness results in our experiment indicate that two of four treatments that combined weed management tactics had a weed species evenness that was greater relative to the nontreated control (Figure 6). Weed species evenness of all single-tactic treatments was not different from that of the nontreated control. Although this research focused on organic production, these findings are also applicable to conventional cropping systems where difficult to control or herbicide-resistant weeds are present and IWM may be warranted.
Use of the interrow mower may incur additional benefits beyond reducing weed biomass and increasing soybean yield. The reduction in weed biomass between soybean rows could have long-term effects by reducing weed seed production of dominant species, which could reduce the soil weed seedbank in subsequent years. Reduction of the weed seedbank is an important principle of ecological weed management (Gallandt et al. Reference Gallandt, Liebman and Huggins1999; Menalled Reference Menalled2008). Use of the interrow mower could also facilitate soybean harvest by reducing interference with harvesting operations. The timing of mowing is also an important consideration, for in both years of this experiment, the first mowing event occurred during the critical period of weed control, yet in 2022, the second mowing event was likely outside this period (Keramati et al. Reference Keramati, Pirdashti, Esmaili, Abbasian and Habibi2008; Zimdahl Reference Zimdahl1980; Table 1). Therefore, to manage annual dicot weeds, mowing may only be needed once in systems with a weed suppressive cover crop mulch, rather than twice, as suggested by Donald et al. (Reference Donald, Kitchen and Sudduth2001), thereby saving farmers fuel and labor costs.
Although weed electrocution did not prevent weed–crop competition and soybean yield loss (Figure 8), this tactic may still be valuable for the long-term reduction of weed populations. Electric weed control can reduce weed seed production and seed viability of dominant weed species (Moore et al. Reference Moore, Jennings, Monks, Boyette, Leon, Jordan, Ippolito, Blankenship and Chang2023; Schreier et al. Reference Schreier, Bish and Bradley2022). Moore et al. (Reference Moore, Jennings, Monks, Boyette, Leon, Jordan, Ippolito, Blankenship and Chang2023) reported that weed seed production of Palmer amaranth (Amaranthus palmeri S. Watson) was reduced by 70% and 93% when electricity was applied at 0 and 2 wk after inflorescences were first observed, respectively. In addition, Schreier et al. (Reference Schreier, Bish and Bradley2022) conducted an experiment with the same Weed Zapper™ model used in this experiment and reported up to an 80% reduction in weed seed viability in A. artemisiifolia and up to 60% reduction in seed viability in Setaria spp., both of which are competitive weed species commonly found in northeastern U.S. organic cropping systems (Brown et al. Reference Brown, Gallandt, DiTommaso, Salon, Smith, Ryan and Cordeau2022). Reducing weed seed production and viability is critical for decreasing the soil weed seedbank, which could lead to the long-term reduction of weed pressure and increased crop yields. Weed electrocution could also reduce weed biomass between crop rows if many fast-growing weeds are present. Like the interrow mower, this could facilitate crop harvest. Therefore, the Weed Zapper™ has the potential to be a valuable medium- to long-term management tool in fields with heavy infestations of weeds that grow faster than the crop.
As cost is one of the largest barriers to IWM adoption, the cost of equipment on profitability is an important factor to consider when deciding what tools to integrate into an IWM strategy. The interrow mower used in this experiment was purchased for US$34,750, had five mower row units on 76-cm spacing, and was attached to a John Deere® 5100R tractor with a category II three-point hitch. A Weed Zapper™ can cost up to US$88,500, depending on generator wattage, tractor model, and length of boom. The unit purchased for this experiment was US$69,000 and is one of the smallest models, with a 110,000+ W generator and a 4.6-m boom that were powered by a John Deere® 5100R tractor. As with any new equipment, a farmer must consider the return on investment and the direct effects on short-term profitability as well as any indirect benefits that might accrue over an extended period. In addition, as of May 2023, the baseline seeding rate cost approximately US$216 ha−1 to implement, while the high seeding rate cost approximately US$349 ha−1. Given no differences were observed in weed biomass or soybean yield between the two seeding rates tested, it may be possible to use an even lower soybean seeding rate, which could save on production costs.
Future Directions
In this study, three weed management tactics were implemented alone and in combination in organic no-till planted soybean: a high soybean seeding rate, interrow mowing, and weed electrocution. All treatments that included the interrow mower reduced weed biomass by 60% compared with the nontreated control (P < 0.001) (Figure 5). The interrow mower targeted annual dicot weeds, which dominated the weed community in this experiment (Figure 7). All treatments with the interrow mower produced yields greater than the nontreated control, indicating that the interrow mower may be an effective tool for managing weeds and increasing yields in organic no-till planted soybean. Although multi-tactic management did not improve weed suppression or soybean yield beyond what was achieved with interrow mowing in this research, results may vary depending on weed species present, their growth rate relative to the crop, and their susceptibility to shading. Despite the weed suppression provided by the interrow mower, yields were still considerably lower than in the weed-free treatment. The high soybean yield in the weed-free treatment suggests that additional weed management tactics could be integrated into an organic no-till system in combination with the interrow mower to achieve higher yields. In addition to testing the effect of the weed management tactics used in this experiment across different environmental conditions and with different crop cultivars, future research should evaluate the effects of tactics on other metrics, including crop harvestability, grain quality, and weed seed production.
Acknowledgments
Thank you to Sandra Wayman for coordinating and assisting in fieldwork and sample processing. Thank you to Christopher Pelzer for field management and operations. Thank you to Eric Youngerman, Kristen Loria, and Jake Allen for assisting in fieldwork and thank you to the summer research assistants for sample processing. This research was funded by the USDA National Institute of Food and Agriculture (NIFA), Organic Agriculture Research and Extension Initiative project 2020-51300-32183, and the joint research and Extension project 2020-21-210 funded by the Cornell University Agricultural Experiment Station (Hatch funds) and Cornell Cooperative Extension (Smith Lever funds) received from the NIFA. The authors declare no competing interests.


 Open access