Profiling neurotransmitter-evoked glial responses by RNA-sequencing analysis
 Mengxiao Wang
  Margaret S. Ho*
- School of Life Sciences and Technology, ShanghaiTech University, Shanghai, China
Fundamental properties of neurons and glia are distinctively different. Neurons are excitable cells that transmit information, whereas glia have long been considered as passive bystanders. Recently, the concept of tripartite synapse is proposed that glia are structurally and functionally incorporated into the synapse, the basic unit of information processing in the brains. It has then become intriguing how glia actively communicate with the presynaptic and postsynaptic compartments to influence the signal transmission. Here we present a thorough analysis at the transcriptional level on how glia respond to different types of neurotransmitters. Adult fly glia were purified from brains incubated with different types of neurotransmitters ex vivo. Subsequent RNA-sequencing analyses reveal distinct and overlapping patterns for these transcriptomes. Whereas Acetylcholine (ACh) and Glutamate (Glu) more vigorously activate glial gene expression, GABA retains its inhibitory effect. All neurotransmitters fail to trigger a significant change in the expression of their synthesis enzymes, yet Glu triggers increased expression of neurotransmitter receptors including its own and nAChRs. Expressions of transporters for GABA and Glutamate are under diverse controls from DA, GABA, and Glu, suggesting that the evoked intracellular pathways by these neurotransmitters are interconnected. Furthermore, changes in the expression of genes involved in calcium signaling also functionally predict the change in the glial activity. Finally, neurotransmitters also trigger a general metabolic suppression in glia except the DA, which upregulates a number of genes involved in transporting nutrients and amino acids. Our findings fundamentally dissect the transcriptional change in glia facing neuronal challenges; these results provide insights on how glia and neurons crosstalk in a synaptic context and underlie the mechanism of brain function and behavior.
Introduction
Neurons and glia are the two major cell types in the central nervous system (CNS). Whereas neurons are the major mediators for all aspects of brain function, glia, although abundantly seen, are usually considered passive bystanders that provide nutrient and support (Allen and Lyons, 2018; Kim et al., 2020; Perez-Catalan et al., 2021). Evolutionally, the percentage of glial cells increases with the complexity of organisms, from 16% in nematodes, 20% in Drosophila, 50% in mice, to 90% in human brains, suggesting that glia play a broader and more complex role (Verkhratsky, 2010; Zwarts et al., 2015; Losada-Perez, 2018; Yildirim et al., 2019; Doron and Goshen, 2020). Intriguingly, glial cells among these species are similar in the morphology and function. For instance, fly glia include cortex glia, astrocyte-like glia, ensheathing glia, and the surface glia (perineurial glia and subperineurial glia). Whereas the outermost perineurial glia (PNG) and subperineurial glia (SPG) are involved in forming the blood–brain barrier for protecting the nervous system, cortex glia, like mammalian astrocytes, are responsible to wrap around the cell bodies of neurons and provide them with nutrients. Astrocyte-like glia and ensheathing glia are both glia associated with neuropils, function similarly as mammalian astrocytes and oligodendrocytes, for mediating synapse formation, synaptic function, and axon insulation (Losada-Perez, 2018; Wilton et al., 2019; Yildirim et al., 2019; Sanuki, 2020; Hertenstein et al., 2021).
Lately, accumulating evidence has revealed new and exciting roles of glia, participating in the regulation of nervous system function in an active manner. In both Drosophila and mammals, glia have been shown as the third component in the tripartite synapse (Hillen et al., 2018; Durkee and Araque, 2019; Farizatto and Baldwin, 2023); they regulate synapse formation and synaptic transmission by responding to neurotransmitters, the chemical molecules that convey signals after releasing into the synaptic cleft. In nanoscale, neurotransmitters are released to activate the corresponding receptors on the postsynaptic membrane, propagating the signaling relay from the presynaptic to the postsynaptic compartment. Like postsynaptic compartments, glia, also express receptors on the membranes that respond to these neurotransmitters. In addition, glia express transporters which uptake and recycle extra neurotransmitters released into the cleft. Thus, it is crucial to consider how glia respond to neurotransmitters and incorporate these effects when analyzing the synaptic transmission for larger contexts.
Neurons secrete a variety of neurotransmitters, including acetylcholine (ACh), gamma-aminobutyric acid (GABA), glutamate (Glu), dopamine (DA), adenosine triphosphate (ATP), serotonin (5-HT), opioids, endocannabinoids, and etc. (Deng et al., 2019; Vogt, 2019; Cox et al., 2020; De Deurwaerdere and Di Giovanni, 2020; Kilb and Kirischuk, 2022; Wei et al., 2022; Wiseman, 2022; Suwara et al., 2023). These neurotransmitters, some also released by glia, convey activation or inhibitory signals. Here we developed a protocol purifying glia from the adult fly brains ex vivo. By RNA-sequencing analysis, we found that incubation with different types of neurotransmitters triggers differential gene expressions in glia. Distinct and overlapping patterns of these transcriptomes were identified, implicating that different types of neurotransmitters induce unique signature patterns in gene expression; interconnected crosstalk among them also occurred at the transcriptional level. A general metabolic suppression in glia was also evoked by all types of neurotransmitters except the DA, which upregulates a number of genes involved in transporting nutrients and amino acids.
Results
Purification and RNA-sequencing analysis of adult fly glia ex vivo
To investigate how glia respond to neurotransmitters, we developed a protocol analyzing gene expression in adult fly glia (Figure 1A). Adult fly brains expressing a membranous GFP (UAS-mCD8GFP) under the control of a pan-glial driver repo-GAL4 (repo > mCD8GFP) were dissected and incubated with different types of neurotransmitters (10 mM) for 30 min. The neurotransmitters we used include: Glu, DA, ATP, ACh, and GABA. GFP-positive adult fly glia were purified by the fluorescence activated cell sorting (FACS) and total RNAs were extracted from these glia for further sequencing analysis. Expression changes of genes of interest were verified again by the reverse transcription quantitative PCR (RT-qPCR). Due to the heterogeneity in the size and shape of glial cells, adult fly brain cells were suspended into single cells and sorted by the criteria whether the cells express GFP (Figure 1B). Interestingly, the sorting plot revealed that 8–10% of total cells were GFP-positive, correlating with the reported number of glia in adult fly brains (Croset et al., 2018; Brunet Avalos et al., 2019; Park et al., 2022). After removal of cell debris, single GFP-positive glial cells were visualized by confocal microscopy (Figure 1C).
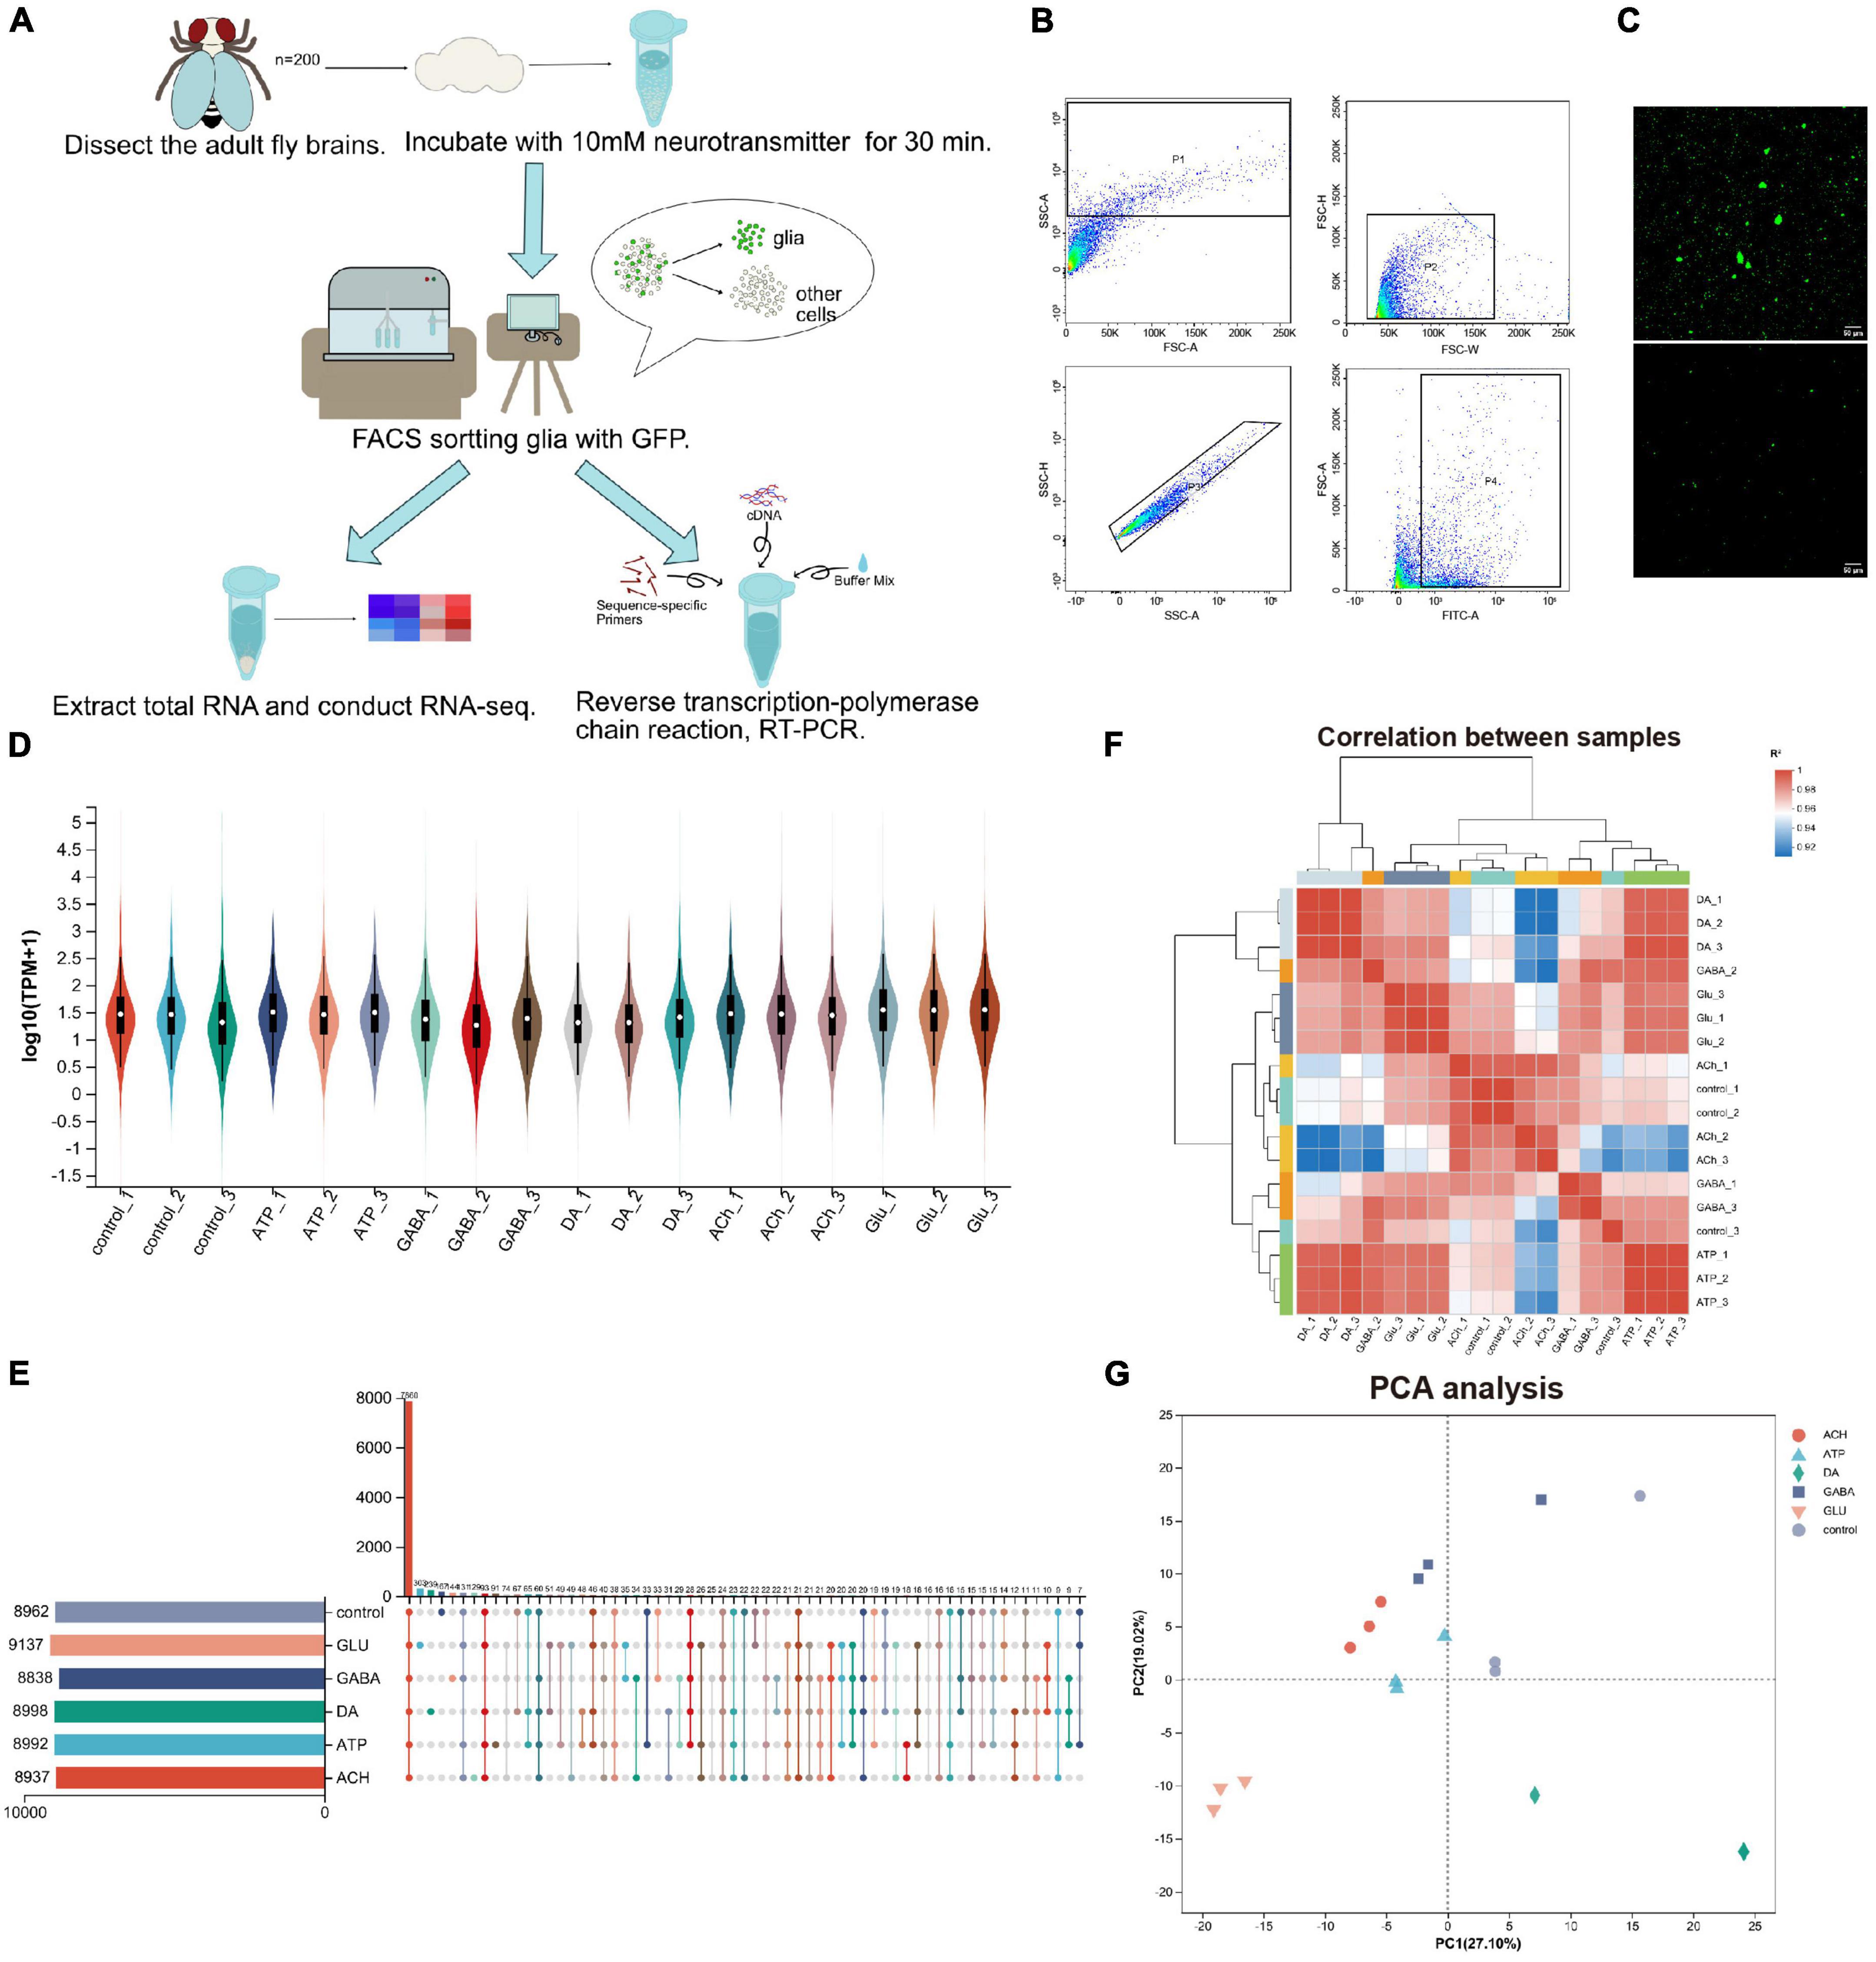
Figure 1. Purification and RNA-sequencing of neurotransmitter-treated adult fly glia. (A) An schematic diagram illustrating the purification, sorting, and gene expression analysis of adult fly glia treated with neurotransmitters ex vivo. A total of 200 adult fly brains were dissected and treated with different neurotransmitters for 30 min. Neurotransmitters used: Glu, DA, ATP, ACh, and GABA. The brain tissues were homogenized into suspended and GFP-positive single cells and subsequently sorted by FACS. Novaseq sequencing technology was used to sequence all mRNAs in the transcriptome, and Illumina Truseq™ RNA sample prep Kit was used to construct the library. The sequencing results were verified by RT-qPCR. (B) The FACS sorting plot of adult fly glia. P4 was classified according to the fluorescence intensity, and a FITC-A value over 102 was identified as GFP-positive single-cell population. (C) Confocal microscopy visualizing the cell suspension before and after FACS sorting. Scale bar, 50 μm. (D) The Violin plot of sample expression distribution. Each color represents one sample, and the enlarged part represents the region with the most concentrated gene expression. (E) The Upset plot of sample expression distribution. The horizontal bar chart on the left represents the expression quantity of each sample. The middle matrix shows the number of overlapping genes in each category. (F) Sample distance heatmap (Pearson correlation analysis). The correlation analysis indicates that the results from three replicates are consistent and the data are reliable (ideal biological replication R2 > 0.92). (G) Principal component analysis (PCA analysis). After dimensionality reduction analysis, the samples have relative coordinate points on the principal component, indicating the distance among the samples. The closer the distance, the higher the similarity between the samples.
By RNA-sequencing analysis, we were able to analyze the glial response at the transcription level to each type of neurotransmitters; the differences in individual gene expression were compared. A total of 720 million reads of sequencing samples were obtained, with each transcriptome containing about 0.4 million reads in three biological replicates. A total of 16,107 genes were detected including 2,631 uncharacterized genes (annotated in CG number). Total 46,048 expressed transcripts including 18,763 new transcripts were identified. RSEM software was used to quantitatively analyze the expression level of transcripts, and TPM conversion was performed to homogenize the sequencing length and depth of transcripts, so to obtain standardized expression level of transcripts. According to the Violin plot showing the sample expression distribution, the gene expression level in each transcriptome is similar, ensuring the same amount of information collected from different transcriptomes (Figure 1D). In addition, about 9,000 genes were identified in each transcriptome as revealed by the sample expression distribution Upset plot, with over 7,800 overlapping genes identified in all six groups and the rest expressing in different groups (Figure 1E). Sample distance heatmap (Figure 1F) and PCA analysis (Figure 1G) revealed a strong correlation between the bio-replicated samples for each group treated with different neurotransmitters. These results suggest that the difference between replicates of each group is relatively large, whereas among replicates themselves is small. The RNA-sequencing results are therefore reliable, consistent, and qualified.
Identification of differentially expressed genes in neurotransmitter-treated adult fly glia
Next, genes differentially expressed among these groups were analyzed. Gene set analysis was carried out and the Upset plot revealed the total number of differentially expressed genes (DEGs) in adult fly glia upon neurotransmitter addition. A total of 2,259 DEGs were identified in Glu-treated glia, whereas only 371 DEGs were detected in ATP-treated glia (Figure 2A). Among these identified DEGs, 1,171 upregulated and 1,088 downregulated genes were identified in Glu-treated glia, whereas only 80 upregulated and 291 downregulated genes were identified in ATP-treated glia (Figure 2B). As more upregulated genes were identified in the Glu and DA groups, more downregulated genes were detected in the ACh, GABA, and ATP groups (Figure 2B). These results suggest that neurotransmitters have differential effects on the glial gene expression. A heatmap of gene cluster analysis was drawn to compare the expression level of individual gene in each group (Figure 2C). Z score was used to standardize the gene expression: when the score is lower than the average value, z is negative; otherwise, it is positive. As shown in the heatmap, genes in the top panel (green label on the left) were mostly upregulated in the DA-treated glia compared to the control group, whereas the same set of genes were mostly downregulated in the GABA-, ACh-, or Glu-treated glia. Genes in the middle panel (blue label on the left) were mostly downregulated in glia treated with all five types of neurotransmitters. At last, genes in the bottom panel (red label on the left) exhibited a low expression in the control group, yet mostly upregulated in the Glu-treated glia (Figure 2C). Consistently, changes in some of these genes involved in signal transduction, metabolism, and function of glial cells were also verified by RT-qPCR in our hand (Supplementary Figures 1, 2).
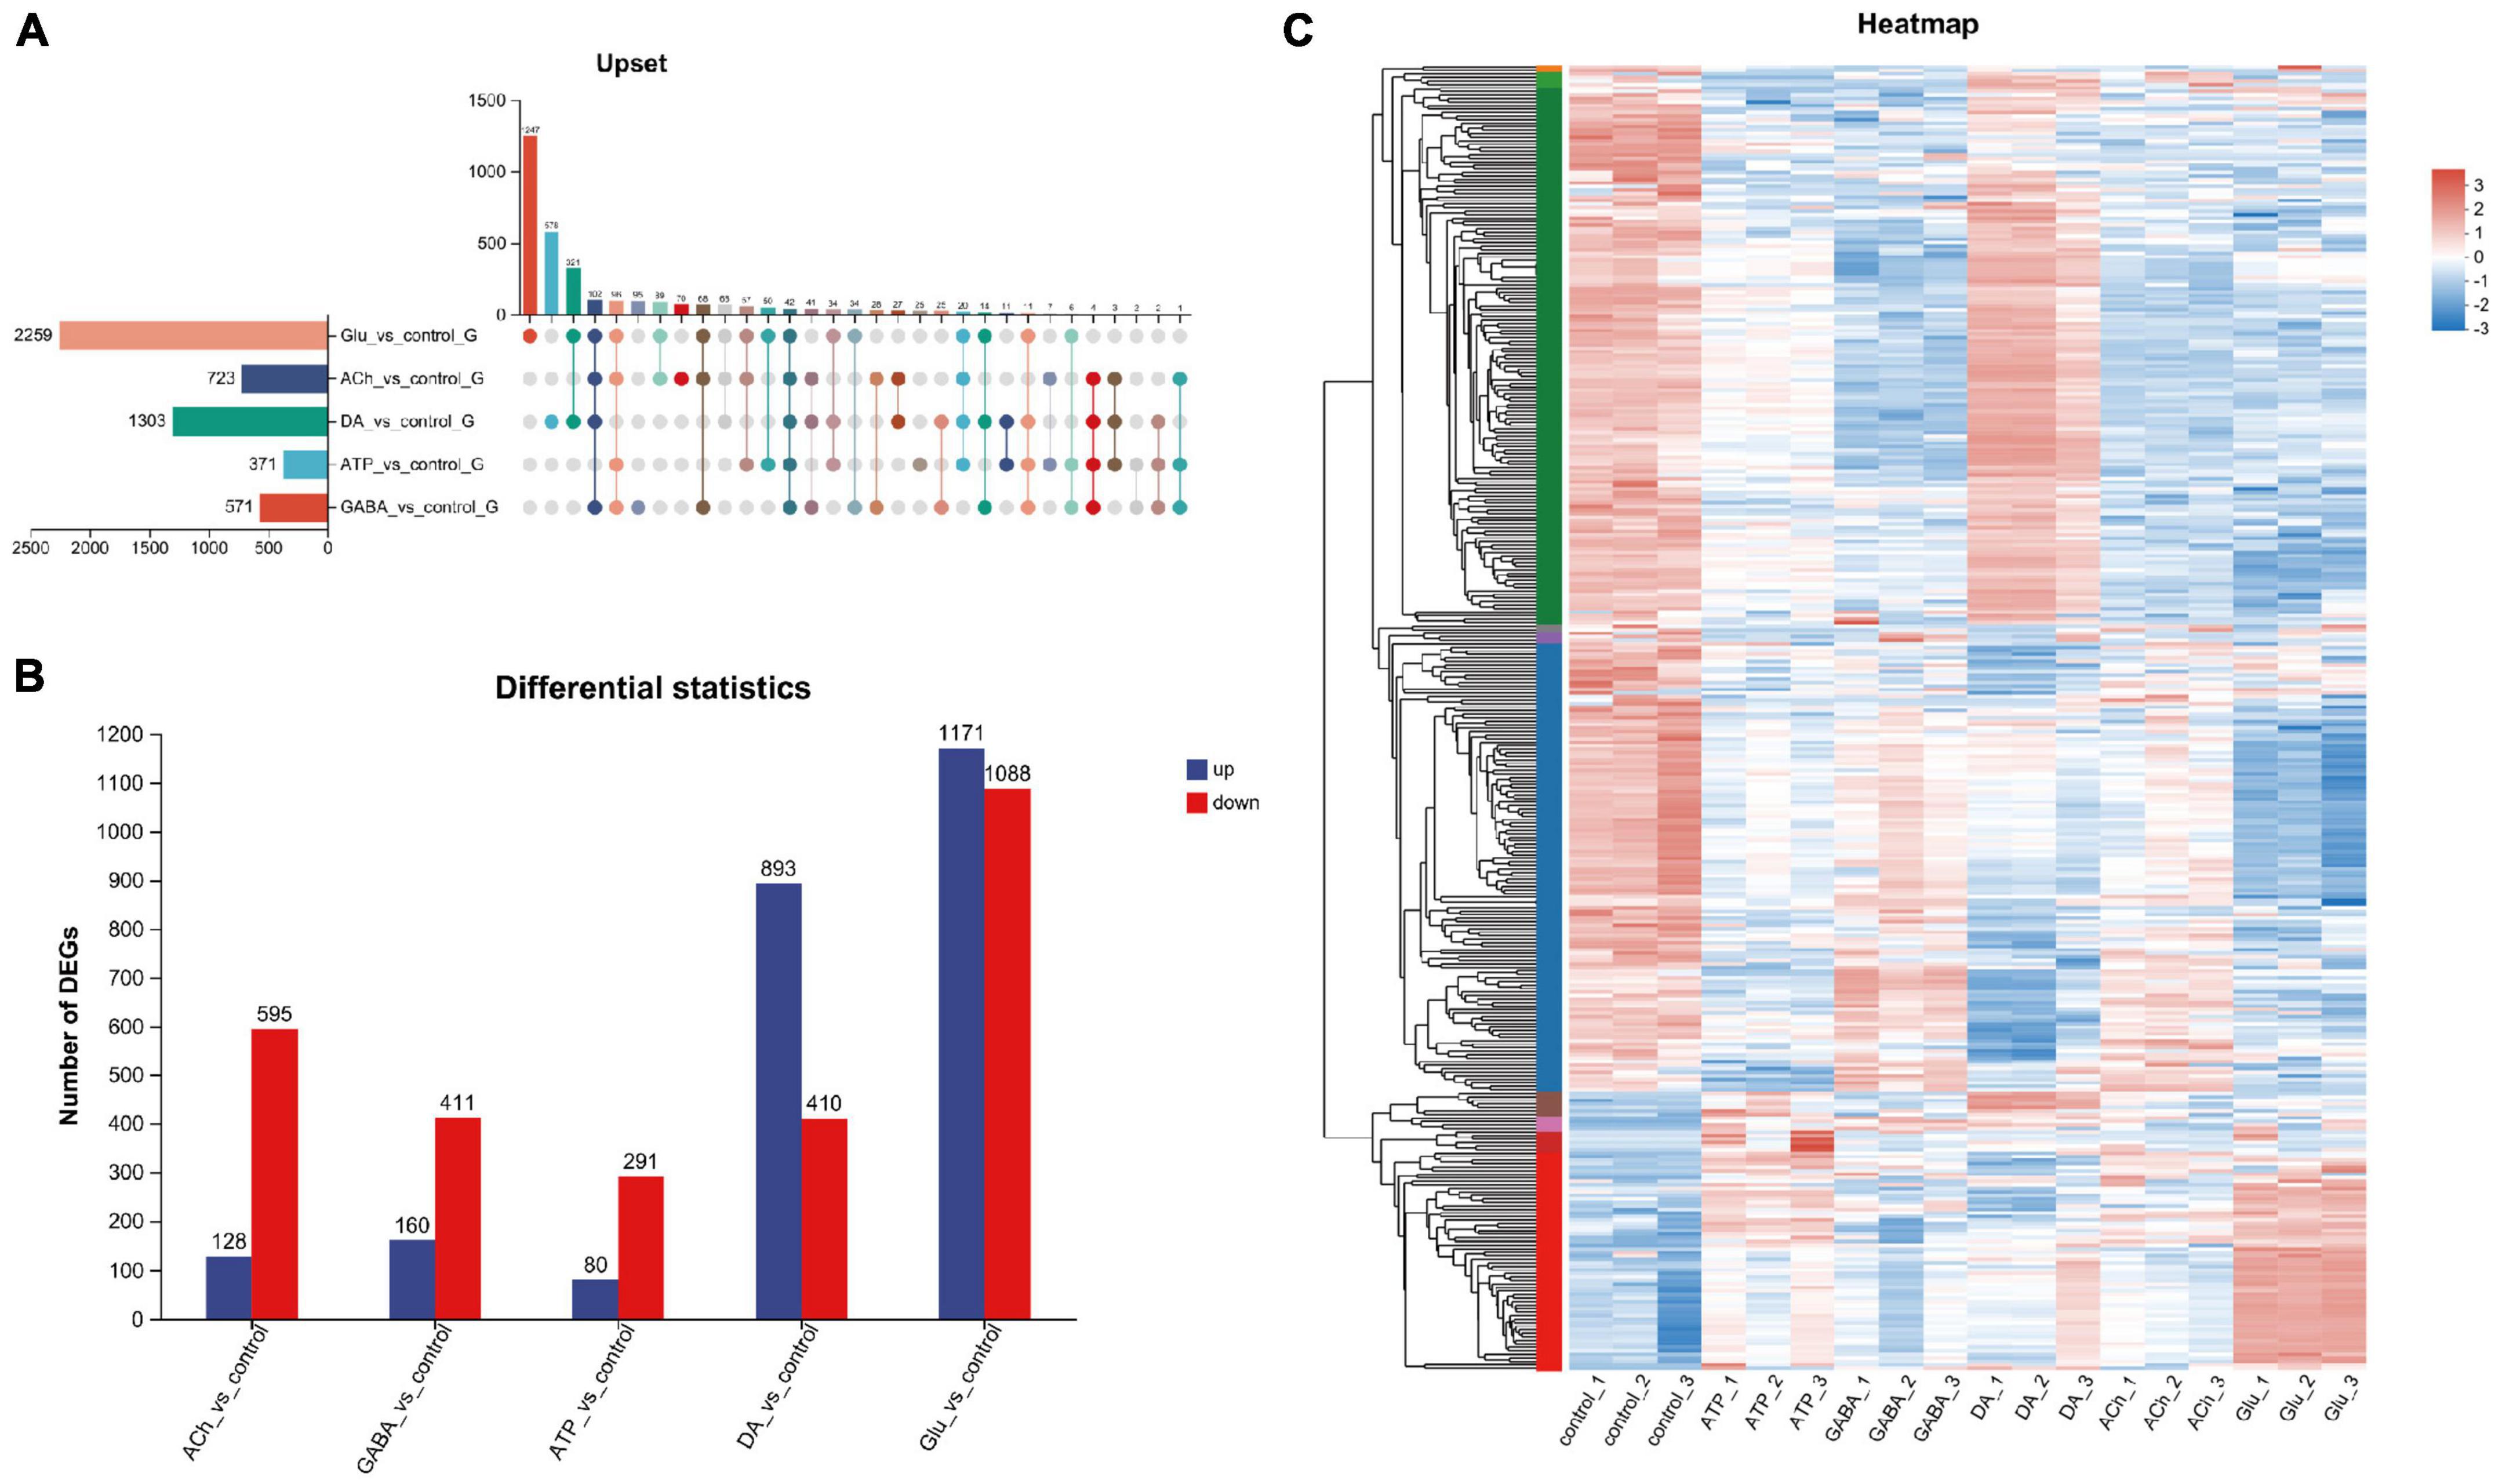
Figure 2. Analysis of differentially expressed genes (DEGs) in neurotransmitter-treated adult fly glia. (A) The Upset plot of DEGs. The horizontal bar chart on the left represents the number of differential genes expressed in each sample. The matrix revealed the number of overlapping genes in each category. (B) Bar graph showing the number of DEGs in each group. The number of upregulated genes (blue) and the downregulated genes (red) were listed on the top of the bars for each group. Note that more upregulated than the downregulated genes were identified for DA- and Glu-treated adult fly glia, whereas the rest is the opposite. Down-regulated genes were identified as FC ≤ 0.5 and up-regulated genes as FC ≥ 2. Adj. p-value ≤ 0.05. FC, fold change; adj., adjusted (Benjamin–Hochberg multiple comparison method). (C) Differential gene heatmap comparing glia treated with different types of neurotransmitters. Y-axis: individual genes categorized into groups with left color labels green, blue, and red. X-axis: five different sample groups. A color tile is present on the right with red and blue indicate higher or lower expression level of the designated genes, respectively. The left Y-axis also reveals the tree diagram of gene clustering and the module diagram of sub clustering, Z-score is used for standardization, and the value of TPM +1 is converted by log10. When the score is lower than the average value, z is negative; otherwise, it is positive.
On the other hand, DEGs categorized by different analyses revealed further information on the function of affected genes (Supplementary Figures 3–5). For instance, COG classification showed that most genes affected in all five groups of glia were poorly characterized (Group S), revealing unrecognized glial cell functions that remain to be investigated. GO annotation and KEGG analysis showed similar trends in the number of genes involved in different cellular processes or pathways for all five types of neurotransmitter-treated glia. Considering that neurotransmitters likely regulate glia in similar mechanisms, it is feasible that no dramatic change in one single type of cellular events is detected.
Neurotransmitters evoke changes in the expression of related receptors and transporters in adult fly glia
Despite that glia are not excitable cells, they utilize similar repertoires of synthesis enzymes, receptors, and transporters when transmitting the cellular signals in response to neurotransmitters (Fellin and Carmignoto, 2004; Fiacco and McCarthy, 2006; Hartl et al., 2007; de Tredern et al., 2021). Next, we analyzed the expression change in a list of genes characterized for their function in the synthesis, transport, and receptor-based signaling of neurotransmitters. Genes selected are the synthesis enzymes, transporters, and receptors for the five types of neurotransmitters and they are listed in Table 1.
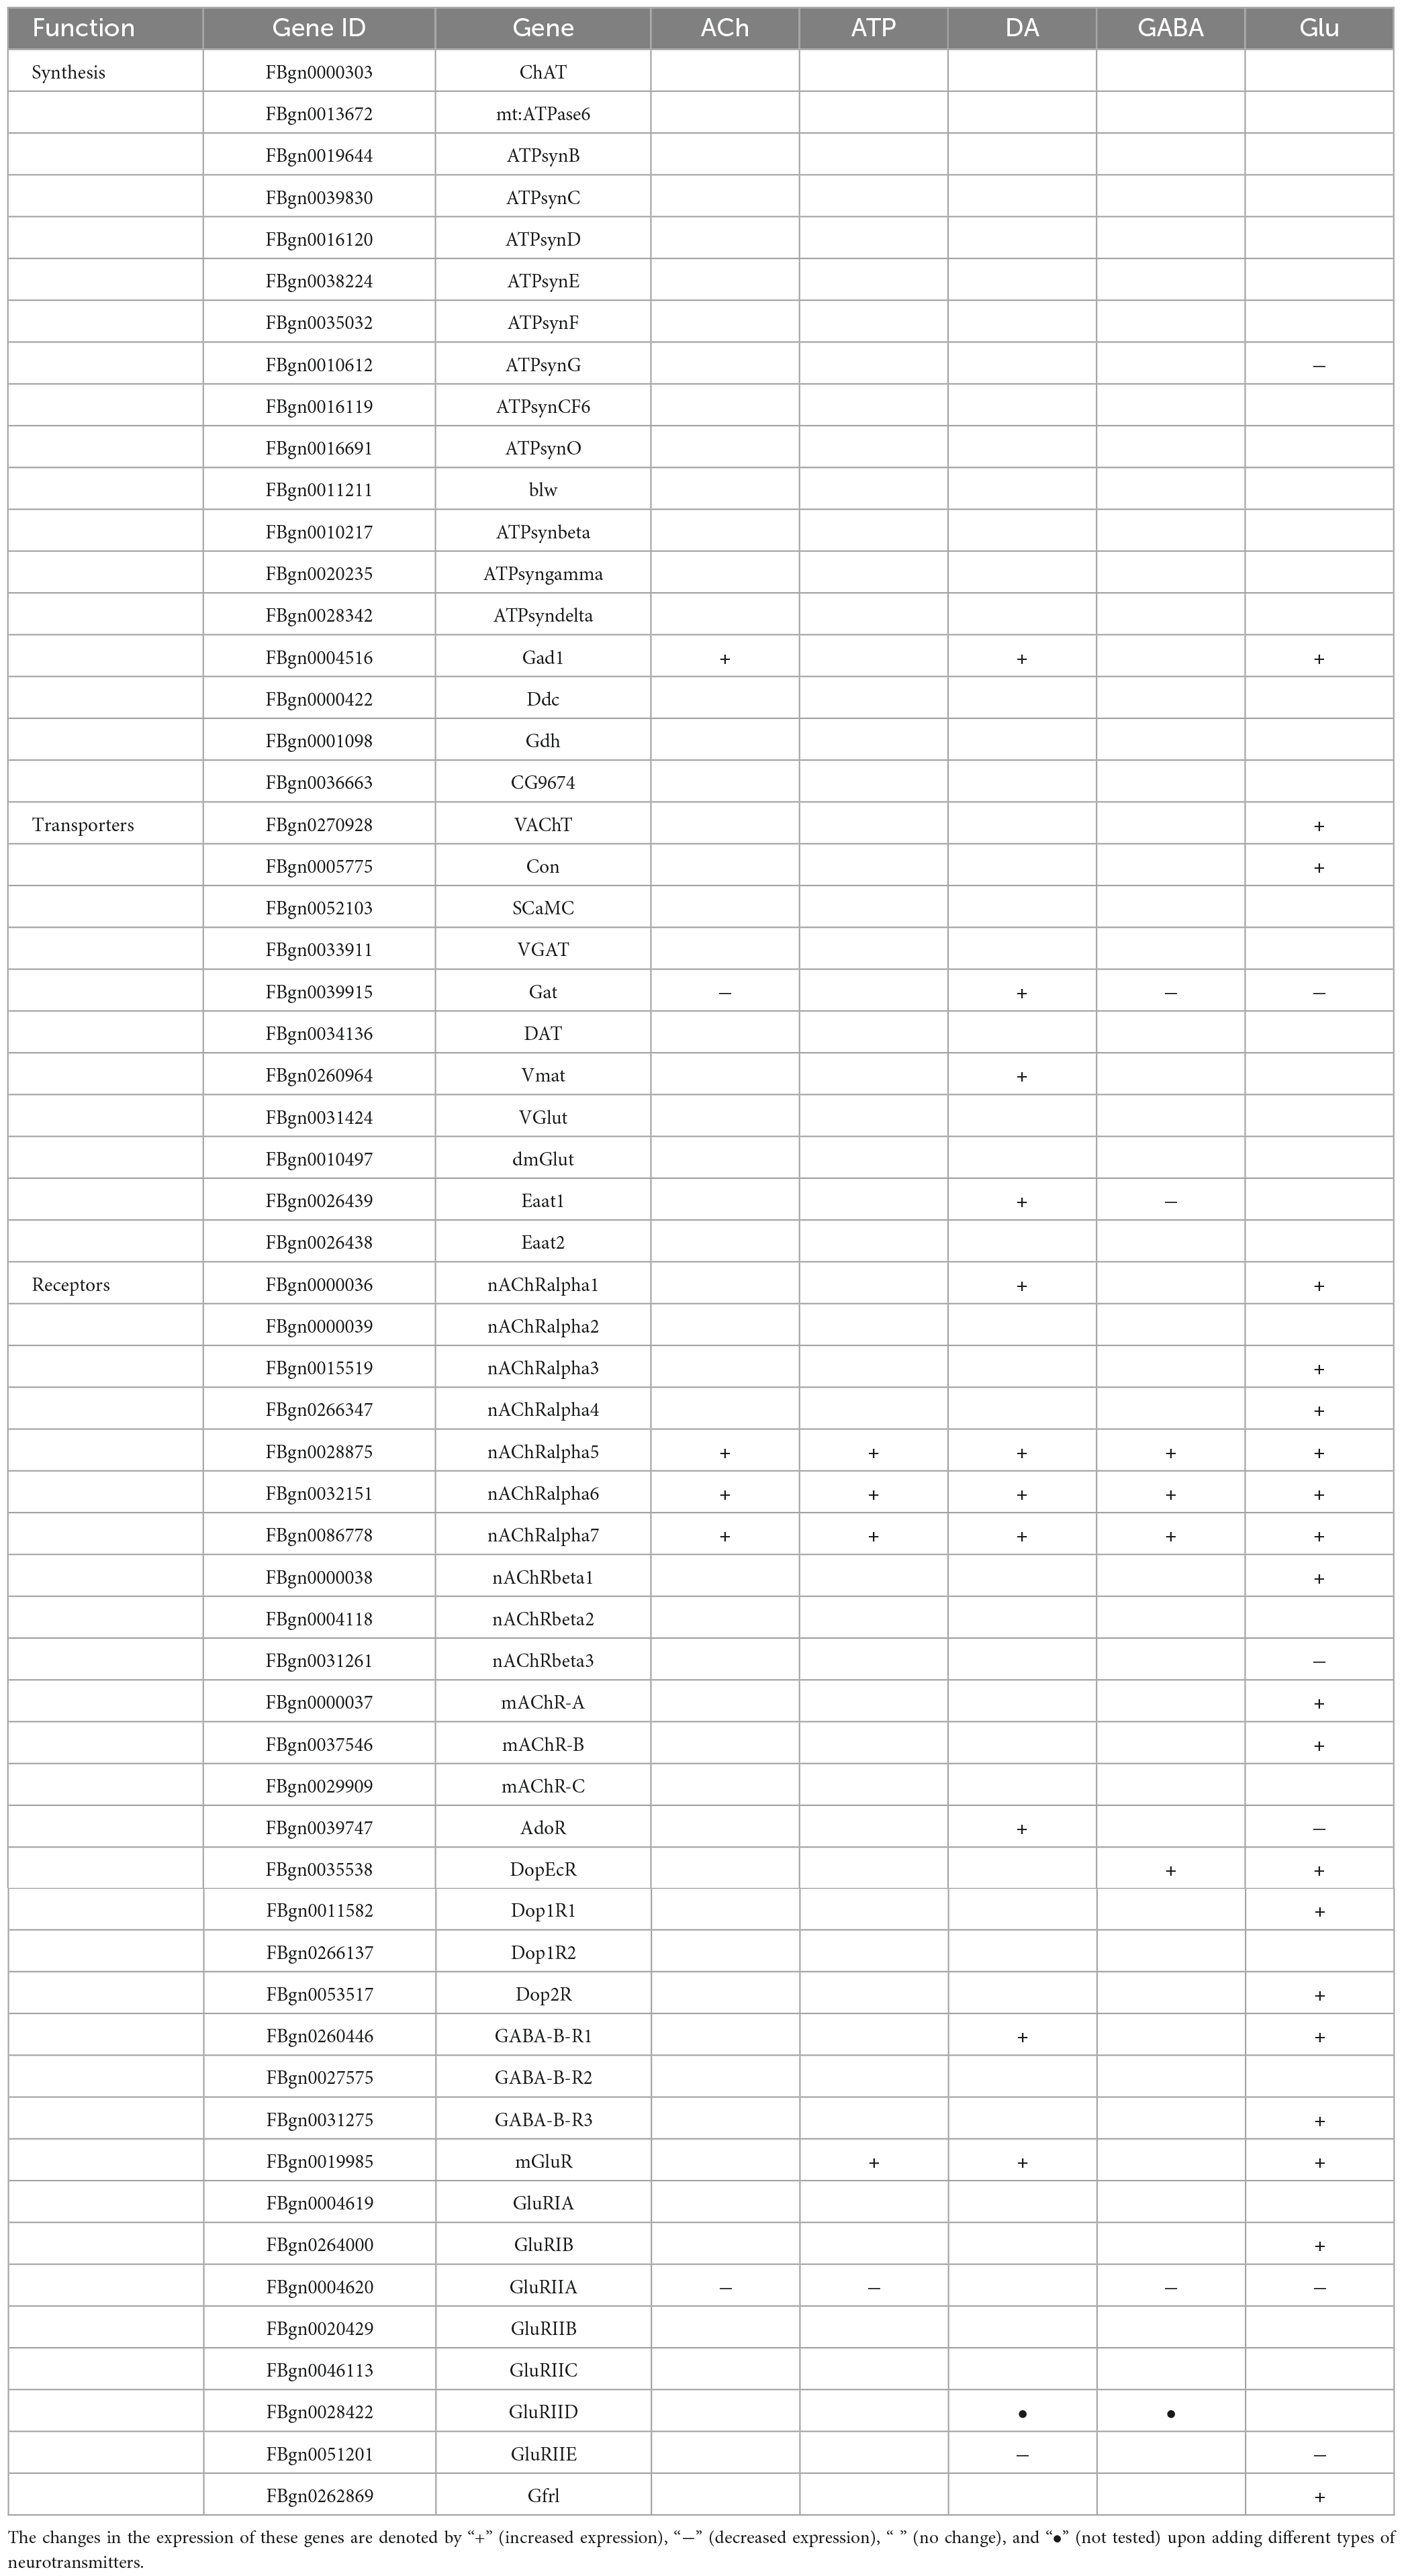
Table 1. A list of genes involved in the synthesis, transport, and receptor-based signaling of neurotransmitters.
As shown by the Volcano plot and heatmap in Figure 3, significant changes in the expression of genes listed in Table 1 were uncovered. We used “+” or “−” symbol for indicating genes with increased expression (the adjusted p-value < 0.05, log2FC > 1) or decreased expression (the adjusted p-value < 0.05, log2FC < −1), respectively in Table 1. A color tile along with the number designation was shown in the upper-right corner of the heatmap in Figure 3 for indicating the difference in gene expression. By default, a three color scale is used with blue indicating low expression values (2–4-fold lower), white indicating similarly expressed genes, and red representing highly expressed genes (2–4-fold higher). Genes with expression differentially affected by the neurotransmitters were selected and shown in the Volcano plot. Overall, neurotransmitters failed to evoke significant change in the expression of synthesis enzymes and triggered more change in the receptor expression. Among the five types of neurotransmitters, Glu activate the expression of Table 1 genes more significantly. Whereas Glu mainly evoked upregulation in receptor expression, GABA rarely caused any increase, correlating with its inhibitory function (Figures 3D, E).
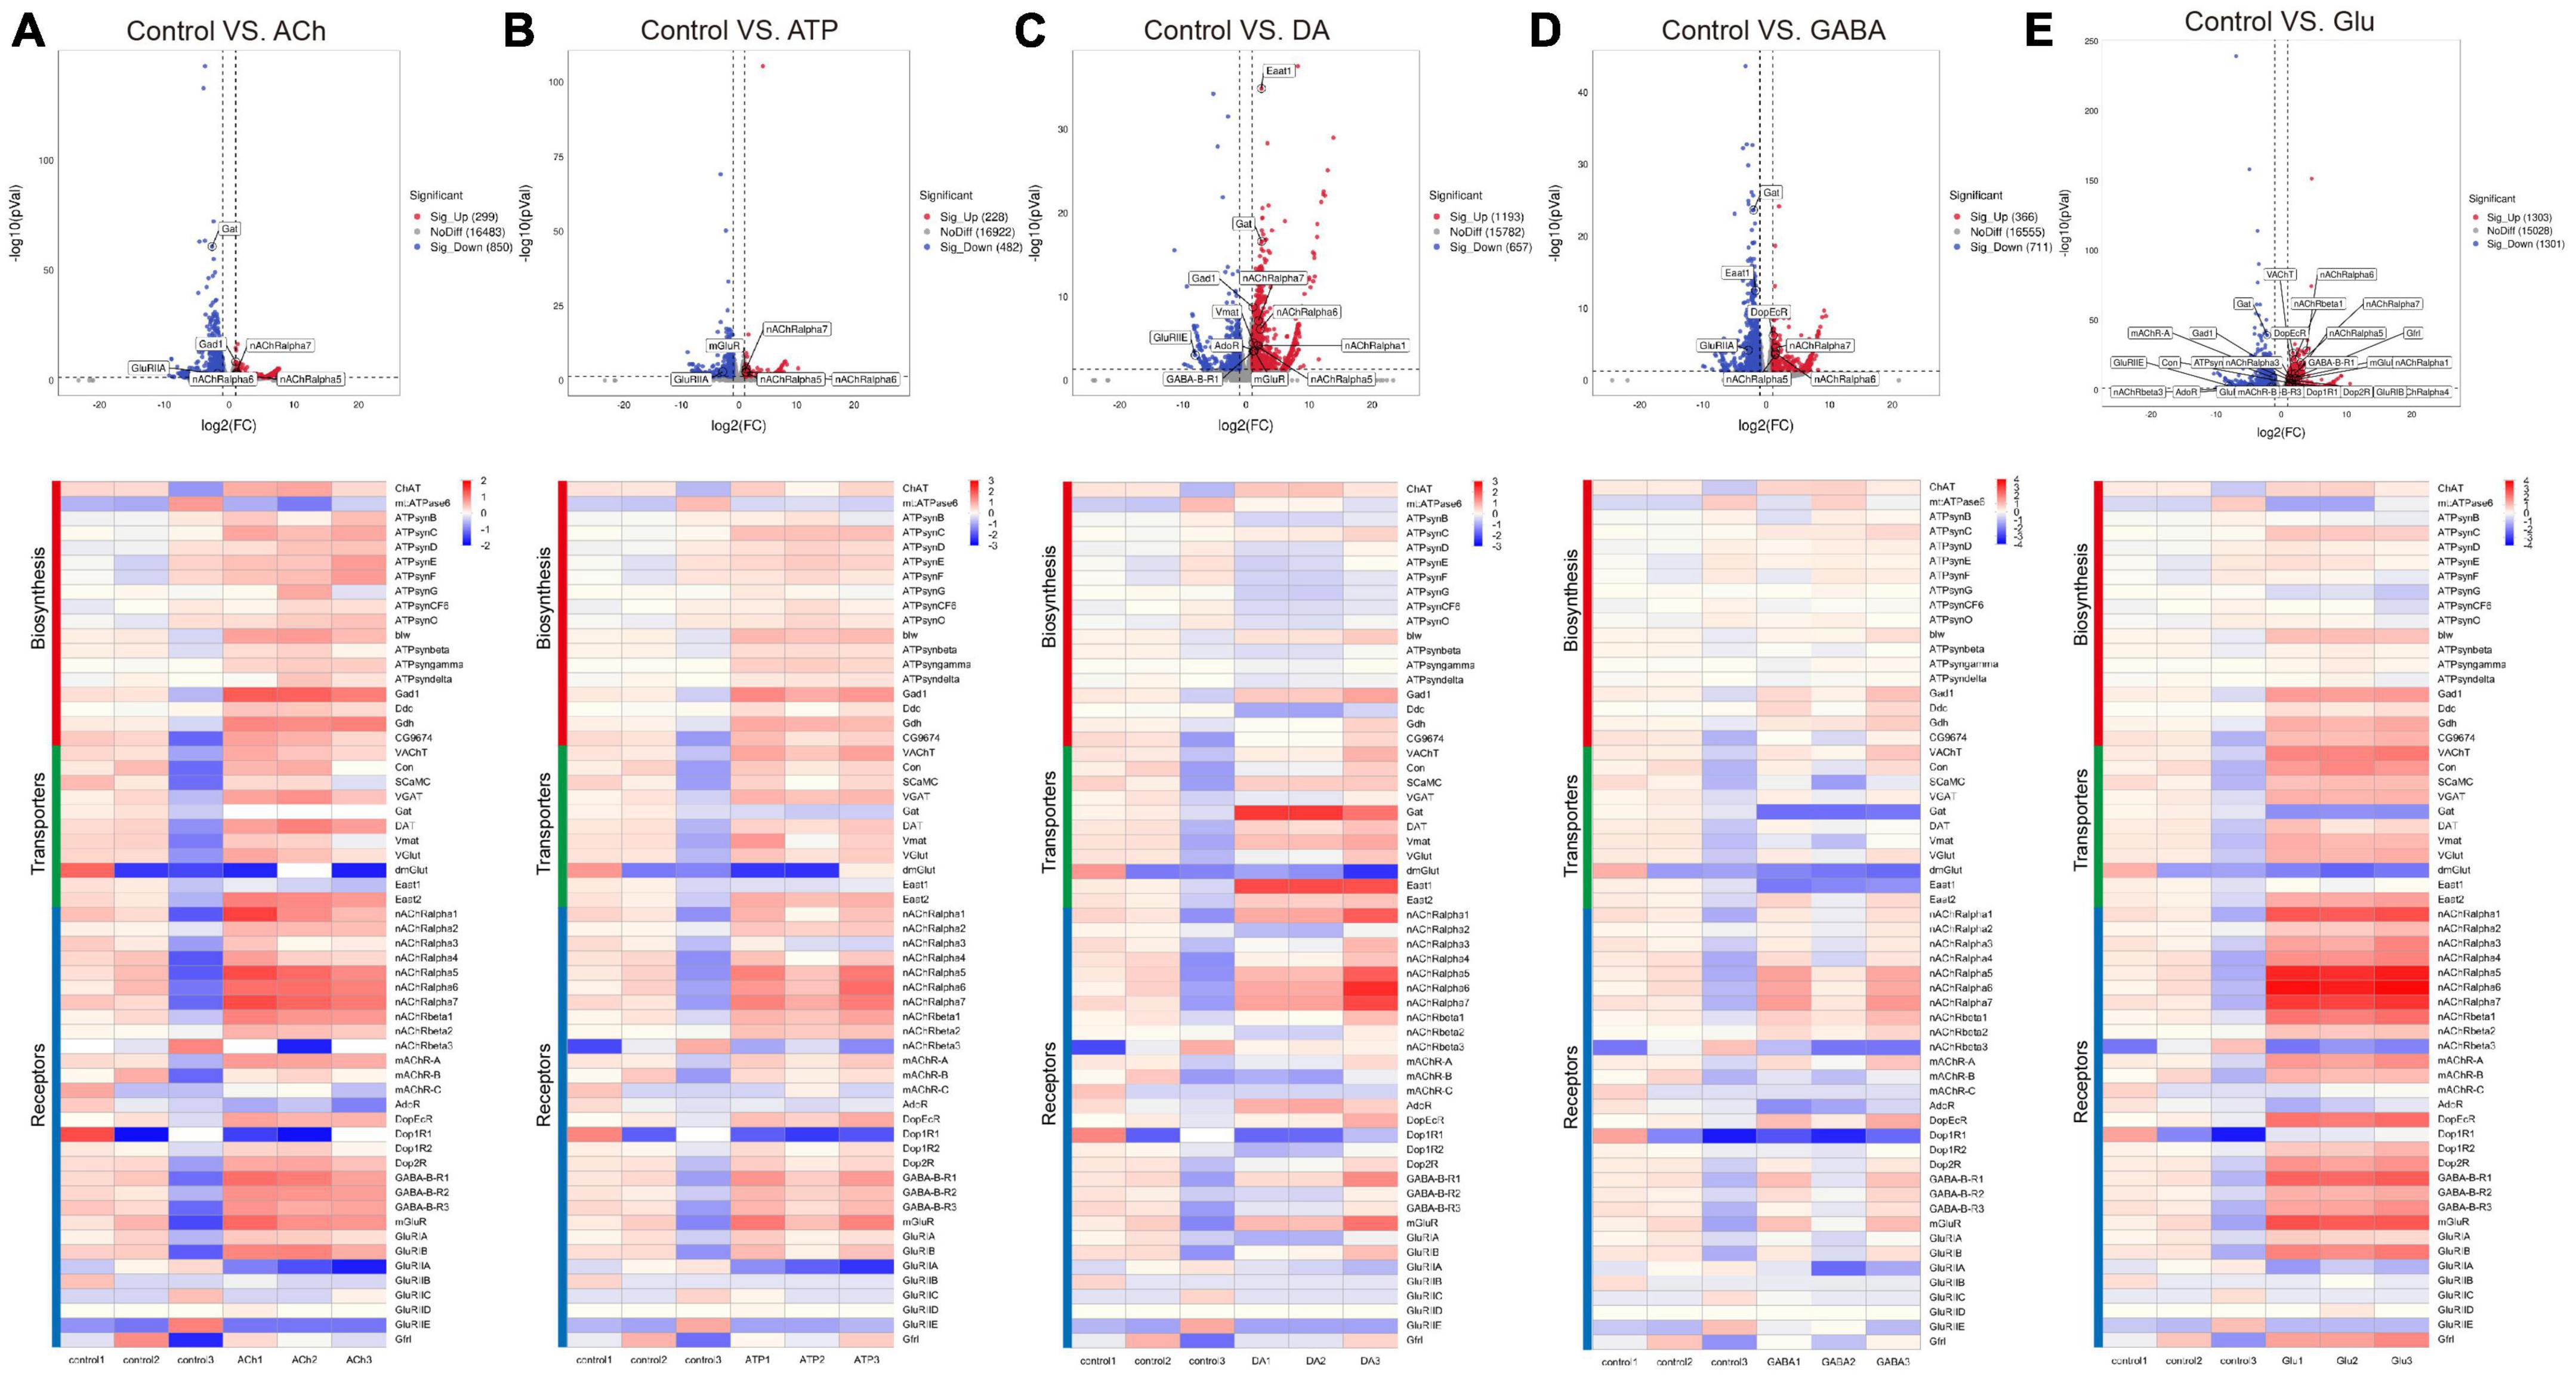
Figure 3. Neurotransmitters trigger changes in the expression of related receptors and transporters in glia. (A–E) The Volcano plot (top) and the cluster heatmap (bottom) are shown. Genes shown in both are similarly selected by their expression level change with the adjusted p-value < 0.05, log2FC > 1 for the increased gene expression (red); the adjusted p-value < 0.05, log2FC < –1 for the decreased gene expression (blue). Multiple comparisons were conducted by the Benjamin–Hochberg analysis. DEGs are boxed out in the Volcano plot. Panels (A–E) represent analysis for glia treated with ACh (A), ATP (B), DA (C), GABA (D), and Glu (E).
Specifically, ACh increased the expression of glutamate decarboxylase 1 (GAD1) and nicotinic acetylcholine receptor alpha 1, 5-7 (nAChRα1, 5-7), yet decreased the expression of Glutamate receptor IIA (GluRIIA) (Control vs. ACh, Figure 3A). ATP also decreased the GluRIIA expression, and increased the expression of nAChRα1, 5-7 as potently as ACh (Control vs. ATP, Figure 3B). DA upregulated the GABA transporter GAT and the Excitatory amino acid transporter 1 (Eaat1), both are transporters for neurotransmitter trafficking (Control vs. DA, Figure 3C). Whereas GABA did not elicit a dramatic change in the overall gene expression, Glu elicited increased expression in nAChRα1, 5-7, Dopamine/Ecdysteroid receptor (DopEcR), metabotropic GABA-B receptor subtype 1 (GABA-B-R1), metabotropic Glutamate Receptor (mGluR), and Glutamate receptor IB (GluRIB) (Figure 3E).
Neurotransmitters trigger changes in the expression of genes dictated for glial function
It has been widely recognized that glia are part of the tripartite synapse and respond to neuronal signals by calcium wave propagation, a functional way to relay signals to adjacent or distal glia via gap junctions (Kielian and Esen, 2004; Deitmer and Rose, 2010; Verkhratsky, 2010; De Bock et al., 2013; Mu et al., 2019; Spray et al., 2019). To further investigate whether neurotransmitters trigger change in genes involved in these aspects, a list of genes encoding channels, transporters, and gap junctions were compiled and analyzed (Table 2). Volcano plot and heatmap were also illustrated in Figure 4, with changes in the expression level of these genes described similarly in Table 1 and Figure 3. Interestingly, expressions of most genes in these categories were upregulated upon ATP, DA, or Glu addition, whereas some inhibitory effects were seen in the group of ACh- and GABA-treated glia. These results suggest that in general neurotransmitters trigger glial activation.

Table 2. A list of genes involved in glial calcium activity.
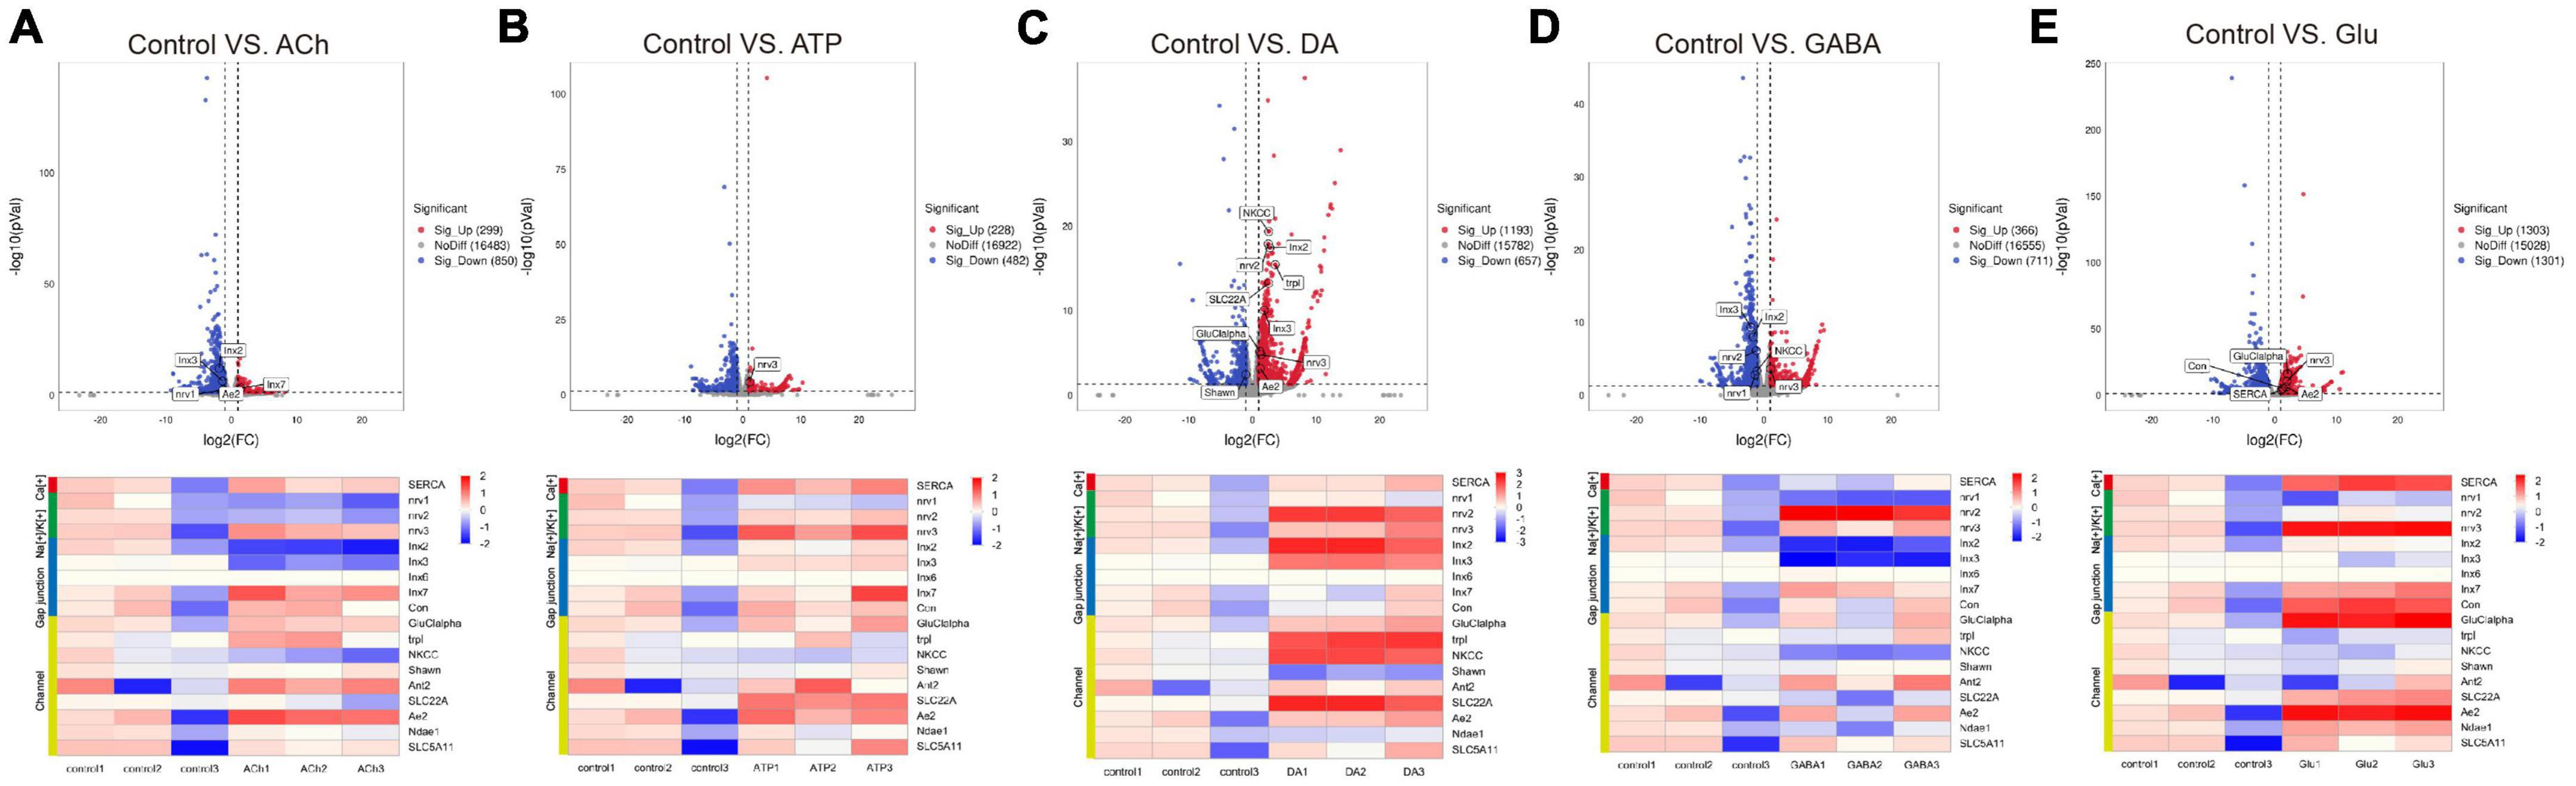
Figure 4. Neurotransmitters trigger changes in the expression of genes related to glial activity. The Volcano plot (top) and the cluster heatmap (bottom) are shown. Genes shown in both are similarly selected by their expression level change with the adjusted p-value < 0.05, log2FC > 1 for the increased gene expression (red); the adjusted p-value < 0.05, log2FC < –1 for the decreased gene expression (blue). Multiple comparisons were conducted by the Benjamin–Hochberg analysis. DEGs are boxed out in the Volcano plot. Panels (A–E) represent analysis for glia treated with ACh (A), ATP (B), DA (C), GABA (D), and Glu (E).
Specifically, the expression of Sarco/endoplasmic reticulum Ca(2+)-ATPase (SERCA) was upregulated in the Glu-treated glia, suggesting that Glu triggers glial calcium activity. The expression of nervana 3 (nrv3) was upregulated in ATP- and Glu-treated glia, whereas nervana 2 (nrv2) was more highly expressed in the DA and GABA group. For gap junction genes, Innexin 2 (Inx2) and Innexin 3 (Inx3) were both upregulated in the DA-treated glia, yet downregulated in ACh- and GABA-treated glia. Moreover, genes encoding channels such as Glutamate-gated chloride channel subunit alpha (GluClalpha) and Ae2 in Glu group, and transient receptor potential-like (trpl), sodium potassium chloride cotransporter (NKCC) and SLC22A family member (SLC22A) in the DA group were more highly expressed. On the other hand, the expressions of Shawn and NKCC were downregulated in the DA- or ACh- and GABA-treated glia, respectively (Figure 4C). Taken together, these results suggest that neurotransmitters trigger changes in the expression of genes functioning in glial activity.
Neurotransmitters elicit metabolic changes in adult fly glia
Accumulating evidence has indicated that metabolic changes in neurons associate with brain dysfunction (Mlody et al., 2016; Diaz-Garcia et al., 2017; Onkar et al., 2020; Rickman et al., 2020; Bonvento and Bolanos, 2021; Li et al., 2021). On the other hand, not a lot has been explored for how glia react to neuronal challenges from a metabolic view. Here we investigated metabolic genes differentially expressed in adult fly glia upon adding neurotransmitters. Searches done using the COG, GO, and KEGG databases identified genes in four types of metabolism including carbohydrates, lipid, amino acid, and alcohol (Table 3). Volcano plot and heatmap were also illustrated in Figure 5, with changes in the expression level of these genes described similarly in Table 1 and Figure 3. Overall, expressions of these metabolic genes were mostly downregulated in ACh- or GABA-treated glia, whereas ATP and Glu also evoked suppression for most genes but with some exception. These results suggest that metabolic suppression might be a general event when glia are in the presence of neurotransmitters. Interestingly, DA triggered increased expression for most metabolic genes, implicating a different response pathway for glia upon DA addition.
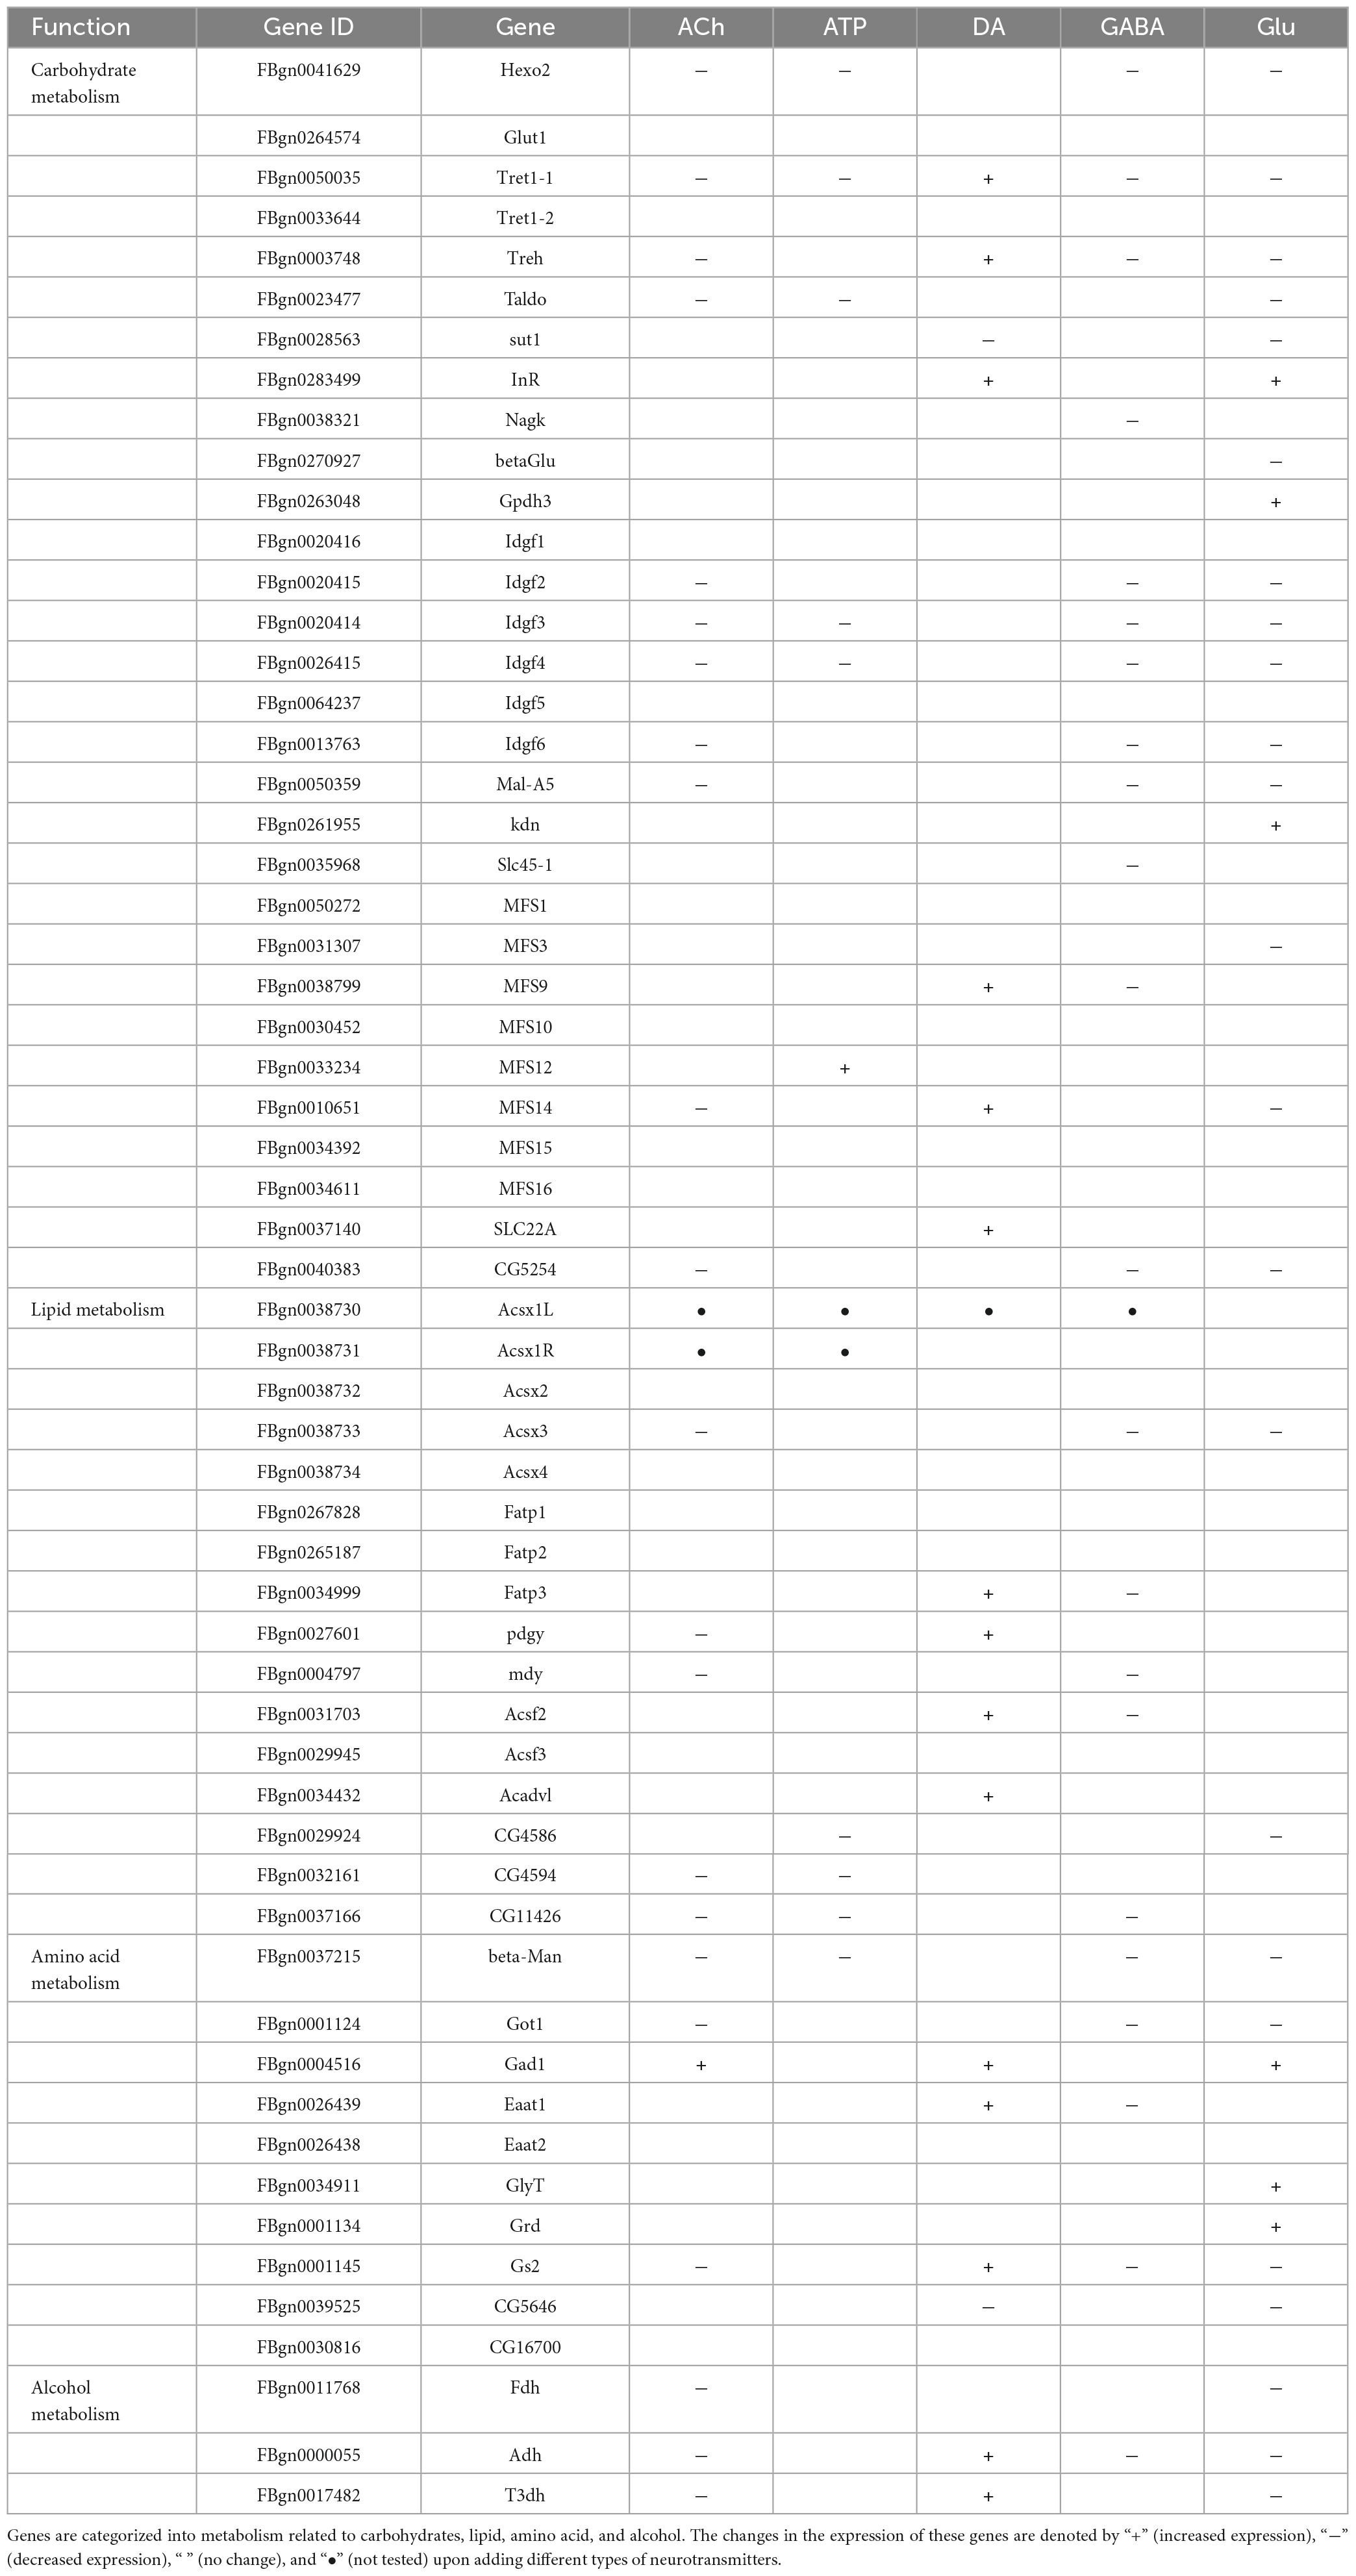
Table 3. A list of genes involved in metabolism.
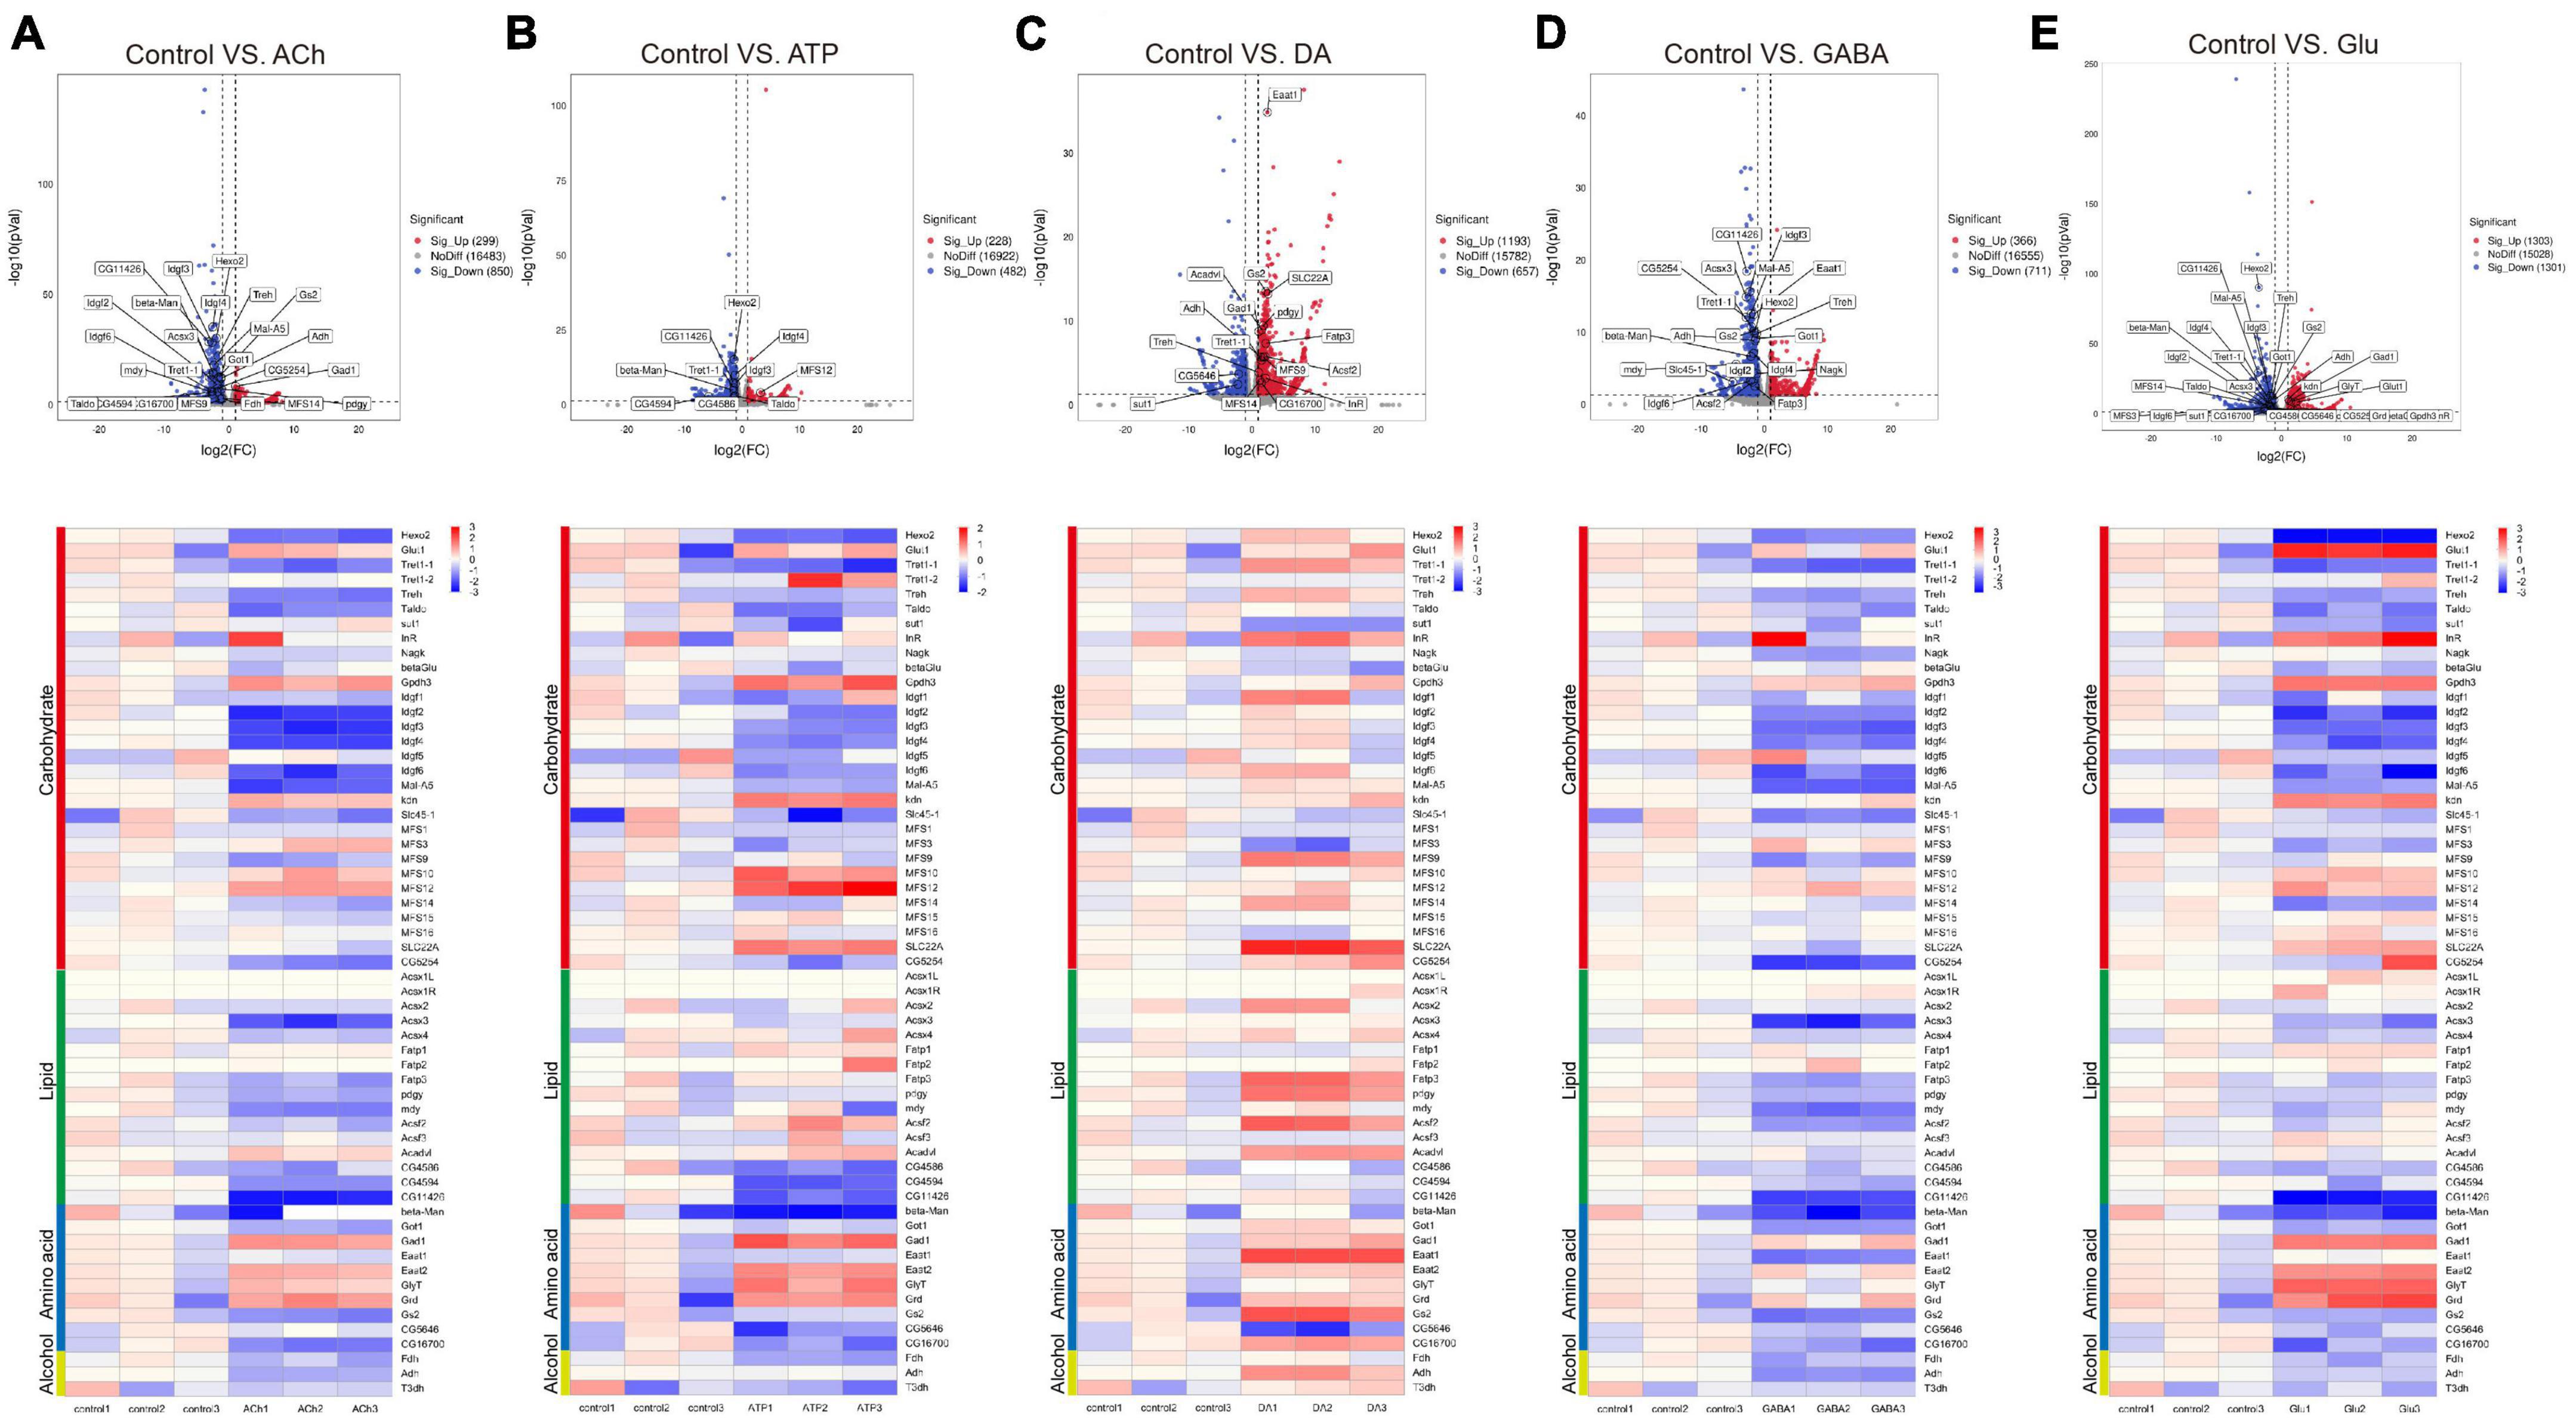
Figure 5. Neurotransmitters trigger changes in the expression of genes related to metabolism. (A–E) The Volcano plot (top) and the cluster heatmap (bottom) are shown. Genes shown in both are similarly selected by their expression level change with the adjusted p-value < 0.05, log2FC > 1 for the increased gene expression (red); the adjusted p-value < 0.05, log2FC < –1 for the decreased gene expression (blue). Multiple comparisons were conducted by the Benjamin–Hochberg analysis. DEGs are boxed out in the Volcano plot. Panels (A–E) represent analysis for glia treated with ACh (A), ATP (B), DA (C), GABA (D), and Glu (E).
Specifically, expressions of the metabolic genes including Hexosaminidase 2 (Hexo2), Trehalose transporter 1-1 (Tret1-1), and Imaginal disc growth factor 2-4, 6 (Idgf2-4, 6) in the Carbohydrate section were downregulated in the ACh- and GABA-treated glia. The expressions of Acyl-CoA synthetase X3 (Acsx3) and a putative lipid phosphatase CG11426 in the Lipid section were downregulated in ACh- and GABA-treated glia, while the expression of CG5254, a putative α-ketoglutarate transporter, was particularly affected by GABA (Figures 5A, D). These results indicate that the DEGs identified for ACh- and GABA-treated glia are similar.
On the other hand, a mixture of upregulated and downregulated genes were identified in the ATP- and Glu-treated glia. For the Carbohydrate section, the expressions of Glycerol-3-phosphate dehydrogenase 3 (Gpdh3), knockdown (kdn), Major Facilitator Superfamily Transporter 12 (MFS12), and SLC22A family member (SLC22A) were upregulated in both types of glia, although in different degrees. The expressions of glucose transporter Glut1 and Insulin-like receptor (InR) were specifically upregulated in Glu-treated glia. The expressions of putative lipid-related genes like CG4586, CG4594, and CG11426 were downregulated in both types of glia, with the expression of CG11426 most affected in the Glu-treated glia. In the Amino acid section, the expressions of Gad1, Eaat2, Glycine transporter (GlyT), and Glycine receptor (Grd) were upregulated in both ATP- and Glu-treated glia (Figures 5B, E).
In the DA-treated glia, most metabolic genes were upregulated in all four types of metabolism groups. The most affected genes included Major Facilitator Superfamily Transporter 9 (MFS9) and SLC22A in the Carbohydrate section; Fatty acid transport protein 3 (Fatp3), pudgy (pdgy), Acyl-CoA synthetase family member 2 (Acsf2), and Acyl-CoA dehydrogenase very long chain (Acadvl) in the Lipid section; Eaat1 and Gs2 in the Amino acid section. Interestingly, sugar transporter 1 (sut1) and the putative L-arginine solute carrier family 25 member 45 (SLC25A45, CG5646) were specifically downregulated in the presence of DA (Figure 5C). Taken together, these results suggest that metabolic suppression in glia is a general event upon neurotransmitter challenges except for DA.
Discussion
In the present study, we profiled the gene expression change in adult fly glia in the presence of different neurotransmitters. It is widely recognized that glia are the central elements in the tripartite synapse. They express the corresponding receptors, respond to neurotransmitters, mediate their uptake and recycling, and relay functional changes downstream. Thus, our findings provide both an overview on the gene expression change at the transcription level and implications on specific cellular events that orchestrate these glial responses. Analyses using different methods and qPCR results have also validated our RNA-sequencing results.
It is plausible to hypothesize that different types of neurotransmitters induces different cellular responses in glia. Thus, the overall profile of DEGs for each transcriptome should be distinct and separate from each other. Nonetheless, we identified profiles overlapping in number, pattern, and identity. ACh and Glu treatment both upregulate the nAChRs expression, suggesting that these receptors augment their responses by increasing their availability on the glial surface for receiving ACh. While both ACh and Glu increase the receptor expression of their own: Glu increases the expression of nAChRs, yet ACh decreases the expression of GluRIIA, suggesting a reciprocal effect of ACh and Glu on glia (Figure 6A). Furthermore, DA increases the expressions of GAT and Eaat1, transporter for GABA and Glu, respectively, whereas Glu decreases the GAT expression. These results suggest opposite effects of DA and Glu on the GABA-mediated signaling pathway. In contrast, GABA decreases the Eaat1 expression, indicating that DA and GABA also regulate Glu transport in opposite means. On the other hand, GABA inhibits its own transport by decreasing the GAT expression, suggesting a potential feedback loop on controlling the GABA availability. These results together point to an interactive and overlapping network of neurotransmitter-triggered glial responses (Figure 6B). Our results demonstrate the complexity in the interactive network at the transcription level. Of note, all five types of neurotransmitters fail to evoke a dramatic change in the expression of genes encoding synthesis enzymes for neurotransmitters, suggesting that glia do not respond to neurotransmitters by increasing their amounts, but to allocate the existing available signaling molecules for their trafficking and release, so to efficiently orchestrate the glial responses. Notably, the change in the gene expression also reflects a potential modulation on glial function. To this end, genes involved in propagating the glial calcium waves are also differentially expressed upon adding different types of neurotransmitters.
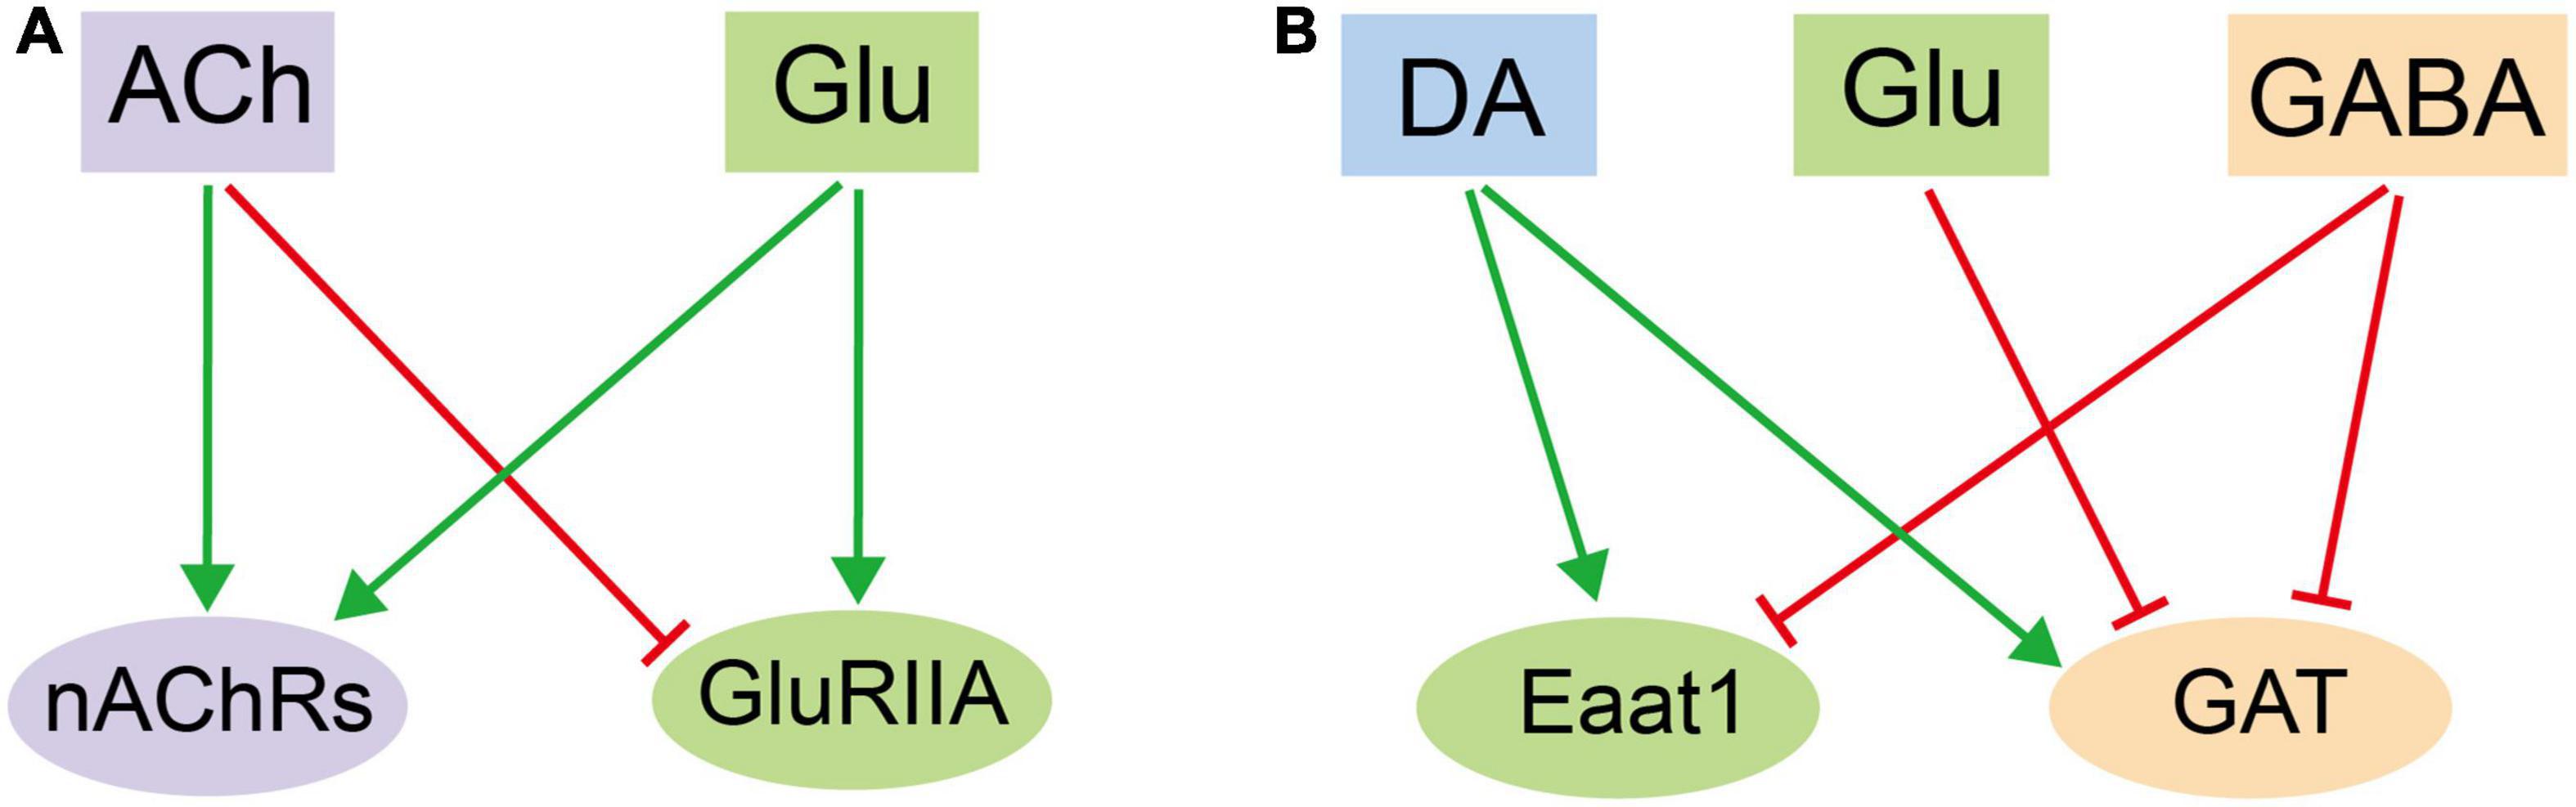
Figure 6. An illustration on the mutual regulatory network in adult fly glia among different neurotransmitters. (A) The reciprocal effect of ACh and Glu on glia by regulating the receptor expression. (B) The interactive and overlapping network of neurotransmitter-triggered glial responses among DA, Glu, and GABA. Note that the three exhibit reciprocal effect on one or another.
Recently, metabolic changes have emerged as critical mechanisms associated with brain dysfunction. A lot of observations have been made in neurons, whereas metabolic changes in glia in the context of synapse activation and neuronal function have not been largely explored. Our findings reveal that metabolic suppression in glia might be a general event upon neurotransmitter challenge. The expression of most metabolic genes in glia are suppressed when challenged with most types of neurotransmitters. Notably, DA triggers a general increase in the expression of metabolic genes including the choline transporter SLC22A, suggesting that DA acts differently from other types of neurotransmitters in regulating glial metabolism in the context of synaptic transmission. It has been shown that glia express a wide range of solute carrier family transporters that transport sugar, nutrients, amino acid, etc. (Visser et al., 2007; Awasaki et al., 2008; Zhu et al., 2008; Boudko, 2012; Liu et al., 2015; Parkhurst et al., 2018; McMullen et al., 2021; De Backer and Kadow, 2022). In our study, neurotransmitters trigger changes in the expression of different SLC genes, implicating a role for SLC transporters in transducing neurotransmitter-triggered metabolic changes in glia.
Glia are the central elements of tripartite synapse and have long been recognized for their pivotal function in regulating a plethora of cellular processes underlying brain function and behavior. The present study provides insights on how glia respond to neurotransmitters at the transcription level. These findings illustrate a complex transcriptional network that includes characterized genes and the ones await to be further analyzed. Future work will be required to uncover how these DEGs uniquely relay the neurotransmitter-evoked signals in glia, so to construct the foundation underlying the mechanism of glia-neuron crosstalk in a synaptic context.
Materials and methods
Fly stock and husbandry
Flies were raised on a fly food (10 g agar, 52.5 g glucose, 60 g dry yeast, 59.1 g corn flour, 26.2 g brown sugar, 10.1 ml antiputrefactive #1 (418 ml propionic acid, 41.5 ml 85% phosphoric acid, and 540.5 ml ddH2O), and 12.5 ml antiputrefactive #2 (200 g methyl p-hydroxybenzoate add to 95% ethanol to 1 L) in a 12/12 h light/dark condition at 25°C with 70% humidity. All strains were obtained from Bloomington Stock Center, the Vienna Drosophila RNAi Center (VDRC), or as gifts from colleagues. The following stocks were used: repo-GAL4, UAS-mCD8GFP, UAS-mCD8GFP; repo-GAL4, UAS-GCamp6.0, UAS-Gcamp6.0; repo-Gal4.
Adult fly brain dissociation and cell collection
The flies used to sort glia were kept in incubators at 25°C, 70% humidity, 12/12 h light/dark condition, for 2∼3 days after eclosion. The brains expressing UAS-mCD8GFP; repo-GAL4 were dissected and dissociated as described (Croset et al., 2018; Li et al., 2022; Lu et al., 2023). Male and female adult flies of 100 each were dissected in cold Schneider’s Drosophila medium (SDM: Gibco) and immediately transferred to 1 ml cold SDM with 10 mM of different neurotransmitters added. Neurotransmitters used: acetylcholine chloride (Sigma A6625-25G), dopamine hydrochloride (MCE HY-B0451A), adenosine 5′-triphosphate disodium salt hydrate (Sigma A2383), γ-aminobutyric acid (MCE HY-N0067), and glutamate (Sigma G0355000). After incubated at room temperature on a shaker for 30 min, the brains were washed three times with 1 ml SDM for 10 min each time, then once again with 1XPBS and incubated in 300 μl SDM containing 100 U/ml papain (MCE, HY-P1645) and 2.5 mg/ml collagenase TL (Roche, 5401020001) for 30 min. After incubation for 5 min, the solution was mixed by pipets and centrifuged at 1,500 rpm for another 5 min for three times. A total of 400 μl cold SDM was added to inactivate enzyme. The supernatant was then filtered with 40 μm Cell strainer (Thermo/Fisher, T_70122363547), centrifuged at 400 g, 4°C for 7 min, then re-suspended with 500 μl SDM in a flow tube. Single-cell suspensions were screened by the BD FACS Aria Fusion Cell Sorter flow cytometry and sorted using a 100 μm nozzle. Flow-sorted glia were collected with 500 μl TRIzol Reagent (Thermo, 15596026) in the RNase-free centrifuge tubes. Average 30,000 glial cells were collected in each centrifuge tube and stored in liquid nitrogen.
RNA extraction
Total RNA was extracted from the purified glia using TRIZOL and Viral DNA/RNA Mini Purification Kit (MCE, HY-K1082). Then RNA quality was analyzed by the 2100 Bioanalyser (Agilent) and quantified using the ND-2000 (NanoDrop Technologies). Only high-quality RNA sample (OD260/280 = 1.8∼2.2, OD260/230 ≥ 2.0, RIN ≥ 6.5, 28S:18S ≥ 1.0, >1 μg) was used to construct the sequencing library.
Library preparation, sequencing, and processing
RNA-sequencing transcriptome libraries were prepared following the TruSeq™ RNA sample preparation Kit from Illumina using 1 μg of total RNA. Messenger RNA was isolated according to the polyA selection method by oligo(dT) beads and then fragmented by fragmentation buffer. Next, double-stranded cDNAs were synthesized using a SuperScript double-stranded cDNA synthesis kit (Invitrogen, CA) with random hexamer primers (Illumina). The synthesized cDNAs were subjected to end-repair, phosphorylation, and “A” base addition according to the Illumina’s library construction protocol. Libraries were size selected for cDNA target fragments of 300 bps on 2% Low Range Ultra Agarose followed by PCR amplified using the Phusion DNA polymerase (NEB) for 15 PCR cycles. After quantified by TBS380, paired-end RNA-seq sequencing library was sequenced with the Illumina HiSeq xten/NovaSeq 6000 sequencer (2X150 bp read length). The raw paired end reads were trimmed and quality controlled by SeqPrep and Sickle (Pertea et al., 2015). The original data after quality control, namely clean data (reads), were compared with the reference genome to obtain mapped data (reads) for subsequent transcriptome assembly and expression calculation, etc. At the same time, the quality of the comparison results of this transcriptome sequencing was evaluated, software used: HiSat2, TopHat2 (Kim et al., 2015).
Differential expression analysis
In RNA-Seq analysis, gene expression levels were calculated by the number of clean reads (reads counts) located to genomic regions. RSEM software was used to quantitatively analyze the expression levels of genes and transcripts, so as to analyze the differential expression (DE) of genes among different samples (Li and Dewey, 2011). DESeq2 software is used to analyze the DE, according to the comparison to the calculated DEGs read count data. The default screening criteria for significantly DEGs were adjusted using p-value < 0.05 and log2FC ≧ 1, when a gene met these two conditions at the same time, it was considered as a DEG (Love et al., 2014).
Pathway analysis
With the GO database, genes can be grouped by their function according to the biological processes (BP), cellular component (CC), and molecular function (MF). The DEGs were annotated with GO, and the results were mapped with up-down-regulated gene GO annotation histogram, using software Blast2go (Ding et al., 2018; Liu and Thomas, 2019). Using the KEGG database, genes can be classified according to the pathway they participate. KEGG annotation of DEGs can display the differential genes on the KEGG pathway map, and display the KEGG annotation pathway maps of up-regulated and down-regulated differential genes, using software KOBAS (Kanehisa et al., 2016). Using the EggNOG database, genes can be classified according to their function. COG annotation was made for DEGs displayed on the COG classification statistical map, using the software BLAST+, Diamond (Li et al., 2018).
Reverse transcription quantitative PCR
Quantitative PCR experiments were performed as described (Croset et al., 2018). Total RNAs were extracted from the sorted glia and reverse-transcribed using the HiScript III RT SuperMix for qPCR (+gDNA wiper) (vazyme, R323-01). qPCR was performed in AB Quanut Studio 7 Real-Time PCR System using ChamQ Universal SYBR qPCR Master Mix (vazyme, Q711-02). Student’s t-test was used to statistic differences between control group and treated group, nsp > 0.05; *p < 0.05, **p < 0.01, ***p < 0.001, ****p < 0.0001.
Calcium imaging
Calcium imaging experiments were performed using adult flies of 3–5 days old (Owald et al., 2015; Jacob and Waddell, 2020). Flies were put on ice for immobilization, then glued into the dish. We used an external saline containing 108 mM NaCl, 5 mM KCl, 2 mM CaCl2⋅2H2O, 8 mM MgCl2⋅6H2O, 4 mM NaHCO3, 1 mM NaH2PO4, 1 mM NaH2PO4⋅2H2O, 10 mM glucose, 5 mM treharose⋅2H2O, 10 mM sucrose, 5 mM HEPES, and 1 μM TTX. The fly heads were opened under room temperature in external saline solution. Fluorescence microscope with high frame rate camera was used to record the calcium signals. Images were taken every 40 ms lasting 2 min, and a 10 mM concentration of neurotransmitter was added at 30 s for 5 s. Manual selection and Fiji was used for further analysis (Schindelin et al., 2012). ΔF/F was calculated by fluorescence after addition of neurotransmitter subtracting the baseline fluorescence level (Tian et al., 2009; Vicario and Cali, 2019). To eliminate for baseline differences in F/F0 between samples, we normalized the “preconditioning” treatment for each cell to equal 0 (Park et al., 2022).
Data availability statement
The data presented in the study are deposited in the NCBI repository, accession number PRJNA992962.
Ethics statement
The manuscript presents research on animals that do not require ethical approval for their study.
Author contributions
MW and MH conceived and designed the study, analyzed the data, and wrote the manuscript. MW performed the experiments. Both authors read and approved the manuscript.
Funding
This work was supported by grants from ShanghaiTech and National Natural Science Foundation of China (32170962).
Acknowledgments
We thank the Bloomington Drosophila Stock Center, Vienna Drosophila RNAi Center, Tsinghua Fly Center, the Core Facility of Drosophila Resource and Technology, Shanghai Institute of Biochemistry and Cell Biology, Chinese Academy of Sciences, Developmental Studies Hybridoma Bank for fly stocks. We also thank the Molecular Imaging Core Facility (MICF), the Molecular and Cell Biology Core Facility (MCBCF), and the Multi-Omics Core Facility (MOCF) at the School of Life Sciences and Technology, ShanghaiTech University for providing technical support. MH Lab members for discussion and comments.
Conflict of interest
The authors declare that the research was conducted in the absence of any commercial or financial relationships that could be construed as a potential conflict of interest.
Publisher’s note
All claims expressed in this article are solely those of the authors and do not necessarily represent those of their affiliated organizations, or those of the publisher, the editors and the reviewers. Any product that may be evaluated in this article, or claim that may be made by its manufacturer, is not guaranteed or endorsed by the publisher.
Supplementary material
The Supplementary Material for this article can be found online at: https://www.frontiersin.org/articles/10.3389/fncir.2023.1252759/full#supplementary-material
Supplementary Figure 1 | Reverse transcription quantitative PCR verification of common candidate genes selected from the RNA sequencing analysis (A–C) RT-qPCR verification of common candidate genes related to signal transduction (A), glial activity (B), and metabolism (C). Common genes include: nAChRα5, nAChRα6, nAChRα7, Gat, and GluRIIA (receptors and transporters); Tret1-1, Treh, ldgf3, ldgf4, and GS2 (metabolism). ns: p > 0.05; *: p < 0.05, **: p < 0.01, ***: p < 0.001, ****: p < 0.0001.
Supplementary Figure 2 | Reverse transcription quantitative PCR verification of specific candidate genes in different groups selected from the RNA sequencing analysis (A–E) candidate genes were selected from the RNA-sequencing results and their expression changes were verified again using RT-qPCR. Genes selected include: Fdh, Gat1, Got, mGluR, Eaat1, and pdgy (receptors and transporters); ldgf2, ldgf6 (metabolism). ns: p > 0.05; *: p < 0.05, **: p < 0.01, ***: p < 0.001, ****: p < 0.0001.
Supplementary Figure 3 | COG classification of RNA-sequencing analysis on glia treated with different types of neurotransmitters (A–E) The COG classification of RNA-sequencing results from glia treated with ACh (A), ATP (B), DA (C), GABA (D), and Glu (E).
Supplementary Figure 4 | GO annotation of RNA-sequencing analysis on glia treated with different types of neurotransmitters. (A–E) The GO annotation of RNA-sequencing results from glia treated with ACh (A), ATP (B), DA (C), GABA (D), and Glu (E).
Supplementary Figure 5 | KEGG pathway analysis of RNA-sequencing on glia treated with different types of neurotransmitters. (A–E) The KEGG pathway analysis of RNA-sequencing results from glia treated with ACh (A), ATP (B), DA (C), GABA (D), and Glu (E).
References
Allen, N. J., and Lyons, D. A. (2018). Glia as architects of central nervous system formation and function. Science 362, 181–185.
Awasaki, T., Lai, S. L., Ito, K., and Lee, T. (2008). Organization and postembryonic development of glial cells in the adult central brain of Drosophila. J. Neurosci. 28, 13742–13753. doi: 10.1523/JNEUROSCI.4844-08.2008
Bonvento, G., and Bolanos, J. P. (2021). Astrocyte-neuron metabolic cooperation shapes brain activity. Cell Metab. 33, 1546–1564.
Boudko, D. Y. (2012). Molecular basis of essential amino acid transport from studies of insect nutrient amino acid transporters of the SLC6 family (NAT-SLC6). J. Insect Physiol. 58, 433–449. doi: 10.1016/j.jinsphys.2011.12.018
Brunet Avalos, C., Maier, G. L., Bruggmann, R., and Sprecher, S. G. (2019). Single cell transcriptome atlas of the Drosophila larval brain. Elife 8:50354. doi: 10.7554/eLife.50354
Cox, M. A., Bassi, C., Saunders, M. E., Nechanitzky, R., Morgado-Palacin, I., Zheng, C., et al. (2020). Beyond neurotransmission: Acetylcholine in immunity and inflammation. J. Intern. Med. 287, 120–133.
Croset, V., Treiber, C. D., and Waddell, S. (2018). Cellular diversity in the Drosophila midbrain revealed by single-cell transcriptomics. Elife 7:34500. doi: 10.7554/eLife.34550
De Backer, J. F., and Kadow, I. C. G. (2022). A role for glia in cellular and systemic metabolism: Insights from the fly. Curr. Opin. Insect Sci. 53:100947. doi: 10.1016/j.cois.2022.100947
De Bock, M., Wang, N., Decrock, E., Bol, M., Gadicherla, A. K., Culot, M., et al. (2013). Endothelial calcium dynamics, connexin channels and blood-brain barrier function. Prog. Neurobiol. 108, 1–20.
De Deurwaerdere, P., and Di Giovanni, G. (2020). Serotonin in health and disease. Int. J. Mol. Sci. 21:3500.
de Tredern, E., Rabah, Y., Pasquer, L., Minatchy, J., Placais, P. Y., and Preat, T. (2021). Glial glucose fuels the neuronal pentose phosphate pathway for long-term memory. Cell Rep. 36:109620. doi: 10.1016/j.celrep.2021.109620
Deitmer, J. W., and Rose, C. R. (2010). Ion changes and signalling in perisynaptic glia. Brain Res. Rev. 63, 113–129.
Deng, B., Li, Q., Liu, X., Cao, Y., Li, B., Qian, Y., et al. (2019). Chemoconnectomics: Mapping chemical transmission in Drosophila. Neuron 101, 876–893e4. doi: 10.1016/j.neuron.2019.01.045
Diaz-Garcia, C. M., Mongeon, R., Lahmann, C., Koveal, D., Zucker, H., and Yellen, G. (2017). Neuronal stimulation triggers neuronal glycolysis and not lactate uptake. Cell Metab. 26, 361–374.e4.
Ding, R., Qu, Y., Wu, C. H., and Vijay-Shanker, K. (2018). Automatic gene annotation using GO terms from cellular component domain. BMC Med. Inform. Decis. Mak. 18:119. doi: 10.1186/s12911-018-0694-7
Doron, A., and Goshen, I. (2020). Glia: The glue holding memories together. Neuron 105, 9–11. doi: 10.1016/j.neuron.2019.12.016
Durkee, C. A., and Araque, A. (2019). Diversity and specificity of astrocyte-neuron communication. Neuroscience 396, 73–78.
Farizatto, K. L. G., and Baldwin, K. T. (2023). Astrocyte-synapse interactions during brain development. Curr. Opin. Neurobiol. 80:102704.
Fellin, T., and Carmignoto, G. (2004). Neurone-to-astrocyte signalling in the brain represents a distinct multifunctional unit. J. Physiol. 559, 3–15. doi: 10.1113/jphysiol.2004.063214
Fiacco, T. A., and McCarthy, K. D. (2006). Astrocyte calcium elevations: Properties, propagation, and effects on brain signaling. Glia 54, 676–690. doi: 10.1002/glia.20396
Hartl, S., Heil, J. E., Hirsekorn, A., and Lohr, C. (2007). A novel neurotransmitter-independent communication pathway between axons and glial cells. Eur. J. Neurosci. 25, 945–956. doi: 10.1111/j.1460-9568.2007.05351.x
Hertenstein, H., McMullen, E., Weiler, A., Volkenhoff, A., Becker, H. M., and Schirmeier, S. (2021). Starvation-induced regulation of carbohydrate transport at the blood-brain barrier is TGF-beta-signaling dependent. Elife 10:62503. doi: 10.7554/eLife.62503
Hillen, A. E. J., Burbach, J. P. H., and Hol, E. M. (2018). Cell adhesion and matricellular support by astrocytes of the tripartite synapse. Prog. Neurobiol. 16, 66–86. doi: 10.1016/j.pneurobio.2018.02.002
Jacob, P. F., and Waddell, S. (2020). Spaced training forms complementary long-term memories of opposite valence in Drosophila. Neuron 106, 977–991.e4. doi: 10.1016/j.neuron.2020.03.013
Kanehisa, M., Sato, Y., Kawashima, M., Furumichi, M., and Tanabe, M. (2016). KEGG as a reference resource for gene and protein annotation. Nucleic Acids Res. 44, D457–D462.
Kielian, T., and Esen, N. (2004). Effects of neuroinflammation on glia-glia gap junctional intercellular communication: A perspective. Neurochem. Int. 45, 429–436. doi: 10.1016/j.neuint.2003.09.010
Kilb, W., and Kirischuk, S. (2022). GABA release from astrocytes in health and disease. Int. J. Mol. Sci. 23:15859.
Kim, D., Langmead, B., and Salzberg, S. L. (2015). HISAT: A fast spliced aligner with low memory requirements. Nat. Methods 12, 357–360. doi: 10.1038/nmeth.3317
Kim, T., Song, B., and Lee, I. S. (2020). Drosophila Glia: Models for human neurodevelopmental and neurodegenerative disorders. Int. J. Mol. Sci. 21:4859. doi: 10.3390/ijms21144859
Li, B., and Dewey, C. N. (2011). RSEM: Accurate transcript quantification from RNA-Seq data with or without a reference genome. BMC Bioinformatics 12:323. doi: 10.1186/1471-2105-12-323
Li, H., Janssens, J., Waegeneer, M. De, Kolluru, S. S., Davie, K., Gardeux, V., et al. (2022). Fly cell atlas: A single-nucleus transcriptomic atlas of the adult fruit fly. Science 375:eabk2432. doi: 10.1126/science.abk2432
Li, S., Xuan, Y., Gao, B., Sun, X., Miao, S., Lu, T., et al. (2018). Identification of an eight-gene prognostic signature for lung adenocarcinoma. Cancer Manag. Res. 10, 3383–3392.
Li, X., Zhang, J., Li, D., He, C., He, K., Xue, T., et al. (2021). Astrocytic ApoE reprograms neuronal cholesterol metabolism and histone-acetylation-mediated memory. Neuron 109, 957–970.e8. doi: 10.1016/j.neuron.2021.01.005
Liu, L., Zhang, K., Sandoval, H., Yamamoto, S., Jaiswal, M., Sanz, E., et al. (2015). Glial lipid droplets and ROS induced by mitochondrial defects promote neurodegeneration. Cell 160, 177–190. doi: 10.1016/j.cell.2014.12.019
Liu, M., and Thomas, P. D. (2019). GO functional similarity clustering depends on similarity measure, clustering method, and annotation completeness. BMC Bioinformatics 20:155. doi: 10.1186/s12859-019-2752-2
Losada-Perez, M. (2018). Glia: From ‘just glue’ to essential players in complex nervous systems: A comparative view from flies to mammals. J. Neurogenet. 32, 78–91. doi: 10.1080/01677063.2018.1464568
Love, M. I., Huber, W., and Anders, S. (2014). Moderated estimation of fold change and dispersion for RNA-seq data with DESeq2. Genome Biol. 15:550. doi: 10.1186/s13059-014-0550-8
Lu, T. C., Brbic, M., Park, Y. J., Jackson, T., Chen, J., Kolluru, S. S., et al. (2023). Aging fly cell atlas identifies exhaustive aging features at cellular resolution. Science 380:eadg0934. doi: 10.1126/science.adg0934
McMullen, E., Weiler, A., Becker, H. M., and Schirmeier, S. (2021). Plasticity of carbohydrate transport at the blood-brain barrier. Front. Behav. Neurosci. 14:612430. doi: 10.3389/fnbeh.2020.612430
Mlody, B., Lorenz, C., Inak, G., and Prigione, A. (2016). Energy metabolism in neuronal/glial induction and in iPSC models of brain disorders. Semin. Cell. Dev. Biol. 52, 102–109. doi: 10.1016/j.semcdb.2016.02.018
Mu, Y., Bennett, D. V., Rubinov, M., Narayan, S., Yang, C. T., Tanimoto, M., et al. (2019). Glia accumulate evidence that actions are futile and suppress unsuccessful behavior. Cell 178, 27–43.e19. doi: 10.1016/j.cell.2019.05.050
Onkar, A., Sheshadri, D., and Ganesh, S. (2020). Glycogen: The missing link in neuronal autophagy? Autophagy 16, 2102–2104. doi: 10.1080/15548627.2020.1802090
Owald, D., Felsenberg, J., Talbot, C. B., Das, G., Perisse, E., Huetteroth, W., et al. (2015). Activity of defined mushroom body output neurons underlies learned olfactory behavior in Drosophila. Neuron 86, 417–427. doi: 10.1016/j.neuron.2015.03.025
Park, A., Croset, V., Otto, N., Agarwal, D., Treiber, C. D., Meschi, E., et al. (2022). Gliotransmission of D-serine promotes thirst-directed behaviors in Drosophila. Curr. Biol. 32, 3952–3970.e8. doi: 10.1016/j.cub.2022.07.038
Parkhurst, S. J., Adhikari, P., Navarrete, J. S., Legendre, A., Manansala, M., and Wolf, F. W. (2018). Perineurial barrier glia physically respond to alcohol in an akap200-dependent manner to promote tolerance. Cell Rep. 22, 1647–1656. doi: 10.1016/j.celrep.2018.01.049
Perez-Catalan, N. A., Doe, C. Q., and Ackerman, S. D. (2021). The role of astrocyte-mediated plasticity in neural circuit development and function. Neural Dev. 16:1. doi: 10.1186/s13064-020-00151-9
Pertea, M., Pertea, G. M., Antonescu, C. M., Chang, T. C., Mendell, J. T., and Salzberg, S. L. (2015). StringTie enables improved reconstruction of a transcriptome from RNA-seq reads. Nat. Biotechnol. 33, 290–295. doi: 10.1038/nbt.3122
Rickman, O. J., Baple, E. L., and Crosby, A. H. (2020). Lipid metabolic pathways converge in motor neuron degenerative diseases. Brain 143, 1073–1087.
Sanuki, R. (2020). Drosophila models of traumatic brain injury. Front. Biosci. 25, 168–178. doi: 10.2741/4801
Schindelin, J., Arganda-Carreras, I., Frise, E., Kaynig, V., Longair, M., Pietzsch, T., et al. (2012). Fiji: An open-source platform for biological-image analysis. Nat. Methods 9, 676–682. doi: 10.1038/nmeth.2019
Spray, D. C., Iglesias, R., Shraer, N., Suadicani, S. O., Belzer, V., Hanstein, R., et al. (2019). Gap junction mediated signaling between satellite glia and neurons in trigeminal ganglia. Glia 67, 791–801.
Suwara, J., Radzikowska-Cieciura, E., Chworos, A., and Pawlowska, R. (2023). The ATP-dependent pathways and human diseases. Curr. Med. Chem. 30, 1232–1255.
Tian, L., Hires, S. A., Mao, T., Huber, D., Chiappe, M. E., Chalasani, S. H., et al. (2009). Imaging neural activity in worms, flies and mice with improved GCaMP calcium indicators. Nat. Methods 6, 875–881. doi: 10.1038/nmeth.1398
Vicario, M., and Cali, T. (2019). Measuring Ca2+ levels in subcellular compartments with genetically encoded GFP-based indicators. Methods Mol. Biol. 1925, 31–42. doi: 10.1007/978-1-4939-9018-4_3
Visser, W. F., van Roermund, C. W., Ijlst, L., Waterham, H. R., and Wanders, R. J. (2007). Metabolite transport across the peroxisomal membrane. Biochem. J. 401, 365–375.
Wei, Z., Wei, M., Yang, X., Xu, Y., Gao, S., and Ren, K. (2022). Synaptic secretion and beyond: Targeting synapse and neurotransmitters to treat neurodegenerative diseases. Oxid. Med. Cell. Longev. 2022:9176923.
Wilton, D. K., Dissing-Olesen, L., and Stevens, B. (2019). Neuron-glia signaling in synapse elimination. Annu. Rev. Neurosci. 42, 107–127.
Yildirim, K., Petri, J., Kottmeier, R., and Klambt, C. (2019). Drosophila glia: Few cell types and many conserved functions. Glia 67, 5–26. doi: 10.1002/glia.23459
Zhu, B., Pennack, J. A., McQuilton, P., Forero, M. G., Mizuguchi, K., Sutcliffe, B., et al. (2008). Drosophila neurotrophins reveal a common mechanism for nervous system formation. PLoS Biol. 6:e284. doi: 10.1371/journal.pbio.0060284
Keywords: glia, neurotransmitter, RNA-sequencing, metabolic suppression, signal transduction
Citation: Wang M and Ho MS (2023) Profiling neurotransmitter-evoked glial responses by RNA-sequencing analysis. Front. Neural Circuits 17:1252759. doi: 10.3389/fncir.2023.1252759
Received: 04 July 2023; Accepted: 25 July 2023;
Published: 14 August 2023.
Edited by:
Ju Lu, University of California, Santa Cruz, United StatesReviewed by:
Zhefeng Gong, Zhejiang University, ChinaWei Zhou, Huazhong University of Science and Technology, China
Copyright © 2023 Wang and Ho. This is an open-access article distributed under the terms of the Creative Commons Attribution License (CC BY). The use, distribution or reproduction in other forums is permitted, provided the original author(s) and the copyright owner(s) are credited and that the original publication in this journal is cited, in accordance with accepted academic practice. No use, distribution or reproduction is permitted which does not comply with these terms.
*Correspondence: Margaret S. Ho, margareth@shanghaitech.edu.cn