


Introduction
Arsenic (Z = 33) is considered one of the most worrying of the potential toxic elements (PTE), considering its prevalence, toxicity and potential for human exposure (e.g. Mitchell, Reference Mitchell, Bowell, Alpers, Jamieson, Nordstrom and Majzlan2014). Its possible dispersion in the environment and, ultimately, its bioavailability can be related to weathering processes affecting ore deposits, where As is widespread in several primary minerals (e.g. As-bearing pyrite, arsenopyrite and As-bearing sulfosalts). However, in order to understand its potential mobility, the occurrence of several attenuation processes, mainly related to the precipitation of As-minerals (both in oxidising or reducing environments) and the adsorption onto some minerals (e.g. Fe oxy-hydroxides) (e.g. Gieré et al., Reference Gieré, Sidenko and Lazareva2003; Drahota and Filippi, Reference Drahota and Filippi2009; Craw and Bowell, Reference Craw, Bowell, Bowell, Alpers, Jamieson, Nordstrom and Majzlan2014), has to be taken into account. For these reasons, the mineralogical investigation of arsenate-bearing assemblages is crucial in assessing the fate of As in the environment.
Several researchers have pointed out the occurrence of high contents of some PTE, including As, in an area of the Peloritani Mountains (northeastern Sicily, Italy) where several small base-metal ore deposits are known (e.g. Saccà et al., Reference Saccà, Saccà and Nucera2015 and references therein). For instance, De Vivo et al. (Reference De Vivo, Lima, Catalano and Chersicla1993) stressed the presence of anomalous contents of As, Hg, Sb, Zn and Pb in stream sediments from this area, whereas Dongarrà et al. (Reference Dongarrà, Manno, Sabatino and Varrica2009) found high As concentrations in waters from mineralised areas. A geogenic source for the As contamination detected in the Peloritani Mountains was also suggested by Cangemi et al. (Reference Cangemi, Censi, Madonia and Favara2021), agreeing with previous results of Cosenza et al. (Reference Cosenza, Lima, Ayuso, Foley, Albanese, Messina and De Vivo2015) who reported high PTE content in soils from Fiumedinisi, Budali and Alì, related to the weathering of ore deposits and mine wastes.
In this respect, a better knowledge of the mineralogy of these deposits is mandatory. Among primary minerals, arsenopyrite and gersdorffite are known to occur (Donati et al., Reference Donati, Stagno and Triscari1978; Triscari and Saccà, Reference Triscari and Saccà1982; Triscari, Reference Triscari1985; Mauro et al., Reference Mauro, Biagioni and Zaccarini2021) and minor As occurs in Pb/Sb sulfosalts (e.g. Triscari and Saccà, Reference Triscari and Saccà1984) and tetrahedrite-group minerals (Mauro et al., Reference Mauro, Biagioni and Zaccarini2021). The alteration of these species gives rise to the occurrence of supergene arsenates. La Valle (Reference La Valle1898) reported the identification of annabergite, erythrite and possibly symplesite. Scorodite was described by Triscari and Saccà (Reference Triscari and Saccà1982). However, crystal chemical data for these arsenates are lacking and no further details on supergene assemblages was given. Recently, Mauro et al. (Reference Mauro, Biagioni and Zaccarini2022) investigated a supergene mineral belonging to the alunite supergroup from the Tripi mine (Alì, Messina Province), identifying it as the lead-iron phosphate kintoreite. The Tripi mine (latitude 38°00′50″N; 15°24′27″E), located some hundred metres SSW of the small hamlet of Alì, exploited a stratabound fine-banded ore, mainly composed of sphalerite and Ag-bearing galena, with rare pyrite and trace amounts of chalcopyrite, arsenopyrite, pyrrhotite and covellite; quartz and fluorite are gangue minerals (Saccà et al., Reference Saccà, Saccà, Nucera, De Fazio and D'Urso2007). Supergene products are smithsonite, gypsum, hydrozincite, ‘limonite’ and malachite (Saccà et al., 2007). Additional investigations of a suite of specimens sampled by one of us (DM) in the dumps of this abandoned mine allowed the identification of an interesting association of three distinct Zn-bearing arsenates, i.e. austinite, conichalcite and zincolivenite. To the best of our knowledge, these species have not been reported previously from the Sicilian ore deposits and, as regards austinite, this is the first Italian occurrence.
The aim of this paper is the crystal chemical characterisation of these three arsenates, improving the available crystallographic and spectroscopic data for these species.
Experimental
Specimen studied
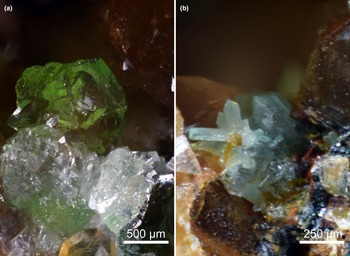
The specimen studied is composed of a calcite vein with deeply oxidised pyrite crystals; in small vugs of the calcite vein, colourless to bright-green crystals can be observed (Fig. 1). Three distinct kinds of crystals were identified: Type 1, colourless bladed crystals, forming aggregates of transparent, sub-adamantine individuals, up to 1 mm in length; Type 2, bright green tabular crystals, with a vitreous lustre, up to 1 mm in size; and Type 3, pale green prismatic crystals, up to 0.2 mm, with a sub-vitreous lustre.

Figure 1. Arsenate minerals from the Tripi mine. (a) Colourless prismatic crystals of austinite associated with green conichalcite. (b) Prismatic crystals of zincolivenite. Specimens in private collection.
Chemical, spectroscopic and structural data on these three different crystal types were collected and allowed the identification of austinite (Type 1), conichalcite (Type 2) and zincolivenite (Type 3), respectively (see below).
Chemical analysis
Quantitative chemical analyses were performed at the National Museum of Prague (Czech Republic) using a Cameca SX 100 electron microprobe using the following analytical conditions: wavelength dispersive spectroscopy mode, accelerating voltage of 15 kV, beam current = 8 nA and beam size = 5 μm. The following standards (element, emission line) were used: albite (NaKα), baryte (BaLα), Bi (BiMα), celestine (SKα and SrLβ), chalcopyrite (CuKα), clinoclase (AsLα), Co (CoKα), diopside (MgKα), fluorapatite (CaKα and PKα), halite (ClKα) hematite (FeKα), LiF (FKα), rhodonite (MnKα), sanidine (AlKα, KKα and SiKα), vanadinite (PbMα and VKα) and ZnO (ZnKα). Contents of the above-listed elements not included in Table 1 were analysed quantitatively, but were consistently below the detection limit (ca. 0.03–0.08 wt.% for individual elements). Peak counting times (CT) were 20 s; CT for each background was one-half of the peak time. Matrix correction by PAP software (Pouchou and Pichoir, Reference Pouchou, Pichoir and Armstrong1985) was applied to the data. Results of the electron microprobe analysis of the studied grains are given in Table 1.
Table 1. Electron microprobe data for arsenates from the Tripi mine.

n = number of spot analyses. *Calculated in agreement with stoichiometry. σ = estimated standard deviation; – = not detected
Micro-Raman spectroscopy
Micro-Raman spectra of the minerals studied were collected using a Horiba Jobin-Yvon XploRA Plus apparatus, equipped with a motorised x–y stage and an Olympus BX41 microscope with a 50× objective (Dipartimento di Scienze della Terra, Università di Pisa). Raman spectra were excited using a 532 nm line of a solid-state laser, attenuated to 25% (i.e. 6.25 mW) in order to avoid any potential sample damage. The minimum lateral and depth resolution was set to a few μm. The system was calibrated using the 520.6 cm–1 Raman band of silicon before each experimental session. Spectra were collected through multiple acquisitions (3) with variable counting times, ranging from 30 to 180 s. Back-scattered radiation was analysed with a 1200 gr/mm grating monochromator. Experimental precision can be estimated at ± 2 cm–1. Whenever necessary, Raman spectra were processed using Fityk (Wojdyr, Reference Wojdyr2010), subtracting the background and fitting the spectra to theoretical peak shapes using pseudo-Voigt functions.
X-ray crystallography
Single-crystal X-ray diffraction data were collected for austinite, conichalcite and zincolivenite using a Bruker D8 Venture diffractometer (50 kV and 1.4 mA) equipped with an air-cooled Photon III detector and microfocus MoKα radiation (Centro per l'Integrazione della Strumentazione scientifica dell'Università di Pisa, Università di Pisa, Italy). For all the three crystals studied, the detector-to-crystal distance was set to 38 mm. The diffraction quality was good enough for crystals of austinite and zincolivenite, whereas no grains of conichalcite suitable for high-quality intensity data collection were found.
Data were collected using φ and ω scan modes, in 0.5° slices. Intensity data were integrated and corrected for Lorentz, polarisation, background effects and absorption using the APEX4 (Bruker AXS Inc., 2022) software package. Crystal structure refinements were performed using Shelxl–2018 (Sheldrick, Reference Sheldrick2015) and neutral scattering curves were taken from the International Tables for Crystallography (Wilson, Reference Wilson1992). Details of data collections and structure refinements are given in Table 2. Atomic coordinates and equivalent isotropic or isotropic displacement parameters are shown in Table 3, whereas selected bond distances are reported in Table 4. Bond-valence sums, calculated using the bond parameters of Gagné and Hawthorne (Reference Gagné and Hawthorne2015), are given in Table 5. Crystallographic information files of austinite and zincolivenite have been deposited with the Principal Editor of Mineralogical Magazine and are available as Supplementary material (see below). In the following, details of the structure refinements are briefly reported.
Table 2. Summary of crystal data and parameters describing data collections and refinements for austinite and zincolivenite from the Tripi mine.

1 Austinite: w = 1/[σ2(F o2)+(0.0263P)2+0.7514P], where P = (F o2+2F c2)/3
2 Zincolivenite: w = 1/[σ2(F o2) +2.3444P], where P = (F o2+2F c2)/3
Table 3. Sites, site occupancy factors*, fractional atom coordinates and isotropic (**) or equivalent isotropic displacement parameters (Å2) for austinite and zincolivenite from the Tripi mine.

* Site occupancy: M = Zn1.00
Table 4. Selected bond distances (Å) and angles (°) for austinite and zincolivenite from Tripi mine.

Table 5. Weighted bond-valence sums (in valence units) for austinite and zincolivenite from the Tripi mine.

Notes: left and right superscripts indicate the number of equivalent bonds involving anions and cations, respectively. The following site occupancies were used for calculating the bond-valence sums: in austinite, Ca = Ca1.00, Zn = Zn0.90Cu0.10 and As = As0.98P0.02; in zincolivenite, Cu(1) = Cu0.75Zn0.25, Zn(1) = Zn1.00 and As(1) = As1.00.
* Corrected for H bonds.
Austinite
A total of 1621 frames was collected, with exposure time of 10 s per frame. Unit-cell parameters are a = 7.4931(5), b = 9.0256(6), c = 5.9155(4) Å, V = 400.06(5) Å3, space group P212121, in agreement with systematic absences and the |E 2–1| value (i.e. 0.684). The crystal structure was refined starting from the atomic coordinates given by Giuseppetti and Tadini (Reference Giuseppetti and Tadini1988) for austinite. The following scattering curves were used: Ca at the Ca site, As at the As site, O at the O(1)–O(5) sites, and H at the H site. Taking into account the similarity in the scattering factors of Cu (Z = 29) and Zn (Z = 30), and the results of electron microprobe analysis, showing a Zn/(Zn + Cu) atomic ratio of 0.90(4), only the scattering factor of Zn was used to model the site scattering of the M site. After several cycles of isotropic refinement, the R 1 factor converged to 0.0336, thus confirming the correctness of the structural model. A restraint on the O(5)–H bond distance was added and the displacement parameter of H was refined assuming it is 1.5 times that of U eq of O(5). Racemic twinning was modelled, converging to a Flack parameter (Flack, Reference Flack1983) of 0.17(2). After the introduction of the anisotropic displacement parameters for all atoms (but H), the R 1 decreased to 0.0236 for 1210 unique reflections with F o > 4σ(F o) and 77 least-square parameters.
Conichalcite
Several grains of conichalcite were checked and all of them were polycrystalline, showing powder-like diffraction patterns. However, using a 30 × 30 × 30 μm grain, the refinement of the unit-cell parameters of one of the individuals forming the polycrystalline aggregate was possible, selecting the sharp spots superimposed on diffraction rings. On the basis of 176 reflections in the 2θ range between 7.08 and 39.37°, the following unit-cell parameters were refined: a = 7.419(10), b = 9.111(11), c = 5.867(7) Å and V = 396.6(1.4) Å3. Unfortunately, the intensity data had a very high R int value (0.238), and the crystal structure refinement converged to a high R 1 value of 0.1101 for 342 reflections with F o > 4σ(F o) and 49 least-square parameters (0.2334 for all the 871 measured reflections). For this reason, structural data of conichalcite are not discussed, and only electron microprobe data are presented.
Zincolivenite
A total of 1368 frames was collected, with exposure time of 25 s per frame. Unit-cell parameters are a = 8.4594(9), b = 8.5324(8), c = 5.9893(6) Å, V = 432.30(12) Å3 and space group Pnnm, in accord with systematic absences and the |E 2–1| value (i.e. 0.861). The crystal structure was refined starting from the atomic coordinates given by Chukanov et al. (Reference Chukanov, Pushcharovsky, Zubkova, Pekov, Pasero, Merlino, Möckel, Rabadanov and Belakovskiy2007) for zincolivenite. The following scattering curves were used: As, Cu and Zn at the As(1), Cu(1) and Zn(1) sites, and O at the O(1)–O(4) sites. Owing to the similar scattering factors of Cu (Z = 29) and Zn (Z = 30), the site occupancy of the Cu(1) and Zn(1) sites was refined assuming a pure occupancy. After several cycles of isotropic refinement, the R 1 factor converged to 0.0520, confirming the correctness of the structural model. Introducing the anisotropic displacement parameters for all the atoms decreased the R 1 to 0.0234. The site hosting the H atom was not correctly located in the difference-Fourier maps and it was added on the basis of the atom coordinates given by Chukanov et al. (Reference Chukanov, Pushcharovsky, Zubkova, Pekov, Pasero, Merlino, Möckel, Rabadanov and Belakovskiy2007). A restraint on the O(2)–H bond distance was added and the displacement parameter of the H atom was restrained to be 1.5 times that of O(2). The refinement converged to R 1 = 0.0230 for 523 unique reflections with F o > 4σ(F o) and 47 least-square parameters.
Results and discussion
Chemical data
Chemical formulae of austinite, conichalcite and zincolivenite were recalculated on the basis of 3 cations per formula unit (pfu), assuming the presence of the amount of H2O required to achieve the electrostatic balance.
The total of conichalcite is low, even after the addition of calculated H2O; this is probably due to the small size of the polished grain embedded in epoxy. Such low totals were observed previously by other authors during the examination of this species (e.g. Braithwaite et al., Reference Braithwaite, Green and Tindle2009). However, atom ratios agree with the ideal formula of this mineral.
Austinite and conichalcite and their solid-solution series
The chemical formula of austinite from the Tripi mine is Ca1.04(1)Zn0.86(4)Cu0.09(4)As0.98(2)P0.02(1)O4(OH)0.98, whereas that of conichalcite is Ca0.98(1)Fe2+0.02(4)Cu0.69(10)Zn0.30(6)As0.97(2)P0.03(1)O4(OH)0.98. With respect to the ideal formula, austinite has minor Cu-to-Zn and P-to-As substitutions, and a slight Ca excess; on the contrary, in conichalcite the replacement of Zn by Cu is significant. Minor Fe, assumed as Fe2+, may partially replace Ca2+ or Zn2+. However, owing to the oxidised nature of the assemblage studied, the occurrence of Fe3+ cannot be discarded. The relationship between the Zn and Cu contents, in atoms pfu, in austinite and conichalcite is shown in Fig. 2. Austinite has a Cu/(Cu + Zn) atomic ratio ranging between 0.03 and 0.23, whereas conichalcite from Tripi has the same ratio in the range 0.58–0.77.

Figure 2. Relationship between Cu and Zn (in atoms per formula unit) in austinite (grey diamonds), conichalcite (green diamonds) and zincolivenite (light green diamonds) from the Tripi mine. Red circles indicate compositional data for austinite and conichalcite after Staples (Reference Staples1935), Radcliffe and Simmons (Reference Radcliffe and Simmons1971), Gunter (Reference Gunter1977), Jambor et al. (Reference Jambor, Owens and Dutrizac1980), Giuseppetti and Tadini (Reference Giuseppetti and Tadini1988), Henderson et al. (Reference Henderson, Yang, Downs and Jenkins2008), Sakai et al. (Reference Sakai, Yoshiasa, Sugiyama and Miyawaki2009) and Ðorđević et al. (Reference Ðorđević, Kolitsch and Nasadala2016).
Further analytical data from literature for the isotypic series between austinite and conichalcite analysis is also plotted in Fig. 2. Type material of the former was Cu free (Staples, Reference Staples1935) and other occurrences of austinite are usually Cu poor. For instance, Giuseppetti and Tadini (Reference Giuseppetti and Tadini1988) reported the replacement of Zn by 0.03 Cu atoms and 0.01 Fe atoms pfu for a sample from Kamareza (Greece), whereas Clark et al. (Reference Clark, Pluth, Steele, Smith and Sutton1997) gave the composition Ca(Zn0.95Cu0.03Mg0.02)AsO4(OH) for a sample from Sonora (Mexico). Gunter (Reference Gunter1977) provided several analyses of members of the austinite–conichalcite series, with Cu/(Cu + Zn) atomic ratios in the range 0.47–1.00. Lead-bearing conichalcite described by Jambor et al. (Reference Jambor, Owens and Dutrizac1980) has a Cu/(Cu + Zn) ratio in the interval 0.69–0.91, and similarly Taggart and Foord (Reference Taggart and Foord1980), on the basis of electron dispersive spectroscopy data, found ratios of 0.11 for Cu-rich austinite and 0.60 for conichalcite. Henderson et al. (Reference Henderson, Yang, Downs and Jenkins2008) refined a sample of conichalcite from the RRUFF project with only 0.01 Zn pfu. Other specimens of conichalcite from RRUFF have up to 0.30 Zn apfu (see http://rruff.info – Lafuente et al., Reference Lafuente, Downs, Yang, Stone, Armbruster and Danisi2015). Conichalcite studied by Sakai et al. (Reference Sakai, Yoshiasa, Sugiyama and Miyawaki2009) has no Zn, and Cu was partly replaced by very small amounts of Mg (up to 0.13 atoms pfu in a sample from Fukushima, Japan). Finally, conichalcite studied by Ðorđević et al. (Reference Ðorđević, Kolitsch and Nasadala2016) has a Cu/(Cu + Zn) ratio of 0.97.
It is interesting to note that type material of the Pb-analogue of austinite, arsendescloizite PbZn(AsO4)(OH), contains no Cu (Keller and Dunn, Reference Keller and Dunn1982), whereas the P-analogue of conichalcite, hermannroseite, ideally CaCu(PO4)(OH), has a very small Zn content (Schlüter et al., Reference Schlüter, Pohl and Gebhard2011).
Notwithstanding the hypothesis of Radcliffe and Simmons (Reference Radcliffe and Simmons1971) who suggested a complete solid solution between austinite and conichalcite, the evidence is meagre. Indeed, Fig. 2 suggests the possible existence of a miscibility gap in the compositional region having Cu/(Cu + Zn) in the range 0.25–0.50, i.e. (Zn0.25Cu0.75)–(Zn0.50Cu0.50). This could be due to the Jahn-Teller effect shown by Cu2+ (Burns and Hawthorne, Reference Burns and Hawthorne1996); indeed, it is well-known that Cu2+ and Zn often tend to be partitioned in different structural sites, characterised by a different degree of distortion, e.g. in paratacamite and herbertsmithite (Braithwaite et al., Reference Braithwaite, Mereiter, Paar and Clark2004), in rosasite (Perchiazzi, Reference Perchiazzi2006), in ktenasite (Mellini and Merlino, Reference Mellini and Merlino1978) and in zincolivenite (Chukanov et al., Reference Chukanov, Pushcharovsky, Zubkova, Pekov, Pasero, Merlino, Möckel, Rabadanov and Belakovskiy2007). The finding of both austinite and conichalcite in the same small vugs of a calcite vein from the Tripi mine is in keeping with this hypothesis; indeed, two distinct phases crystallised instead of a single phase with intermediate composition.
Zincolivenite
The chemical formula of zincolivenite from the Tripi mine is Cu0.73(5)Zn1.25(5)As1.01(1)O4(OH)1.01. The Cu/(Cu + Zn) atomic ratio ranges between 0.33 and 0.41 (Fig. 2). This occurrence is richer in Zn than type material from the Lavrion deposit (Greece), having composition Cu0.94Zn1.03Fe0.02[(AsO4)0.98(PO4)0.02](OH)0.98(H2O)0.10, it is close to a sample from Dal'negorsk (Russia), with composition Cu0.58Mg0.07Zn1.36(AsO4)(OH)0.98O0.02 (Chukanov et al., Reference Chukanov, Pushcharovsky, Zubkova, Pekov, Pasero, Merlino, Möckel, Rabadanov and Belakovskiy2007). According to these authors, the chemical composition of zincolivenite should span the range between Cu0.5Zn1.5(AsO4)(OH) and Cu1.5Zn0.5(AsO4)(OH). Zinc-rich zincolivenite from the Tripi mine also has a composition similar to the specimen reported by Šejkora et al. (Reference Sejkora, Škovíra and Škoda2008) from Krupka, northern Bohemia (Czech Republic), with composition (Zn1.27Cu0.62Al0.08Pb0.01Ca0.01)[(AsO4)0.98(PO4)0.01(SO4)0.01](OH)1.09. Other quantitative data on zincolivenite are given by Gołębiowska et al. (Reference Gołębiowska, Pieczka and Franus2006), Braithwaite et al. (Reference Braithwaite, Green and Tindle2009) and Andersen and Moulding (Reference Andersen and Moulding2009).
Micro-Raman spectroscopy
Austinite and conichalcite
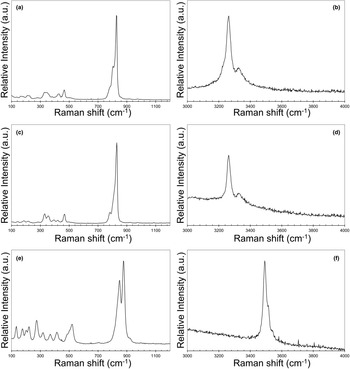
The Raman spectra of austinite and conichalcite are shown in Fig. 3. The observed bands are at similar positions and only minor differences, in the lower wavenumber region, were observed.

Figure 3. Raman spectra of austinite (a,b), conichalcite (c,d) and zincolivenite (e,f) in the region between 100–1200 cm–1 and 3000–4000 cm–1.
In the region between 100 and 1200 cm–1, the strongest Raman band occurs at 828 and 831 cm–1 for austinite and conichalcite, respectively, with two additional weaker bands at 784 and 805 cm–1 in both Raman spectra. These bands can be attributed to the ν3 and ν1 modes of AsO4 groups, in agreement with Reddy et al. (Reference Reddy, Frost and Martens2005) and Ðorđević et al. (Reference Ðorđević, Kolitsch and Nasadala2016). It is worth noting that, in this spectral region, Martens et al. (Reference Martens, Frost and Williams2003b) also reported strong bands at 859 and 889 cm–1. However these bands have not been observed in the sample from the Tripi mine or in isotypic phases like cobaltaustinite CaCo(AsO4)(OH) and nickelaustinite CaNi(AsO4)(OH). Finally, the occurrence of these bands do not agree with the infrared spectral features described by Sumin de Portilla (Reference Sumin de Portilla1974). In conclusion, the spectrum of austinite reported by Martens et al. (Reference Martens, Frost and Williams2003b) is not representative of this species. In the sample from the Tripi mine, two very weak bands occur at 920 and 975 cm–1 and at 924 and 975 cm–1 in the Raman spectra of austinite and conichalcite, respectively, and they could be attributed to the O–H deformation modes (e.g. Martens et al., Reference Martens, Frost and Williams2003b; Reddy et al., Reference Reddy, Frost and Martens2005).
In the spectrum of austinite, bands at 381, 430 and 466 cm–1 can be related to the ν4 bending modes of AsO4 groups; these bands were observed at 394, 424 and 469 cm–1 in the spectrum of conichalcite. Weak bands at 502 cm–1 for austinite and at 502 and 518 cm–1 in conichalcite may be interpreted as due to ν4 modes, although these band could be due to M–O stretching vibrations, in agreement with Martens et al. (Reference Martens, Frost and Williams2003b) who proposed such a possible interpretation for bands at 487 and 495 cm–1 observed in cobaltaustinite and nickelaustinite, respectively. The ν2 bending modes of AsO4 groups is possibly related to the bands at 328 and 347 cm–1 in the spectrum of austinite and at 330 and 353 cm–1 in that of conichalcite. Raman bands at lower wavenumbers, i.e., 134, 173, 216 and 281 cm–1 in austinite and 144, 188, 218 and 283 cm–1 in conichalcite, can be interpreted either as lattice modes or M–O vibrations.
In the region between 3000 and 4000 cm–1, a relatively strong band at 3265 cm–1 was observed in both austinite and conichalcite, with a shoulder at 3330 cm–1. These bands are related to the O–H stretching modes. Whereas in the olivenite–adamite series the band shift in the O–H stretching region can allow prediction of the local cation arrangements around the (OH) group (see below), this seems to be not applicable to the austinite–conichalcite isotypic pair. In these compounds, the (OH) group is bonded to one Ca and two M cations (M = Zn or Cu in austinite and conichalcite, respectively). It is worth noting that the M–(OH) bonds are the shortest ones in the M-centred octahedra; the replacement of Zn2+ by Cu2+, the latter being responsible for the Jahn-Teller effect distorting the coordination polyhedron (Burns and Hawthorne, Reference Burns and Hawthorne1996), did not significantly affect such short distances. For this reason, the O⋅⋅⋅O distance of the H-bonds in austinite and conichalcite may be not so different to give rise to significant Raman shifts, i.e. 2.721–2.723 Å in austinite (Giuseppetti and Tadini, Reference Giuseppetti and Tadini1988; Clark et al., Reference Clark, Pluth, Steele, Smith and Sutton1997) and 2.741 Å in conichalcite (Sakai et al., Reference Sakai, Yoshiasa, Sugiyama and Miyawaki2009). However, Henderson et al. (Reference Henderson, Yang, Downs and Jenkins2008) reported a shorter O⋅⋅⋅O distance for conichalcite, i.e. 2.678 Å, stating that, in agreement with the relations between O⋅⋅⋅O and the wavenumber of O–H stretching modes (Libowitzky, Reference Libowitzky1999), conichalcite should show the smallest O–H wavenumber in the adelite series. In this respect, they cited the band at 3158 cm–1 observed by Martens et al. (Reference Martens, Frost and Williams2003b); a similar band position was reported by Reddy et al. (Reference Reddy, Frost and Martens2005) at 3148 cm–1. This band position corresponds, according to Libowitzky (Reference Libowitzky1999), to an O⋅⋅⋅O distance of ca. 2.69 Å, in agreement with the distance observed by Henderson et al. (Reference Henderson, Yang, Downs and Jenkins2008). This seems to suggest that a systematic study of the spectral features of the O–H stretching region on well-characterised specimens of the austinite–conichalcite isotypic series is mandatory to understand the actual relations between their crystal chemistry and band positions.
Zincolivenite
The Raman spectrum of zincolivenite is shown in Fig. 3. The region between 100 and 1200 cm–1 is characterised by two strong bands at 850 and 876 cm–1, with a weak shoulder at 924 cm–1.The strong bands can be interpreted as due to the ν3 and ν1 stretching modes of AsO4 groups, in agreement with Martens et al. (Reference Martens, Frost, Kloprogge and Williams2003a) and Makreski et al. (Reference Makreski, Jovanovski, Pejov, Kloess, Hoebler and Jovanovski2013). The weak shoulder at 924 cm–1 could be due to O–H deformation modes, as in the austinite–conichalcite pair (see above).
Bands at 487, 502 and 520 cm–1 can be interpreted as due to the ν4 bending modes of AsO4 groups, whereas the ν2 modes can be represented by the band at 414 cm–1. Makreski et al. (Reference Makreski, Jovanovski, Pejov, Kloess, Hoebler and Jovanovski2013) interpreted the bands at 325 and 380 cm–1 in the Raman spectrum of adamite as due to the vibrations of M2+O5 unit; in agreement with this interpretation, a similar attribution can be proposed for the bands at 320 and 369 cm–1 observed in zincolivenite from the Tripi mine. Finally, bands at 135, 175, 202, 222 and 274 cm–1 are probably due to M–O modes and lattice vibrations.
In the 3000–4000 cm–1 region, three sharp bands were observed at 3492, 3514 and 3540 cm–1. These three bands can be interpreted as due to O–H stretching modes and they can be related to different local Cu–Zn distributions, in agreement with the interpretation of Chisholm (Reference Chisholm1985), based on previous results of Braithwaite (Reference Braithwaite1983). Taking into account the electron microprobe data of zincolivenite from the Tripi mine, the site occupancy (Cu0.75Zn0.25) and Zn1.00 can be proposed for the Cu(1) and Zn(1) sites, respectively. As the (OH) group is bonded to one Zn(1) and two Cu(1) sites, the following cation distributions around the (OH) group can be observed [elements are listed according to the occupancy of sites Zn(1)Cu(1)Cu(1)]: (i) ZnCuCu; (ii) ZnCuZn; and (iii) ZnZnZn. In agreement with Chisholm (Reference Chisholm1985), these three different local arrangements should correspond to bands at 3490, 3510 and 3540 cm–1, comparable with the values observed in the Sicilian sample studied in this work. Moreover, considering the relative proportions of Zn and Cu, configuration (i) is more abundant than configurations (ii) and (iii). Through the fitting of the O–H stretching bands using Fityk (Wojdyr, Reference Wojdyr2010), a ratio 75:17:8 for the three possible arrangements has been obtained. This ratio can be taken into account qualitatively to indicate that ZnCuCu is the most probable configuration, followed by the configurations ZnCuZn and ZnZnZn, in agreement with the electron microprobe data and the Cu and Zn preferential partitioning at Cu(1) and Zn(1) sites, respectively.
Crystal structure description
Austinite and conichalcite
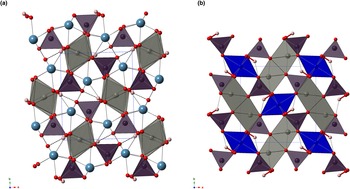
Austinite and conichalcite belong to the adelite group within the descloizite supergroup. In agreement with previous authors (Qurashi and Barnes, Reference Qurashi and Barnes1963; Giuseppetti and Tadini, Reference Giuseppetti and Tadini1988; Clark et al., Reference Clark, Pluth, Steele, Smith and Sutton1997; Henderson et al., Reference Henderson, Yang, Downs and Jenkins2008; Sakai et al., Reference Sakai, Yoshiasa, Sugiyama and Miyawaki2009; Ðorđević et al., Reference Ðorđević, Kolitsch and Nasadala2016), their crystal structure can be described as formed by columns of edge-sharing M-centred octahedra running along c; every chain is connected to four adjacent octahedral chains through corner-sharing As-centred tetrahedra. In the cavities resulting from this heteropolyhedral framework, eight-fold coordinated Ca2+ cations are hosted (Fig. 4). Following Eby and Hawthorne (Reference Eby and Hawthorne1993), the structure of the isotypic pair austinite–conichalcite could be described as a M = M–T framework, i.e. edge-sharing octahedral chains linked by tetrahedral corners.

Figure 4. Crystal structures of austinite (a) and zincolivenite (b) seen down c. Arsenic-, Cu- and Zn-centred polyhedra are shown in violet, blue and grey, respectively. Circles represent Ca (light blue), O (red) and H (pink) atoms. Thick red lines and dashed black lines are, respectively, O–H and H⋅⋅⋅O bonds. Unit cells are shown as blue dotted lines. Drawn with CrystalMaker ® software.
In austinite, M is zinc. This element is octahedrally coordinated by four O2– and two (OH)– groups. Bond distances range between 1.936 and 2.234 Å, with average <Zn–O> distance of 2.101 Å, to be compared with 2.104 and 2.106 Å observed by Giuseppetti and Tadini (Reference Giuseppetti and Tadini1988) and Clark et al. (Reference Clark, Pluth, Steele, Smith and Sutton1997), respectively. The two shortest Zn–O distances are formed with (OH) groups (1.936 and 1.951 Å, respectively), in agreement with previous studies (Giuseppetti and Tadini, Reference Giuseppetti and Tadini1988; Clark et al., Reference Clark, Pluth, Steele, Smith and Sutton1997). The difference between the longest and shortest Zn–O distance is 0.297 Å, to be compared with 0.311 and 0.300 Å given by Giuseppetti and Tadini (Reference Giuseppetti and Tadini1988) and Clark et al. (Reference Clark, Pluth, Steele, Smith and Sutton1997); this difference is increased in conichalcite, e.g. 0.476, 0.470 and 0.503–0.504 Å for conichalcite from Arizona, Japan and Chile, respectively (Henderson et al., Reference Henderson, Yang, Downs and Jenkins2008; Sakai et al., Reference Sakai, Yoshiasa, Sugiyama and Miyawaki2009; Ðorđević et al., Reference Ðorđević, Kolitsch and Nasadala2016). This is due to the Jahn-Teller effect shown by Cu2+ (Burns and Hawthorne, Reference Burns and Hawthorne1996). Along the columns, Zn–Zn distance is 2.967 Å, close to 2.970 Å reported for the sample from Kamareza studied by Giuseppetti and Tadini (Reference Giuseppetti and Tadini1988), whereas it is shorter than that observed by Clark et al. (Reference Clark, Pluth, Steele, Smith and Sutton1997) for the sample from Sonora, i.e. 2.977 Å. This is probably due to the minor replacement of Zn by Cu observed in the sample from Tripi. In conichalcite, indeed, the Cu–Cu distance along the c direction is 2.92–2.93 Å (Qurashi and Barnes, Reference Qurashi and Barnes1963; Sakai et al., Reference Sakai, Yoshiasa, Sugiyama and Miyawaki2009). According to Clark et al. (Reference Clark, Pluth, Steele, Smith and Sutton1997), the value observed by Giuseppetti and Tadini (Reference Giuseppetti and Tadini1988) could indicate some Cu substitution, in agreement with data of austinite from the Tripi mine. The bond-valence sum at the Zn site, calculated assuming the site population (Zn0.90Cu0.10), is 2.11 valence units (vu) (Table 5).
Arsenic is tetrahedrally coordinated, with As–O bonds ranging between 1.681 and 1.697 Å. The average <As–O> bond distance is 1.688 Å, comparable to 1.692 and 1.694 Å of Giuseppetti and Tadini (Reference Giuseppetti and Tadini1988) and Clark et al. (Reference Clark, Pluth, Steele, Smith and Sutton1997), respectively, and fitting with the grand value of 1.688 Å given by Majzlan et al. (Reference Majzlan, Drahota, Filippi, Bowell, Alpers, Jamieson, Nordstrom and Majzlan2014). The bond-valence sum at this site, calculated with the site occupancy (As0.98P0.02), is 4.94 vu (Table 5), in agreement with the occurrence of As5+.
Calcium is coordinated by seven O2- and one (OH)- group in a distorted square antiprism. Calcium–O distances range between 2.309 and 2.657 Å, the shortest distance being represented by the Ca–(OH) bond. These distances can be compared with the results of Giuseppetti and Tadini (Reference Giuseppetti and Tadini1988) and Clark et al. (Reference Clark, Pluth, Steele, Smith and Sutton1997), who reported Ca–O distances in the range 2.315–2.656 Å and 2.313–2.661 Å, respectively. The CaO7(OH) polyhedron shares edges with two AsO4 tetrahedra and three edges with Zn-centred octahedra; the edges shared with AsO4 groups are the shortest ones in the Ca-centred polyhedron. The bond-valence sum at the Ca site is 1.85 vu (Table 5).
Oxygen atoms are three- or four-fold coordinated by Ca, Zn and As atoms. Those atoms hosted at O(1), O(2) and O(4) sites are bonded to these three cations, achieving bond-valence sums ranging between 1.87 and 2.02 vu, in agreement with the occurrence of O2- anions. On the contrary, oxygen atoms at O(2) and O(5) are three-fold coordinated. The former is bonded to two Ca and one As atom, with a bond-valence sum of 1.67 vu, whereas the latter is bonded to one Ca and two Zn atoms, with a bond-valence sum of 1.40 vu. The undersaturation of O(2) and O(5) indicates their involvement in the O(5)–H⋅⋅⋅O(2) hydrogen bond. The O(5)⋅⋅⋅O(2) distance is 2.719(5) Å, to be compared with 2.721 and 2.723 Å given by Giuseppetti and Tadini (Reference Giuseppetti and Tadini1988) and Clark et al. (Reference Clark, Pluth, Steele, Smith and Sutton1997); using relationships between bond distance and bond strength in H bonds from Ferraris and Ivaldi (Reference Ferraris and Ivaldi1988), such a distance corresponds to a bond strength of 0.22 vu. These values agree with the O⋅⋅⋅O distances estimated on the basis of the wavenumbers of O–H stretching modes observed in the Raman spectrum of austinite following Libowitzky (Reference Libowitzky1999), i.e. 2.726 and 2.755 Å, respectively.
Zincolivenite
Zincolivenite belongs to the olivenite group, a series of orthorhombic and monoclinic arsenates and phosphates whose crystal structures are related to that of andalusite, Al2SiO4O. The crystal structure of zincolivenite can be described as formed by chains of edge-sharing distorted Cu(1)O4(OH)2 octahedra running along c. These octahedral chains are connected by isolated As(1)O4 tetrahedra through corner-sharing, giving rise to channels where dimers of edge-sharing Zn(1)O4(OH) trigonal bipyramids are hosted.
Copper is in a distorted octahedral coordination. Bond distances range between 2.006 and 2.359 Å, with an average value of 2.124 Å. These values can be compared with those given by Chukanov et al. (Reference Chukanov, Pushcharovsky, Zubkova, Pekov, Pasero, Merlino, Möckel, Rabadanov and Belakovskiy2007) for type zincolivenite from Lavrion, Greece and by Toman (Reference Toman1978) for a sample from Tsumeb, Namibia. The former has an average <Cu–O> distance of 2.132 Å (range 1.986–2.409 Å) and the latter 2.12 Å (range 1.99–2.37 Å). It is interesting to observe that the difference between the longest and shortest Cu–O distances is 0.35, 0.38 and 0.42 Å for the samples from Tripi, Tsumeb, and Lavrion, respectively; this increasing difference is directly related to the Cu content. Indeed, the Cu/(Cu + Zn) atomic ratios of these three studied samples are 0.37, 0.42 and 0.48, respectively. The higher the Cu content, the higher is the distortion of the Cu-centred Cu(1) octahedron. This is in keeping with the Jahn-Teller effect shown by Cu2+ (Burns and Hawthorne, Reference Burns and Hawthorne1996). In the Tripi mine, the Cu(1) site is probably a mixed (Cu,Zn) site, with an idealised site occupancy (Cu0.75Zn0.25), based on electron microprobe data. The bond-valence sum at this site, calculated using this site occupancy, is 1.96 vu. (Table 5).
Zinc is hosted at the Zn(1) site. In zincolivenite from the Tripi mine, the average <Zn–O> is 2.030 Å, with bond distances ranging between 1.999 and 2.083 Å. These features are close to those observed in the Greek and Namibian specimens by Chukanov et al. (Reference Chukanov, Pushcharovsky, Zubkova, Pekov, Pasero, Merlino, Möckel, Rabadanov and Belakovskiy2007) and Tomin (1978), respectively. In the former, the average distance is 2.031 Å (range 1.998–2.074 Å), and in the latter 2.04 Å (range 2.00–2.08 Å). The bond-valence sum at the Zn(1) site is 2.03 vu. (Table 5).
Arsenic is tetrahedrally coordinated, with As–O bonds ranging between 1.679 and 1.694 Å. Average <As–O> bond distance is 1.684 Å, comparable to 1.690 and 1.689 Å of Chukanov et al. (Reference Chukanov, Pushcharovsky, Zubkova, Pekov, Pasero, Merlino, Möckel, Rabadanov and Belakovskiy2007) and Tomin (1978). The bond-valence sum is 5.04 vu. (Table 5).
Among the four symmetry-independent O atoms, three have bond-valence sums ranging between 1.88 and 2.04 vu, whereas the fourth, namely the oxygen atom at the O(2) site, shows a strong undersaturation, i.e. 1.19 vu. This latter atom is involved in a H bond with O(4), with the O(2)–H⋅⋅⋅O(4) distance of 2.883(4) Å, corresponding to a bond strength of 0.16 vu. (according to Ferraris and Ivaldi, Reference Ferraris and Ivaldi1988); taking into account the bifurcated nature of this H bond (as, for instance, in adamite or the related phosphate libethenite – e.g. Cordsen, Reference Cordsen1978; Jinnouchi et al., Reference Jinnouchi, Yoshiasa, Sugiyama, Shimura, Arima, Momma and Miyawaki2016), the bond valence at the O(4) site is increased by 0.08 vu, up to 1.96 vu, in agreement with the occurrence of O2– anions. The observed O⋅⋅⋅O distance agrees with the bond lengths calculated using the relation of Libowitzky (Reference Libowitzky1999), i.e. between 2.88 and 2.97 Å.
Conclusions
The crystal chemical characterisation of austinite, conichalcite and zincolivenite is a further step in the knowledge of the supergene phases formed through the alteration of base-metal ore deposits of the Peloritani Mountains, after the study on the alunite-supergroup mineral kintoreite (Mauro et al., Reference Mauro, Biagioni and Zaccarini2022). In particular, the identification of these three arsenates gives interesting insights for the speciation, transport and dispersion of As in this sector of Sicily, where, as discussed briefly in the Introduction, high contents of this toxic element (as well as other PTE) have been reported in stream sediments and soils since the beginning of the 1990s (e.g. De Vivo et al., Reference De Vivo, Lima, Catalano and Chersicla1993; Cosenza et al., Reference Cosenza, Lima, Ayuso, Foley, Albanese, Messina and De Vivo2015).
This study also provides some interesting crystal-chemical and physical data for the arsenates studied. Some unexpected spectral features described by Martens et al. (Reference Martens, Frost and Williams2003b) in the Raman spectrum of austinite (i.e. the occurrence of strong bands at 889 and 859 cm–1) are not supported by the current study, where the same grain used for single-crystal X-ray diffraction study and electron microprobe analysis was used for the collection of micro-Raman spectra. Some discrepancies occur also in the O–H stretching region, suggesting the opportunity to perform a systematic study on well-characterised specimens of the austinite–conichalcite isotypic series to describe the actual relations between crystal-chemistry and the band position of the O–H stretching modes. Moreover, a critical examination of the austinite–conichalcite isotypic pair suggests the existence of a miscibility gap between these two species, in disagreement with the hypothesis of Radcliffe and Simmons (Reference Radcliffe and Simmons1971). This gap would not be surprising, considering the Jahn-Teller effect shown by Cu2+ cations and the Zn/Cu different partitioning observed in several mineral species. One of them is represented by zincolivenite. The refinement of the crystal structure of Zn-rich zincolivenite from the Tripi mine, with a Cu/(Cu + Zn) atomic ratio different from the samples studied previously by Toman (Reference Toman1978) and Chukanov et al. (Reference Chukanov, Pushcharovsky, Zubkova, Pekov, Pasero, Merlino, Möckel, Rabadanov and Belakovskiy2007), has shown that, between Cu(1) and Zn(1), only the former seems to be affected by geometrical changes related to the different chemistry. Majzlan et al. (Reference Majzlan, Števko, Plášil, Sejkora and Dachs2023) stated that anomalous X-ray diffraction would be required to prove cation ordering in zincolivenite. This is correct, but it should be noted that examination of the geometrical features of the Cu(1) and Zn(1) sites in the available refinements of zincolivenite supports the presence of Cu and Zn ordering; the study of other specimens, possibly Cu-rich, may be able to support or refute this statement.
Acknowledgements
Peter Leverett and an anonymous reviewer are acknowledged for their useful comments. R. Gunter is thanked for making available his B.Sc. Thesis. This research was financially supported by the Ministero dell'Istruzione, Università e Ricerca through the project PRIN 2017 “TEOREM – deciphering geological processes using Terrestrial and Extraterrestrial ORE Minerals”, prot. 2017AK8C32 and by the Ministry of Culture of the Czech Republic (long-term project DKRVO 2019–2023/1.II.e; National Museum, 00023272) for JS.
Supplementary material
The supplementary material for this article can be found at https://doi.org/10.1180/mgm.2023.49.
Competing interests
The authors declare none.


 Open access