
Cerebral Small Vessel Disease Is Associated with Motor, Cognitive, and Emotional Dysfunction in Multiple System Atrophy
Abstract
Background:
Cerebral small vessel disease (CSVD) has not been systematically studied in patients with multiple system atrophy (MSA).
Objective:
We sought to explore whether MSA patients suffer from a heavier CSVD burden relative to healthy individuals and whether CSVD has a relationship with motor, cognitive, and emotional dysfunction in patients with MSA.
Methods:
This study consecutively recruited 190 MSA patients and 190 matched healthy controls whose overall CSVD burden and single CSVD imaging markers (including white matter hyperintensity (WMH), microbleeds, lacunes, and enlarged perivascular spaces (EPVS)) were measured. Of the MSA patients, 118 completed multi-dimensional outcome assessments. Spearman’s correlations and multivariable linear regressions were performed.
Results:
We observed a greater burden of overall CSVD, WMH, and EPVS in MSA patients compared with controls, but not for microbleeds and lacunes. Motor dysfunction and cognitive impairment were significantly worse in subjects with severe CSVD than those with none-to-mild CSVD. In patients with MSA, the severity of CSVD burden was positively associated with motor impairments as measured by the Unified Multiple System Atrophy Rating Scale-II (β= 2.430, p = 0.039) and Scale for the Assessment and Rating of Ataxia (β= 1.882, p = 0.015). Of CSVD imaging markers, different associations with MSA outcomes were displayed. WMH was associated with motor, cognitive, and emotional deficits, while the EPVS in the centrum semiovale, basal ganglia, and hippocampus regions was correlated only with motor severity, anxiety, and cognition, respectively. Similar findings were noted in MSA-cerebellar and MSA-parkinsonian patients.
Conclusions:
Concomitant CSVD may be correlated with worse multi-dimensional dysfunction in patients with MSA.
INTRODUCTION
Multiple system atrophy (MSA) is an adult-onset, devastating, and fatal neurodegenerative disease characterized by progressive autonomic dysfunction, cerebellar impairment, and parkinsonism [1, 2]. The pathologic hallmark is the cytoplasmic inclusions formed in oligodendrocytes by the accumulation of aggregated α-synuclein [1, 2], which qualifies MSA as an α-synucleinopathy. Emerging evidence has suggested that non-motor symptoms including cognitive impairment, anxiety, and depression may be the under-recognized features in MSA [3–6]. Multiple symptoms of cerebral small vascular disease (CSVD) are documented to overlap with these symptoms of MSA. The mechanisms underlying CSVD may include the destruction of the blood-brain barrier (BBB) caused by endothelial cell dysfunction and cerebral hypoperfusion resulting from autoregulation disorders, which may also be involved in the pathophysiology of MSA [7–10]. Therefore, due to the additive effect of the symptoms and a shared possible mechanism, it is reasonable to speculate that CSVD may be related to MSA closely.
Recent studies mainly focused on single CSVD markers and may have overlooked the effects of overall CSVD burden and other neuroimaging makers. Previous studies reported a greater white matter hyperintensity (WMH) burden in patients with MSA compared with controls, but there were no significant differences in lacunes [11, 12]. Microstructural abnormalities of WMH in MSA were also confirmed by studies based on diffusion-tensor imaging (DTI) [13, 14] and diffusion magnetic resonance imaging (dMRI) [15, 16]. In addition to WMH and lacunes, CSVD imaging markers also include enlarged perivascular spaces (EPVS) and microbleeds [17]. However, they have not been clarified in MSA patients, nor have the overall CSVD burden. Moreover, few studies explored the relationship between CSVD and MSA outcomes, only one study from Japan recruited 16 MSA patients and explored the microstructural white matter abnormalities and clinical symptoms [18]. They found that DTI may be useful for the severity assessment of motor dysfunction, but they did not focus on non-motor symptoms including cognitive impairment, anxiety, and depression [18]. Accordingly, a comprehensive investigation into whether and how various CSVD neuroimaging features influence multiple functional domains of MSA is an important issue that warrants to be addressed.
The total CSVD score integrating four imaging manifestations is created to capture the overall effect of CSVD on the brain and has been used extensively in clinical studies [19]. Herein, the first purpose of this study is to explore whether patients with MSA and healthy individuals differ in CSVD burden. The second one is to investigate the impact of overall CSVD burden and four separate CSVD imaging markers (WMH, lacunes, EPVS, and microbleeds) on multi-dimensional functional domains of MSA.
METHODS
Study population
We consecutively recruited MSA patients at the Department of Neurology of Huashan Hospital from August 2019 to February 2022. All patients were diagnosed with clinically probable MSA according to the Movement Disorder Society Criteria [20], including a combination of core clinical features (rigorously autonomic dysfunction, poorly levodopa responsive parkinsonism or cerebellar ataxia), and no unsupporting features. Patients were further classified as MSA-parkinsonian type (MSA-P) and MSA-cerebellar type (MSA-C) based on the predominant motor phenotype. Importantly, FDG-PET and DAT-PET were performed to further discriminate it from Parkinson’s disease (PD) and Lewy body dementia. For FDG-PET, MSA patients had low metabolism in the putamen (posterior), pons, and cerebellum, which can be used to distinguish it from PD and Lewy body dementia [21]. If the DAT-PET was normal, it can help to rule out PD and MSA-P [22]. Genetic testing was administered to differentiate it from spinocerebellar ataxia if necessary. All the MSA patients included in this study had their clinical diagnosis verified by follow-up every 6 months and by the recently updated diagnostic criteria [2], if not, the patient was excluded. For assessing CSVD neuroimaging manifestation, only patients who performed cranial MRI examinations were included in our analysis. For the control group, we randomly selected age- and sex-matched healthy subjects who visited the Medical Examination Center of Shanghai Fifth People’s Hospital for routine medical evaluation with available cranial MRI and blood examinations. All the subjects with central nervous system infections, head trauma, other neurodegenerative disorders (e.g., PD, Lewy body dementia, spinocerebellar ataxia, Alzheimer’s disease), other major neurological disorders, major psychological diseases, severe systemic diseases (e.g., cancer), and family history of genetic diseases were excluded.
This study was approved by the regional ethical committees of Huashan Hospital and Shanghai Fifth People’s Hospital (approval number: KY2020-116, KY2020-065 for Huashan Hospital, and 2021-211 for Shanghai Fifth People’s Hospital). Written informed consent was obtained from all participants or authorized representatives. All research procedures adhered to the tenets of the Declaration of Helsinki.
Clinical assessment
Fasting venous blood samples were used to measure triglyceride, total cholesterol, low-density lipoprotein (LDL), high-density lipoprotein (HDL), and homocysteine. Baseline demographic characteristics related to age, sex, smoking status, and comorbid conditions such as diabetes and supine hypertension were obtained after admission through face-to-face interviews by the neurologists. Supine hypertension was defined as a supine systolic blood pressure ≥140 mmHg or a diastolic blood pressure ≥90 mmHg. Orthostatic blood pressure was evaluated at the bedside, and defined as a sustained reduction of systolic blood pressure of at least 30 mmHg or diastolic blood pressure of 15 mmHg within 3 minutes of standing. Sleep disorders were evaluated by interview, including rapid eye movement sleep behavior disorder (RBD), and sleep-related breathing disorders (nocturnal stridor and obstructive sleep apnea).
MSA outcomes assessment
Motor dysfunction duration was uniformly defined as the time interval from the onset of motor symptoms to enrollment. Unified Multiple System Atrophy Rating Scale-II (UMSARS-II), Scale for the Assessment and Rating of Ataxia (SARA), and International Cooperative Ataxia Rating Scale (ICARS) were used to measure motor function. The Mini-Mental State Examination (MMSE) and Montreal Cognitive Assessment (MoCA) were performed to assess cognitive function. Hamilton Anxiety Rating Scale (HAMA) and Hamilton Depression Rating Scale (HAMD) were performed to assess anxiety and depression respectively. Composite Autonomic Symptom Score (COMPASS) 31 questionnaire was used to assess the severity of autonomic dysfunction. The evaluation of the scales for multi-dimensional dysfunction in patients with MSA was completed by one physician specializing in movement disorders independently.
Neuroimaging assessment
The maximum interval between clinical assessments and imaging scans was 7 days. Neuroimaging examinations were performed on a 3.0 T MRI scanner (GE, USA) with a standard 8-channel HRBRAIN coil. MRI protocol was the same for patients with MSA and healthy controls, including the full sequence of cranial MRI such as axial T2-weighted sequences, fluid-attenuated inversion recovery (FLAIR), T1-weighted sequences, diffusion-weighted imaging (DWI), and axial susceptibility-weighted imaging (SWI). The specific parameter information for MRI acquisition was shown in Supplementary Methods. Individual imaging features of CSVD were observed strictly by neuroimaging standards [17]. The Fazekas scale was used for periventricular and deep WMH evaluation. Lacunes were defined as lesions with a diameter of 3–15 mm and a signal similar to cerebrospinal fluid but with a surrounding rim of hyperintensity on FLAIR images. Microbleeds were defined as rounded or ovoid hypointensity foci with a diameter of 2–5 mm on SWI images (less than 10 mm maximally in diameter). EPVS was differentiated from lacunes in size because EPVS was smaller than 3 mm and had no surrounding rim on FLAIR images, in addition, the EPVS was rated in the basal ganglia (BG-EPVS), centrum semiovale (CS-EPVS), hippocampus (H-EPVS), and midbrain (M-EPVS) manually based on the different semi-quantitative scales. BG-EPVS and CS-EPVS were defined by 1 grade (the number is 0–10), 2 grade (the number is 11–25), and 3 grade (the number >25) [23]. H-EPVS were rated based on the slices where the midbrain and para hippocampal gyrus were visible [24]. The sum of the left and right hippocampus EPVS ≥7 was defined as 1 score, representing the extensive burden, and 0 scores presented a non-extensive burden [25]. M-EPVS was rated according to the presence or not, 1 score represented presence, and 0 represented absence.
The total CSVD score was calculated as follows, with 1 point being awarded for each of these features: periventricular Fazekas score = 3, or deep Fazekas score ≥2, for WMH; 1 or more lacunes; 1 or more microbleeds; and grade 2-3 for BG-EPVS [19]. Therefore, the total CSVD score was stratified from 0 to 4. The patients were further classified into three groups for comparison. Group 1, none-to-mild CSVD (burden score 0–1), Group 2, moderate CSVD (burden score = 2), and Group 3, severe CSVD (burden score 3–4). All CSVD evaluations were determined by at least two neuroimaging specialists.
Statistical analysis
Statistical analyses were performed using R version 4.1.2. For demographic and clinical features, continuous variables with normal distribution were presented as mean±standard deviation, and those with abnormal distribution were presented as median (interquartile range). Student t-test or ANOVA for normally distributed continuous parameters and Wilcoxon or Kruskal–Wallis test for abnormal distribution continuous parametric variables were used when appropriate. Categorical variables were expressed as frequency (percentage) and the χ2 test or Fisher exact test was used.
Potential confounders affecting the motor or non-motor outcomes of MSA were evaluated under the univariate linear regression model, and variables significantly correlated with the outcome (p < 0.05) were further added as covariates in corresponding multivariable linear regression models to examine the associations of overall and separate CSVD burden with MSA multi-dimensional dysfunction. Spearman’s correlation was applied to assess the relevance of CSVD burden with MSA outcomes and motor dysfunction duration. Subgroup analysis stratified by age was further performed. The heatmap and forest plots were used to visualize the distribution of correlation effects via the ‘heatmap’ and ‘forest plot’ R packages, respectively. A two-tailed p < 0.05 was considered to be statistically significant. To account for multiple testing, a more conservative significance level based on Bonferroni correction was applied when necessary.
RESULTS
Baseline population characteristics
In the present study, 190 MSA patients (155 MSA-C and 35 MSA-P) and 190 age- and gender-matched healthy controls were included (Supplementary Figure 1). Demographic characteristics of patients with MSA and controls are illustrated in Table 1. Compared with the healthy controls, there was a heavier CSVD burden in patients with MSA (p = 0.009). Among MSA patients, 66 cases (49.25%) had none-to-mild CSVD load, 43 cases (32.09%) had moderate CSVD load, and 25 cases (18.66%) had severe CSVD load (Fig. 1A). Regarding healthy controls, the numbers were 90 (67.16%), 31 (23.13%), and 13 (9.70%), respectively. For separate imaging features of CSVD, the distributions of lacunars, microbleeds, and BG-EPVS did not differ significantly between groups (p > 0.05). WMH Fazekas scores in MSA patients were generally higher than those in healthy controls, no matter in periventricular (p = 0.002) or in deep white matter (p = 0.047). In addition, patients with MSA more frequently had extensive H-EPVS (39.47% vs. 25.79%, p = 0.005) and M-EPVS (41.05% vs. 27.37%, p = 0.005) burden compared to healthy controls.
Fig. 1
Proportions of CSVD burden and comparisons of UMSARS-II scores in different groups. A) Distributions of CSVD burden between patients with MSA and healthy individuals. The histogram shows the proportions of overall CSVD (none-to-mild, moderate and severe) and separate CSVD (WMH, microbleeds, lacunes and EPVS) burden in different diagnostic groups. *indicates that the CSVD load of MSA group differs from that of healthy controls. B) Comparisons of UMSARS-II scores across different CSVD burden groups. X-axis means is as follows: For overall CSVD burden, 1 represents none-to-mild CSVD (burden score 0–1), 2 represents moderate CSVD (burden score = 2), and 3 represents severe CSVD (burden score 3–4). For WMH, 0 represents absence, and 1 represents presence. For microbleeds, 0 represents absence, and 1 represents presence. For lacunes, 0 represents absence, and 1 represents presence. For BG-EPVS and CS-EPVS, 1 represents 1 grade (the number is 0–10), 2 represents 2 grade (the number is 11–25), and 3 represents 3 grade (the number >25). For H-EPVS, 0 represents non-extensive burden (the number <7), and 1 represents extensive burden (EPVS ≥7). For M-EPVS, 0 represents absence, and 1 represents presence. BG-EPVS, enlarged perivascular spaces in the basal ganglia; CS-EPVS, enlarged perivascular spaces in the centrum semiovale; CSVD, cerebral small vessel disease; H-EPVS, enlarged perivascular spaces in the hippocampus; M-EPVS, enlarged perivascular spaces in the midbrain; MSA, multiple system atrophy; UMSARS-II, Unified Multiple System Atrophy Rating Scale-II; WMH, white matter hyperintensity.
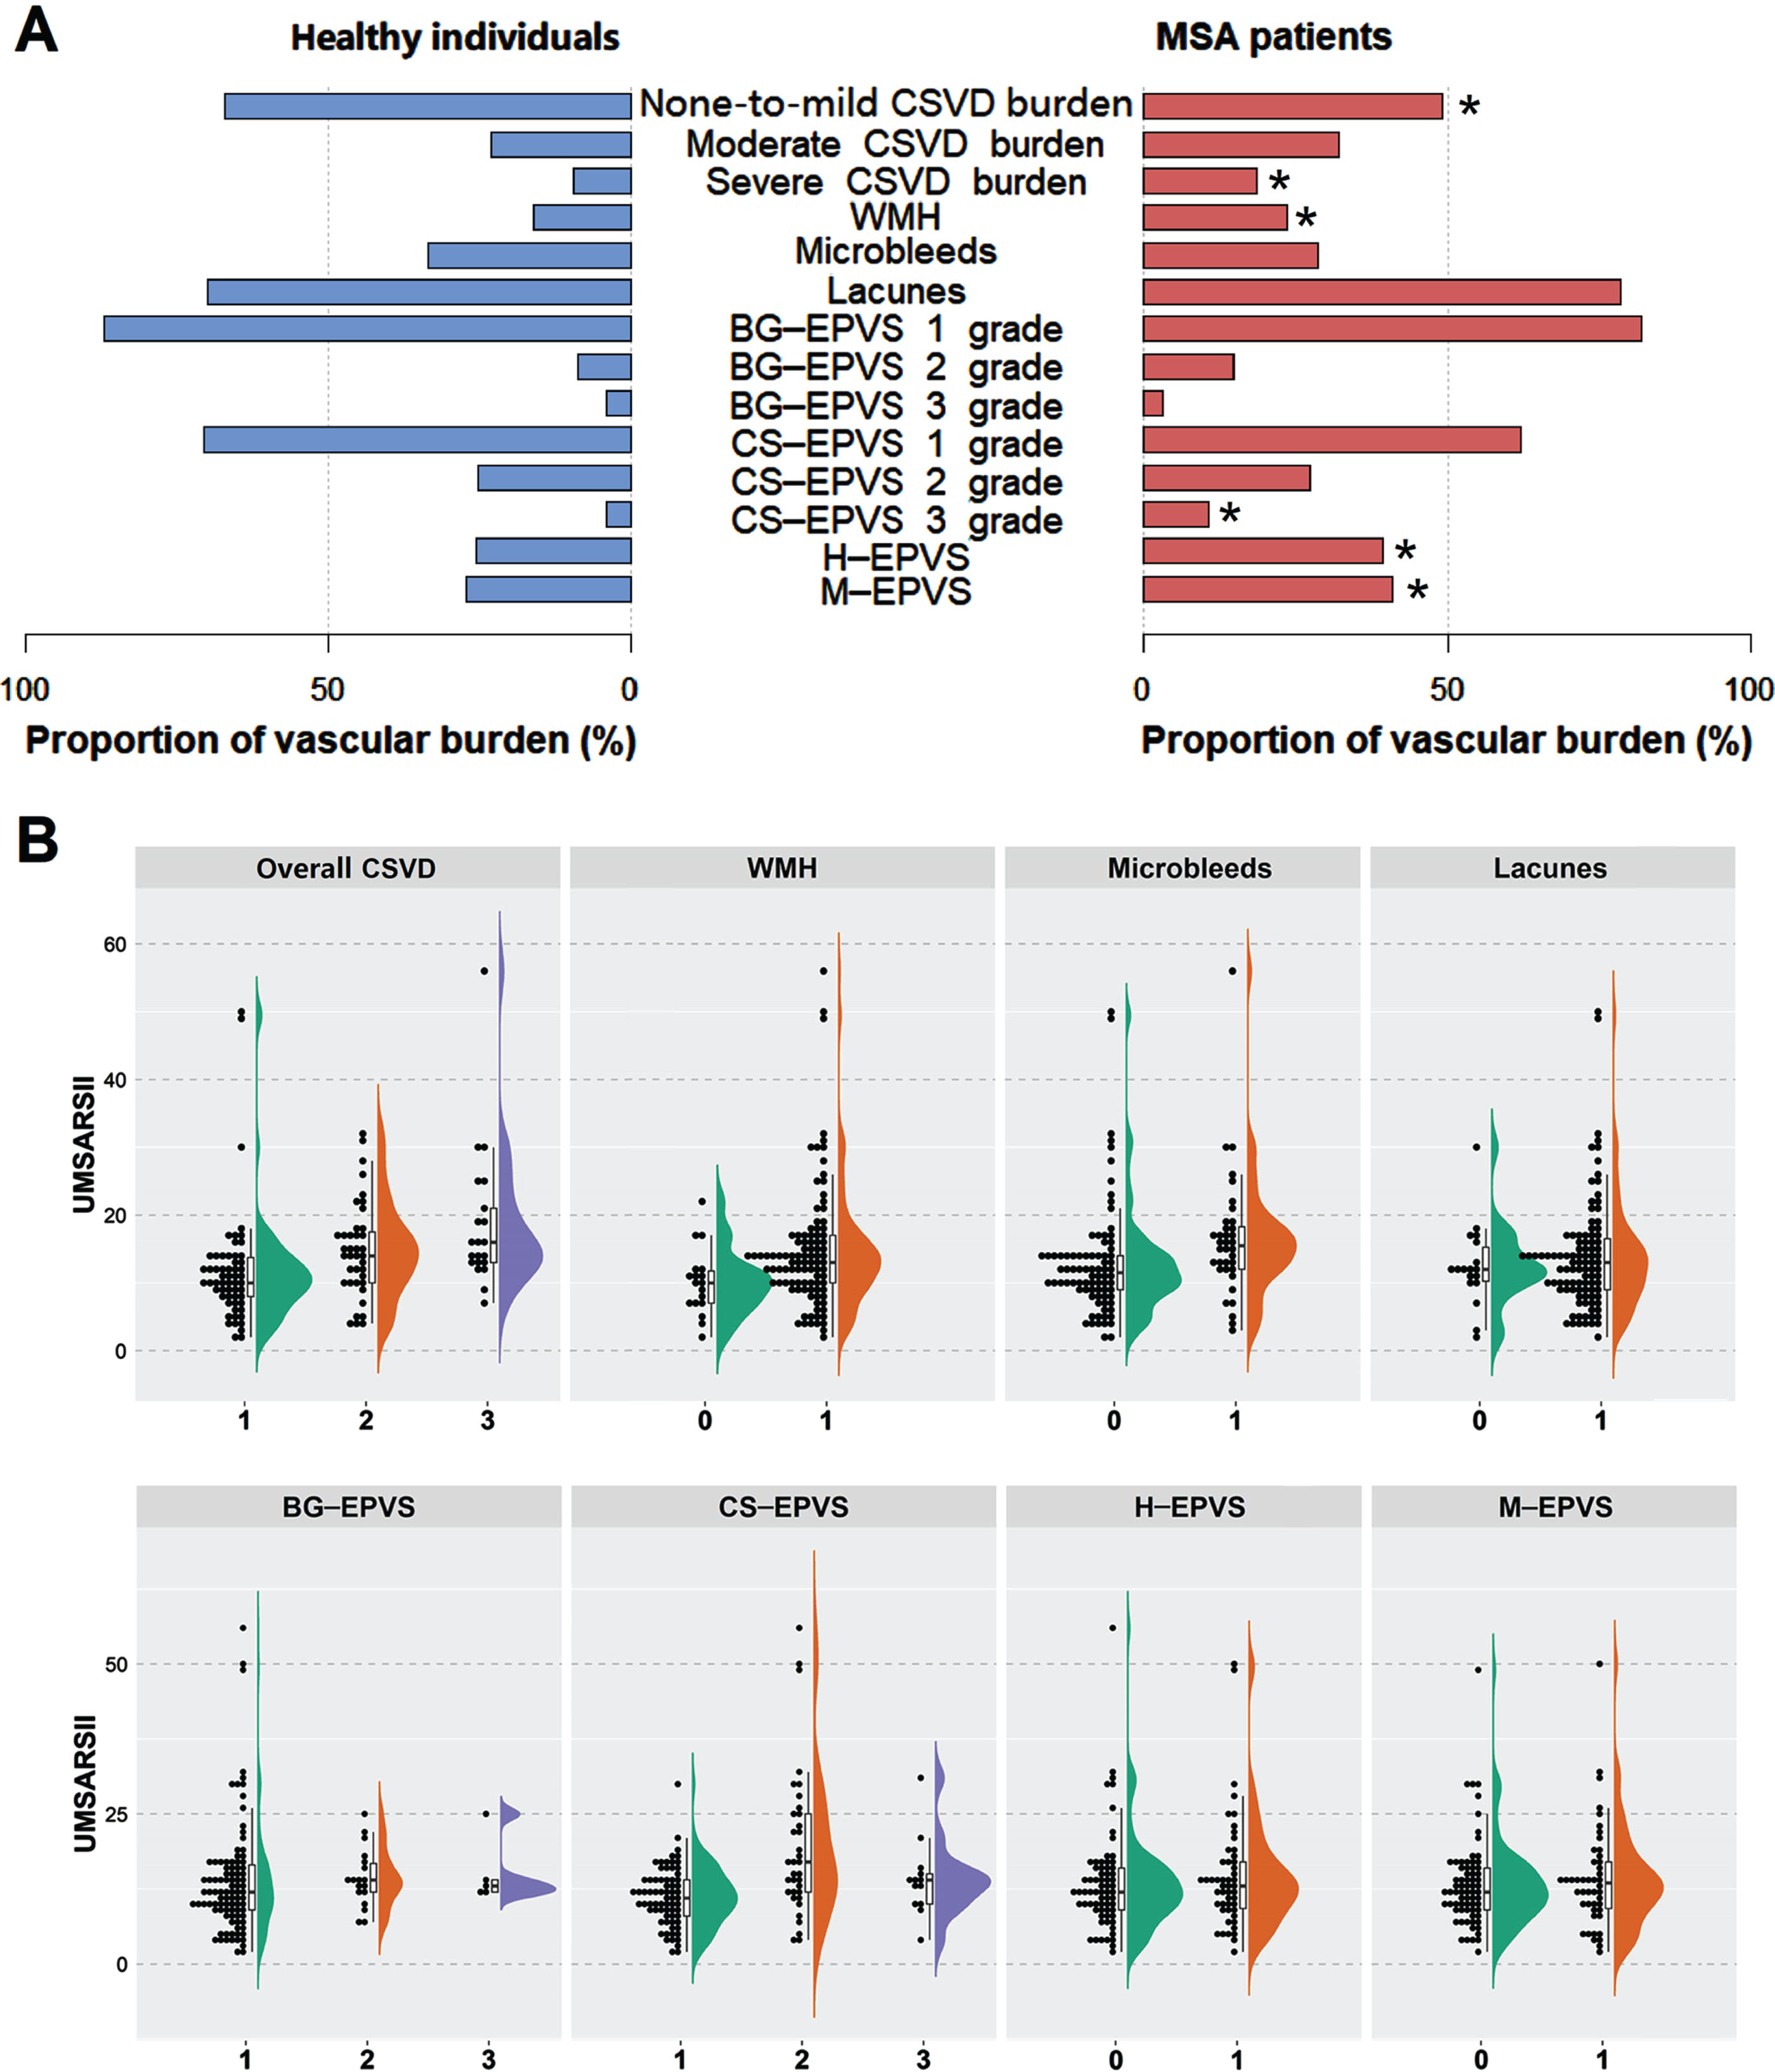
Table 1
Demographic characteristics and CSVD neuroimaging features of MSA patients and healthy controls
| Characteristics | MSA patients | Healthy Controls | p | ||
| MSA-C (n = 155) | MSA-P (n = 35) | Total (n = 190) | n = 190 | ||
| Demographic characteristics | |||||
| Age (y) | 57.75±7.52 | 62.00±7.44 | 58.54±7.66 | 59.59±9.78 | 0.243 |
| Male (n, %) | 92 (59.35%) | 22 (62.86%) | 114 (60.00%) | 114 (60.00%) | 1.000 |
| Vascular risk factors | |||||
| Smoking (n, %) | 24 (15.58%) | 3 (8.57%) | 27 (14.29%) | 41 (21.58%) | 0.064 |
| Drinking (n, %) | 23 (14.94%) | 5 (14.29%) | 28 (14.81%) | 19 (10.00%) | 0.155 |
| Hypertension (n, %) | 33 (21.29%) | 5 (14.29%) | 38 (20.00%) | 40 (21.05%) | 0.799 |
| Diabetes (n, %) | 21 (13.55%) | 5 (14.29%) | 26 (13.68%) | 35 (18.42%) | 0.209 |
| Blood tests | |||||
| Total cholesterol (mmol/L) | 4.39 (3.66, 4.88) | 4.41 (3.96, 5.13) | 4.39 (3.71, 4.93) | 4.35 (3.70, 5.20) | 0.905 |
| HDL (mmol/L) | 1.17 (0.99, 1.45) | 1.17 (0.94, 1.42) | 1.17 (0.99, 1.43) | 1.11 (0.96, 1.32) | 0.050 |
| LDL (mmol/L) | 2.73±0.79 | 2.80±0.78 | 2.74±0.78 | 2.86±0.87 | 0.170 |
| Triglyceride (mmol/L) | 1.26 (0.91, 1.62) | 1.34 (0.84, 1.85) | 1.27 (0.89, 1.66) | 1.31 (0.96, 1.89) | 0.071 |
| Homocysteine (μmol/L) | 10.30 (8.40, 12.70) | 10.94 (9.00, 12.30) | 10.40 (8.40, 12.70) | 11.30 (9.80, 14.40) | <0.001 |
| MRI findings | |||||
| Lacunes (n, %) | 122 (78.71%) | 27 (77.14%) | 149 (78.42%) | 133 (70.00%) | 0.061 |
| BG-EPVS (n, %) | 0.199 | ||||
| 1 grade (count ≤10) | 128 (82.58%) | 28 (80.00%) | 156 (82.11%) | 165 (86.84%) | |
| 2 grade(count = 11–25) | 23 (14.84%) | 5 (14.29%) | 28 (14.74%) | 17 (8.94%) | |
| 3 grade (count ≥25) | 4 (2.58%) | 2 (5.71%) | 6 (3.16%) | 8 (4.21%) | |
| CS-EPVS (n, %) | 0.042 | ||||
| 1 grade (count ≤10) | 101 (65.16%) | 17 (48.57%) | 118 (62.11%) | 134 (70.53%) | |
| 2 grade (count = 11–25) | 42 (27.10%) | 10 (28.57%) | 52 (27.37%) | 48 (25.26%) | |
| 3 grade (count ≥25) | 12 (7.74%) | 8 (22.86%) | 20 (10.53%) | 8 (4.21%) | |
| H-EPVS (n, %) | 0.005 | ||||
| 0 score (non-extensive burden) | 96 (61.94%) | 19 (54.29%) | 115 (60.53%) | 141 (74.21%) | |
| 1 score (extensive burden) | 59 (38.06%) | 16 (45.71%) | 75 (39.47%) | 49 (25.79%) | |
| M-EPVS (n, %) | 0.005 | ||||
| 0 score (absence) | 95 (61.29%) | 17 (48.57%) | 112 (58.95%) | 138 (72.63%) | |
| 1 score (presence) | 60 (38.71%) | 18 (51.43%) | 78 (41.05%) | 52 (27.37%) | |
| WMH score (n, %) | |||||
| Periventricular-WMH | 0.002 | ||||
| 0 score | 40 (25.81%) | 9 (25.71%) | 49 (25.79%) | 78 (41.05%) | |
| 1 score | 78 (50.32%) | 14 (40.00%) | 92 (48.42%) | 60 (31.58%) | |
| 2 score | 30 (19.35%) | 9 (25.71%) | 39 (20.53%) | 35 (18.42%) | |
| 3 score | 7 (4.52%) | 3 (8.57%) | 10 (5.26%) | 17 (8.95%) | |
| Deep-WMH | 0.047 | ||||
| 0 score | 75 (48.39%) | 12 (34.29%) | 87 (45.79%) | 114 (60.00%) | |
| 1 score | 48 (30.97%) | 14 (40.00%) | 62 (32.63%) | 47 (24.74%) | |
| 2 score | 22 (14.19%) | 4 (11.43%) | 26 (13.68%) | 20 (10.53%) | |
| 3 score | 10 (6.45%) | 5 (14.29%) | 15 (7.89%) | 9 (4.74%) | |
| Patients with SWI | n = 111 | n = 23 | n = 134 | n = 134 | |
| Microbleeds (n, %) | 26 (23.42%) | 12 (52.17%) | 38 (28.36%) | 45 (33.58%) | 0.355 |
| Severity of CSVD burden (n, %) | n = 111 | n = 23 | n = 134 | n = 134 | 0.009 |
| None-to-mild (CSVD score 0–1) | 58 (52.25%) | 8 (34.78%) | 66 (49.25%) | 90 (67.16%) | |
| Moderate (CSVD score 2) | 34 (30.63%) | 9 (39.13%) | 43 (32.09%) | 31 (23.13%) | |
| Severe (CSVD score 3–4) | 19 (17.12%) | 6 (26.09%) | 25 (18.66%) | 13 (9.70%) | |
The p-value was a comparison of total MSA patients and the healthy control population. For continuous variables, Student t-test for normally distributed parameters (Age and LDL) and Wilcoxon test for non-normally distributed parametric variables (the remaining continuous variables other than Age and LDL) were used. For categorical variables, χ2 test or Fisher exact test was used. BG-EPVS, enlarged perivascular spaces in the basal ganglia; CS-EPVS, enlarged perivascular spaces in the centrum semiovale; CSVD, cerebral small vessel disease; HDL, high-density lipoprotein; H-EPVS, enlarged perivascular spaces in the hippocampus; LDL, low-density lipoprotein; M-EPVS, enlarged perivascular spaces in the midbrain; MRI, magnetic resonance imaging; MSA, multiple system atrophy; WMH, white matter hyperintensity.
There was no statistical difference in the distribution of overall CSVD burden and separate imaging features between MSA-P and MSA-C, except for CS-EPVS and microbleeds. Compared with MSA-C, MSA-P patients disposed to have a heavier CS-EPVS load and more frequency of microbleeds (Supplementary Table 2).
Group comparisons of demographic profiles and MSA outcomes stratified by CSVD severity
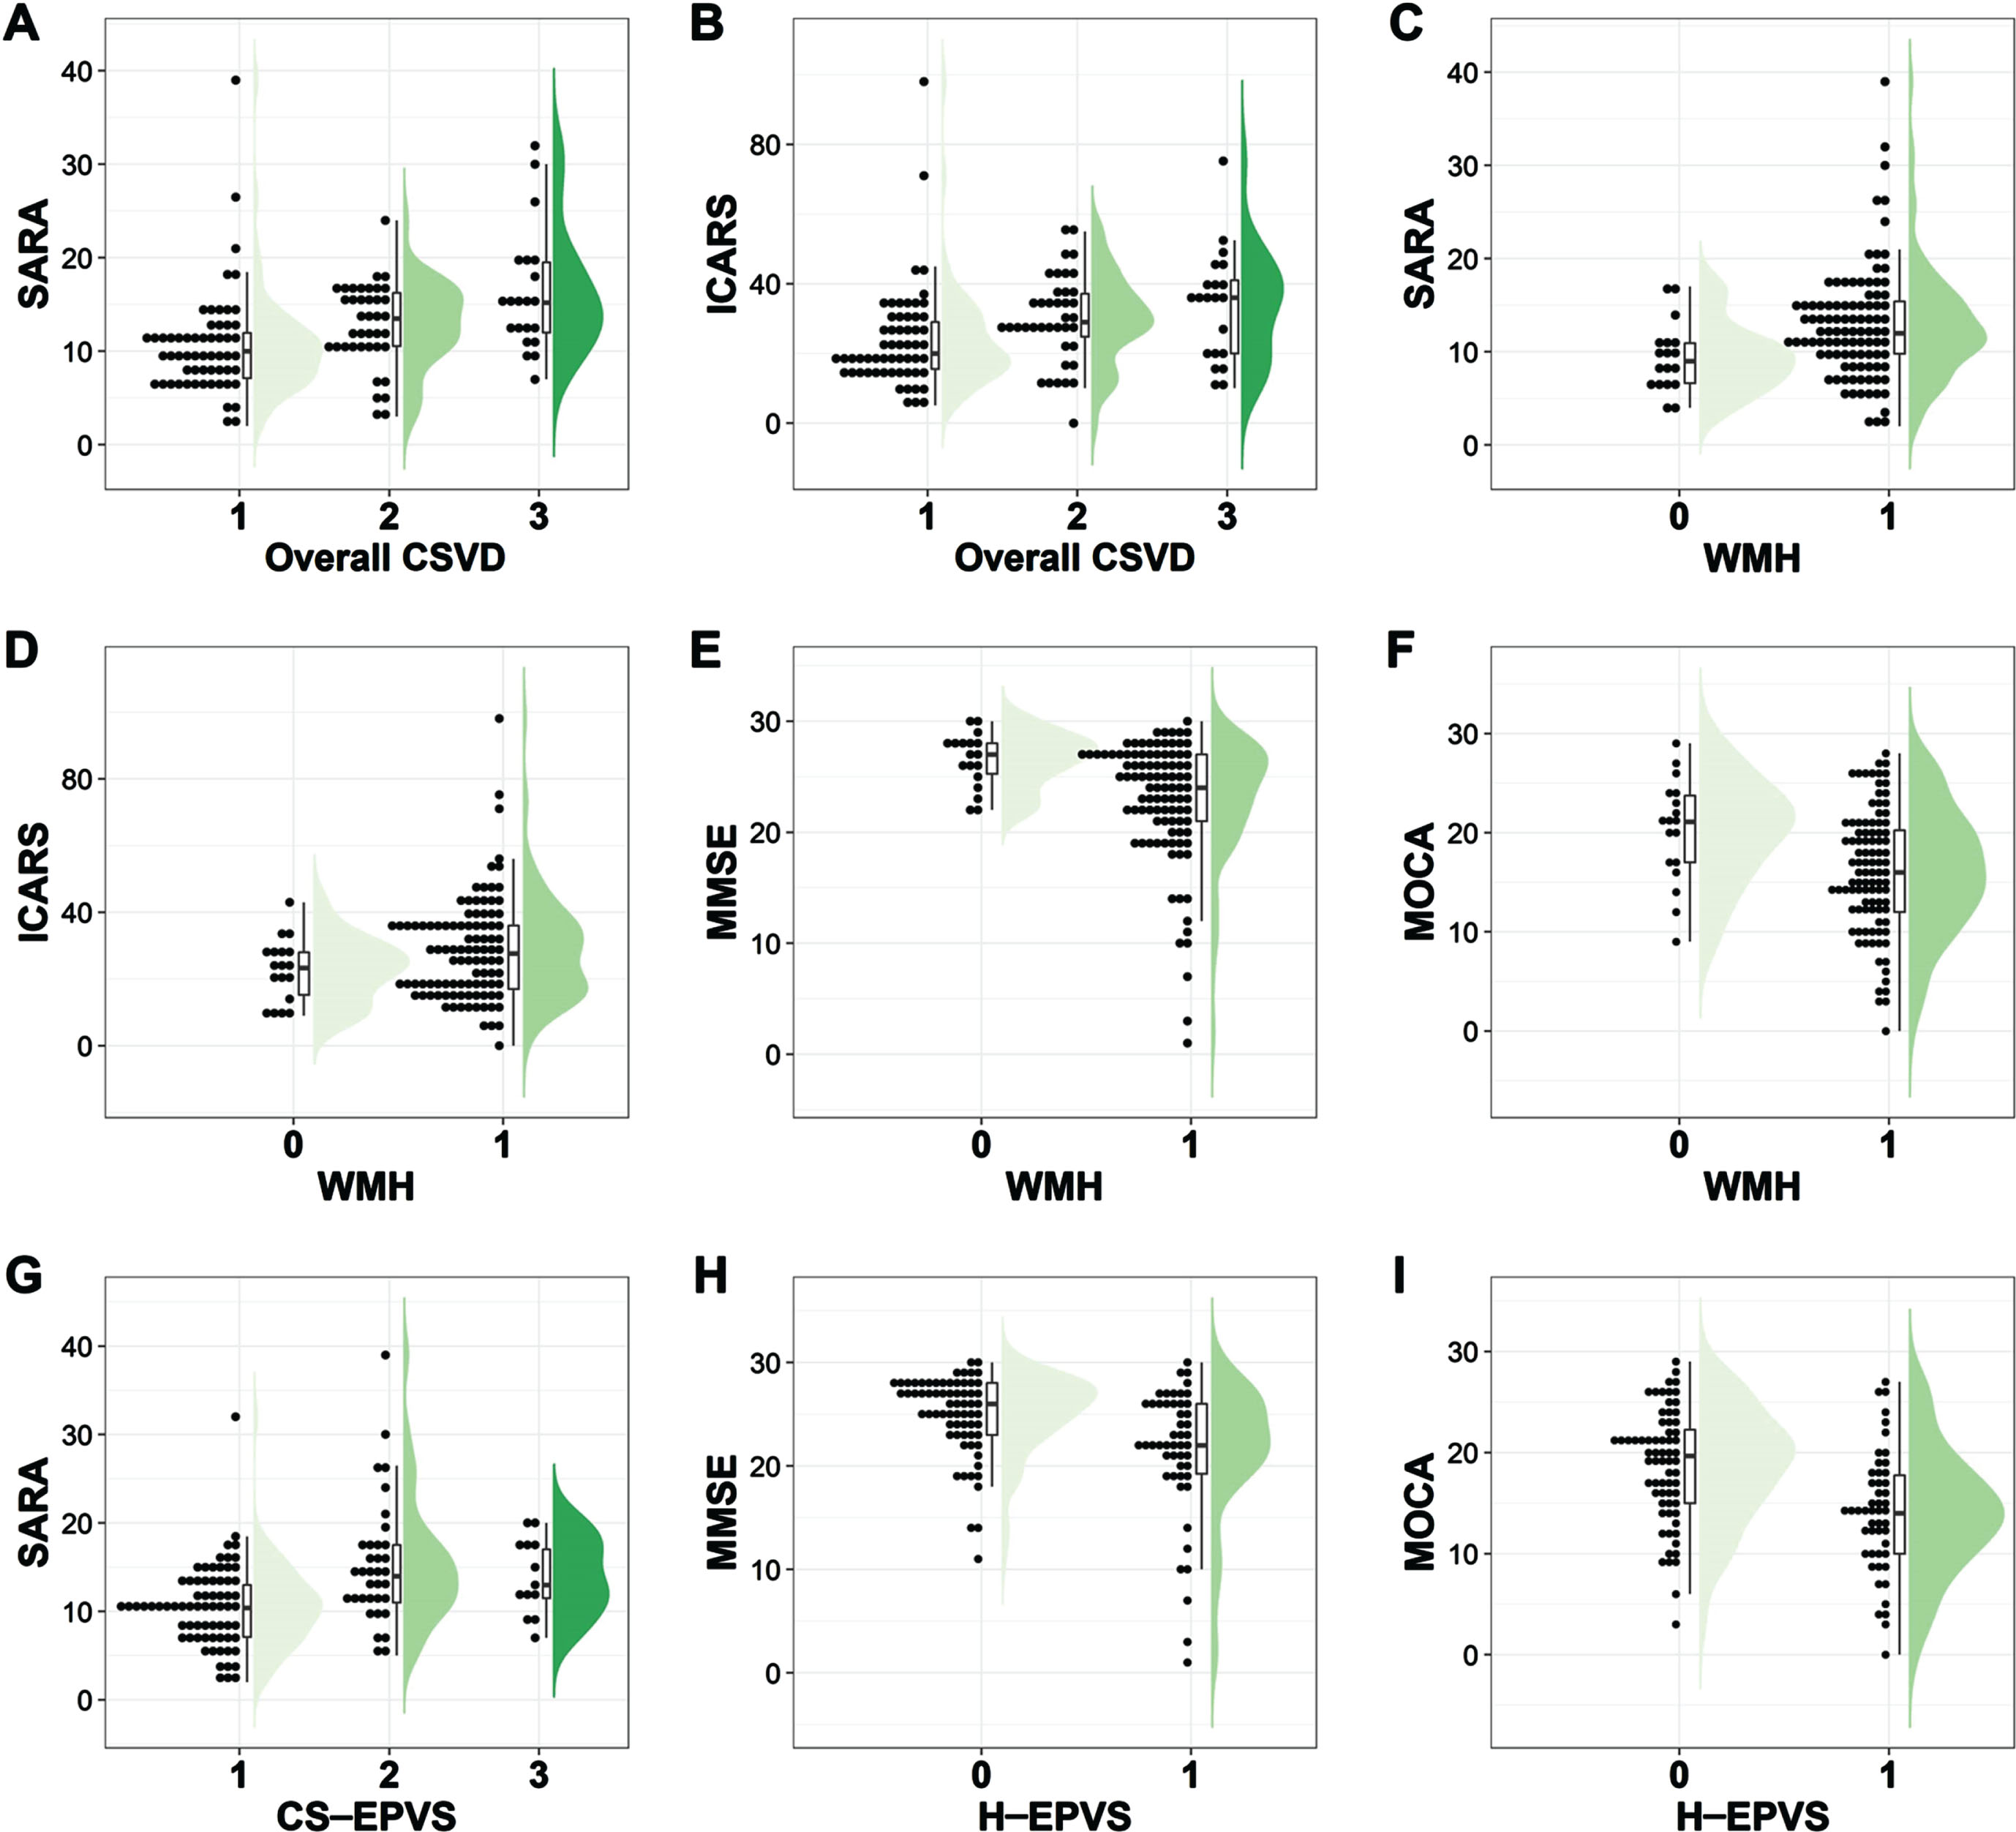
Table 2 compares the demographic and outcome features stratified by CSVD severity. Of the 118 MSA patients, 58 had a none-to-mild overall CSVD burden, 39 had a moderate overall CSVD burden, and 21 had a severe overall CSVD burden. The median of motor dysfunction duration (months) was 17, 24, and 24 correspondingly. The education level in our study was relatively low, the median was 9 for 3 groups. With the increase in severity of CSVD burden, the UMSARS-II (p < 0.001), SARA (p < 0.001), and ICARS (p = 0.002) scores ascended gradually (Table 2, Figs. 1B, and Fig. 2). The same trend was also found for MSA-C (Supplementary Table 3) and MSA-P (Supplementary Table 4). Regarding cognitive function, the MMSE score and MoCA score descended gradually for all MSA patients (Table 2) and MSA-C patients (Supplementary Table 3), but only the p-value for the MoCA score reached statistical significance in all MSA patients (p = 0.033, Table 2).
Table 2
Group comparisons of demographic profiles and MSA outcomes stratified by the severity of CSVD burden
| None-to-mild | Moderate | Severe | p | |
| (CSVD score 0–1) | (CSVD score 2) | (CSVD score 3–4) | ||
| Characteristics | n = 58 | n = 39 | n = 21 | |
| Demographic characteristics | ||||
| Age (y) | 54.41±6.58 | 60.13±6.62 | 65.33±5.92 | <0.001 |
| Motor dysfunction duration (months) | 17 (12, 24) | 24 (12, 30) | 24 (12, 30) | 0.294 |
| Male (n, %) | 33 (56.90%) | 26 (66.67%) | 18 (85.71%) | 0.058 |
| Education (y) | 9.00 (6.75, 12.00) | 9.00 (5.00, 9.00) | 9.00 (0.72, 12.00) | 0.143 |
| Smoking (n, %) | 11 (18.97%) | 5 (12.82%) | 7 (33.33%) | 0.191 |
| Drinking (n, %) | 9 (15.52%) | 7 (17.95%) | 8 (38.10%) | 0.095 |
| Supine hypertension (n, %) | 6 (10.34%) | 9 (23.08%) | 9 (42.86%) | 0.007 |
| Diabetes (n, %) | 5 (8.62%) | 10 (25.64%) | 5 (23.81%) | 0.059 |
| Orthostatic hypotension (n, %) | 28 (48.28%) | 29 (74.36%) | 12 (57.14%) | 0.038 |
| RBD (n, %) | 46 (79.31%) | 32 (82.05%) | 19 (90.48%) | 0.622 |
| Sleep-related breathing disorders (n, %) | 28 (48.28%) | 23 (58.97%) | 17 (80.95%) | 0.036 |
| Blood tests | ||||
| Total cholesterol (mmol/L) | 4.52±0.93 | 4.46±0.95 | 3.98±0.83 | 0.064 |
| HDL (mmol/L) | 1.28±0.40 | 1.21±0.28 | 1.08±0.26 | 0.075 |
| LDL (mmol/L) | 2.81±0.80 | 2.77±0.84 | 2.40±0.67 | 0.127 |
| Triglyceride (mmol/L) | 1.03 (0.88, 1.63) | 1.37 (0.86, 1.76) | 1.29 (0.90, 1.82) | 0.457 |
| Homocysteine (μmol/L) | 9.80 (8.10, 12.33) | 10.90 (8.60, 12.60) | 12.00 (9.35, 14.65) | 0.045 |
| MSA outcomes | ||||
| UMSARS-II | 10.00 (7.75, 13.73) | 14.00 (10.00, 18.00) | 16 (13.00, 23.00) | <0.001 |
| SARA | 10.00 (7.00, 12.15) | 13.50 (10.31, 16.50) | 15.21 (11.75, 19.75) | <0.001 |
| ICARS | 20.00 (15.38, 29.24) | 29.00 (23.59, 38.00) | 36.00 (19.50, 43.00) | 0.002 |
| COMPASS31 | 28.09 (12.77, 41.08) | 34.31 (18.12, 47.25) | 23.76 (15.40, 50.38) | 0.158 |
| MMSE | 26.00 (22.00, 27.00) | 25.00 (22.00, 27.00) | 22.00 (19.00, 27.00) | 0.133 |
| MoCA | 18.17±6.08 | 15.71±5.63 | 14.56±6.87 | 0.033 |
| HAMA | 6.00 (3.00, 13.00) | 10.00 (6.00, 19.00) | 8.00 (3.50, 13.00) | 0.019 |
| HAMD | 4.33 (2.00, 8.00) | 7.00 (4.00, 13.00) | 4.00 (2.00, 9.50) | 0.032 |
A total of 118 MSA patients with complete data on overall CSVD burden and outcome assessments were compared here. For continuous variables, ANOVA for normally distributed parameters (Age, Total cholesterol, HDL, LDL, and MoCA) and Kruskal–Wallis test for non-normally distributed parametric variables (Motor dysfunction duration, Triglyceride, Homocysteine, UMSARS-II, SARA, ICARS, COMPASS31, MMSE, HAMA, and HAMD) were used. For categorical variables, χ2 test or Fisher exact test was used. COMPASS31, Composite Autonomic Symptom Score 31; CSVD, cerebral small vessel disease; HAMA, Hamilton Anxiety Rating Scale; HAMD, Hamilton Depression Rating Scale; HDL, high-density lipoprotein; ICARS, International Cooperative Ataxia Rating Scale; LDL, low-density lipoprotein; MMSE, Mini Mental State Examination; MoCA, Montreal Cognitive Assessment; MSA, multiple system atrophy; RBD, rapid eye movement sleep behavior disorder; SARA, Scale for the Assessment and Rating of Ataxia; UMSARS-II, Unified Multiple System Atrophy Rating Scale-II.
As for CSVD neuroimaging makers, with the presence of WMH, microbleeds, and lacunes, the UMSARS-II score displayed an increased tendency (Fig. 1B), and statistical significance was found for WMH (p = 0.014) and microbleeds (p = 0.002), but not for lacunes (p = 0.433). Besides, only the CS-EPVS burden was significantly correlated with the UMSARS-II score (p < 0.001), rather than the BG-EPVS, H-EPVS nor M-EPVS burden (p = 0.356, p = 0.458, and p = 0.487 respectively). Regarding cognitive function, patients with greater H-EPVS burden performed worse in MMSE and MoCA scores (Fig. 2). Moreover, patients with greater WMH burden showed higher SARA (p = 0.007) scores as well as lower MMSE (p = 0.002) and MoCA (p = 0.008) scores.
Fig. 2
Comparisons of motor and cognitive scores across different CSVD burden groups. X-axis means is as follows: For overall CSVD burden, 1 represents none-to-mild CSVD (burden score 0–1), 2 represents moderate CSVD (burden score = 2), and 3 represents severe CSVD (burden score 3–4). For WMH, 0 represents absence, and 1 represents presence. For CS-EPVS, 1 represents 1 grade (the number is 0–10), 2 represents 2 grade (the number is 11–25), and 3 represents 3 grade (the number >25). For H-EPVS, 0 represents non-extensive burden (the number <7), and 1 represents extensive burden (EPVS ≥7). CS-EPVS, enlarged perivascular spaces in the centrum semiovale; CSVD, cerebral small vessel disease; H-EPVS, enlarged perivascular spaces in the hippocampus; ICARS, International Cooperative Ataxia Rating Scale; MMSE, Mini Mental State Examination; MoCA, Montreal Cognitive Assessment; SARA, Scale for the Assessment and Rating of Ataxia; WMH, white matter hyperintensity.
Associations between the overall CSVD burden and multi-dimensional outcomes in MSA
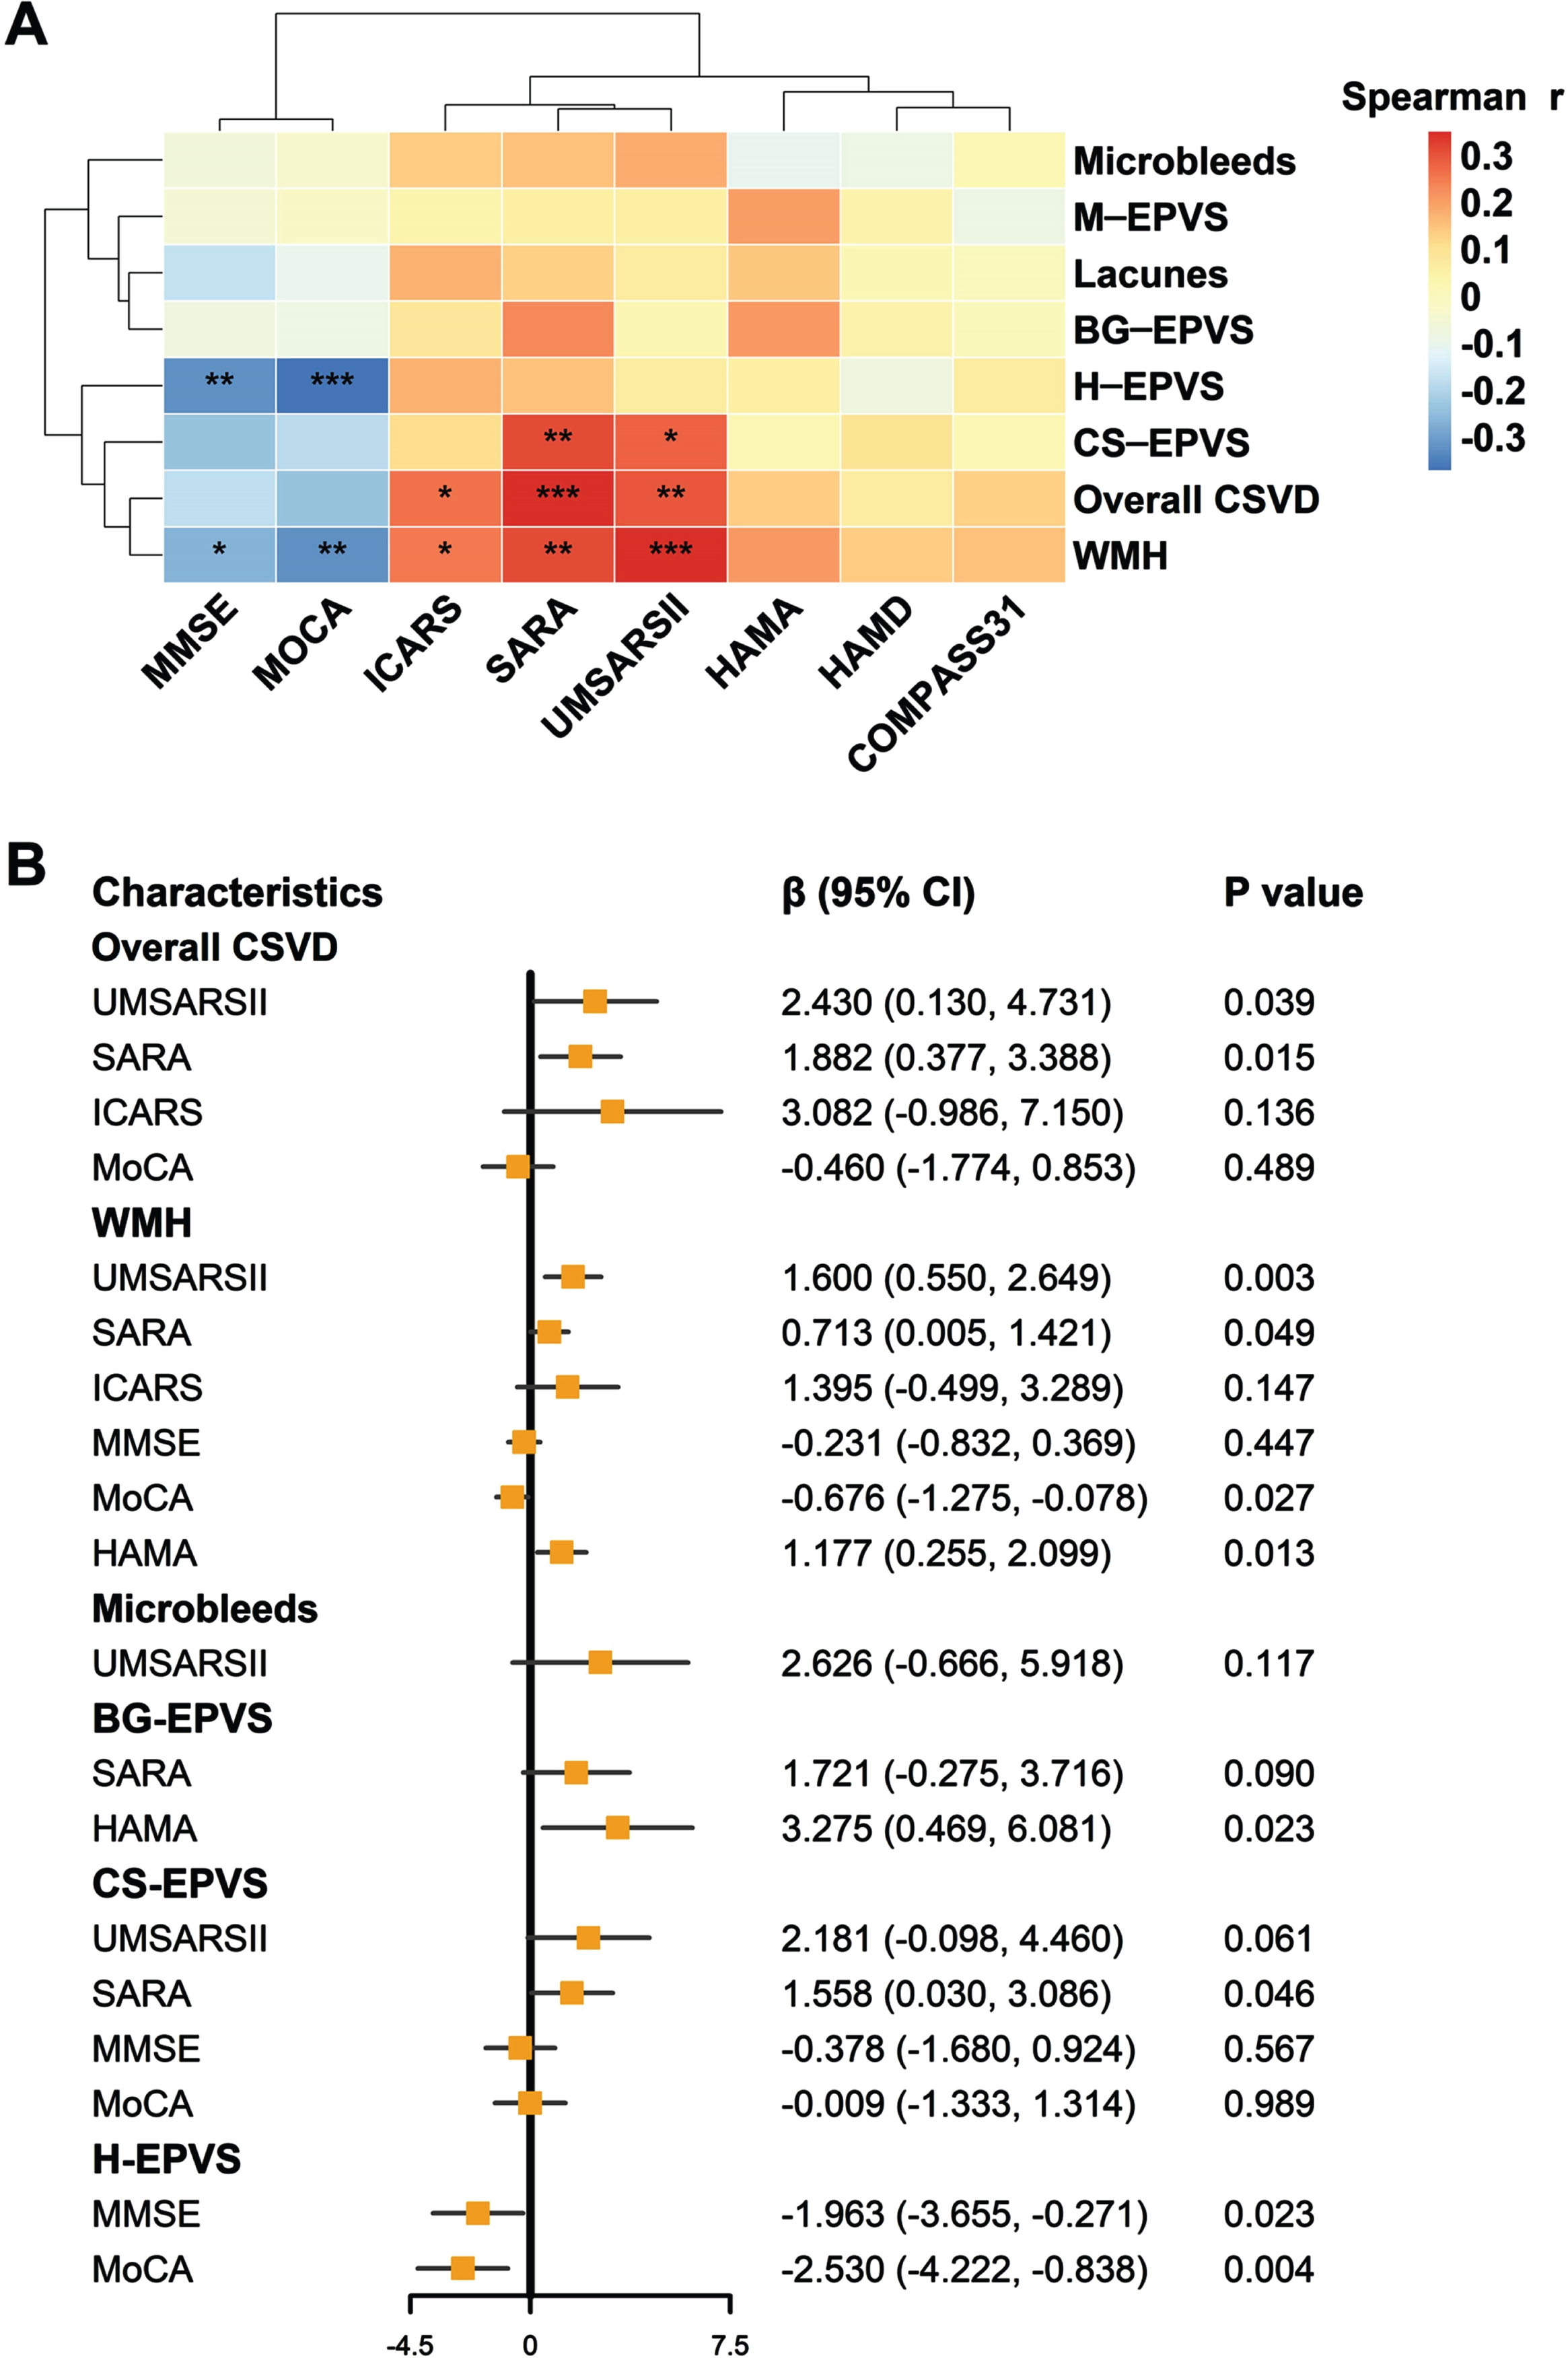
Spearman’s correlation analysis showed significant correlations between the severity of CSVD burden and UMSARS-II, SARA, and ICARS scores, with Bonferroni-adjusted p-value being 0.009, <0.001, and 0.038, respectively (Fig. 3A). With the increase of CSVD burden, the motor dysfunction (reflected by UMSARS-II and SARA) gradually worsened no matter in univariate regression models (B = 3.432, p = 0.001; B = 2.682, p < 0.001, respectively) or multivariate linear regression models after adjusting for confounding factors (β= 2.430, p = 0.039; β= 1.882, p = 0.015, respectively) (Supplementary Table 5). Accordingly, higher motor dysfunction score was correlated with higher CSVD burden. Despite a higher CSVD burden tended to be associated with lower cognitive scores (MMSE: p = 0.056; MoCA: p = 0.010), the association was not statistically significant in the multivariate regression model. In addition, no significant associations were found between overall CSVD burden and psychological assessment scores (HAMA and HAMD) (Supplementary Table 5). We explored the correlations between CSVD burden with outcomes features based on MSA subtypes, the same relationships were still demonstrated in MSA-C (Supplementary Table 6) and MSA-P patients (Supplementary Table 7).
Fig. 3
Associations of CSVD burden with multi-dimensional motor and non-motor scales in MSA. A) Results of Spearman’s correlation were displayed in the heatmap, with colors representing correlation coefficients. Significance: ***p < 0.001, **p < 0.01, *p < 0.05 (Bonferroni-adjusted p values). B) Results of multivariable linear regressions were shown in the forest plot. BG-EPVS, enlarged perivascular spaces in the basal ganglia; CI, confidence interval; COMPASS31, Composite Autonomic Symptom Score 31; CS-EPVS, enlarged perivascular spaces in the centrum semiovale; CSVD, cerebral small vessel disease; HAMA, Hamilton Anxiety Rating Scale; HAMD, Hamilton Depression Rating Scale; H-EPVS, enlarged perivascular spaces in the hippocampus; ICARS, International Cooperative Ataxia Rating Scale; M-EPVS, enlarged perivascular spaces in the midbrain; MMSE, Mini Mental State Examination; MoCA, Montreal Cognitive Assessment; SARA, Scale for the Assessment and Rating of Ataxia; UMSARS-II, Unified Multiple System Atrophy Rating Scale-II; WMH, white matter hyperintensity.
Associations between CSVD neuroimaging makers and multi-dimensional outcomes in MSA
We further explored the associations of CSVD neuroimaging features with the severity of motor or non-motor outcomes in patients with MSA. EPVS burden in different regions was related to different multi-dimensional outcomes (Fig. 3B and Supplementary Tables 8–11). Specifically, in the centrum semiovale, a higher EPVS burden was significantly associated with a higher SARA score (β= 1.558, p = 0.046). In the hippocampus, a higher EPVS burden tended to be associated with lower MMSE (p = 0.023) and MoCA (p = 0.004) scores. In the basal ganglia, a negative correlation was found between EPVS and HAMA score (p = 0.023).
The WMH scores were associated with motor impairment, cognition dysfunction, and mood disorders in multivariate linear regression models. Specifically, a higher WMH burden was positively correlated with UMSARS-II, SARA, and HAMA scores (p = 0.003, p = 0.049, and p = 0.013 respectively), but negatively correlated with MoCA score (β= –0.676, p = 0.027) (Fig. 3B and Supplementary Table 12). As for the lacunes and microbleeds, their correlations with MSA outcomes were weak, and no statistical difference was found (Fig. 3B and Supplementary Tables 13 and 14).
Subgroup and complementary analysis
Next, we explored the relationship between CSVD burden and multiple outcomes in different age subgroups (Supplementary Table 15). Similar but slightly weakened results were obtained, and the results indicated that the observed associations in the primary analysis were not driven by age. Moreover, no association was found between CSVD neuroimaging features and motor dysfunction duration (Supplementary Table 16).
DISCUSSION
By thoroughly exploring the relationship between CSVD and MSA, we had several main findings. First, patients with MSA had a greater CSVD burden relative to healthy individuals, and no statistical difference was found in the distribution of overall CSVD burden between MSA-P and MSA-C. Second, motor dysfunction and cognitive impairment were significantly worse in subjects with severe CSVD than in those with a none-to-mild CSVD burden. Third, the overall CSVD severity was closely related to motor dysfunction in patients with MSA, no matter in MSA-C or MSA-P. Among CSVD imaging markers, WMH had a close relationship with motor, cognitive, and emotional deficits, while the EPVS in the centrum semiovale, basal ganglia, and hippocampus regions was correlated only with motor severity, anxiety, and cognition, respectively. Taken together, concomitant CSVD may be correlated with worse multi-dimensional dysfunction in patients with MSA, and different CSVD imaging markers may play distinct roles in MSA outcomes.
This study ascertained the distinction between overall CSVD burden and CSVD imaging markers that existed between MSA patients and healthy subjects. In our findings, 18.66% of MSA patients had severe CSVD burden, while in patients with PD (another α-synucleinopathy), the prevalence was 21.35% [26]. Both prevalences were higher than that in healthy controls (9.70%), indirectly verifying that these two α-synuclein diseases were frequently complicated by CSVD neuroimaging manifestations. This view was also confirmed in clinicopathological and autopsy studies [27–29]. In terms of CSVD imaging markers, we found patients with MSA had more severe WMH, but no significant differences were found in lacunes compared with healthy people. The result was in line with previous studies which had relatively small sample sizes and conducted cerebral MRI using a 1.5 T device [11, 12]. Several studies based on DTI [13, 14] and dMRI [15, 16] have indeed demonstrated the microstructural abnormalities of WMH in MSA. It is worth noting that in our study, 39.47% of MSA patients had an extensive EPVS burden in the hippocampus, higher than the previously reported 26.14% in patients with hypertension [30]. In the midbrain, the burden of EPVS accounted for 41.05%, more severe than that in the healthy controls. Interestingly, no statistical difference was found in the distribution of overall CSVD burden between MSA-P patients and MSA-C patients. Only 35 MSA-P (18.42%) were included in our study, the ratio is similar to a study from Japan (the ratio was 18.18%) [11, 12], so future studies need to include more MSA-P patients to verify our findings. In a word, given that these CSVD markers have been rarely investigated in MSA patients, their prominent CSVD burden needs to be validated in more studies.
To our knowledge, we are the first to show that motor dysfunction and cognitive impairment were significantly worse in MSA patients with severe CSVD than those with none-to-mild CSVD. In addition, the overall CSVD severity may be related to worse motor dysfunction in patients with MSA. These findings were largely consistent with those of previous studies in the PD field [31, 32], so we speculate that CSVD may affect motor dysfunction in α-synucleinopathies by extensively destroying multiple brain pathways. Future studies with functional imaging or neurotransmitter biomarkers are needed to test this hypothesis. We found no correlation between the overall CSVD severity and non-motor domains (cognitive function, depression, and anxiety), which was different from the results in patients with PD [26, 32]. This indicated the default network dysfunction of MSA was different from PD [13]. In addition, the enrolled MSA patients were relatively younger may partially explain the results. Nevertheless, we presented the first preliminary evidence of the relationship between CSVD severity and MSA outcomes, a future direction that warrants to be deeply explored.
Several mechanisms may underlie the correlation between CSVD and MSA. First is the dysfunction of neuro-glia-vascular unit. Capillary endothelial cells and pericytes interact with astrocytes, oligodendrocytes, and microglia, which together form the neuro-glia-vascular unit. Research in humans has identified that the BBB destruction mediated by endothelial dysfunction may trigger reduced cerebrovascular reactivity, impaired blood flow, and interstitial fluid drainage, thereby initiating or exacerbating the development of CSVD [33–35]. BBB impairment was involved in the pathogenesis of MSA simultaneously [36]. Evidence has confirmed that in patients with MSA, BBB impairment was correlated with clinical severity [10] and the rate of disease progression [9]. Therefore, MSA and CSVD shared the BBB impairment mechanism. The second is hypoperfusion resulting from cerebral autoregulation disorders [8], which is one of the main pathogeneses of CSVD [33]. Patients with MSA and PD had significant cerebral self-regulation disorders [37], which were thought to be related to neurogenic orthostatic hypotension [37]. Previous studies have shown that decreased orthostatic blood pressure was significantly and independently correlated with CSVD in patients with MSA [11, 12] and patients with PD [11, 38]. Our study confirmed the results by showing that postural hypotension was associated with CSVD burden independently after adjusting for various traditional risk factors (Supplementary Table 17), which suggested that the dynamic changes in cerebral perfusions caused by orthostatic hypotension may be predisposing factors for CSVD in patients with α-synucleinopathies [11, 12, 38]. Furthermore, supine hypertension, as a risk factor of CSVD, can cause complex pathological alterations to the cerebral small vessels, compromising the structural and functional integrity of the cerebral microcirculation, such as promoting microvascular rarefaction, BBB impairment and neuro-glia-vascular unit uncoupling, impairing cerebral blood supply eventually [39]. These pathological changes may in turn impair the structure and function of multiple brain pathways in MSA. Third, oligodendrocytes in MSA may be vulnerable to cerebral hypoperfusion, as in basic research, oligodendrocytes were indeed very sensitive to ischemic insults [40, 41]. Therefore, the two-hit hypothesis for vascular dysfunction or CSVD may also apply to MSA, that is, vascular dysfunction or CSVD may have a “double hit” effect on brain health by accelerating neurodegeneration (hit two) in addition to impairing brain perfusion, function and pathways mediated by multiple focal ischemic or hypoxic micro-injuries (hit one). This hypothesis requires testing in future studies.
Our results highlighted the different roles of four single markers of CSVD in MSA. A previous study reported that microstructural abnormalities of WMH may be associated with motor dysfunction in MSA patients [18]. In contrast, it is unclear whether the comorbidity of WMH affects non-motor functions and whether other CSVD markers affect adverse outcomes in patients with MSA. In a relatively large MSA cohort, we extended former studies by showing the close associations between WMH and motor, cognitive and emotional dysfunction, which was in agreement with the findings in PD [26]. Secondly, consistent with previous WMH studies [11, 12], no association between CSVD neuroimaging features and motor dysfunction duration was observed, implying that motor dysfunction duration may not aggravate the CSVD burden. Besides, we found that EPVS burden in different regions affected different functional domains. The EPVS in the hippocampus tended to be correlated with cognitive impairment, as previously revealed in Alzheimer’s disease or hypertension populations [30]. Patients with higher EPVS count in the hippocampus were found to show worse performance in verbal reasoning [30], which may be related to the functional connection between the hippocampus and medial prefrontal lobe [42–44]. In addition, in the centrum semiovale, EPVS was associated with motor function exclusively, while in the basal ganglia, EPVS was significantly associated with anxiety. These results were different from previous publications on PD that EPVS in these two regions (centrum semiovale and basal ganglia) was associated with cognitive function [26, 45]. Relevant large-scale research is necessary.
It is noteworthy that the perivascular space has been proposed to be part of the glial lymphatic system in the brain, and proved to play a key role in the material exchange process between cerebrospinal fluid and brain parenchyma, therefore, EPVS is considered to be a pathological feature of glial lymphatic system dysfunction [46]. We found that EPVS burden in different regions affected different functional domains for MSA patients, inferring that the fluid and toxin clearance in different regions may be involved in different brain functions. In the future, multi-center studies with large samples need to confirm this point. WMH has been proposed to be associated with vascular pathologies such as arterial sclerosis and regional hypo-perfusion, and EPVS may be associated with neuro-glia-vascular unit dysfunction and BBB destruction [33]. Studying the specific pathophysiological mechanisms underlying the course of MSA will be a daunting task ahead.
The strengths of this study include the relatively large sample size, the comprehensive cerebral imaging evaluations, and multidimensional outcome assessments. However, some limitations existed. First, the cross-sectional study design limited us to explore the effects of CSVD on disease progression in MSA. Well-characterized longitudinal studies are required in the future. Second, we only carried out semi-quantitative scoring of CSVD imaging markers and lacked quantitative evaluation such as WMH volumes. Third, the diagnosis of MSA was made according to the consensus criteria for probable MSA, whereas a “definite” MSA diagnosis required a postmortem autopsy.
Collectively our findings suggest clinicians should be aware that the comorbidity of CSVD is correlated with worse multidimensional dysfunction in patients with MSA, and CSVD imaging markers play distinct roles in MSA outcomes. In the meantime, the early appearance of WMH and extensive H-EPVS burden may reflect the onset of cognitive decline in the course of MSA, and in-depth neuropsychological assessments should be considered for the patients.
ACKNOWLEDGMENTS
We sincerely thank the patients, families, general practitioners, and hospital colleagues who participated in our study.
FUNDING
This study was supported by grants from the Minhang District High-Level Specialist Backbone Physician Training Plan (2020MZYS09), Shanghai Fifth People’s Hospital Integration Project (2022WYRH03), Shanghai Minhang District Health and Family Planning Commission for constructing big disciplines (2020MWDXK01), the National Natural Science Foundation of China (91849126), Shanghai Municipal Science and Technology Major Project (No.2018SHZDZX01) and ZJlab, Tianqiao and Chrissy Chen Institute, and the State Key Laboratory of Neurobiology and Frontiers Center for Brain Science of Ministry of Education, Fudan University. The funders had no role in study design, data collection and analysis, decision to publish, or preparation of the manuscript.
CONFLICT OF INTEREST
The authors have no conflict of interest to report.
DATA AVAILABILITY
The data supporting the findings of this study are available on request from the corresponding author. The data are not publicly available due to privacy or ethical restrictions.
SUPPLEMENTARY MATERIAL
[1] The supplementary material is available in the electronic version of this article: https://dx.doi.org/10.3233/JPD-230166.
REFERENCES
[1] | Fanciulli A , Wenning GK ((2015) ) Multiple-system atrophy, N Engl J Med 372: , 249–263. |
[2] | Wenning GK , Stankovic I , Vignatelli L , Fanciulli A , Calandra-Buonaura G , Seppi K , Palma JA , Meissner WG , Krismer F , Berg D , Cortelli P , Freeman R , Halliday G , Hoglinger G , Lang A , Ling H , Litvan I , Low P , Miki Y , Panicker J , Pellecchia MT , Quinn N , Sakakibara R , Stamelou M , Tolosa E , Tsuji S , Warner T , Poewe W , Kaufmann H ((2022) ) The movement disorder society criteria for the diagnosis of multiple system atrophy, Mov Disord 37: , 1131–1148. |
[3] | Koga S , Aoki N , Uitti RJ , van Gerpen JA , Cheshire WP , Josephs KA , Wszolek ZK , Langston JW , Dickson DW ((2015) ) When DLB, PD, and PSP masquerade as MSA: An autopsy study of 134 patients, Neurology 85: , 404–412. |
[4] | Koga S , Parks A , Uitti RJ , van Gerpen JA , Cheshire WP , Wszolek ZK , Dickson DW ((2017) ) Profile of cognitive impairment and underlying pathology in multiple system atrophy, Mov Disord 32: , 405–413. |
[5] | Lazzeri G , Franco G , Difonzo T , Carandina A , Gramegna C , Vergari M , Arienti F , Naci A , Scata C , Monfrini E , Dias Rodrigues G , Montano N , Comi GP , Saetti MC , Tobaldini E , Di Fonzo A ((2022) ) Cognitive and autonomic dysfunction in multiple system atrophy type P and C: A comparative study, Front Neurol 13: , 912820. |
[6] | Miki Y , Foti SC , Hansen D , Strand KM , Asi YT , Tsushima E , Jaunmuktane Z , Lees AJ , Warner TT , Quinn N , Ling H , Holton JL ((2020) ) Hippocampal alpha-synuclein pathology correlates with memory impairment in multiple system atrophy, Brain 143: , 1798–1810. |
[7] | Rydbirk R , Ostergaard O , Folke J , Hempel C , DellaValle B , Andresen TL , Lokkegaard A , Hejl AM , Bode M , Blaabjerg M , Moller M , Danielsen EH , Salvesen L , Starhof CC , Bech S , Winge K , Rungby J , Pakkenberg B , Brudek T , Olsen JV , Aznar S ((2022) ) Brain proteome profiling implicates the complement and coagulation cascade in multiple system atrophy brain pathology, Cell Mol Life Sci 79: , 336. |
[8] | Erro R , Ponticorvo S , Manara R , Barone P , Picillo M , Scannapieco S , Cicarelli G , Squillante M , Volpe G , Esposito F , Pellecchia MT ((2020) ) Subcortical atrophy and perfusion patterns in Parkinson disease and multiple system atrophy, Parkinsonism Relat Disord 72: , 49–55. |
[9] | Lee JE , Song SK , Hong JY , Sunwoo MK , Park HJ , Sohn YH , Lee PH ((2013) ) Changes in the blood-brain barrier status closely correlate with the rate of disease progression in patients with multiple system atrophy: A longitudinal study, Parkinsonism Relat Disord 19: , 450–452. |
[10] | Song SK , Lee SK , Lee JJ , Lee JE , Choi HS , Sohn YH , Lee PH ((2011) ) Blood-brain barrier impairment is functionally correlated with clinical severity in patients of multiple system atrophy, Neurobiol Aging 32: , 2183–2189. |
[11] | Umoto M , Miwa H , Ando R , Kajimoto Y , Kondo T ((2012) ) White matter hyperintensities in patients with multiple system atrophy, Parkinsonism Relat Disord 18: , 17–20. |
[12] | Lim TS , Lee PH , Kim HS , Yong SW ((2009) ) White matter hyperintensities in patients with multiple system atrophy, J Neurol 256: , 1663–1670. |
[13] | Tang S , Wang Y , Liu Y , Chau SW , Chan JW , Chu WC , Abrigo JM , Mok VC , Wing YK ((2022) ) Large-scale network dysfunction in alpha-Synucleinopathy: A meta-analysis of resting-state functional connectivity, EBioMedicine 77: , 103915. |
[14] | Faber J , Giordano I , Jiang X , Kindler C , Spottke A , Acosta-Cabronero J , Nestor PJ , Machts J , Duzel E , Vielhaber S , Speck O , Dudesek A , Kamm C , Scheef L , Klockgether T ((2020) ) Prominent white matter involvement in multiple system atrophy of cerebellar type, Mov Disord 35: , 816–824. |
[15] | Pasquini J , Firbank MJ , Ceravolo R , Silani V , Pavese N ((2022) ) Diffusion magnetic resonance imaging microstructural abnormalities in multiple system atrophy: A comprehensive review, Mov Disord 37: , 1963–1984. |
[16] | Krismer F , Beliveau V , Seppi K , Mueller C , Goebel G , Gizewski ER , Wenning GK , Poewe W , Scherfler C ((2021) ) Automated analysis of diffusion-weighted magnetic resonance imaging for the differential diagnosis of multiple system atrophy from Parkinson’s disease, Mov Disord 36: , 241–245. |
[17] | Wardlaw JM , Smith EE , Biessels GJ , Cordonnier C , Fazekas F , Frayne R , Lindley RI , O’Brien JT , Barkhof F , Benavente OR , Black SE , Brayne C , Breteler M , Chabriat H , Decarli C , de Leeuw FE , Doubal F , Duering M , Fox NC , Greenberg S , Hachinski V , Kilimann I , Mok V , Oostenbrugge R , Pantoni L , Speck O , Stephan BC , Teipel S , Viswanathan A , Werring D , Chen C , Smith C , van Buchem M , Norrving B , Gorelick PB , Dichgans M , STandards for ReportIng Vascular changes on nEuroimaging (STRIVE v1) ((2013) ) Neuroimaging standards for research into small vessel disease and its contribution to ageing and neurodegeneration, Lancet Neurol 12: , 822–838. |
[18] | Tha KK , Terae S , Yabe I , Miyamoto T , Soma H , Zaitsu Y , Fujima N , Kudo K , Sasaki H , Shirato H ((2010) ) Microstructural white matter abnormalities of multiple system atrophy:} topographic illustration by using diffusion-tensor MR imaging, Radiology 255: , 563–569. |
[19] | Staals J , Makin SD , Doubal FN , Dennis MS , Wardlaw JM ((2014) ) Stroke subtype, vascular risk factors, and total MRI brain small-vessel disease burden, Neurology 83: , 1228–1234. |
[20] | Gilman S , Wenning GK , Low PA , Brooks DJ , Mathias CJ , Trojanowski JQ , Wood NW , Colosimo C , Durr A , Fowler CJ , Kaufmann H , Klockgether T , Lees A , Poewe W , Quinn N , Revesz T , Robertson D , Sandroni P , Seppi K , Vidailhet M ((2008) ) Second consensus statement on the diagnosis of multiple system atrophy, Neurology 71: , 670–676. |
[21] | Eidelberg D ((2009) ) Metabolic brain networks in neurodegenerative disorders: A functional imaging approach, Trends Neurosci 32: , 548–557. |
[22] | Marshall V , Grosset D ((2003) ) Role of dopamine transporter imaging in routine clinical practice, Mov Disord 18: , 1415–1423. |
[23] | Xiao L , Lan W , Sun W , Dai Q , Xiong Y , Li L , Zhou Y , Zheng P , Fan W , Ma N , Guo Z , Chen X , Xie X , Xu L , Zhu W , Xu G , Liu X ((2015) ) Chronic kidney disease in patients with lacunar stroke: Association with enlarged perivascular spaces and total magnetic resonance imaging burden of cerebral small vessel disease, Stroke 46: , 2081–2086. |
[24] | Adams HH , Cavalieri M , Verhaaren BF , Bos D , van der Lugt A , Enzinger C , Vernooij MW , Schmidt R , Ikram MA ((2013) ) Rating method for dilated Virchow-Robin spaces on magnetic resonance imaging, Stroke 44: , 1732–1735. |
[25] | Jimenez-Balado J , Riba-Llena I , Garde E , Valor M , Gutierrez B , Pujadas F , Delgado P ((2018) ) Prevalence of hippocampal enlarged perivascular spaces in a sample of patients with hypertension and their relation with vascular risk factors and cognitive function, J Neurol Neurosurg Psychiatry 89: , 651–656. |
[26] | Chen H , Wan H , Zhang M , Liu G , Wang X , Wang Z , Ma H , Pan Y , Feng T , Wang Y ((2021) ) Cerebral small vessel disease may worsen motor function, cognition, and mood in Parkinson’s disease, Parkinsonism Relat Disord 83: , 86–92. |
[27] | Hase Y , Polvikoski TM , Firbank MJ , Craggs LJL , Hawthorne E , Platten C , Stevenson W , Deramecourt V , Ballard C , Kenny RA , Perry RH , Ince P , Carare RO , Allan LM , Horsburgh K , Kalaria RN ((2020) ) Small vessel disease pathological changes in neurodegenerative and vascular dementias concomitant with autonomic dysfunction, Brain Pathol 30: , 191–202. |
[28] | Irwin DJ , Grossman M , Weintraub D , Hurtig HI , Duda JE , Xie SX , Lee EB , Van Deerlin VM , Lopez OL , Kofler JK , Nelson PT , Jicha GA , Woltjer R , Quinn JF , Kaye J , Leverenz JB , Tsuang D , Longfellow K , Yearout D , Kukull W , Keene CD , Montine TJ , Zabetian CP , Trojanowski JQ ((2017) ) Neuropathological and genetic correlates of survival and dementia onset in synucleinopathies: A retrospective analysis, Lancet Neurol 16: , 55–65. |
[29] | Toledo JB , Arnold SE , Raible K , Brettschneider J , Xie SX , Grossman M , Monsell SE , Kukull WA , Trojanowski JQ ((2013) ) Contribution of cerebrovascular disease in autopsy confirmed neurodegenerative disease cases in the National Alzheimer’s Coordinating Centre, Brain 136: , 2697–2706. |
[30] | Gertje EC , van Westen D , Panizo C , Mattsson-Carlgren N , Hansson O ((2021) ) Association of enlarged perivascular spaces and measures of small vessel and Alzheimer disease, Neurology 96: , e193–e202 |
[31] | Chen H , Zhang M , Liu G , Wang X , Wang Z , Ma H , Pan Y , Wang D , Wang Y , Feng T ((2020) ) Effect of small vessel disease burden and lacunes on gait/posture impairment in Parkinson’s disease, Neurol Sci 41: , 3617–3624. |
[32] | Malek N , Lawton MA , Swallow DM , Grosset KA , Marrinan SL , Bajaj N , Barker RA , Burn DJ , Hardy J , Morris HR , Williams NM , Wood N , Ben-Shlomo Y , Grosset DG , Consortium PRC ((2016) ) Vascular disease and vascular risk factors in relation to motor features and cognition in early Parkinson’s disease, Mov Disord 31: , 1518–1526. |
[33] | Wardlaw JM , Smith C , Dichgans M ((2019) ) Small vessel disease: Mechanisms and clinical implications, Lancet Neurol 18: , 684–696. |
[34] | Brown R , Benveniste H , Black SE , Charpak S , Dichgans M , Joutel A , Nedergaard M , Smith KJ , Zlokovic BV , Wardlaw JM ((2018) ) Understanding the role of the perivascular space in cerebral small vessel disease, Cardiovasc Res 114: , 1462–1473. |
[35] | Doubal FN , MacLullich AM , Ferguson KJ , Dennis MS , Wardlaw JM ((2010) ) Enlarged perivascular spaces on MRI are a feature of cerebral small vessel disease, Stroke 41: , 450–454. |
[36] | Wu YC , Sonninen TM , Peltonen S , Koistinaho J , Lehtonen S ((2021) ) Blood-brain barrier and neurodegenerative diseases-modeling with iPSC-derived brain cells, Int J Mol Sci 22: . |
[37] | Indelicato E , Fanciulli A , Poewe W , Antonini A , Pontieri FE , Wenning GK ((2015) ) Cerebral autoregulation and white matter lesions in Parkinson’s disease and multiple system atrophy, Parkinsonism Relat Disord 21: , 1393–1397. |
[38] | Kim JS , Oh YS , Lee KS , Kim YI , Yang DW , Goldstein DS ((2012) ) Association of cognitive dysfunction with neurocirculatory abnormalities in early Parkinson disease, Neurology 79: , 1323–1331. |
[39] | Ungvari Z , Toth P , Tarantini S , Prodan CI , Sorond F , Merkely B , Csiszar A ((2021) ) Hypertension-induced cognitive impairment: From pathophysiology to public health, Nat Rev Nephrol 17: , 639–654. |
[40] | Valeriani V , Dewar D , McCulloch J ((2000) ) Quantitative assessment of ischemic pathology in axons, oligodendrocytes, and neurons: Attenuation of damage after transient ischemia, J Cereb Blood Flow Metab 20: , 765–771. |
[41] | Pantoni L , Garcia JH , Gutierrez JA ((1996) ) Cerebral white matter is highly vulnerable to ischemia, Stroke 27: , 1641–1646; discussion 1647. |
[42] | Jillings S , Pechenkova E , Tomilovskaya E , Rukavishnikov I , Jeurissen B , Van Ombergen A , Nosikova I , Rumshiskaya A , Litvinova L , Annen J , De Laet C , Schoenmaekers C , Sijbers J , Petrovichev V , Sunaert S , Parizel PM , Sinitsyn V , Eulenburg PZ , Laureys S , Demertzi A , Wuyts FL ((2023) ) Prolonged microgravity induces reversible and persistent changes on human cerebral connectivity, Commun Biol 6: , 46. |
[43] | Medford N , Critchley HD ((2010) ) Conjoint activity of anterior insular and anterior cingulate cortex: Awareness and response, Brain Struct Funct 214: , 535–549. |
[44] | Thierry AM , Gioanni Y , Degenetais E , Glowinski J ((2000) ) Hippocampo-prefrontal cortex pathway: Anatomical and electrophysiological characteristics, Hippocampus 10: , 411–419. |
[45] | Javierre-Petit C , Schneider JA , Kapasi A , Makkinejad N , Tamhane AA , Leurgans SE , Mehta RI , Barnes LL , Bennett DA , Arfanakis K ((2020) ) Neuropathologic and cognitive correlates of enlarged perivascular spaces in a community-based cohort of older adults, Stroke 51: , 2825–2833. |
[46] | Rasmussen MK , Mestre H , Nedergaard M ((2018) ) The glymphatic pathway in neurological disorders, Lancet Neurol 17: , 1016–1024. |

