
The Meal Delivery Routing Problem in E-commerce Platforms under the Shared Logistics Mode

1
School of Economics and Management, Yanshan University, Qinhuangdao 066004, China
2
College of Information Science and Engineering, Northeastern University, Shenyang 110819, China
*
Author to whom correspondence should be addressed.
J. Theor. Appl. Electron. Commer. Res. 2023, 18(4), 1799-1819; https://doi.org/10.3390/jtaer18040091
Submission received: 7 June 2023
/
Revised: 18 September 2023
/
Accepted: 18 September 2023
/
Published: 11 October 2023
(This article belongs to the Section e-Commerce Analytics)
Abstract
:The meal delivery routing problem faced by the e-commerce platform is challenging. In order to reduce the logistics cost and meet the needs of customers, a multi-objective meal delivery routing problem is studied under the shared logistics services mode (SLSM). In the meal delivery problem, the third-party logistics providers need to arrange vehicles in the multi-depot to pick up meals from multiple food providers and deliver them to customers, so as to realize the sharing of logistics services between food providers and compare them with the traditional logistics service mode (TLSM). While realizing sharing, it is also necessary to meet customer time requirements as much as possible. In this case, a multi-objective mathematical model to minimize customer dissatisfaction and delivery cost is established, and the linear weighting method is employed to transform the model. An improved Ant Lion Optimizer (IALO) is proposed to solve the problem, and compared with other algorithms. The experiments verified the effectiveness of the proposed algorithm and show that SLSM can save logistics costs and meet customer needs more than TLSM, and provide certain reference opinions for the e-commerce platform.
1. Introduction
The rapid development of society and the improvement of people’s living standards have made people pursue a higher quality of life. As far as eating is concerned, it is no longer enough to just fill a belly, so the catering industry is also developing in a diversified direction. Fast food is a new kind of catering product, which is fast, convenient, nutritious, diversified and low in price. It is deeply loved by students, white-collar workers and other young people. The maturity of Internet technology has caused various industries to integrate differently with the Internet, which has sparked the upsurge of the emerging service of meal delivery. In particular in recent years, the meal industry has broken away from the budding period and officially entered the mature period, which has caused the number of meals to continue to rise. While the number of meal deliveries increases, the optimization of the meal delivery route has also received extensive attention and research from experts and scholars. For example, Li [1], Yi [2] and other related scholars have conducted research on this issue. The core of the meal delivery route problem is the research on the vehicle routing problem (VRP). Its concept was first proposed by Dantzig and Ramser [3] in 1959. What they did has aroused academic researchers. More and more constraints are added to the basic VRP. For example, Yang [4] et al. established a corresponding mathematical model for the multi-depot vehicle route problem, converted the multi-depot vehicle into a single vehicle parking area, and solved it with an improved Mosquito Host-Seeking Algorithm; Brandão [5] proposed an iterative local search algorithm to solve the multi-depot open vehicle route problem. Most studies mainly aim at minimizing costs, but for the third-party logistics providers, they blindly aim at minimizing costs and do not consider customer satisfaction. They only want to obtain higher profits, which will lose customers. A lack of trust has caused the loss of customers. As a result, many scholars [6,7] began to study the multi-objective vehicle route problem that considers customer satisfaction and cost, but there are few studies on the actual application of the meal delivery route problem.
The Dial-a-Ride Problem (DARP) is a VRPPDTW variant [8,9,10,11], each transportation request is a combination of pickup at the origin node and drop-off at the destination node, and each request must be serviced by one vehicle. In order to improve the flexibility and convenience of urban transportation services, many scholars have studied this problem from different aspects. Philipp Hungerländer et al. [12] studied the Improving Sharing Rates of a Dial-a-Ride Problem and proposed a large neighborhood search to solve it. The Selective Dial Ride Problem (SDARP) studied by Rist, Y et al. [13] ignored travel costs compared to VRPPDTW, allowing requests to go unserviced, with the goal of maximizing the total number of pick-up and delivery requests for the service. An iterative algorithm based on combinatorial benders decomposition, novel variable-fixing technique and time discretization is proposed to solve SDARP with the extended fragment (EF) introduced. Experimental results show that the algorithm solves 11 previously unsolved instances in the existing benchmark of SDARP, and is superior to the previous state-of-the-art Logic-Based Benders Decomposition approach. Fu et al. [14] studied the pickup and delivery problems with vehicle-synchronized en route transfers. A mixed-integer linear programming model (MILP) is established with the objective function of minimizing the weighted total cost of vehicle travel distance, customer waiting time, customer driving distance and vehicle transfer time, and a new set of constraints is proposed to track vehicle arrival time at each stop along the way. Vehicles are allowed to wait for passengers to be transferred at the transfer location for a maximum period of time. A two-stage greedy heuristic algorithm with a build phase and an improvement phase is designed. In the first phase, an initial solution for the PDP is constructed using an insertion heuristic. In the second phase, the initial PDP solution is iteratively improved by inserting transfer locations and re-assigning onboard passengers to vehicles. Yunlin Guan et al. [15] proposed a customized bus service model (OECBSM-PMT) for one e-ticket for multi-travel passengers through customized buses (CBs) for passengers who need to travel multiple times in a short period of time. Amirreza Nickkar et al. [16] studied the optimization model of demand responsive feeder transportation that provides passengers with temporary stops, and designed a meta-heuristic algorithm to solve it. Hua et al. [17] studied the dynamic shared taxi problem of the on-demand shared taxi system, and divided the passenger request into three categories: onboard requests, scheduled requests and unscheduled requests, introduced the rescheduling ratio to make all drivers pick up passengers from the corresponding pick-up location and get off at the corresponding drop-off location within their time window, and designed a branch-and-price algorithm and the Lagrange relaxation algorithm to solve this problem. Fu et al. [18] constructed a modular dial-up ride model that provides door-to-door service for passengers, or deviates vehicles from each other from the queue, drives at a lower cost, and allows passenger transfer en route before splitting to minimize the sum of vehicle travel costs and passenger service time, and designs a neighborhood search algorithm solution based on Steiner tree. Experimental results show that modular vehicle (MV) technology can save up to 52% of vehicle travel costs, 41% of passenger service time and 29% of total costs.
In the past, meal delivery was a one person, one ride, and fixed service for a certain food provider in China. This method is called TLSM in this article. This not only leads to an increase in useless distances, but also requires more riders, which is not conducive to reducing cost. After 2000, with the rise and popularization of Internet technology, the sharing economy began to emerge. A recent study [19] shows, as a result of the complexity, sharing economy rules apply and create a scope of new possibilities, generally referred to as shared logistics. This refers to the general idea of sharing assets and services between various end users rather than owning or producing them. The general goal of shared logistics is to achieve better results and higher efficiency of logistics processes than it is possible to achieve when acting individually [20]. Based on this, this paper proposes a SLSM. This method allows the rider form different logistics companies to provide service to multiple food providers at the same time, that is, the rider can serve another food provider not only after the delivery itinerary, but also during the delivery. The rise of shared logistics has added a new direction to the study of meal delivery issues. People have begun to add shared logistics factors to meal delivery. The SLSM in this article is also related to one of the modes, that is, the collaborative transportation mode [5]. Regarded as reducing the overall route cost by reducing air transport by combining multiple shippers or carriers’ vehicles, related research [21] also focuses on the cooperation and sharing of multiple interest entities. They share vehicle information, load, etc. [22,23,24,25]. Unlike coordinated transportation, the SLSM in this article only means that one third-party logistics provider’s vehicle can serve multiple food providers, so these food providers share, and the third-party logistics provider knows all the related vehicles information. Although there are many studies, few of these studies combine shared logistics and use them in the optimization of meal delivery routes. The articles are summarized in Table 1.
In summary, most of the existing works focus only on reducing costs, and do not consider customer satisfaction. The emergence of the SLSM gives the chance to improve the operation of transportation and delivery, both on cost reduction and customer satisfaction. For the meal delivery routing problem, the introduction of SLSM is a new way to focus on both delivery costs and customer satisfaction.
This article belongs to the multi-objective meal delivery route optimization problem under the shared logistics mode. In this problem, we integrate shared logistics services and compare them with traditional logistics services, while considering the impact of customer satisfaction and cost on the entire meal delivery process, establish a corresponding multi-objective integer programming model. The improved Ant Lion Optimizer is used to solve the model, the effectiveness of the model and algorithm is verified through simulation experiments, and the two logistics services are compared and analyzed.
The main purpose of this paper is to introduce the shared logistics services mode (SLSM) into meal delivery problem, to help the third-party logistics providers to arrange vehicles in the multi-depot to pick up meals from multiple food providers and deliver them to customers. A multi-objective mathematical model and an improved Ant Lion Optimizer (IALO) are proposed. This research can help e-commerce platforms save logistics costs and meet customer needs.
The main contributions of this paper: (1) The SLSM is introduced into the operation of meal delivery problem to find a way to reduce cost and improve customer satisfaction. (2) A multi-objective mathematical model is built to address the operational problem. (3) An improved Ant Lion Optimizer is designed, which provides an efficient way to solve this kind of optimization problems.
2. Problem Description and Modeling
2.1. Problem Description
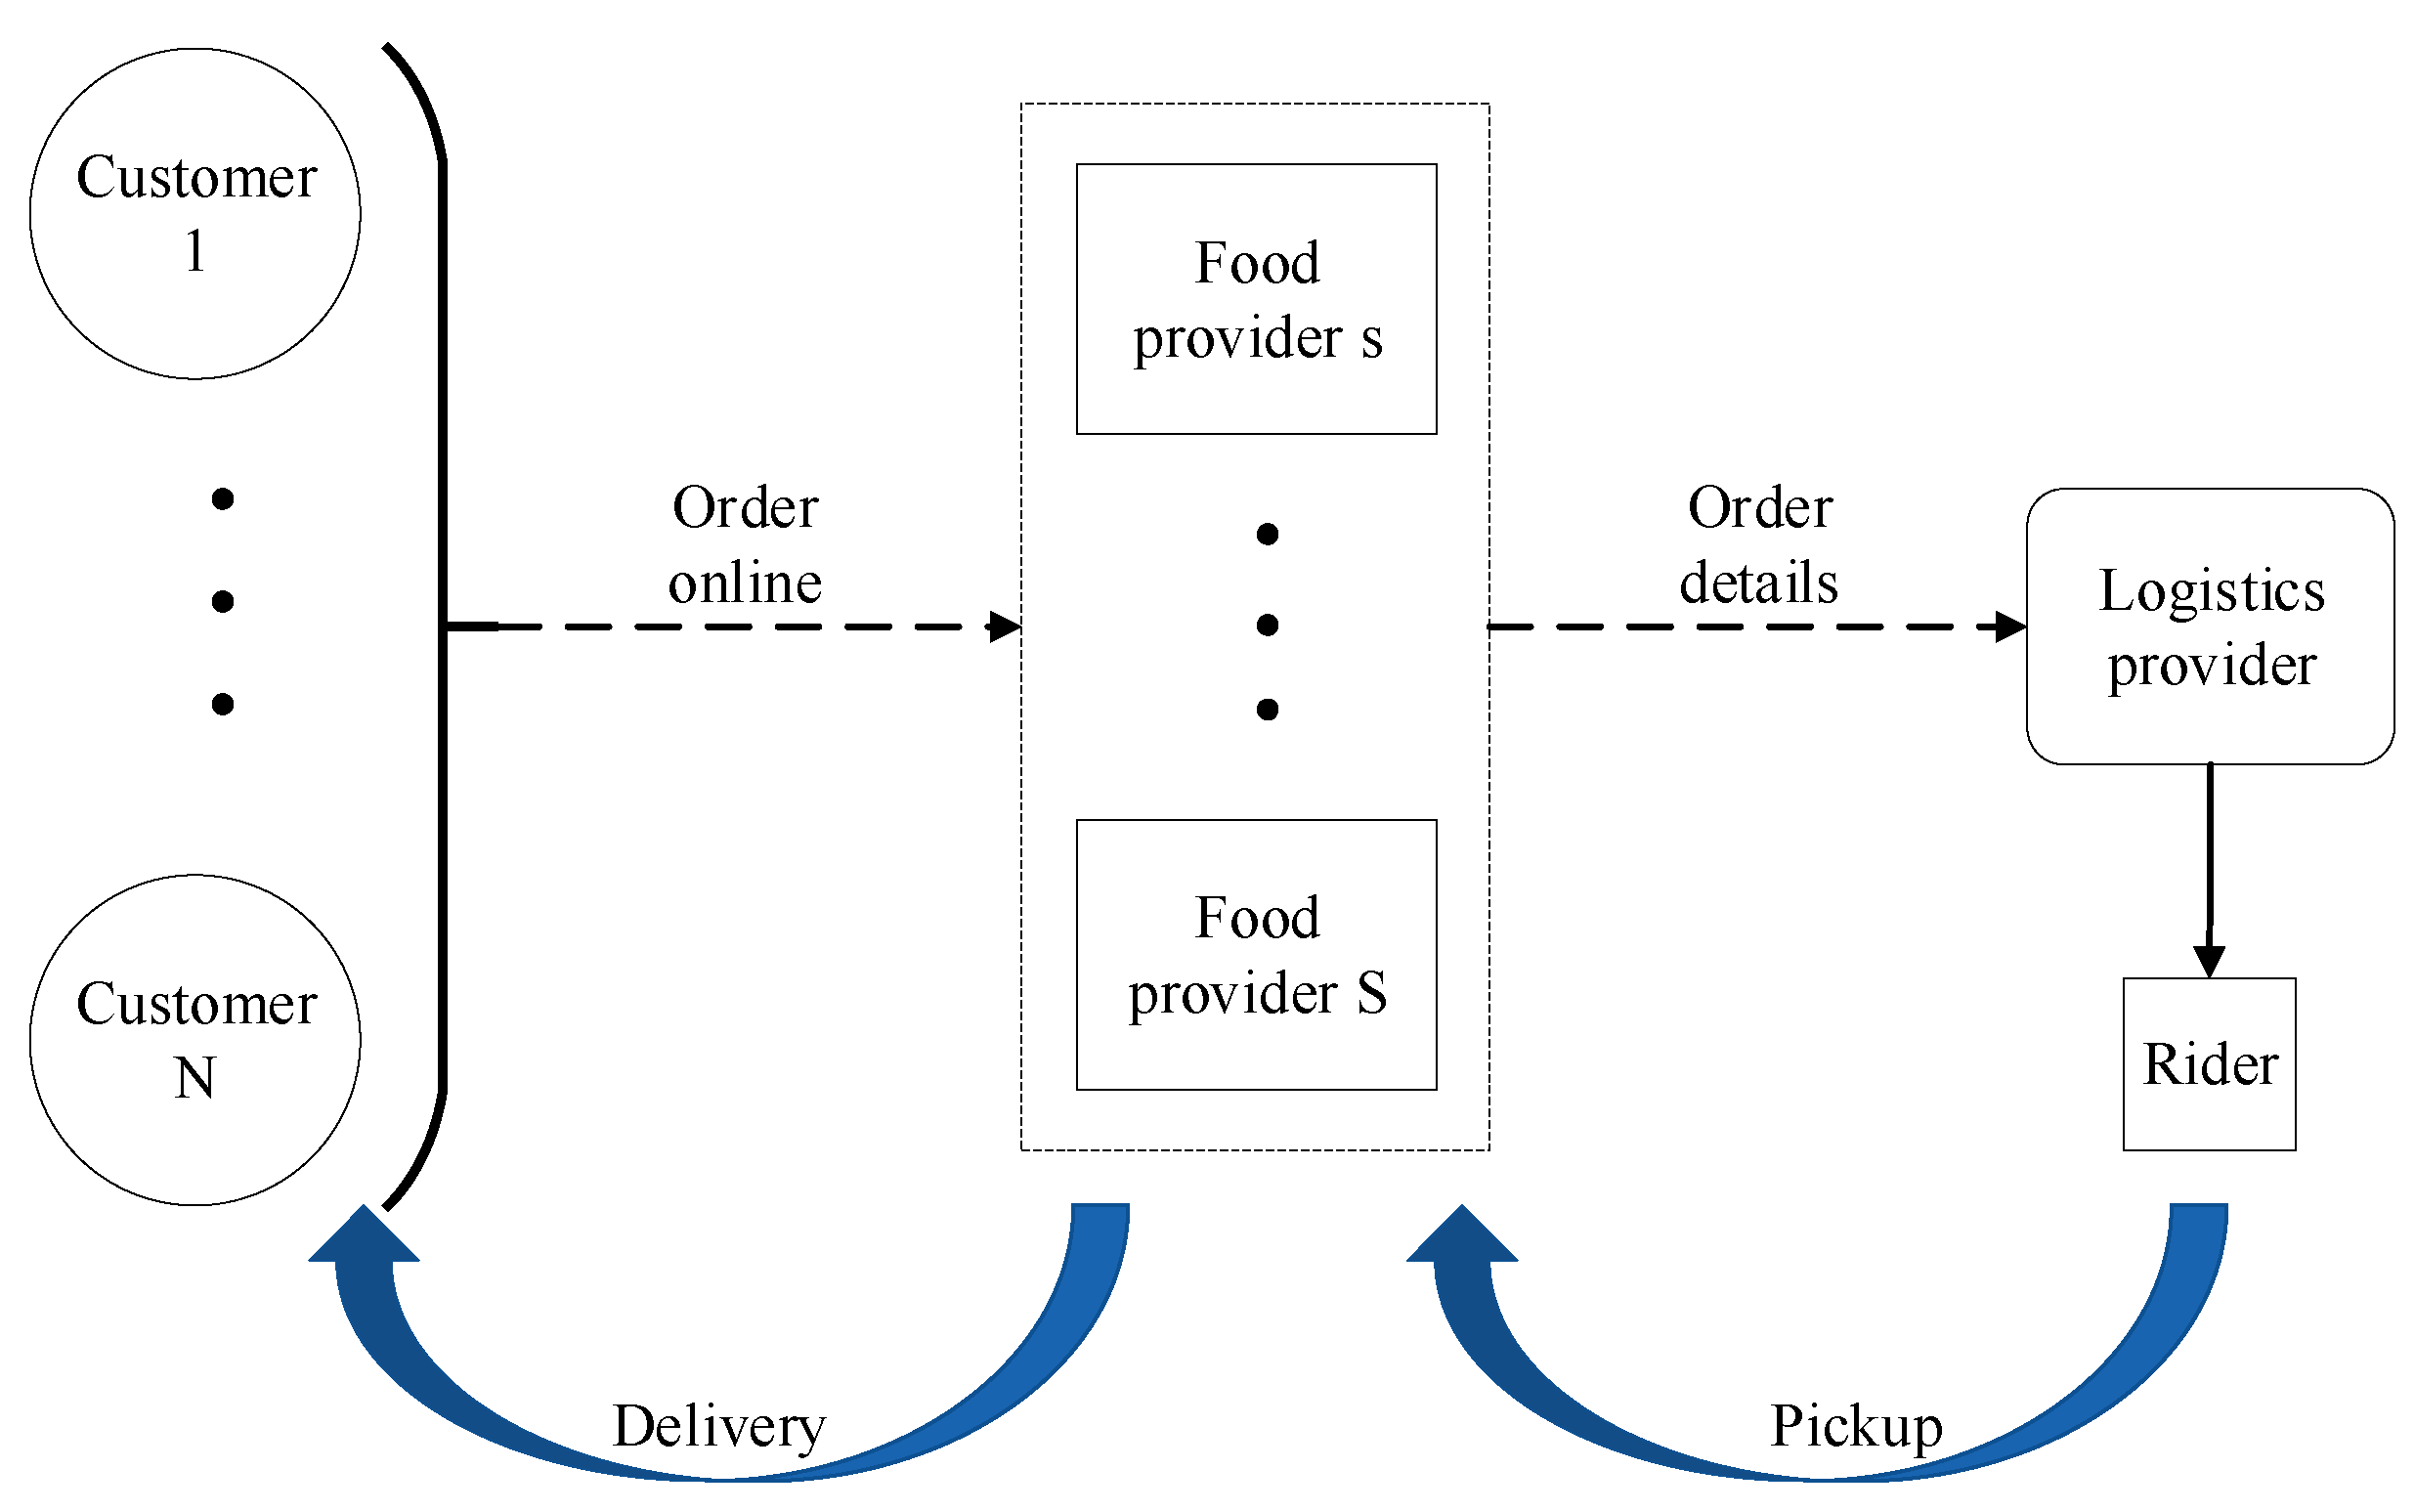
The multi-objective meal delivery route problem under the shared logistics mode can be described as follows: It assumes that at the center of the city, logistics providers have more than one depot, which are distributed in different places, and each depot has multiple riders. The rider needs to take the meal from multiple food providers, through several streets, to the customer. Customer overall satisfaction is not the lowest, and distribution under the condition of minimum cost would be delivery to customers. The specific delivery process is shown in Figure 1.
2.2. Two Types of Logistics Service Modes
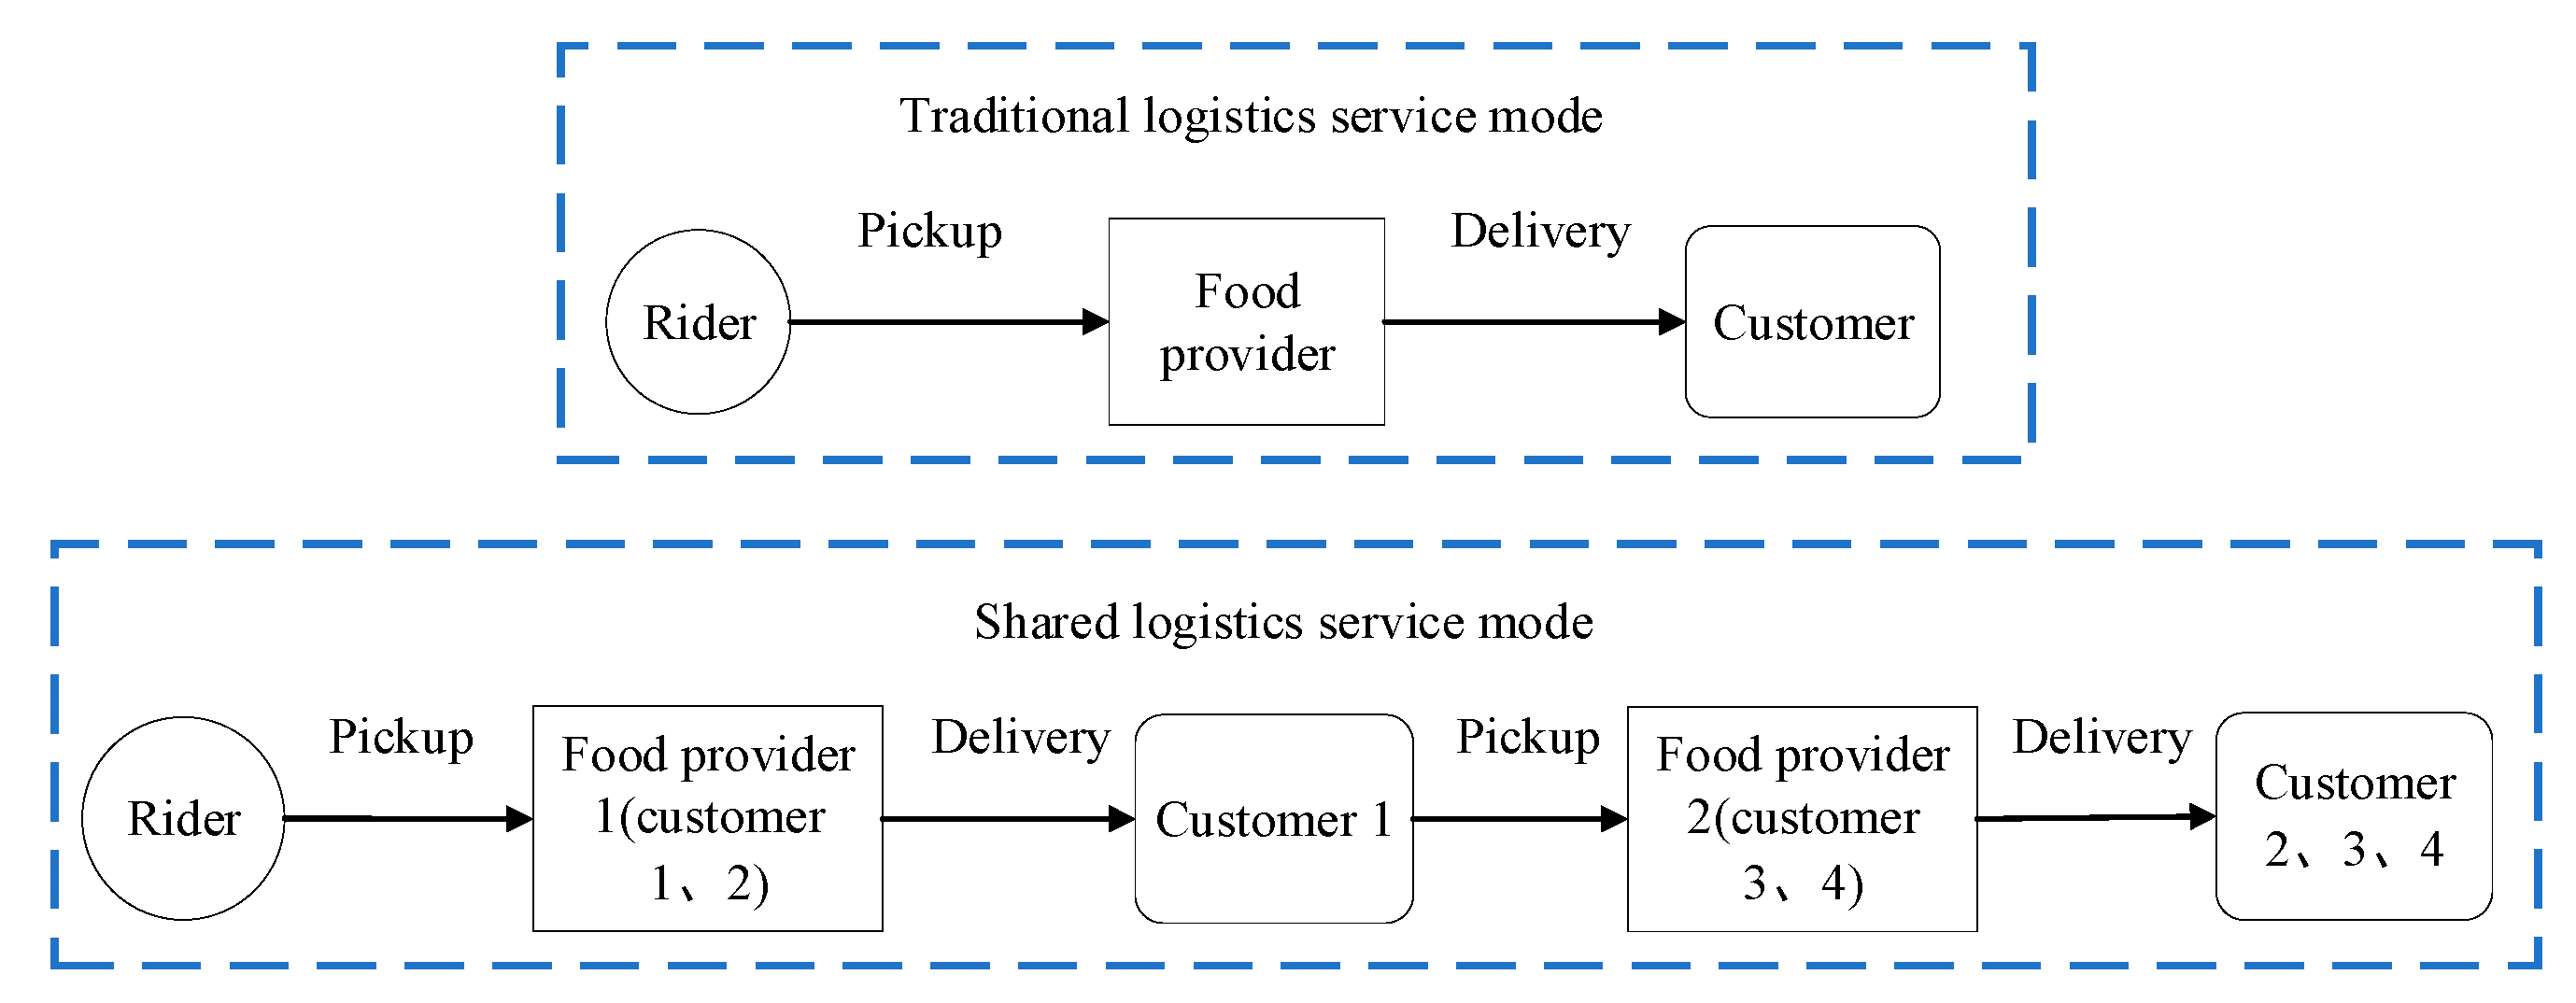
The introduction of this article has presented two types of logistics service, one is TLSM and the other is SLSM. Figure 2 is a general description of the two types of logistics service modes.
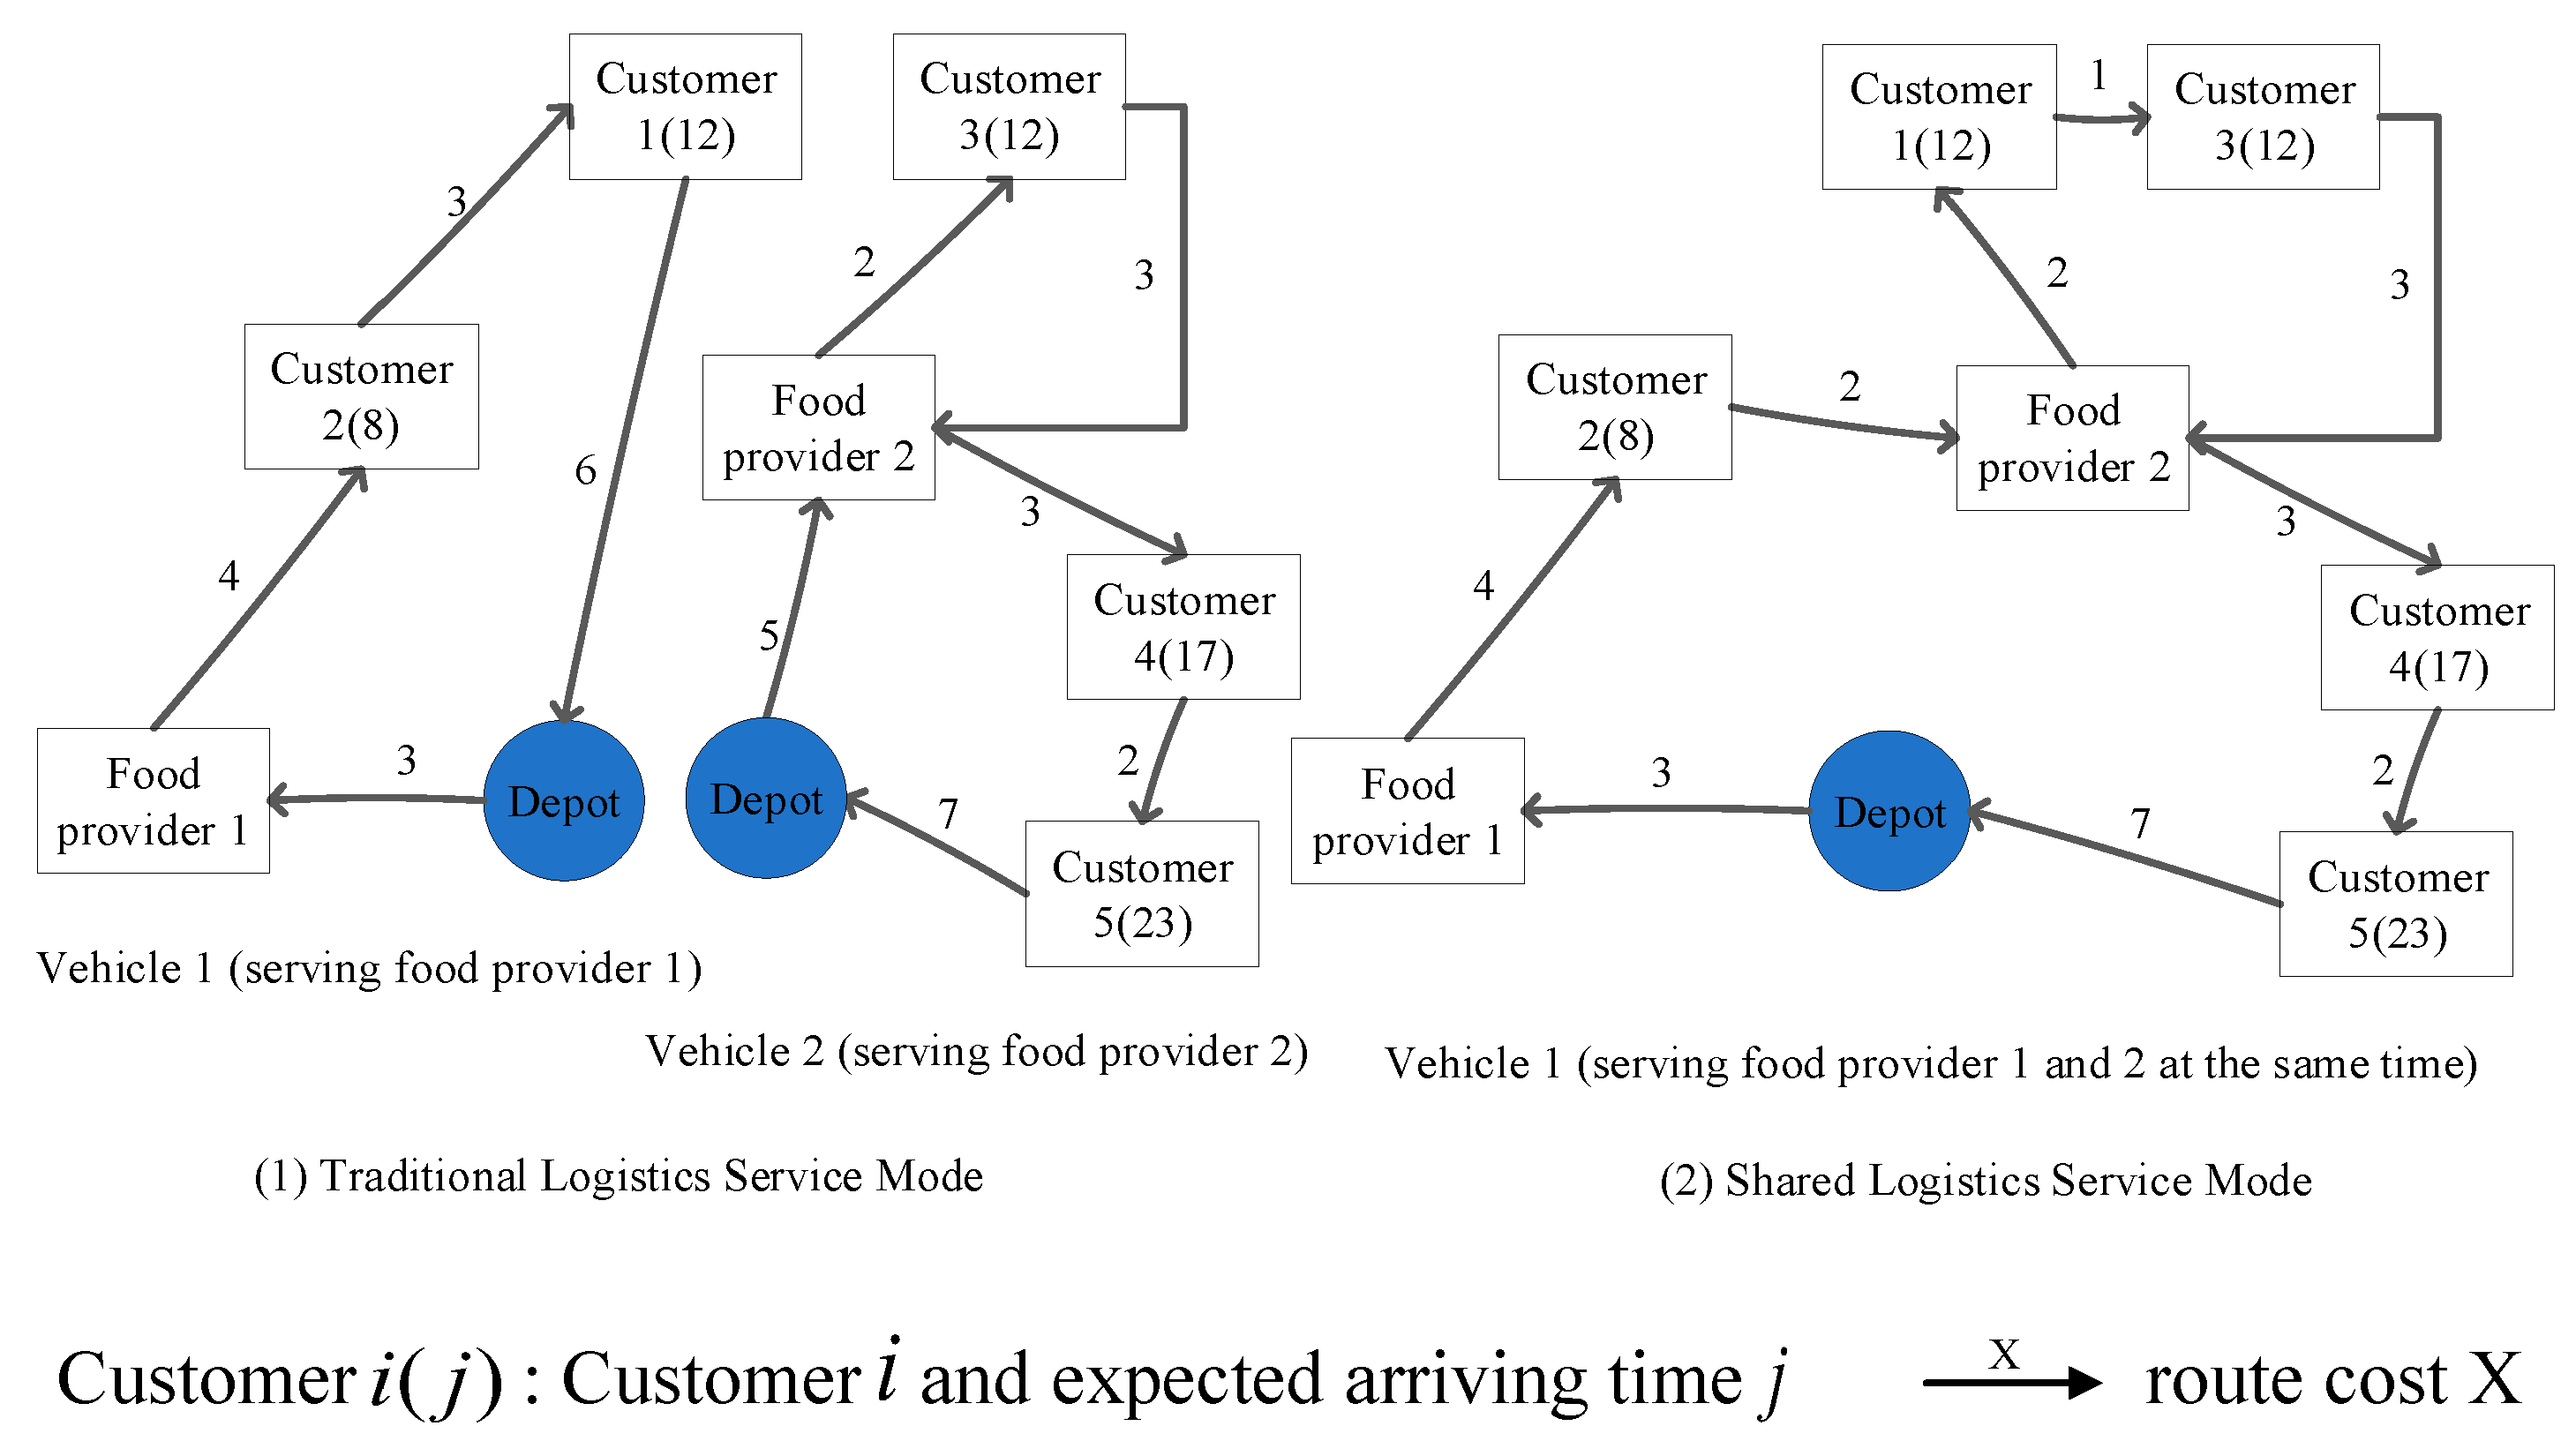
In the TLSM, each vehicle only serves one food provider. In the SLSM, each vehicle can serve multiple food providers. Figure 3 shows the two types of logistics service modes’ specific examples. It can be seen from the figure that the TLSM requires two vehicles to complete the delivery task, and its maximum route cost is 38 CNY. The task can be completed with only one vehicle under the SLSM, and the route cost is 27 CNY, which is significantly lower than the former. Based on the above factors, the question that needs to be answered is: what factors help to reduce the cost of logistics services and follow the best delivery route.
2.3. Symbol Description
Based on the real-world situation, the following assumptions are made:
- (1)
- All vehicles are exactly the same, and overloading delivery is not allowed;
- (2)
- The rider departs from the depot, and the rider does not take orders during the delivery;
- (3)
- Each vehicle keeps driving at a constant speed, regardless of the impact of road conditions;
- (4)
- The vehicle capacity limit of the depot is not considered, and the number of vehicles delivered to each depot is the same.
- (5)
- The coverage of the meal delivery service can satisfy the customers.
2.4. Customer Satisfaction Function
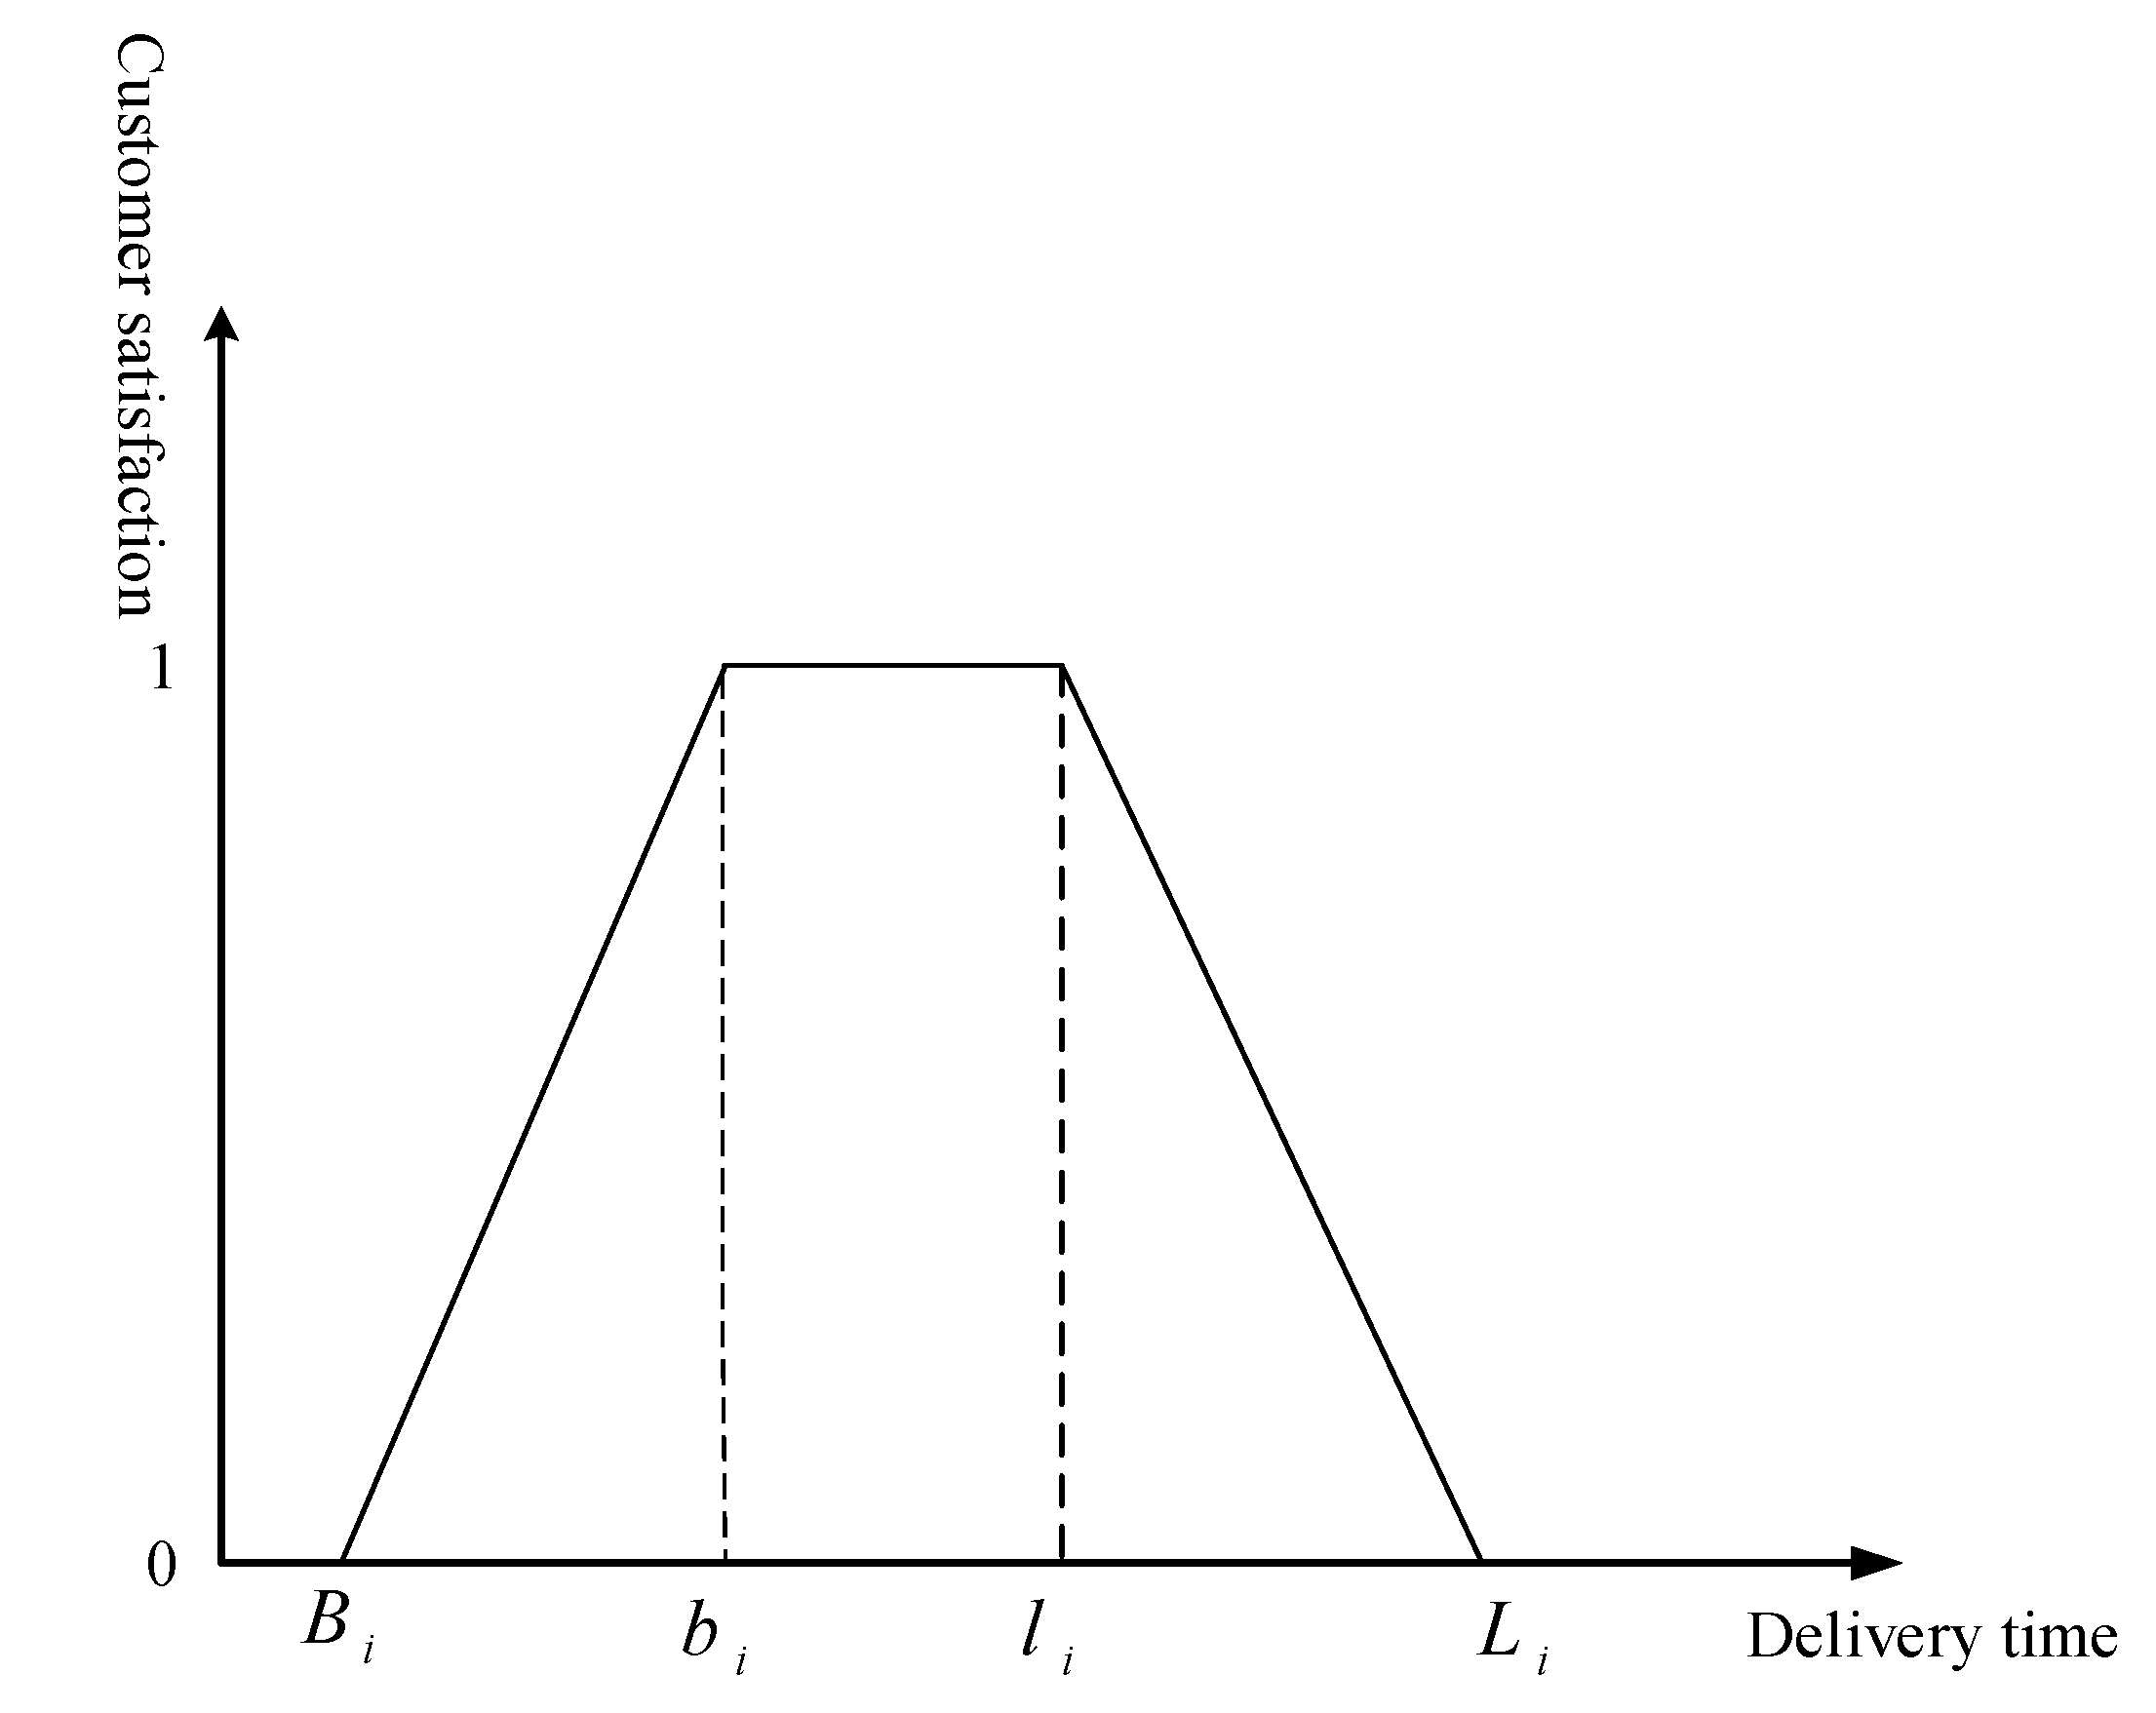
Customer satisfaction mainly depends on the delivery time of the meal. When the delivery time of the meal is earlier or later than the estimated time promised by the platform, customer satisfaction will decrease. There are many functions that describe satisfaction. This article uses a time window to continuously satisfy satisfaction. The degree function [17] to characterize customer satisfaction is shown in Figure 4 below.
The calculation formula of customer satisfaction is as follows:
2.5. The Multi-Objective Optimization Model
Meal delivery is a more complicated process, especially during the meal period. Each food provider will provide multiple services, and the time of each service is different. In order to solve this problem, this paper deals with the multiple services of food providers based on the idea of time index modeling proposed by [26,27], and establishes a mixed-integer programming model to solve this kind of meal delivery problem.
According to the problem description, assumptions, and the definition of model parameters and variables, a multi-depot meal delivery route problem model with the least customer time dissatisfaction and delivery cost is established as follows:
The objective function (2) means that the overall customer dissatisfaction is the lowest; the objective function (3) means that the delivery cost is the lowest; constraint (4) represents that the vehicle starts from a depot and can return to any depot after completing the delivery task; constraint (5) is the food provider’s protection process, which means that the vehicles arrive at node j and leave at node j; constraint (6) guarantees that the time is after ; constraint (7) means that the delivery point of each order can only be passed by one car once; constraint (8) means that the total volume of delivery vehicles does not exceed the maximum cargo capacity of the delivery vehicle; constraints (9) and (10) exclude the possibility of not visiting the supplier before visiting the customer; constraints (4)–(8) apply to two types of logistics services; constraints (9) and (10) are dedicated to shared services.
This article is a multi-objective optimization problem. There are many methods to solve multi-objective optimization problems, including the linear weighting method, the constraint point method, the ideal point method, and the main objective method. In this paper, the linear weighting method is used to transform the multi-objective model into a single-objective model, adding weight coefficients and to the two objectives, respectively, and transforming the objective function (2) and objective function (3) into the following single objective function:
Among them
The weight coefficients and are used to balance customer satisfaction and cost. The third-party logistics providers can choose the weighting coefficient distribution that suits customers according to the different levels of customer satisfaction and cost, and provide a corresponding decision-making basis for different customer needs, which is more in line with the actual situation in the current meal delivery problem.
3. Algorithm Design
The Ant Lion Optimizer (ALO) [28] is a new type of swarm intelligence optimization algorithm proposed after the Artificial Bee Colony Algorithm, the Ant Colony Algorithm, Particle Swarm Optimization and the Genetic Algorithm. The realization process of the Ant Lion Optimizer mainly includes the random walk of the ants, the construction of the ant lion trap by the roulette method, the ants falling into the ant lion trap, the ant sliding to the ant lion, and the ant lion catching the ant and rebuilding the trap.
The multi-objective meal delivery problem considering shared logistics is an NP-hard problem. The current solution is mainly based on intelligent optimization algorithms, and Ant Lion Optimizer is a relatively novel algorithm proposed in 2015, inspired by ant lion larvae foraging behavior in nature has been successfully applied to various engineering fields such as WSN data collection [29], antenna array synthesis [30], photovoltaic parameter optimization [31] and UAV path planning [32]. Some studies have applied it to the optimization problem of the meal delivery route problem [33]. Compared with other optimization algorithms, the ALO algorithm has the advantages of a simple structure, fewer parameters, and easy learning. However, the algorithm still has problems such as poor algorithm convergence and it is easy to fall into local optimality. In order to better apply ALO to the delivery route problem of meal delivery, the adaptive boundary adjustment strategy and dynamic weight coefficients are introduced into the Ant Lion Optimizer, and an Improved Ant Lion Optimizer (IALO) is designed. The introduction of an adaptive boundary adjustment strategy can reflect the difference in the ability of the surrounding ant lion, and balance the exploration and development capabilities of the algorithm; the introduction of dynamic weight coefficients improves the algorithm’s global search ability, so as to obtain the final solution. For the description of the standard Ant Lion Optimizer, refer to [28]. This article focuses on the specific improvement of the Ant Lion Optimizer.
3.1. Adaptive Boundary Adjustment Strategy
Among them, is the boundary shrinkage ratio. In order to balance the global search capability of the algorithm and distinguish the size of the ant lion’s ability to capture ants, this article uses an adaptive boundary adjustment strategy to modify it, as shown below:
where m is the index of the fitness, which corresponds to the ant lions and the finesses are sorted from small to large; is the number of ant lions, and is the changing rate. In Equation (14), if , , the ant lion has the worst fitness, the boundary constriction ratio will increases and the boundary for ants decreases. For the ant lion with the worst fitness, the range of the trap should be reduced and local exploitation ability should be improved. If and , the ant lion has the best fitness, the boundary constriction ratio will decrease, and the boundary for ants increases. For the ant lion with the best fitness, the range of the trap should be expanded and global exploration ability should be improved.
3.2. The Location Update Dynamic Weight Coefficient
By sorting the fitness value of ant lion, the ant lion with the highest fitness value is selected as the elite ant lion, so the elite ant lion has a high probability to be selected as the roulette wheel to select the ant lion, resulting in the ants only wandering around the elite ant lion, as shown below:
To solve this problem, the dynamic weight coefficient is introduced into the ant position updating formula, which is improved as follows
In the formula, at the early stage of iteration, the roulette wheel chooses the weight coefficient of the ant lion to be large, so that ants can explore more areas. In the later stage, the weight coefficient of the elite ant lion increases gradually, which makes the ants develop in the best area, so as to improve the global search ability of the algorithm and jump out of the local best.
3.3. Algorithm Process
The implementation steps of IALO algorithm are as follows:
Step 1: Set IALO algorithm parameter values, including the maximum number of iterations , the number of ants and ant lions, the fitness function dimension , and the upper and lower limits of variables and .
Step 2: Initialize the positions of ants and ant lions randomly, calculate their respective fitness values and save the best values, and at the same time select the ant lion with the largest fitness value as the elite ant lion.
Step 3: Use the roulette method to optimize the selection of Ant lion, and update the values of and .
Step 4: Update the ant’s walking boundary according to the adaptive boundary adjustment strategy.
Step 5: The ants randomly walk around the ant lion.
Step 6: The ants keep getting close to the ant lion, and then the dynamic weight coefficient is introduced to update the position of the ant.
Step 7: After the ants are captured, compare with the elite ant lion at the current position, readjust the position of the elite ant lion, and update the best value. If the position of the ant lion exceeds the farthest boundary or , it will be processed as the farthest boundary.
Step 8: Determine whether the algorithm’s termination criterion is reached? If yes, go to step 9, otherwise go to step 3.
Step 9: The algorithm terminates and obtains the best ant lion position.
4. Case Analysis
This section uses the designed IALO algorithm to carry out corresponding numerical experiment analysis on the optimization problem of foreign delivery distribution. First, set up relevant experimental cases. Secondly, the corresponding managerial analysis of the two logistics services proposed in this paper is carried out, and the best route diagrams of the two logistics services are obtained. Then, for the multi-objective model in this article, related experiments were carried out on how the model parameters (i.e., and ) were combined. Finally, considering the influence of different algorithms on the experimental results, and comparing the performance of the experimental cases with the ALO and GOA algorithms, it is found that the effect of the IALO algorithm is better than the other two algorithms during the experiment, which proves the effectiveness of the IALO algorithm.
4.1. Case Description
This article considers that a logistics provider in a certain area of a city undertakes the task of meal delivery within the time period of 11:00–14:00 on a certain day. This logistics provider needs to balance the two related factors of logistics cost and customer satisfaction. At the same time, the logistics provider provides two kinds of logistics services, and compare the specific route obtained under these two kinds of logistics services.
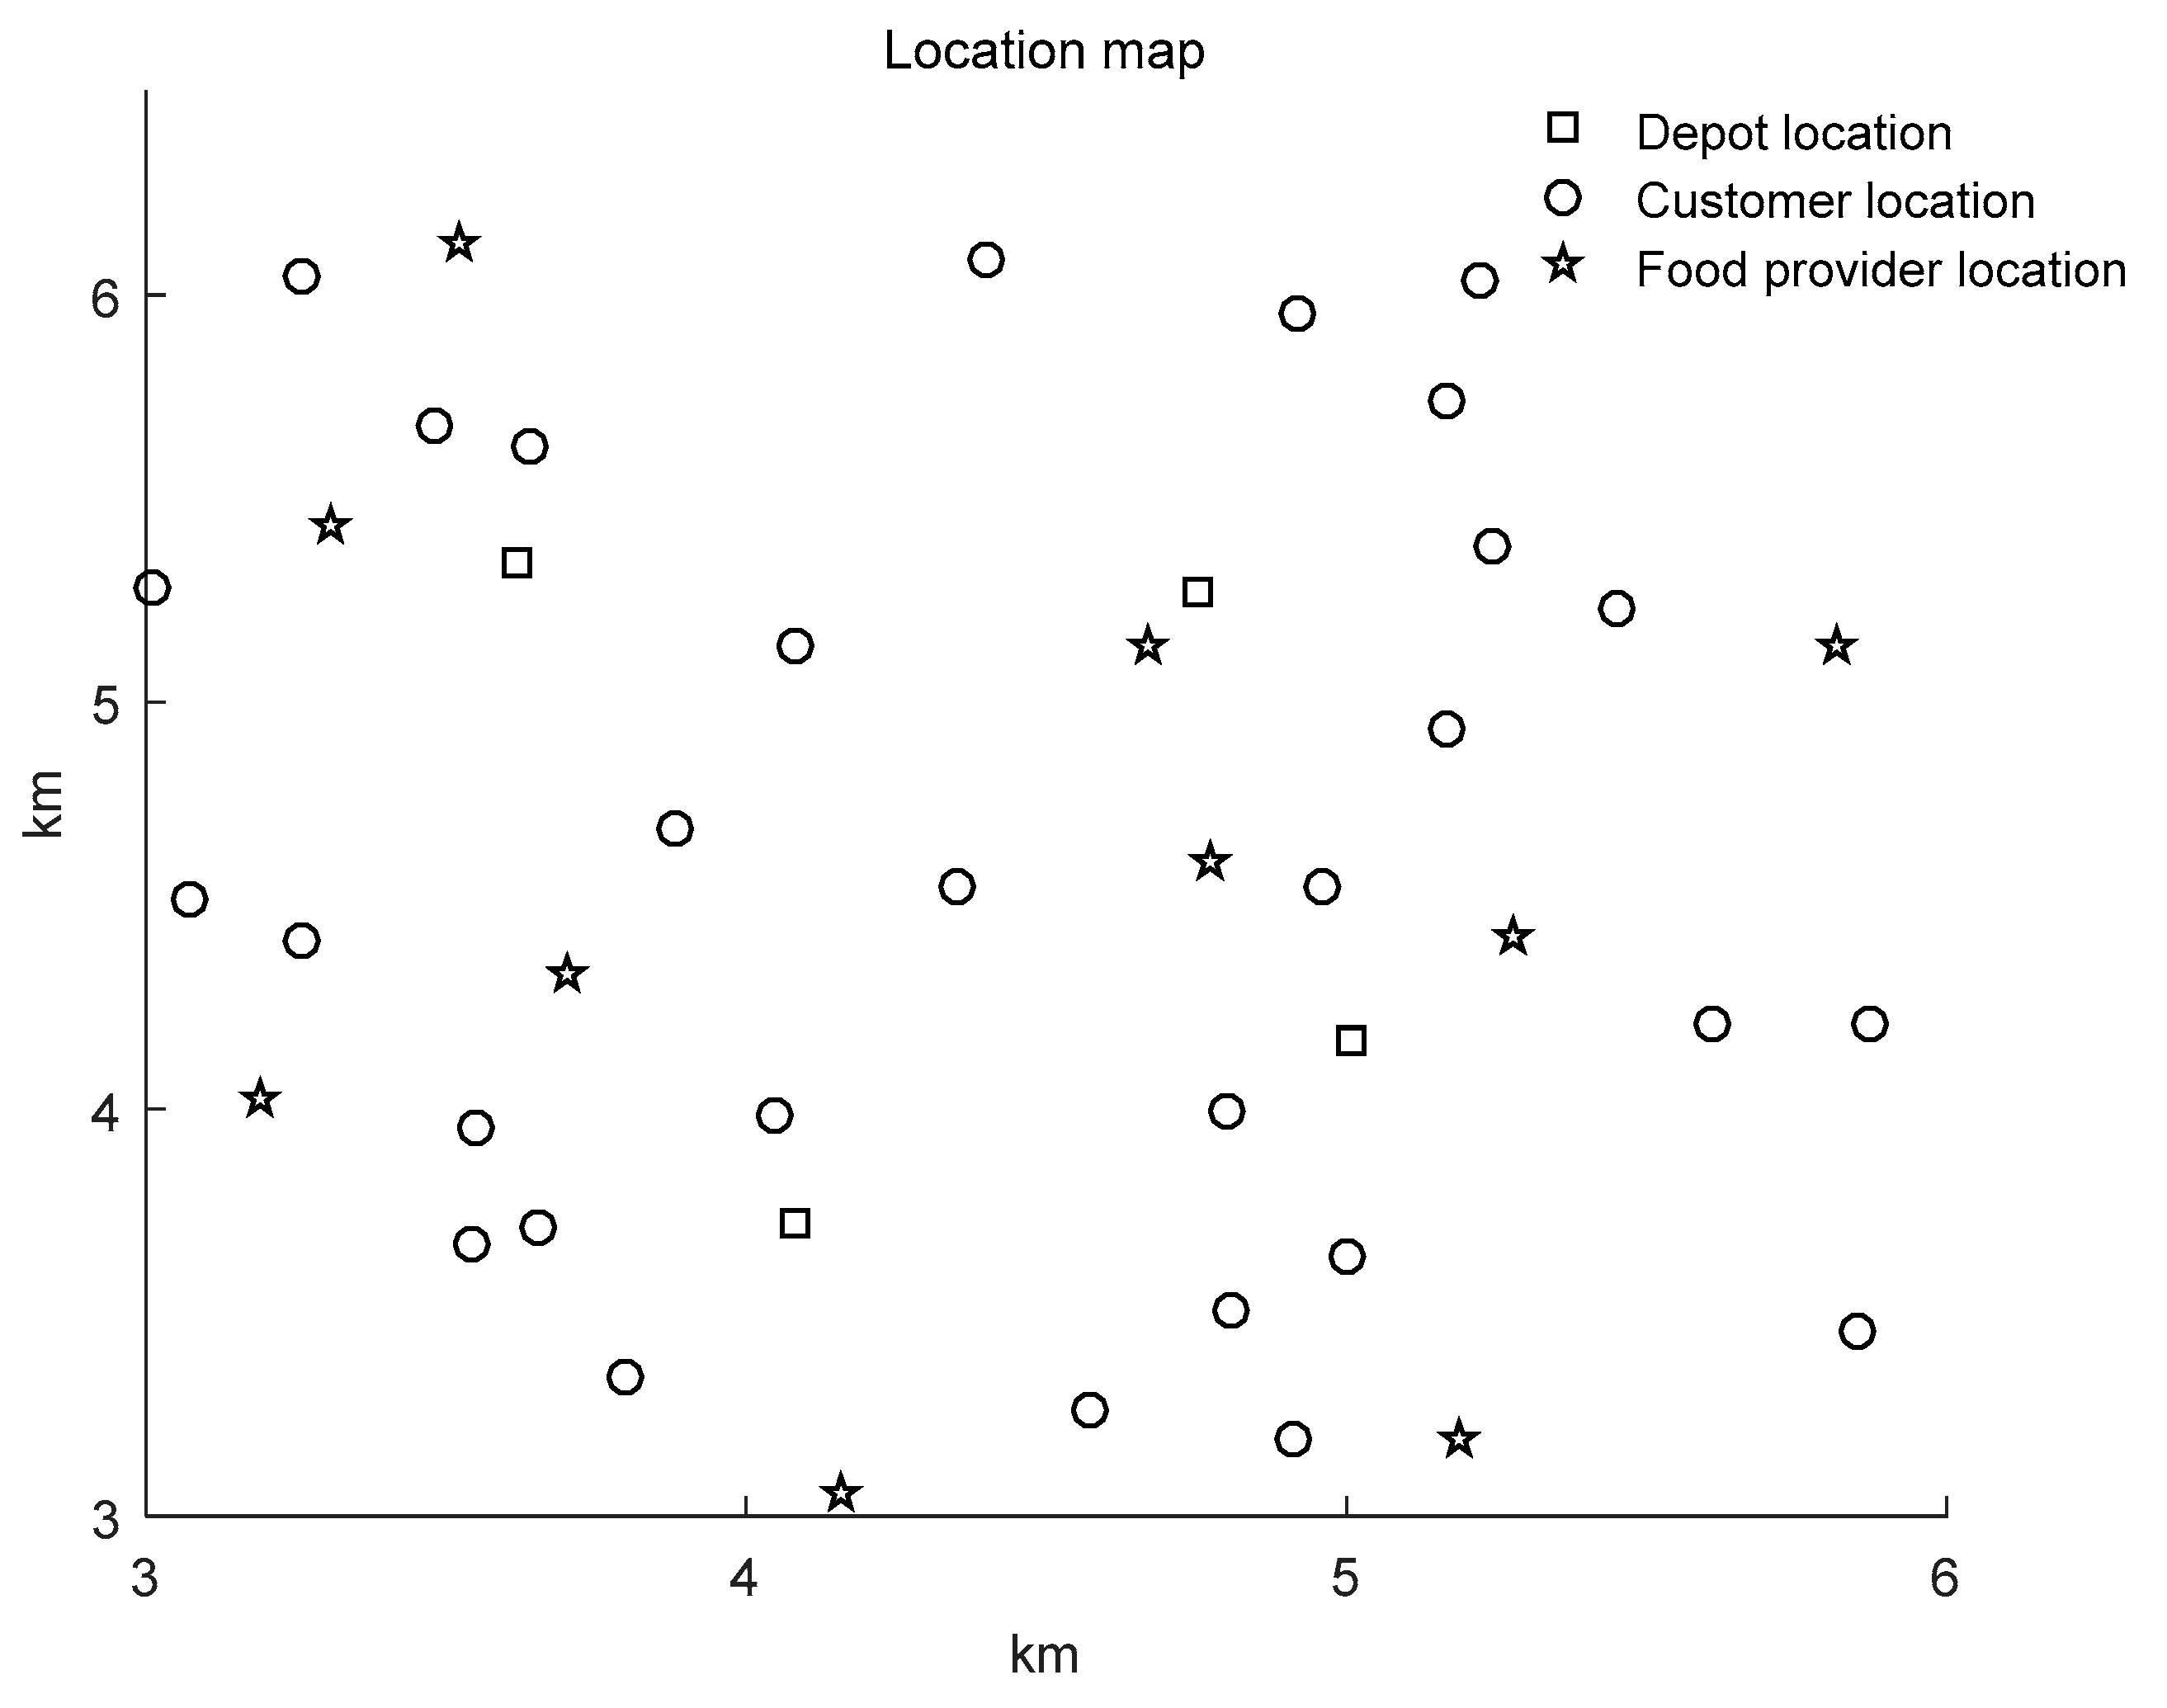
In this example, the logistics provider has 4 depots serving 30 customers and 10 food providers, each depot has 5 vehicles, the maximum loading capacity of each vehicle is 10, and the average speed of the delivery vehicles on the road is 15 km/h, according to which the time spent by the vehicles between each point can be obtained. After placing an order on the ordering platform, the customer is expected to wait for approximately 30–60 min. In order to facilitate picking up the food here for 40 min, that is, the rider needs to deliver the food to the customer within 40 min after placing an order. The average meal preparation time of the supplier is 5 min, and the average service time of each is 3 min. In addition, coordinate information of depots, food providers and customers, as well as service time window, demand and other related information are given in this paper. The specific information is shown in Table 4 and Table 5. The corresponding traveling time is obtained according to coordinate information and average speed between points. The location distribution diagram of depots, food providers and customers are shown in Figure 5. Other relevant parameter settings are shown in Table 6.
4.2. Logistics Service Mode Analysis
This article proposes two types of logistics services. In order to better compare the differences between the two logistics services, under the premise of the same algorithm and the same weight coefficient, this section will explore the two logistics services from two aspects: managerial analysis and result analysis.
4.2.1. Managerial Analysis of Logistics Service Modes
In this section, the corresponding management analysis is carried out for the two logistics services, and the specific analysis is shown in Table 7. In the table, column 1 is the service type, columns 2–5 show the overall results, including vehicle number, route cost, total cost, and satisfaction, while column 6 shows the standardized results, i.e., the percentage of the shared service goal value against the traditional service goal value.
Table 7 shows that the frequency of use of vehicles in traditional service and shared service is 30 and 8, respectively. The latter reduces the utilization rate of vehicles by nearly 75% compared with the former, which indicates that the vehicles in shared service can undertake more meal and reduce the number of vehicles returning to the depot. Secondly, it can be found from the table that the route cost and total cost of shared service are smaller than those of traditional service, respectively, and the percentage of the target value of shared service in traditional service is 21.76%, which reduces the total cost by more than 75%. Finally, the satisfaction of shared service is also higher than that of traditional service, which indicates that the fixed cost and route cost saved by shared service are much higher than the cost needed to consider customer satisfaction.
The above description can illustrate that shared services can save time and distance, increase vehicle usage efficiency, and reduce logistics costs.
4.2.2. Results Analysis of Logistics Service
In this section, the specific routes obtained by the two logistics services are compared and analyzed. The specific best delivery routes are shown in Table 8 and Table 9. In these two tables, the route number represents the number of times the vehicle has left the depot, that is, the number of times the vehicle has been used, and the specific route represents a related process in which the rider starts from the depot and completes the delivery of meals and returns to the depot. It can be seen from the table that under the same number of delivery tasks, traditional services need to be dispatched 30 times to complete, while shared services only need seven times. This not only saves the use of vehicles, but also reduces a lot of useless distance.
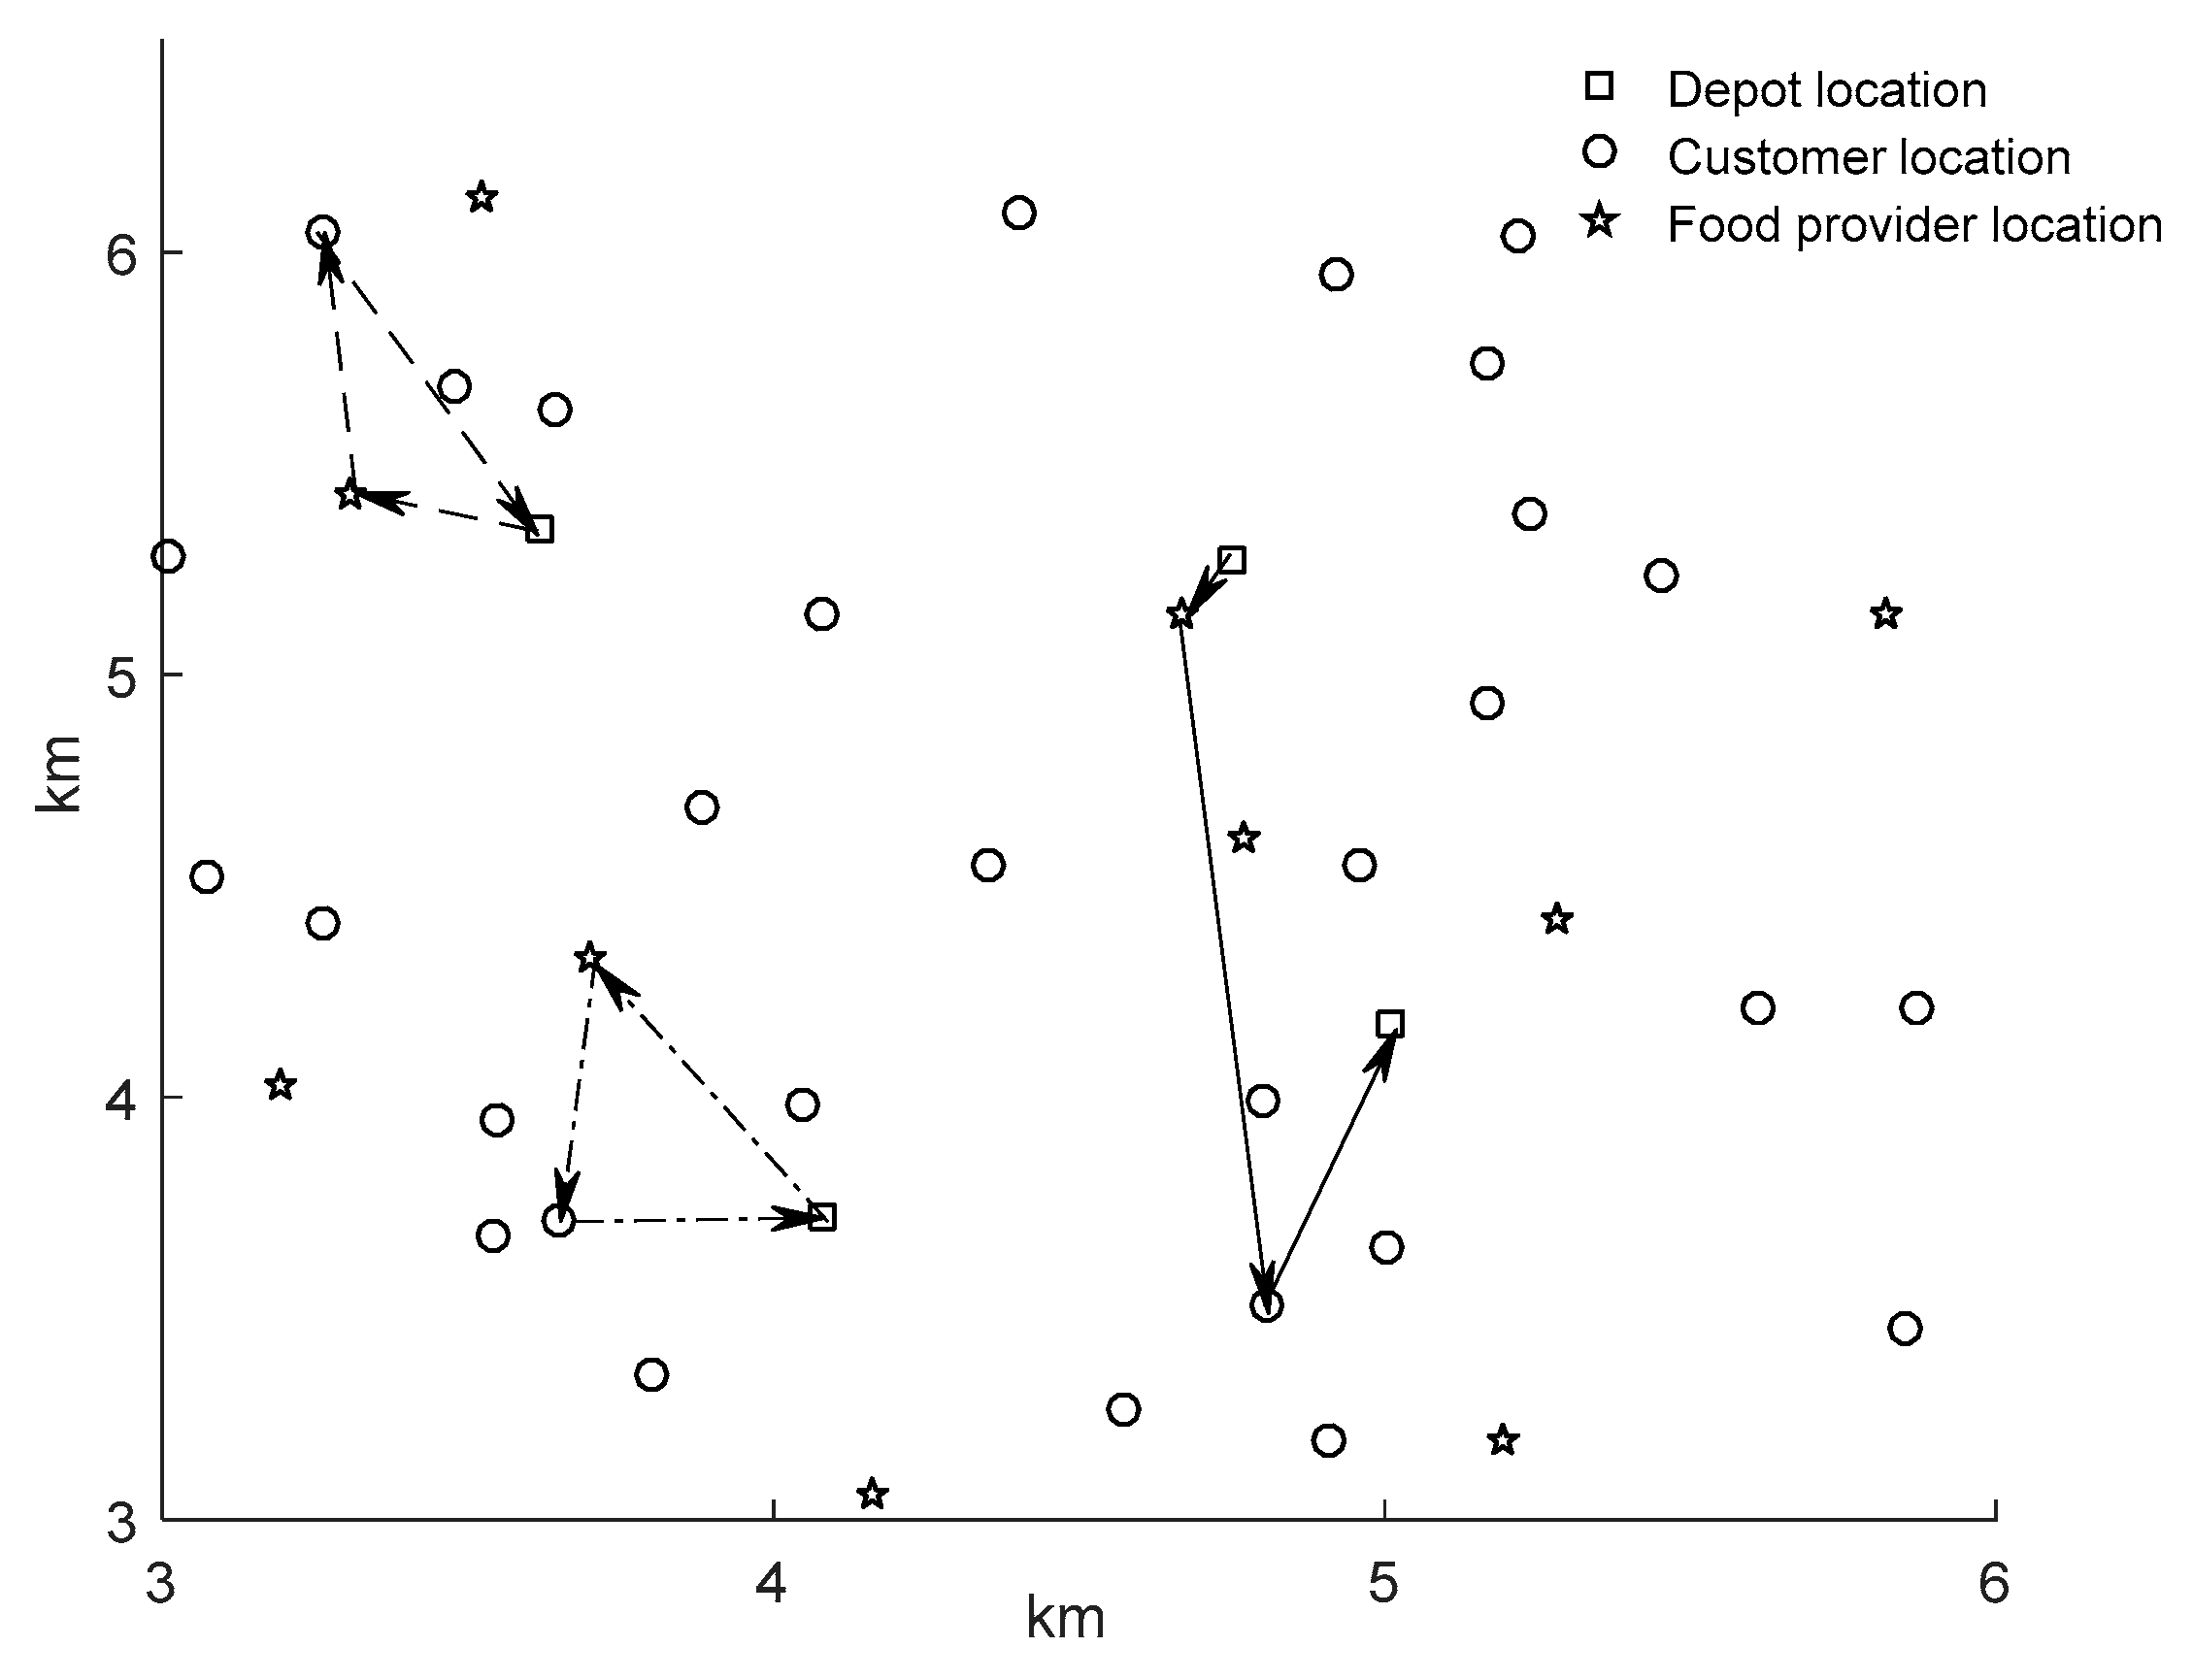
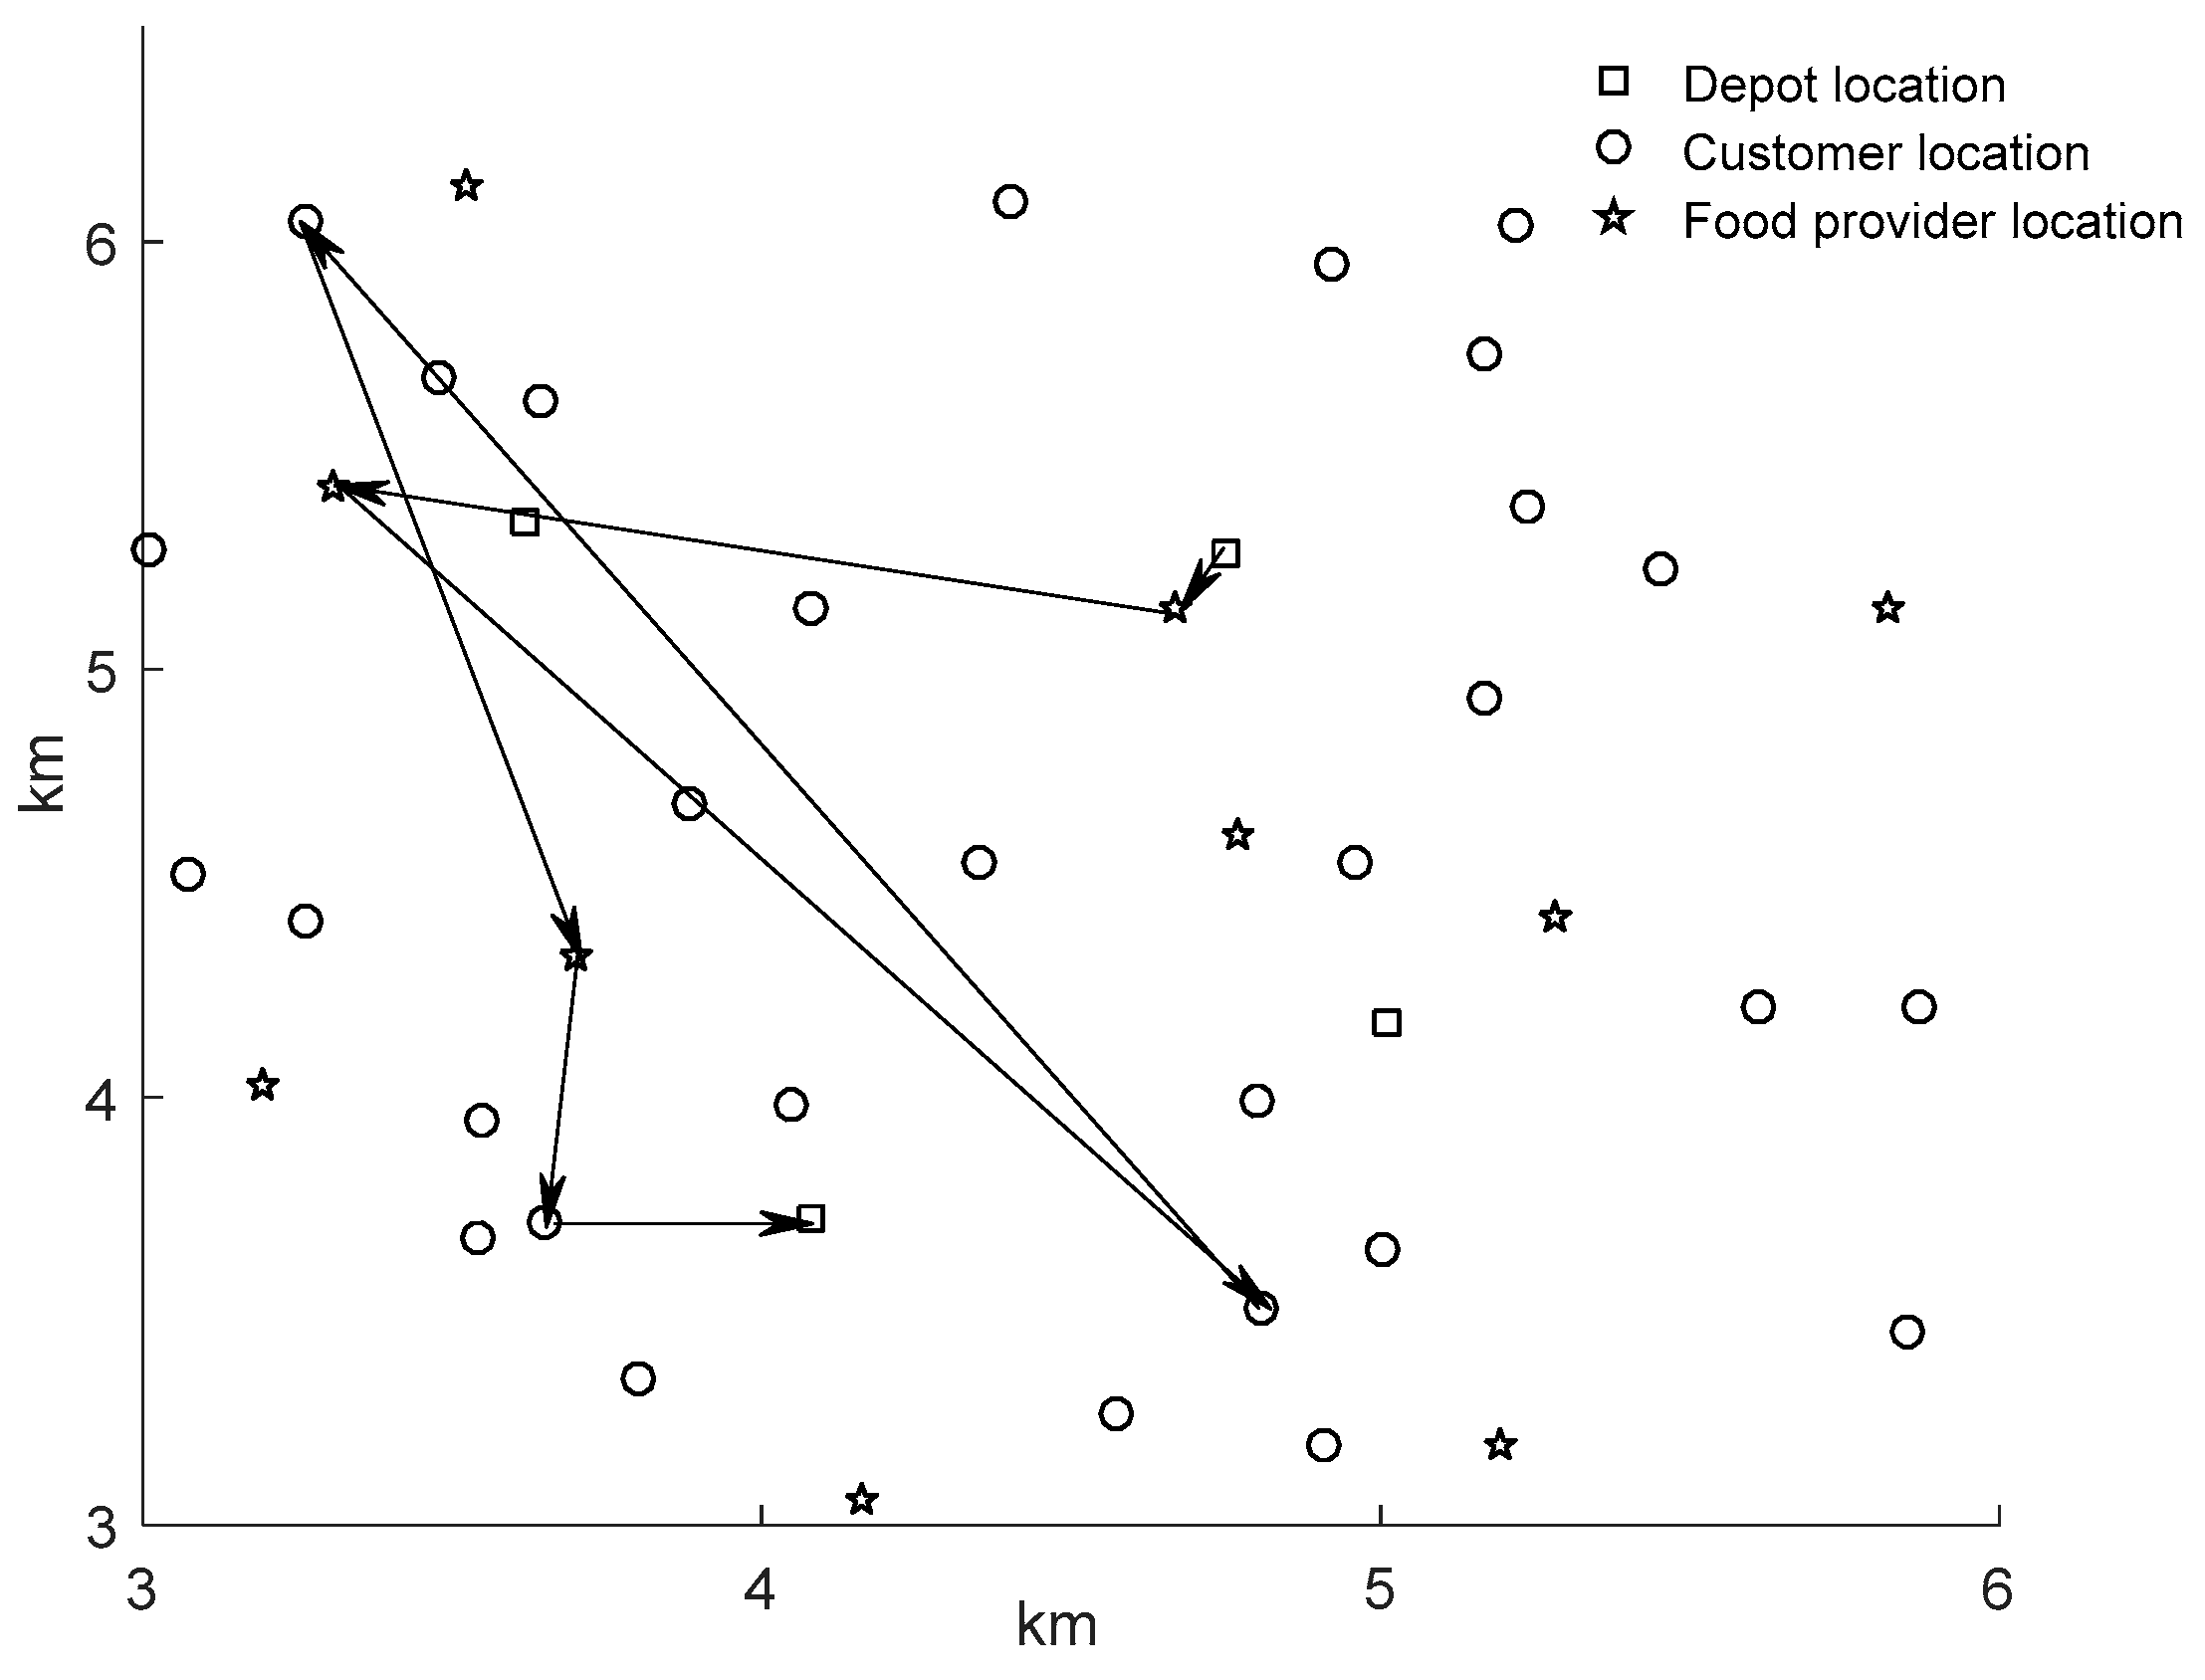
In order to better demonstrate the sharing of vehicles between different food providers and the different running routes of vehicles under the two kinds of logistics services, this paper selects some customers and their corresponding food providers according to the obtained route table and draws a route diagram under the two kinds of logistics services, as shown in Figure 6 and Figure 7. As can be seen from the figure, for the same number of customers, the traditional service is one-to-one to complete the delivery task, and there is no connection between different customers for delivery, so many useless routes are added and the waste of vehicle resources is caused. In the sharing service, delivery between different customers is cross-completed, which not only increases the use efficiency of vehicles, but also reduces some irrelevant consumption on the route, so as to achieve the purpose of rational use of resources and green vehicles.
4.3. Analysis of the Influence of Weight on Target Value
There are two objective functions in the mathematical model established in this paper. Respectively to minimize overall dissatisfaction and cost, the corresponding weighting coefficients and are, respectively [0, 1], and their relationship is also determined, that is, . Taking into account that the third-party logistics providers pay different attention to satisfaction and cost, there are 11 different combinations of R and K values. In order to explore the impact of these 11 different weight combinations on the target value, under the same algorithm and the same example, the relevant function values of the different weight combinations under the two logistics services are obtained, and the corresponding tables are listed, as shown in Table 10.
According to the content in the table, it can be roughly analyzed from three aspects. First, the analysis on the total target. From the comparative analysis of the two logistics services, it can be seen that the total target of shared services has always been smaller than that of traditional services. On the other hand, no matter what kind of logistics service, as the customer dissatisfaction coefficient increases, the total target function value always shows a downward trend; secondly, the analysis of the total cost in the delivery process. It can be seen from the table that the cost of shared services is lower than that of traditional services. The specific reasons have been analyzed before, so I will not repeat them here. In addition, with the increase in the weight coefficient, the total cost of traditional services does not change much. In comparison, the total cost of shared services has changed slightly. This is because the distribution of vehicles and route planning in the process of facing the different needs of customers will also change accordingly, but in general, shared services are better than traditional services; finally, the analysis of satisfaction. No matter what kind of logistics service, the satisfaction degree shows a downward trend as the weight coefficient increases.
Focus on the analysis of the above two combinations. The first combination method is to consider only the cost in the delivery process. This situation is studied in Chapter 3. Of course, it can be seen that shared services are better than traditional services; the eleventh combination method, which only considers customer satisfaction, can also show that shared services are better than traditional services. This result is caused by taking a positive number. In fact, satisfaction is greater than 1, and it is negative when converted into dissatisfaction, which does not affect the final result analysis.
Based on the above results, a conclusion can be drawn. For third-party logistics providers, if they want to obtain higher returns, they should reduce the cost of input, but they should not blindly forget the requirements of customers in order to obtain higher returns. The final result is that the cost may not be much reduced, and the trust of customers is indeed lost, and the loss is outweighed by the gain. This shows that the third-party logistics providers can consider the 50/50 method when choosing the combination of weight coefficients, which can not only make profits but also obtain more customers. When choosing the type of logistics service, we can fully consider the type of shared service, which can meet customer needs and reduce costs.
4.4. Algorithm Analysis
Algorithm performance analysis is a commonly used method in algorithm analysis. Therefore, this section will analyze the algorithm from the aspects of algorithm convergence and box plot. The following is the specific analysis process.
In order to explore the effectiveness of different algorithms for solving mathematical models, for the experimental cases described in this article, called case I, three different algorithms, GOA, ALO, and IALO, were used to randomly solve the model 50 times, and from the two traditional services and shared services. The algorithms are analyzed and compared to verify the effectiveness of the proposed algorithms. The specific results are shown in Table 11. As can be seen from the table, although in traditional services, the best fitness of ALO algorithm is the same as that of the ALO algorithm, and the variance is the same as that of the ALO algorithm, from other aspects, the worst fitness, average fitness and standard deviation obtained by ALO algorithm are all better than those obtained by the GOA and ALO algorithms, regardless of the type of logistics service. This shows that the IALO algorithm is generally superior to the other two algorithms.
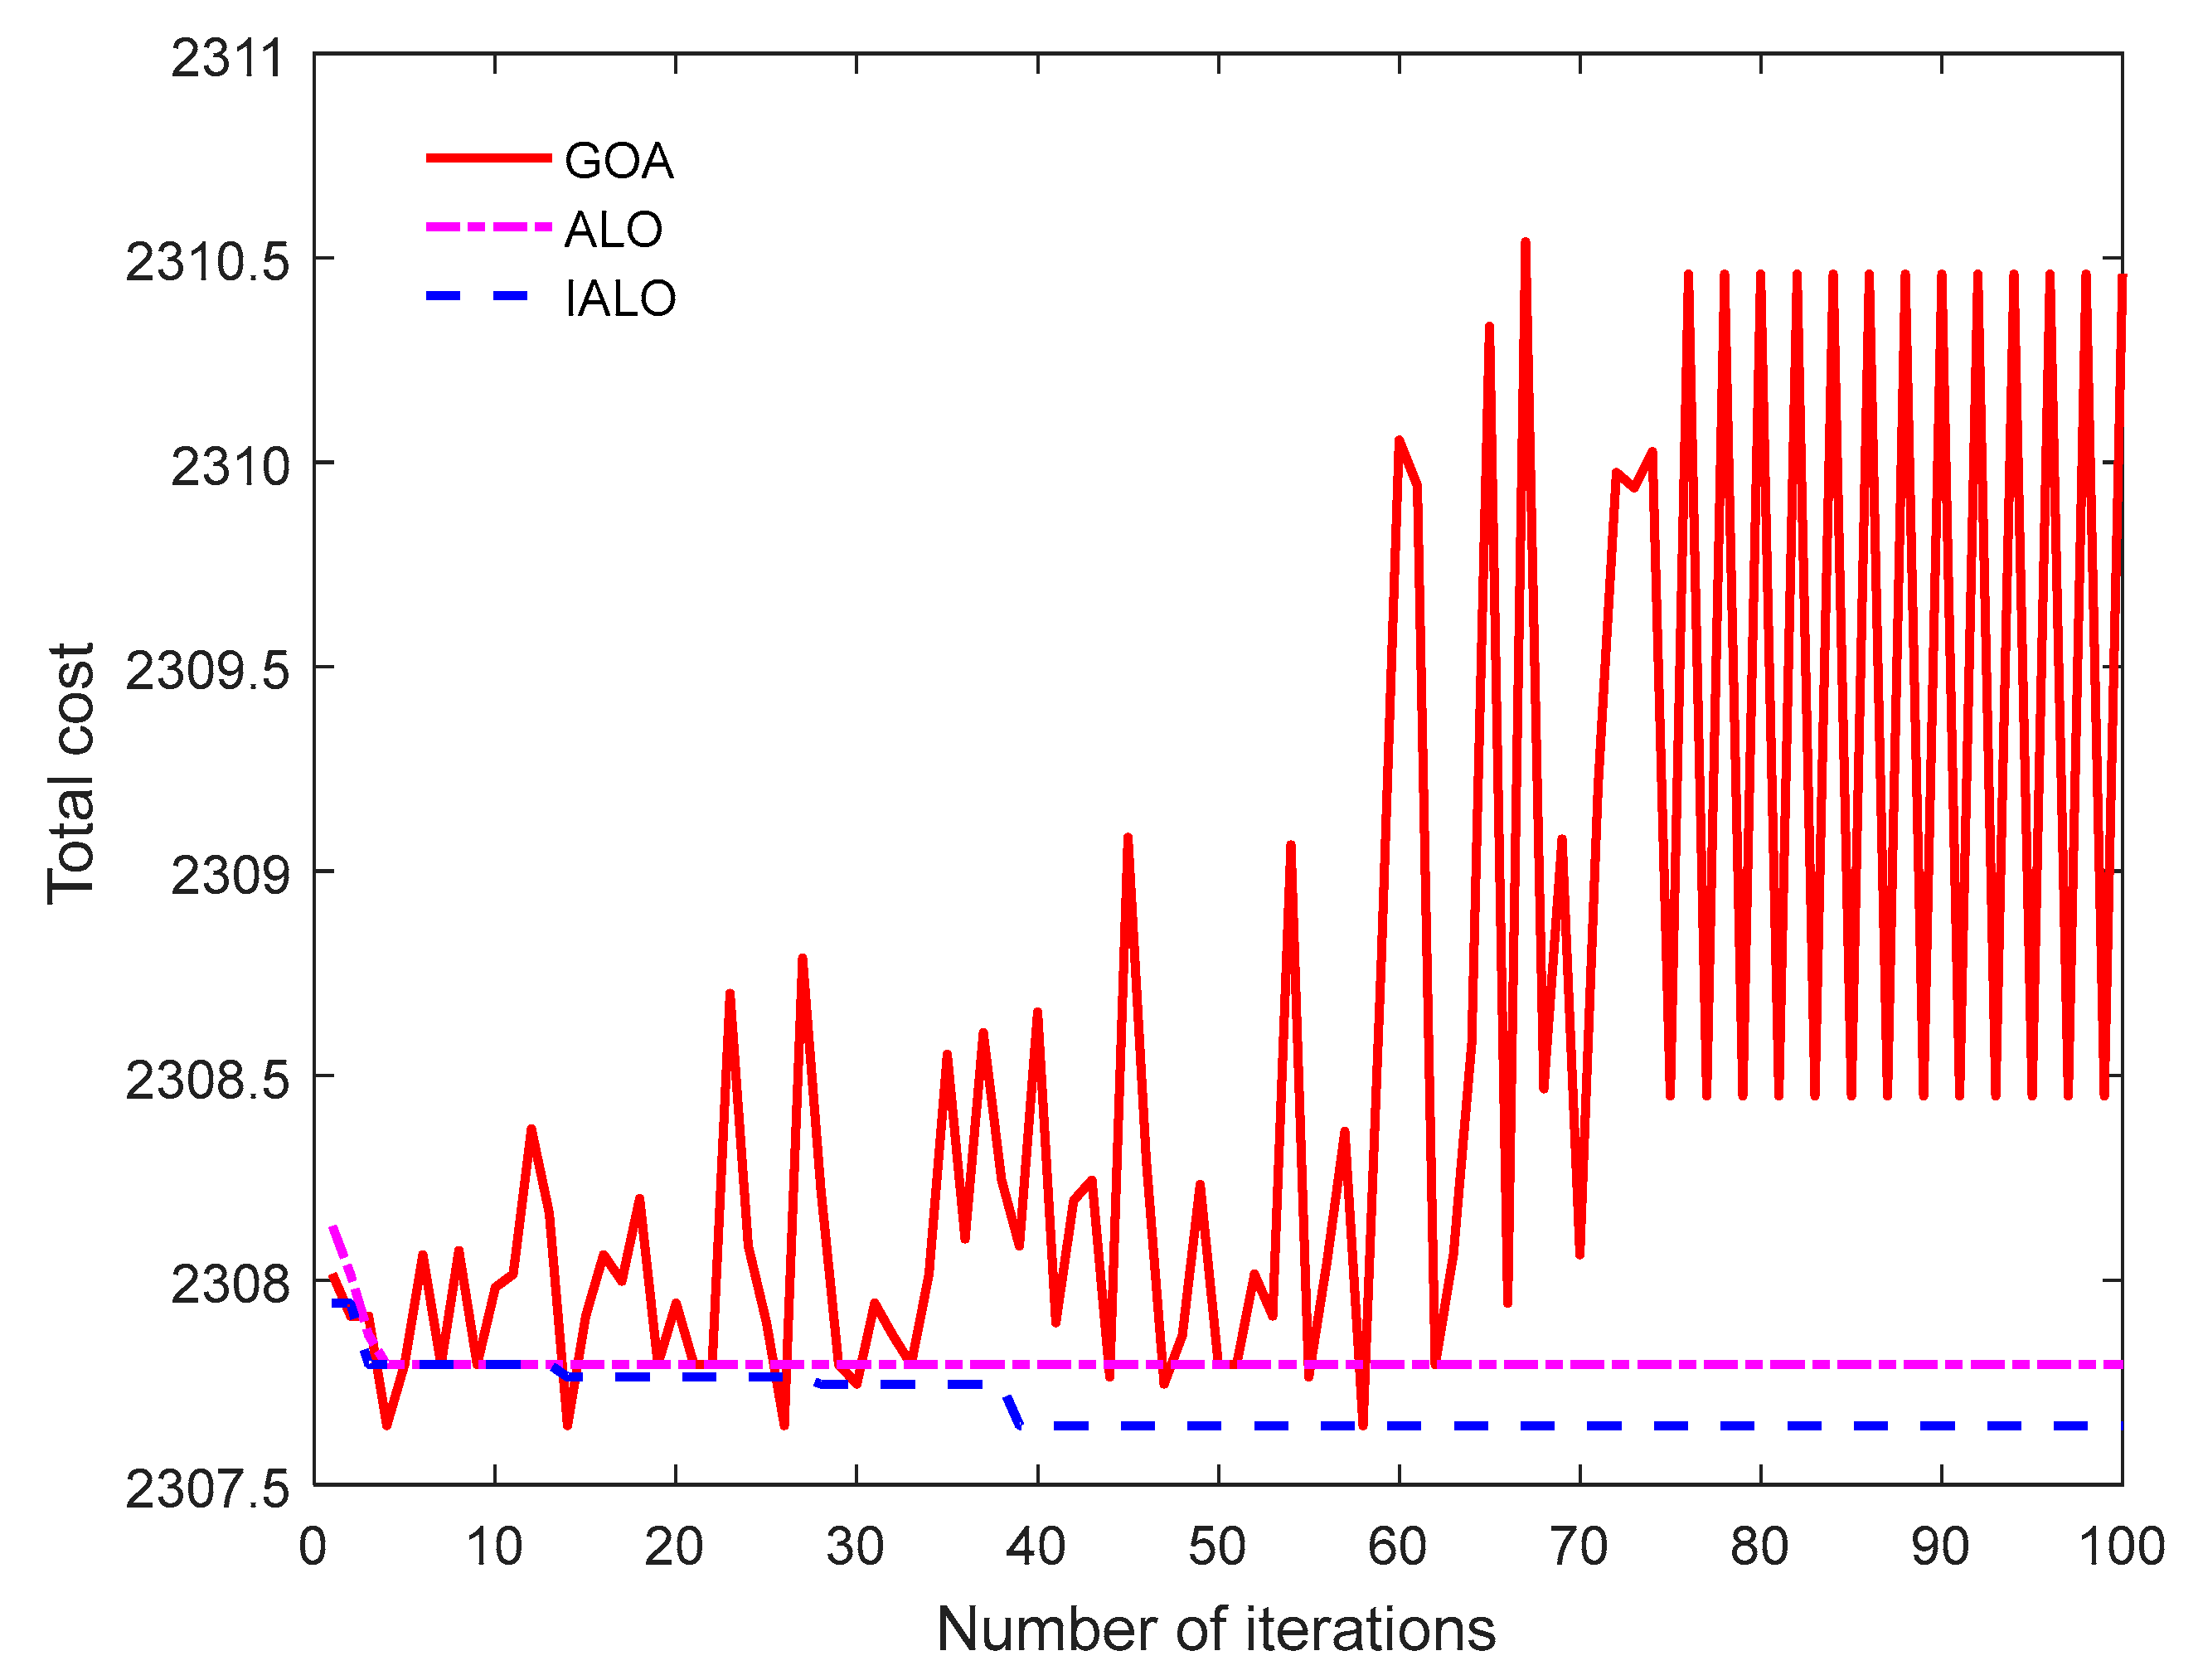
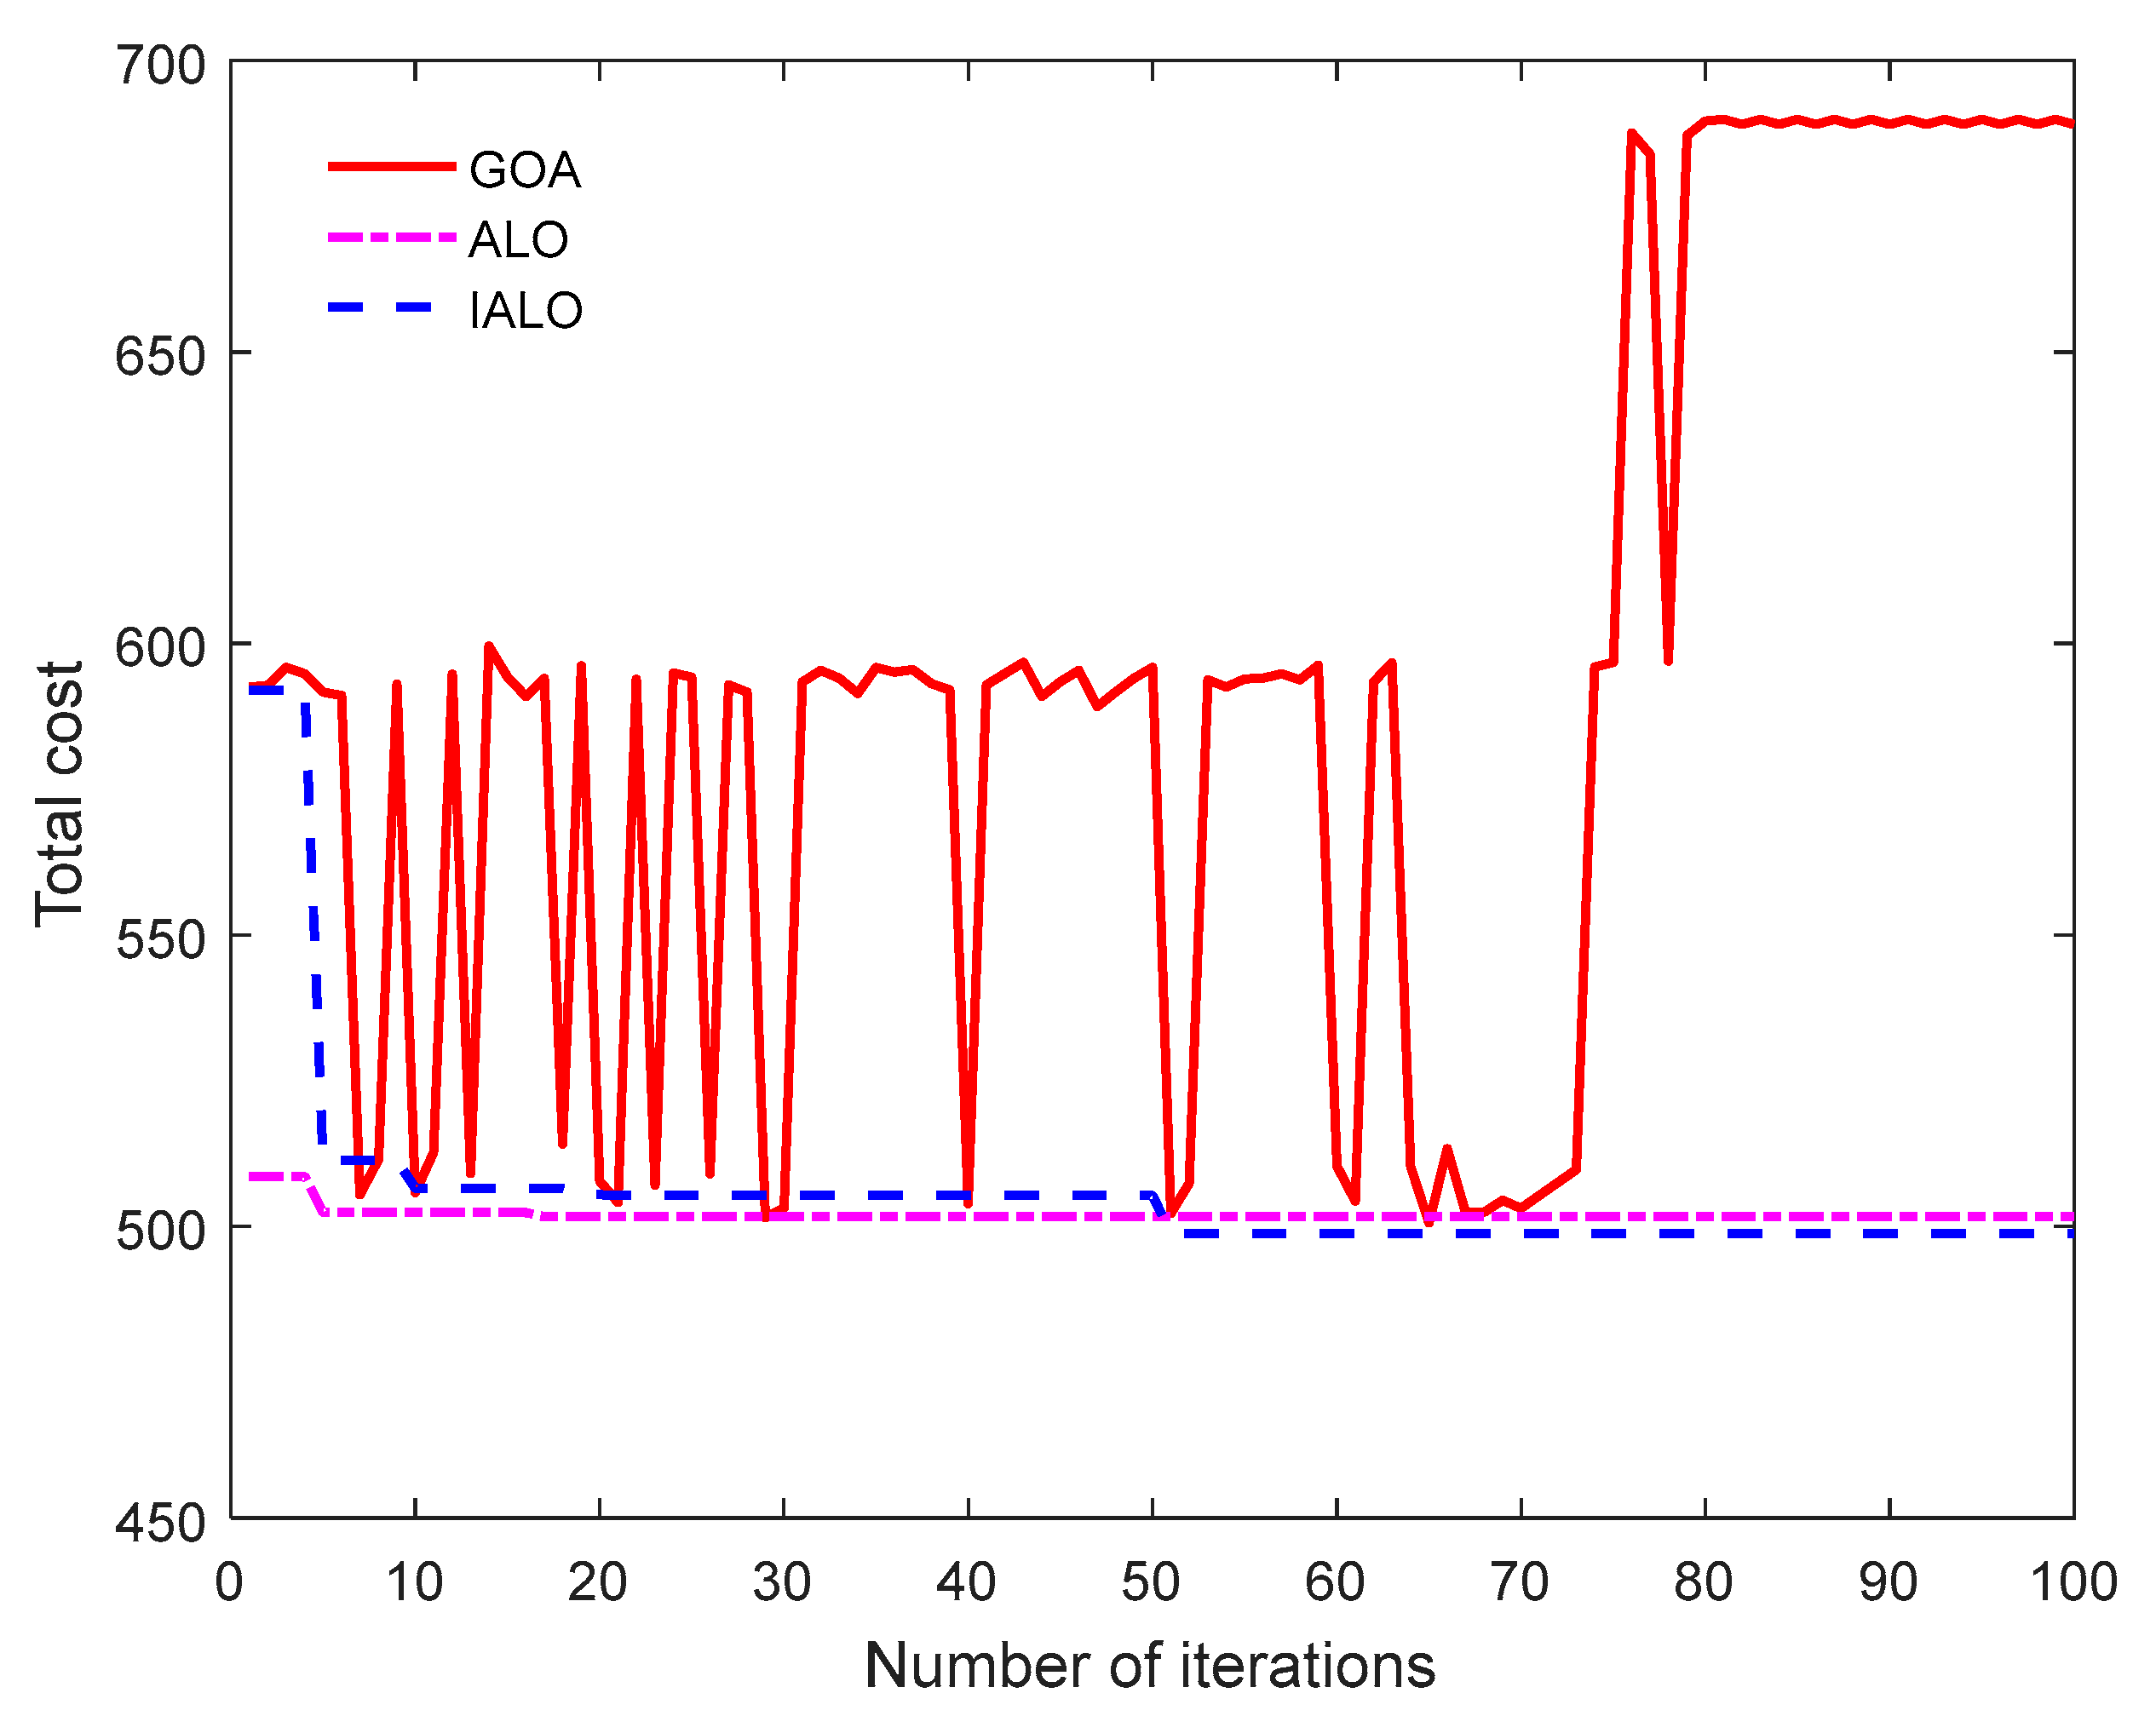
It is convenient to analyze the iterative effects of different algorithms. This paper draws the relevant convergence diagrams of four different algorithms to solve the problem under two logistics services, as shown in Figure 8 and Figure 9. Can be seen from the diagram, either logistics service, GOA algorithm are not stable, and the improved IALO algorithm not only stable and can obtain more best objective function value, suggesting that IALO algorithm not only has good global search ability, and can better avoid falling into local optimum easily, even if fall into local optimum, also can rapid escape.
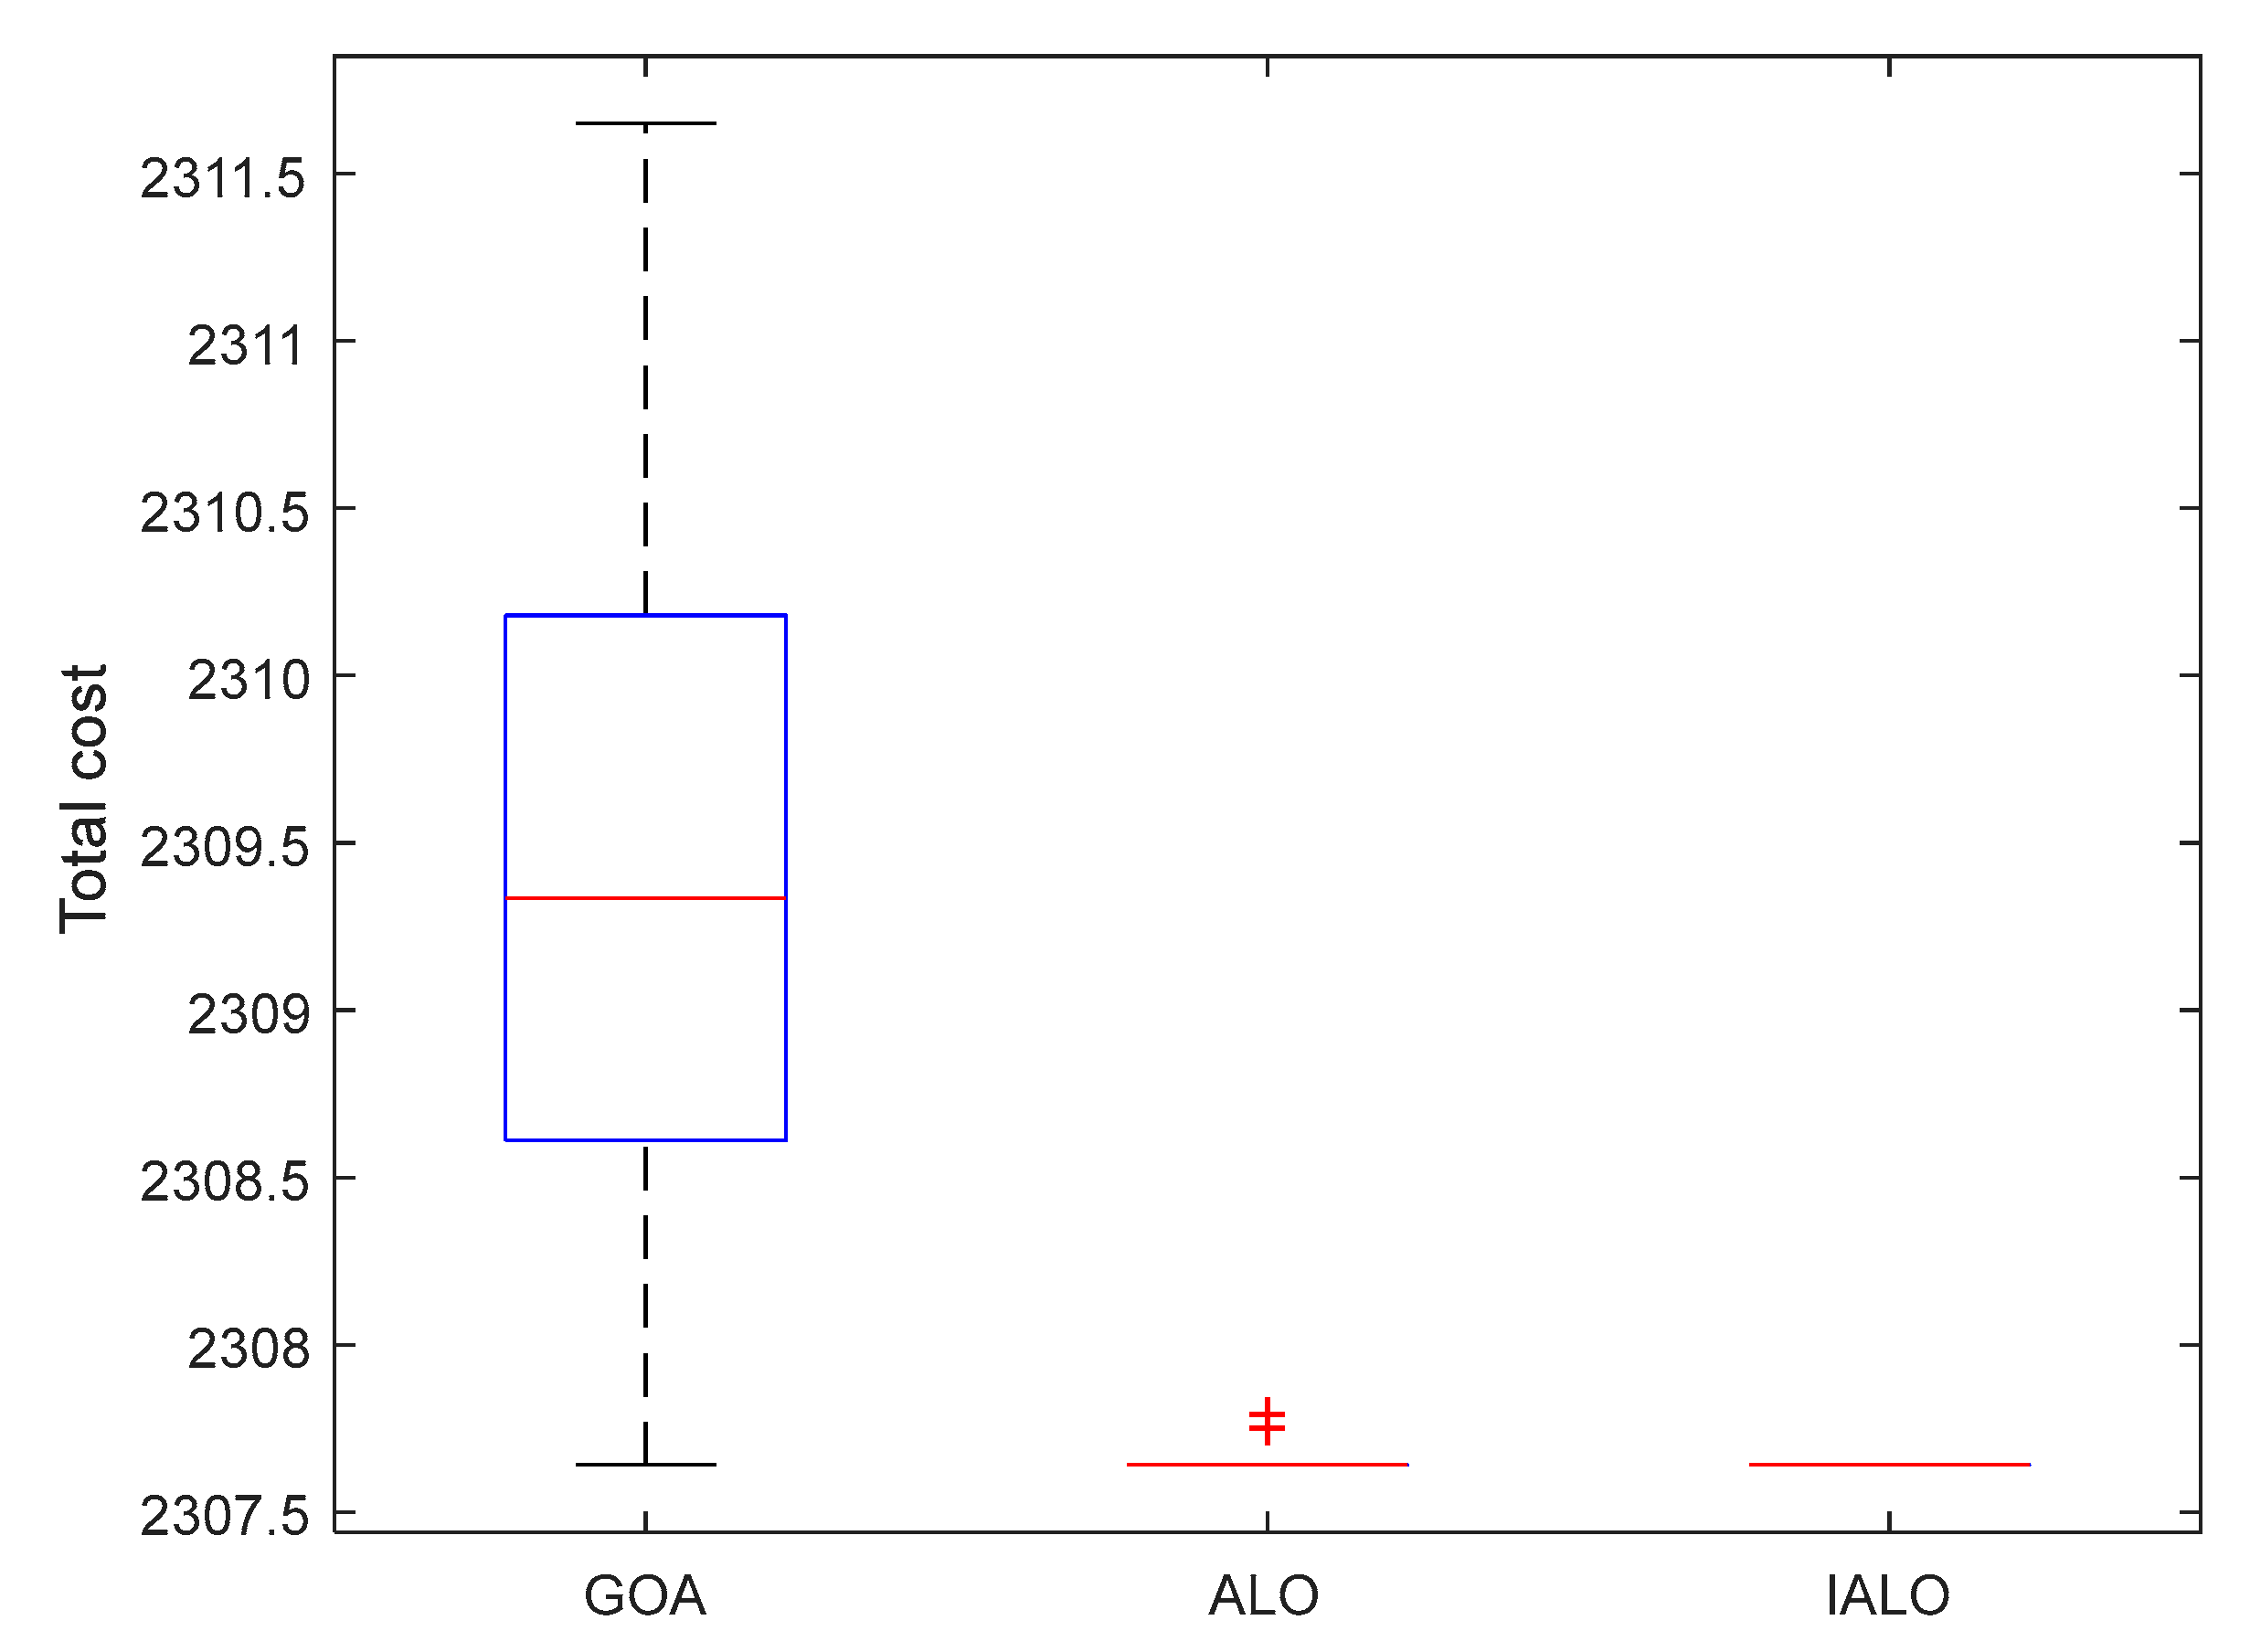
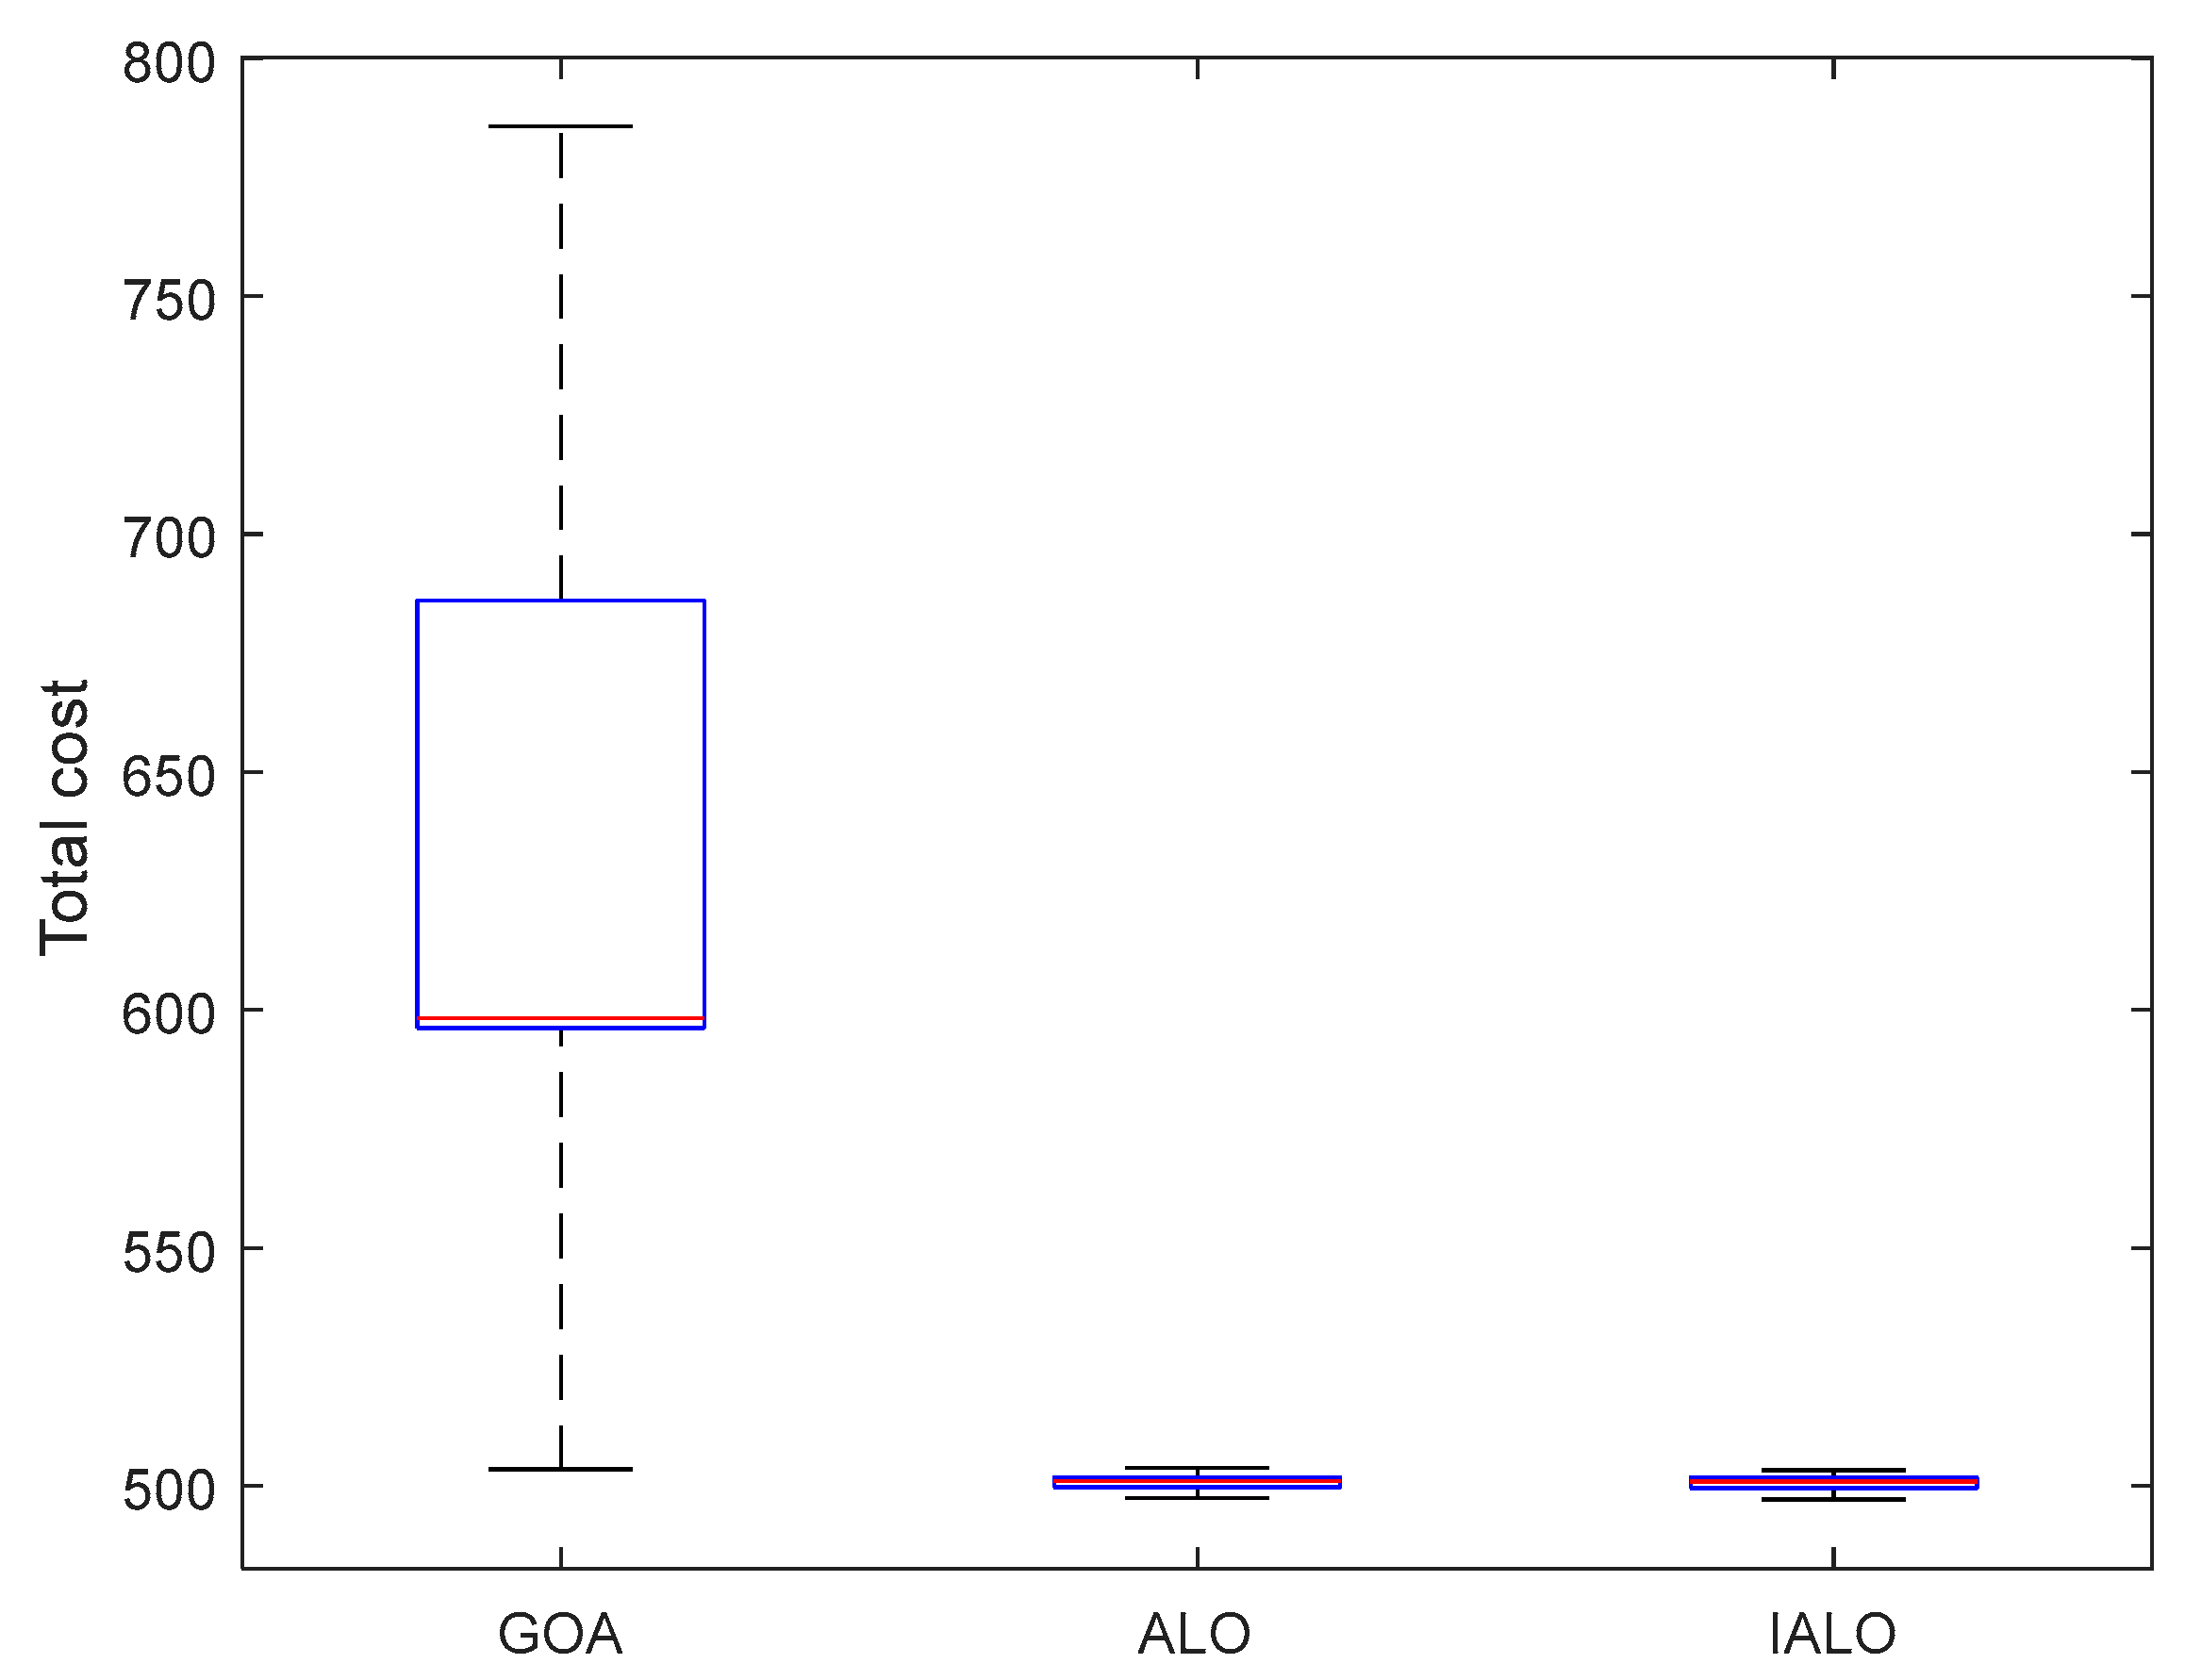
A boxplot, a statistical method used to show the degree of dispersion of data, is very simple and straightforward. Therefore, in order to better demonstrate the effectiveness of the algorithm used, the GOA, ALO and IALO algorithms were used to randomly calculate the experimental cases for 50 times through MATLAB, respectively, and the calculation results of the two logistics services were obtained. According to the results, a boxplot corresponding to different algorithms was drawn and analyzed, as shown in Figure 10 and Figure 11. According to the figure, the optimization ability of IALO algorithm is better than that of the GOA and ALO algorithms. Secondly, the size of the boxplot directly reflects the degree of dispersion of the algorithm results. Therefore, by comparing the boxplot size, it can be found that although the box size of the IALO algorithm is approximately equal to that of the ALO algorithm, the median of the IALO algorithm is smaller than that of the ALO algorithm, while the box size and median of the IALO algorithm are significantly smaller than that of the GOA algorithm. This shows that the discretization degree of the IALO algorithm is better than that of the other two algorithms. Finally, it is found that the ALO algorithm sometimes has outliers, which indicates that this algorithm is easy to fall into local optimum at some time, which also proves the stability of the search ability of the ALO algorithm.
Further, an extended numerical experiments is given under the SLSM, called case II, a larger case was introduced with 60 customers and 60 orders. Further algorithms are employed, such as a large neighborhood search (LNS). The summary results are shown in Table 12.
It can be seen from Table 12 that the best fitness values calculated by the GOA, LNS, ALO and IALO algorithms have certain differences. The results of the five indicators—best, worst, average, standard deviation and variance—are different for small- and large-scale problems such as case I and II. Therefore, the four algorithms can be easily ranked as IALO > ALO > LNS > GOA. The additional experiments prove that the proposed IALO is an effective method for the resulting optimization problem.
5. Conclusions
This article starts from the perspective of a third-party logistics provider and studies the route optimization problem in meal delivery. According to the shared logistics, a shared service is proposed and compared with the traditional service in the past. For providers, only considering minimizing costs without considering customer satisfaction may result in the loss of customers, and at the same time is not in line with reality. Based on the above situation, a multi-objective mathematical model considering customer dissatisfaction and cost minimization is established, and an IALO is designed to solve this problem. The relevant conclusions obtained by the algorithm are as follows:
(1) Starting from the actual situation, add the element of human behavior in the research on the optimization of the delivery route of the meal. That is, in the distribution, the required transportation cost should be reduced, customer satisfaction should also be considered, and the corresponding multi-objective should be established. A mathematical model that enables third-party logistics providers to obtain customers while gaining benefits is more in line with reality.
(2) Based on the emergence of shared logistics, propose corresponding shared services and compare them with previous traditional services. The analysis concludes that shared services can reduce the use of vehicles, effectively reduce transportation costs, and at the same time improve service quality and meet customer needs.
(3) The effectiveness of the improved algorithm proposed in this paper is verified through experimental cases, and the results show that the IALO algorithm is due to other algorithms.
This paper also has some shortcomings. For example, it only considers the customer’s satisfaction with the delivery, but not the psychology of the food providers. In addition, there are many functional formulas for expressing customer satisfaction. In the future, we will try other mathematical functions to compare the results obtained by different functions. Additionally, the linear weighting method is one of many transformation methods to deal with the model. In the future, we will try other methods to for more discussion about the multi-object optimization model.
Author Contributions
Conceptualization, F.L.; methodology, H.B.; validation, M.H.; formal analysis, X.Z.; investigation, X.Z.; data curation, X.Z.; writing—original draft preparation, X.Z. and F.L.; writing—review and editing, H.B.; supervision, H.B.; funding acquisition, F.L. and M.H. All authors have read and agreed to the published version of the manuscript.
Funding
Please add: This research was funded by the National Key R&D Program of China grant number 2020YFB1712802, and the Research Program of the Regional Economic Development Research Center of Yanshan University grant number JJ2208 and The APC was funded by the National Key R&D Program of China.
Institutional Review Board Statement
Not applicable.
Informed Consent Statement
Not applicable.
Data Availability Statement
Data will be available from the author.
Acknowledgments
The authors would like to thank master Runxue Jiang for her helpful suggestions in the revision processes.
Conflicts of Interest
The authors declare no conflict of interest.
References
- Li, C.W. Optimization analysis of logistics distribution process route—Take meal delivery as an example. Econ. Trade Pract. 2015, 10, 289–289+291. [Google Scholar]
- Yi, C.Y. Integrated Production and Delivery Scheduling Model and Algorithm under Online Meal Ordering. Master’s Thesis, Dalian University of Technology, Dalian, China, 2016. [Google Scholar]
- Dantzig, G.B.; Ramser, J.H. The truck dispatching problem. Manag. Sci. 1959, 6, 80–91. [Google Scholar] [CrossRef]
- Yang, Q.J.; Tang, Y.L.; Teng, X.B.; Luo, C.J.; Zhang, Z.B.; Bi, Q.L.; Wei, A. Hybrid mosquito tracking algorithm for MDVRP problem. J. Dongguan Univ. Technol. 2019, 26, 1–6+45. [Google Scholar]
- José, B. A memory-based iterated local search algorithm for the multi-depot open vehicle routing problem. Eur. J. Oper. Res. 2020, 284, 559–571. [Google Scholar]
- Fang, C.J. Research on Vehicle Dynamic Path Optimization of Multi-Objective Joint Delivery for Fresh Goods. Master’s Thesis, Chengdu University of Technology, Chengdu, China, 2018. [Google Scholar]
- Liu, Q.P. Optimization of Multi-Objective Cold Chain Logistics Distribution Vehicle Path Considering Customer Rating Classification. Ph.D. Thesis, Jiangsu University, Zhenjiang, China, 2019. [Google Scholar]
- Mahmoudi, M.; Zhou, X. Finding optimal solutions for vehicle routing problem with pickup and delivery services with time windows: A dynamic programming approach based on state-space-time network representations. Transp. Res. B Methodol. 2016, 89, 19–42. [Google Scholar] [CrossRef]
- Lu, F.; Chen, W.; Feng, W.; Bi, H. 4PL routing problem using hybrid beetle swarm optimization. Soft Comput. 2023, 27, 17011–17024. [Google Scholar] [CrossRef]
- Yan, T.; Lu, F.; Wang, S.; Wang, L.; Bi, H. A hybrid metaheuristic algorithm for the multi-objective location-routing problem in the early post-disaster stage. J. Ind. Manag. Optim. 2022, 19, 4663–4691. [Google Scholar] [CrossRef]
- Lu, F.; Feng, W.; Gao, M.; Bi, H.; Wang, S. The Fourth-Party Logistics Routing Problem Using Ant Colony System-Improved Grey Wolf Optimization. J. Adv. Transp. 2020, 2020, 8831746. [Google Scholar] [CrossRef]
- Hungerlander, P.; Maier, K.; Pachatz, V.; Truden, C. Improving Sharing Rates of a Dial-a-Ride Problem implemented for an Austrian Mobility Provider. Transp. Res. Procedia 2021, 52, 525–532. [Google Scholar] [CrossRef]
- Rist, Y.; Forbes, M. A column generation and combinatorial benders decomposition algorithm for the selective dial-a-ride-problem. Comput. Oper. Res. 2022, 140, 105649. [Google Scholar] [CrossRef]
- Fu, Z.; Chow, J.Y.J. The pickup and delivery problem with synchronized en-route transfers for microtransit planning. Transport. Res. Part E Logist. Transport. Rev. 2022, 157, 102562. [Google Scholar] [CrossRef]
- Guan, Y.; Wang, Y.; Yan, X.; Guo, H.; Zhao, Y. The One E-Ticket Customized Bus Service Mode for Passengers with Multiple Trips and the Routing Problem. Sustainability 2022, 14, 2124. [Google Scholar] [CrossRef]
- Nickkar, A.; Lee, Y.J.; Meskar, M. Developing an optimal algorithm for demand responsive feeder transit service accommodating temporary stops. J. Public Transp. 2022, 24, 100021. [Google Scholar] [CrossRef]
- Hua, S.; Zeng, W.; Liu, X.; Qi, M. Optimality-guaranteed algorithms on the dynamic shared-taxi problem. Transp. Res. Part E Logist. Transp. Rev. 2022, 164, 102809. [Google Scholar] [CrossRef]
- Fu, Z.; Chow, J.Y.J. Dial-a-ride problem with modular platooning and en-route transfers. Transp. Res. Part C Emerg. Technol. 2023, 152, 104191. [Google Scholar] [CrossRef]
- Matusiewicz, M.; Książkiewicz, D. Shared Logistics—Literature Review. Appl. Sci. 2023, 13, 2036. [Google Scholar] [CrossRef]
- Li, J.; Li, T.; Yu, Y.; Zhang, Z.; Pardalos, P.M.; Zhang, Y.; Ma, Y. Discrete firefly algorithm with compound neighborhoods for asymmetric multi-depot vehicle routing problem in the maintenance of farm machinery. Appl. Soft Comput. 2019, 81, 105460. [Google Scholar] [CrossRef]
- Wang, J.X. China’s shared logistics innovation model and development trend. Logist. Technol. Appl. 2017, 8, 80–84. [Google Scholar]
- Liu, R.; Jiang, Z.; Fung, R.Y.K.; Chen, F.; Liu, X. Two-phase heuristic algorithms for full truckloads multi-depot capacitated vehicle routing problem in carrier collaboration. Comput. Oper. Res. 2010, 37, 950–959. [Google Scholar] [CrossRef]
- Wang, Y.; Ma, X.; Li, Z.; Liu, Y.; Xu, M.; Wang, Y. Profit distribution in collaborative multiple centers vehicle routing problem. J. Clean. Prod. 2017, 144, 203–219. [Google Scholar] [CrossRef]
- Sheu, J.-B. An emergency logistics distribution approach for quick response to urgent relief demand in disasters. Transp. Res. Part E Logist. Transp. Rev. 2007, 43, 687–709. [Google Scholar] [CrossRef]
- Chen, S.J. Study on Distribution Network Planning of Enterprise Logistics Based on the Customer Value and Time Satisfaction. Ph.D. Thesis, Chongqing University, Chongqing, China, 2014. [Google Scholar]
- Wang, Z. Delivering meals for multiple suppliers: Exclusive or sharing logistics service. Transp. Res. Part E J. 2018, 118, 496–512. [Google Scholar] [CrossRef]
- Lu, F.; Yan, T.; Bi, H.; Feng, M.; Wang, S.; Huang, M. A bilevel whale optimization algorithm for risk management scheduling of information technology projects considering outsourcing. Knowl. Based Syst. 2022, 235, 107600. [Google Scholar] [CrossRef]
- Mirjalili, S. The Ant Lion Optimizer. Adv. Eng. Softw. 2015, 83, 80–98. [Google Scholar] [CrossRef]
- Yogarajan, G.; Revathi, T. Improved Cluster Based Data Gathering Using Ant Lion Optimization in Wireless Sensor Networks. Wirel. Pers. Commun. 2017, 98, 2711–2731. [Google Scholar] [CrossRef]
- Subhashini, K.R.; Satapathy, J.K. Development of an Enhanced Ant Lion Optimization Algorithm and Its Application in Antenna Array Synthesis. Appl. Soft Comput. 2017, 59, 153–173. [Google Scholar] [CrossRef]
- Kanimozhi, G.; Harish, K. Modeling of Solar Cell under Different Conditions by Ant Lion Optimizer with Lambert W Function. Appl. Soft Comput. 2018, 71, 141–151. [Google Scholar]
- Huang, C.Q.; Zhao, K.X. Three dimensional route planning of UAV with improved antlion optimizer. J. Electron. Inf. Technol. 2018, 40, 1532–1538. [Google Scholar]
- Wen, H.; Wang, S.X.; Lu, F.Q.; Feng, M.; Wang, L.Z.; Xiong, J.K.; Si, M.C. Colony search optimization algorithm using global optimization. J. Supercomput. 2022, 78, 6567–6611. [Google Scholar] [CrossRef]
- Zhai, J.S.; Thai, Y.H. Delivery Routing Optimization Based on Time Window Constraint. Logist. Sci-Tech 2018, 41, 15–18. [Google Scholar]
- Ye, Y.; Zhang, H.Z. Wolf pack algorithm for multi-depot routing problem. Appl. Res. Comput. 2017, 34, 2590–2593. [Google Scholar]
- Yin, Z.; Ye, C.M. Study on the hierarchical model for multi-depot logistic vehicle scheduling problem. J. Syst. Manag. 2014, 23, 602–606. [Google Scholar]
- Wu, Q.J. Study on Delivery Vehicle Routing Problem with Hard Time Window. Master’s Thesis, JiMei University, Xiamen, China, 2020. [Google Scholar]
- Zhang, L.Y.; Zhang, J.; Xiao, B. Multi-objective O2O Take-Out Instant Delivery Routing Optimization Considering Customer Priority. Ind. Eng. Manag. 2021, 26, 196–204. [Google Scholar]
- Zhao, Q.; Lu, F.; Wang, L.; Wang, S. Research on Drones and Riders Joint Take-Out Delivery Routing Problem. Comput. Eng. Appl. 2022, 58, 57–67. [Google Scholar]
Figure 1.
Meal delivery process.

Figure 2.
General description of the two types of logistics service modes.

Figure 3.
Examples of the two types of logistics service modes.

Figure 4.
Customer satisfaction function.

Figure 5.
Location distribution map of depots, customers and food providers.

Figure 6.
Best route diagram under the TLSM.

Figure 7.
Best route diagram under the SLSM.

Figure 8.
Algorithm convergence diagram under TLSM.

Figure 9.
Algorithm convergence diagram under SLSM.

Figure 10.
Box plot under TLSM.

Figure 11.
Box plot under SLSM.


Table 1.
A summary of studies on shared logistics.
| Article | Mode | Application Area | Method | Goal |
|---|---|---|---|---|
| [16] | shared logistics | e-platforms, Intelligent cyberphysical system, blockchain, ICT in reducing warehouse waste | SHARE assets and services | higher efficiency of logistics processes |
| [17] | shared logistics | maintenance of farm machinery | Shared logistics resources, to achieve the optimal allocation of resources | reduce logistics cost, improve logistics efficiency |
| [18] | collaborative transportation | transportation | Reduce air transport by combining multiple shippers or carriers’ vehicles | reduce the overall route cost |
| [19] | collaborative transportation | transportation | Cooperation and sharing of multiple interest entities | reduce the overall route cost |
| [5,20,21,22] | collaborative transportation | urban transportation, emergency logistics | Share vehicle information, load | improve logistics efficiency, response demand |
| This paper | shared logistics | e-commerce platform, meal delivery | Share vehicles and their information | reduce delivery cost and improve customer satisfaction |
Table 2.
Symbols in the model.
| Type | Name | Description |
|---|---|---|
| Set | the node set | |
| the edge set (defined in Table 2) | ||
| the set of food providers | ||
| food providers set with same position and different time index, | ||
| the set of all-time index food providers | ||
| customers set that ordering meals from food provider, | ||
| the set of all customers | ||
| the set of depots, | ||
| the set of vehicles, | ||
| Parameters | the visiting time, | |
| the food provider who provides meal for customer i, | ||
| the travel time on edge | ||
| a big positive number | ||
| the routing cost per time unit | ||
| the fixed cost of employing a vehicle | ||
| the lower limit of the time window that the order promises to be delivered | ||
| the upper limit of the time window that the order promises to be delivered | ||
| the earliest acceptable delivery time for order | ||
| the latest acceptable delivery time for order | ||
| dissatisfaction weight | ||
| cost weight | ||
| maximum cargo capacity of a single delivery vehicle | ||
| the meal demand from customer | ||
| Variables | if vehicle travels on edge , then , otherwise | |
| the time when the vehicle arriving at node i, | ||
| the accumulative travel time at node i, since the last visiting of food provider s, | ||
| customer satisfaction |
Table 3.
Connection types in edge set .
| Connection Type | Traditional Logistics Service Mode | Shared Logistics Service Mode |
|---|---|---|
| From depot to food provider | Connections from to i, | Connections from to i, |
| From food provider to customer | Connections from i to c, , | Connections from i to c, , |
| From customer to customer | Connections from c to c′, , , | Connections from c to c′, , |
| From customer to provider | Connections from c to i, , | Connections from c to i, , |
| From provider to provider | Connections from i to j, satisfying , represents the waiting time at food provider (without cost), , | Connections from i to j, satisfying . , , |
| From customer to depot | Connections from c to , | Connections from c to , |
Table 4.
Location coordinates of depots, customers, and food providers.
| Depot | Customer | Food Provider | |||||
|---|---|---|---|---|---|---|---|
| Number | Coordinate (km) | Number | Coordinate (km) | Number | Coordinate (km) | Number | Coordinate (km) |
| 1 | (4.08, 3.72) | 5 | (3.48, 5.68) | 20 | (4.96, 4.55) | 35 | (3.19, 4.03) |
| 2 | (3.62, 5.34) | 6 | (4.91, 3.19) | 21 | (5.24, 5.38) | 36 | (5.28, 4.42) |
| 3 | (4.75, 5.27) | 7 | (3.26, 4.41) | 22 | (5.00, 3.64) | 37 | (4.67, 5.14) |
| 4 | (5.01, 4.17) | 8 | (3.64, 3.63) | 23 | (4.80, 3.99) | 38 | (3.70, 4.33) |
| 9 | (5.45, 5.23) | 24 | (4.57, 3.26) | 39 | (5.82, 5.14) | ||
| 10 | (4.05, 3.98) | 25 | (5.87, 4.21) | 40 | (3.52, 6.13) | ||
| 11 | (3.07, 4.52) | 26 | (3.80, 3.34) | 41 | (3.31, 5.43) | ||
| 12 | (3.88, 4.69) | 27 | (3.01, 5.28) | 42 | (4.16, 3.06) | ||
| 13 | (5.22, 6.04) | 28 | (5.61, 4.21) | 43 | (5.19, 3.19) | ||
| 14 | (3.65, 3.71) | 29 | (5.85, 3.45) | 44 | (4.77, 4.61) | ||
| 15 | (4.35, 4.55) | 30 | (4.92, 5.95) | ||||
| 16 | (3.55, 3.95) | 31 | (4.40, 6.09) | ||||
| 17 | (5.17, 5.74) | 32 | (3.26, 6.05) | ||||
| 18 | (3.54, 3.67) | 33 | (4.08, 5.14) | ||||
| 19 | (5.17, 4.93) | 34 | (4.81, 3.51) | ||||
Table 5.
Customer information and food provider information.
| Order Number | Order Time | Delivery Time | Customer | Food Provider | Demand | Service Time Window | Earliest Time | Latest Time |
|---|---|---|---|---|---|---|---|---|
| (1) | 11:17 | 11:57 | 5 | 35 | 2 | [11:52, 12:02] | 11:47 | 12:07 |
| (2) | 11:24 | 12:04 | 6 | 41 | 3 | [11:59, 12:09] | 11:54 | 12:14 |
| (3) | 11:26 | 12:06 | 7 | 42 | 3 | [12:01, 12:11] | 11:56 | 12:16 |
| (4) | 11:33 | 12:13 | 8 | 38 | 1 | [12:08, 12:18] | 12:03 | 12:23 |
| (5) | 11:35 | 12:15 | 9 | 40 | 2 | [12:10, 12:20] | 12:05 | 12:25 |
| (6) | 11:36 | 12:16 | 10 | 39 | 2 | [12:11, 12:21] | 12:06 | 12:26 |
| (7) | 11:38 | 12:18 | 11 | 36 | 4 | [12:13, 12:23] | 12:08 | 12:28 |
| (8) | 11:40 | 12:20 | 12 | 44 | 2 | [12:15, 12:25] | 12:10 | 12:30 |
| (9) | 11:42 | 12:22 | 13 | 41 | 3 | [12:17, 12:27] | 12:12 | 12:32 |
| (10) | 11:45 | 12:25 | 14 | 43 | 1 | [12:20, 12:30] | 12:15 | 12:35 |
| (11) | 11:46 | 12:26 | 15 | 35 | 3 | [12:21, 12:31] | 12:16 | 12:36 |
| (12) | 11:48 | 12:28 | 16 | 37 | 2 | [12:23, 12:33] | 12:18 | 12:38 |
| (13) | 11:48 | 12:28 | 17 | 44 | 3 | [12:23, 12:33] | 12:18 | 12:38 |
| (14) | 11:50 | 12:30 | 18 | 40 | 3 | [12:25, 12:35] | 12:20 | 12:40 |
| (15) | 11:53 | 12:33 | 19 | 42 | 4 | [12:28, 12:38] | 12:23 | 12:43 |
| (16) | 12:05 | 12:45 | 20 | 37 | 1 | [12:40, 12:50] | 12:35 | 12:55 |
| (17) | 12:08 | 12:46 | 21 | 39 | 3 | [12:41, 12:51] | 12:36 | 12:56 |
| (18) | 12:09 | 12:49 | 22 | 43 | 4 | [12:44, 12:54] | 12:39 | 12:59 |
| (19) | 12:10 | 12:50 | 23 | 40 | 2 | [12:45, 12:55] | 12:40 | 13:00 |
| (20) | 12:16 | 12:56 | 24 | 36 | 3 | [12:51, 13:01] | 12:46 | 13:06 |
| (21) | 12:19 | 12:59 | 25 | 39 | 1 | [12:54, 13:04] | 12:49 | 13:09 |
| (22) | 12:20 | 13:00 | 26 | 42 | 4 | [12:55, 13:05] | 12:50 | 13:10 |
| (23) | 12:22 | 13:02 | 27 | 43 | 3 | [12:57, 13:07] | 12:52 | 13:12 |
| (24) | 12:26 | 13:06 | 28 | 38 | 4 | [13:01, 13:11] | 12:56 | 13:16 |
| (25) | 12:26 | 13:06 | 29 | 40 | 2 | [13:01, 13:11] | 12:56 | 13:16 |
| (26) | 12:29 | 13:09 | 30 | 39 | 4 | [13:03, 13:13] | 12:58 | 13:18 |
| (27) | 12:30 | 13:10 | 31 | 36 | 1 | [13:05, 13:15] | 13:00 | 13:20 |
| (28) | 12:35 | 13:15 | 32 | 41 | 3 | [13:10, 13:20] | 13:05 | 13:25 |
| (29) | 12:36 | 13:16 | 33 | 43 | 1 | [13:11, 13:21] | 13:06 | 13:26 |
| (30) | 12:40 | 13:20 | 34 | 37 | 2 | [13:15, 13:25] | 13:10 | 13:30 |
Table 6.
Parameter values.
| Parameter Symbol | Parameter Value |
|---|---|
| 0.32 RMB/min | |
| 150 RMB | |
| 180 RMB | |
Table 7.
Comparison of the two types of logistics service modes.
| Logistics Service Mode | Number of Vehicles | Route Cost (RMB) | Total Cost (RMB) | Satisfaction | Percentage (%) |
|---|---|---|---|---|---|
| TLSM | 30 | 120.63 | 4620.63 | 6.35 | - |
| SLSM | 8 | 117.75 | 1395.75 | 392.59 | 21.76 |
Table 8.
The best route table under traditional services.
| Route Number | Specific Route | Route Number | Specific Route |
|---|---|---|---|
| 1 | [1; 35; 15; 4] | 2 | [1; 38; 8; 1] |
| 3 | [3; 39; 21; 3] | 4 | [2; 41; 13; 3] |
| 5 | [3; 37; 16; 1] | 6 | [4; 43; 33; 2] |
| 7 | [2; 41; 32; 2] | 8 | [3; 39; 25; 4] |
| 9 | [4; 36; 31; 3] | 10 | [1; 35; 5; 2] |
| 11 | [2; 40; 18; 1] | 12 | [3; 39; 10; 1] |
| 13 | [4; 44; 17; 3] | 14 | [4; 43; 14; 1] |
| 15 | [2; 40; 29; 4] | 16 | [1; 42; 7; 2] |
| 17 | [1; 38; 28; 4] | 18 | [4; 36; 24; 1] |
| 19 | [3; 43; 27; 2] | 20 | [2; 42; 26; 1] |
| 21 | [2; 40; 9; 3] | 22 | [3; 39; 30; 3] |
| 23 | [3; 37; 34; 4] | 24 | [2; 40; 23; 4] |
| 25 | [1; 42; 19; 3] | 26 | [4; 36; 11; 2] |
| 27 | [1; 44; 12; 2] | 28 | [3; 37; 20; 4] |
| 29 | [2; 41; 6; 1] | 30 | [1; 43; 22; 4] |
Table 9.
The best route table under shared services.
| Route Number | Specific Route |
|---|---|
| 1 | [3; 37; 41; 34; 32; 38; 8; 1] |
| 2 | [1; 38; 40; 8; 23; 41; 39; 6; 10; 40; 18; 1] |
| 3 | [2; 40; 39; 18; 21; 43; 36; 27; 24; 43; 22; 4] |
| 4 | [4; 43; 22; 38; 43; 28; 14; 40; 9; 3] |
| 5 | [2; 40; 35; 9; 5; 40; 43; 29; 33; 35; 15; 4] |
| 6 | [1; 35; 36; 15; 31; 42; 42; 7; 26; 42; 37; 19; 20; 4] |
| 7 | [3; 37; 16; 1] |
Table 10.
Target value.
| Total Target | Total Cost | Satisfaction | |||||
|---|---|---|---|---|---|---|---|
| TLSM | SLSM | TLSM | SLSM | TLSM | SLSM | ||
| 0.0 | 1.0 | 4614.29 | 999.61 | 4614.29 | 999.61 | 0.00 | 0.00 |
| 0.1 | 0.9 | 4152.96 | 900.96 | 4619.24 | 1471.46 | 44.56 | 4234.53 |
| 0.2 | 0.8 | 3691.63 | 799.38 | 4618.99 | 1357.90 | 18.82 | 1435.70 |
| 0.3 | 0.7 | 3230.30 | 700.49 | 4617.49 | 1452.23 | 7.47 | 1054.57 |
| 0.4 | 0.6 | 2768.97 | 600.10 | 4618.91 | 1490.66 | 6.93 | 736.74 |
| 0.5 | 0.5 | 2307.64 | 502.08 | 4620.63 | 1395.75 | 6.35 | 392.59 |
| 0.6 | 0.4 | 1846.32 | 399.82 | 4617.16 | 1416.06 | 1.92 | 278.68 |
| 0.7 | 0.3 | 1384.99 | 300.90 | 4618.78 | 1451.19 | 1.92 | 193.08 |
| 0.8 | 0.2 | 923.66 | 200.97 | 4618.33 | 1472.73 | 1.01 | 117.97 |
| 0.9 | 0.1 | 462.33 | 100.80 | 4618.84 | 1434.01 | 0.51 | 48.33 |
| 1.0 | 0.0 | 1.00 | 0.00 | 4619.21 | 1434.67 | 0.00 | 1.00 |
Table 11.
Comparison of GOA, ALO and IALO algorithms (case I).
| Algorithm | Mode | Best | Worst | Average | Standard Deviation | Variance |
|---|---|---|---|---|---|---|
| GOA | TLSM | 2307.64 | 2311.65 | 2309.34 | 1.00 | 0.99 |
| SLSM | 503.45 | 785.69 | 628.36 | 66.95 | 4482.91 | |
| ALO | TLSM | 2307.64 | 2307.79 | 2307.66 | 0.03 | 0.00 |
| SLSM | 497.40 | 503.74 | 500.64 | 1.51 | 2.28 | |
| IALO | TLSM | 2307.64 | 2307.64 | 2307.64 | 0.00 | 0.00 |
| SLSM | 497.08 | 503.26 | 500.57 | 1.49 | 2.23 |
Table 12.
Comparison of the GOA, LNS, ALO and IALO algorithms.
| Case | Algorithm | Best | Worst | Average | Standard Deviation | Variance |
|---|---|---|---|---|---|---|
| case I | GOA | 503.45 | 785.69 | 628.36 | 66.95 | 4482.91 |
| LNS | 497.28 | 543.64 | 510.32 | 3.87 | 14.98 | |
| ALO | 497.40 | 503.74 | 500.64 | 1.51 | 2.28 | |
| IALO | 497.08 | 503.26 | 500.57 | 1.49 | 2.23 | |
| case II | GOA | 1234.90 | 1993.40 | 1687.20 | 203.32 | 41339.02 |
| LNS | 973.60 | 1120.42 | 1054.28 | 45.30 | 2052.09 | |
| ALO | 970.42 | 1074.86 | 1034.98 | 18.48 | 341.51 | |
| IALO | 962.68 | 1023.58 | 987.24 | 9.94 | 98.80 |
Disclaimer/Publisher’s Note: The statements, opinions and data contained in all publications are solely those of the individual author(s) and contributor(s) and not of MDPI and/or the editor(s). MDPI and/or the editor(s) disclaim responsibility for any injury to people or property resulting from any ideas, methods, instructions or products referred to in the content. |
© 2023 by the authors. Licensee MDPI, Basel, Switzerland. This article is an open access article distributed under the terms and conditions of the Creative Commons Attribution (CC BY) license (https://creativecommons.org/licenses/by/4.0/).
Share and Cite
MDPI and ACS Style
Bi, H.; Zhu, X.; Lu, F.; Huang, M. The Meal Delivery Routing Problem in E-commerce Platforms under the Shared Logistics Mode. J. Theor. Appl. Electron. Commer. Res. 2023, 18, 1799-1819. https://doi.org/10.3390/jtaer18040091
AMA Style
Bi H, Zhu X, Lu F, Huang M. The Meal Delivery Routing Problem in E-commerce Platforms under the Shared Logistics Mode. Journal of Theoretical and Applied Electronic Commerce Research. 2023; 18(4):1799-1819. https://doi.org/10.3390/jtaer18040091
Chicago/Turabian StyleBi, Hualing, Xiaoxue Zhu, Fuqiang Lu, and Min Huang. 2023. "The Meal Delivery Routing Problem in E-commerce Platforms under the Shared Logistics Mode" Journal of Theoretical and Applied Electronic Commerce Research 18, no. 4: 1799-1819. https://doi.org/10.3390/jtaer18040091