
Evolutionary Game Analysis of the Impact of Big Data Credit Technology on the Credit Rationing of Micro and Small Enterprises (MSEs)


Abstract
:1. Introduction
2. Literature Review
2.1. The Causes of the Credit Rationing of MSEs
2.2. Countermeasures to Alleviate the Credit Rationing of MSEs
2.3. The Role of Big Data in the Credit Market
3. Evolutionary Game Analysis of Bank–Enterprise Credit Strategies
3.1. Evolutionary Game Analysis under the Traditional Mode
3.1.1. Game Hypothesis
- (1)
- All players are bounded rational individuals who pursue profit maximization.
- (2)
- The information asymmetry degree between the banks and MSEs is , , where represents complete information asymmetry and represents complete information symmetry. MSEs know their own operating conditions, profitability, repayment ability and repayment willingness, etc., thus having an absolute information advantage. However, banks only know the average success probability of the projects invested by MSEs, and they need to pay high costs to obtain additional information.
- (3)
- The decision vectors of banks and MSEs are (lend, reject) and (repay, default), respectively; in the initial state, the probabilities of banks and MSEs choosing the two strategies are (, ) and (, ), respectively, where , and ; i.e., both and are functions of time . Banks do not know whether MSEs will repay or not before deciding whether to lend.
- (4)
- The fixed capital amount that MSEs need to invest in the project is , where is MSE’s private wealth, is the loan amount MSEs need to borrow from banks, and the interest rate is .
- (5)
- The collateral requirement is , ; when the MSE defaults, the bank confiscates the collateral. Since the use of collateral usually involves various costs, such as the assets’ regulatory cost of maintaining the collateral’s value at the agreed level or implicit costs for the borrower in being forced to relinquish discretionary use of the asset [53], which is assumed to be and is undertaken by MSEs; the asset realization rate of the collateral is .
- (6)
- MSEs’ project success probability is ), the rate of return on capital when the project is successful is , the failure probability of the project is , and the return is when the project fails; the expected return of the MSE is .
- (7)
- If the bank chooses to decline the loan, and the MSE plans to continue operating the project and turn to non-bank financing channels, the amount to be repaid and the additional costs incurred during the loan application process are . Generally speaking, it is more expensive for borrowers to finance from non-bank institutions, which is manifested by higher interest rates and negotiation costs [54]; thus, assume that .
- (8)
- The risk-free rate of return on the bank loan is , . Since MSEs’ operating risks and the information asymmetry degree are higher than those of large-scale enterprises [55], assume that the transaction cost for the bank to lend to MSEs is , ; the expected return of the bank is .
3.1.2. Basic Model
3.1.3. Model Analysis
- (1)
- The evolution path and evolutionarily stable strategy of MSEs and banks
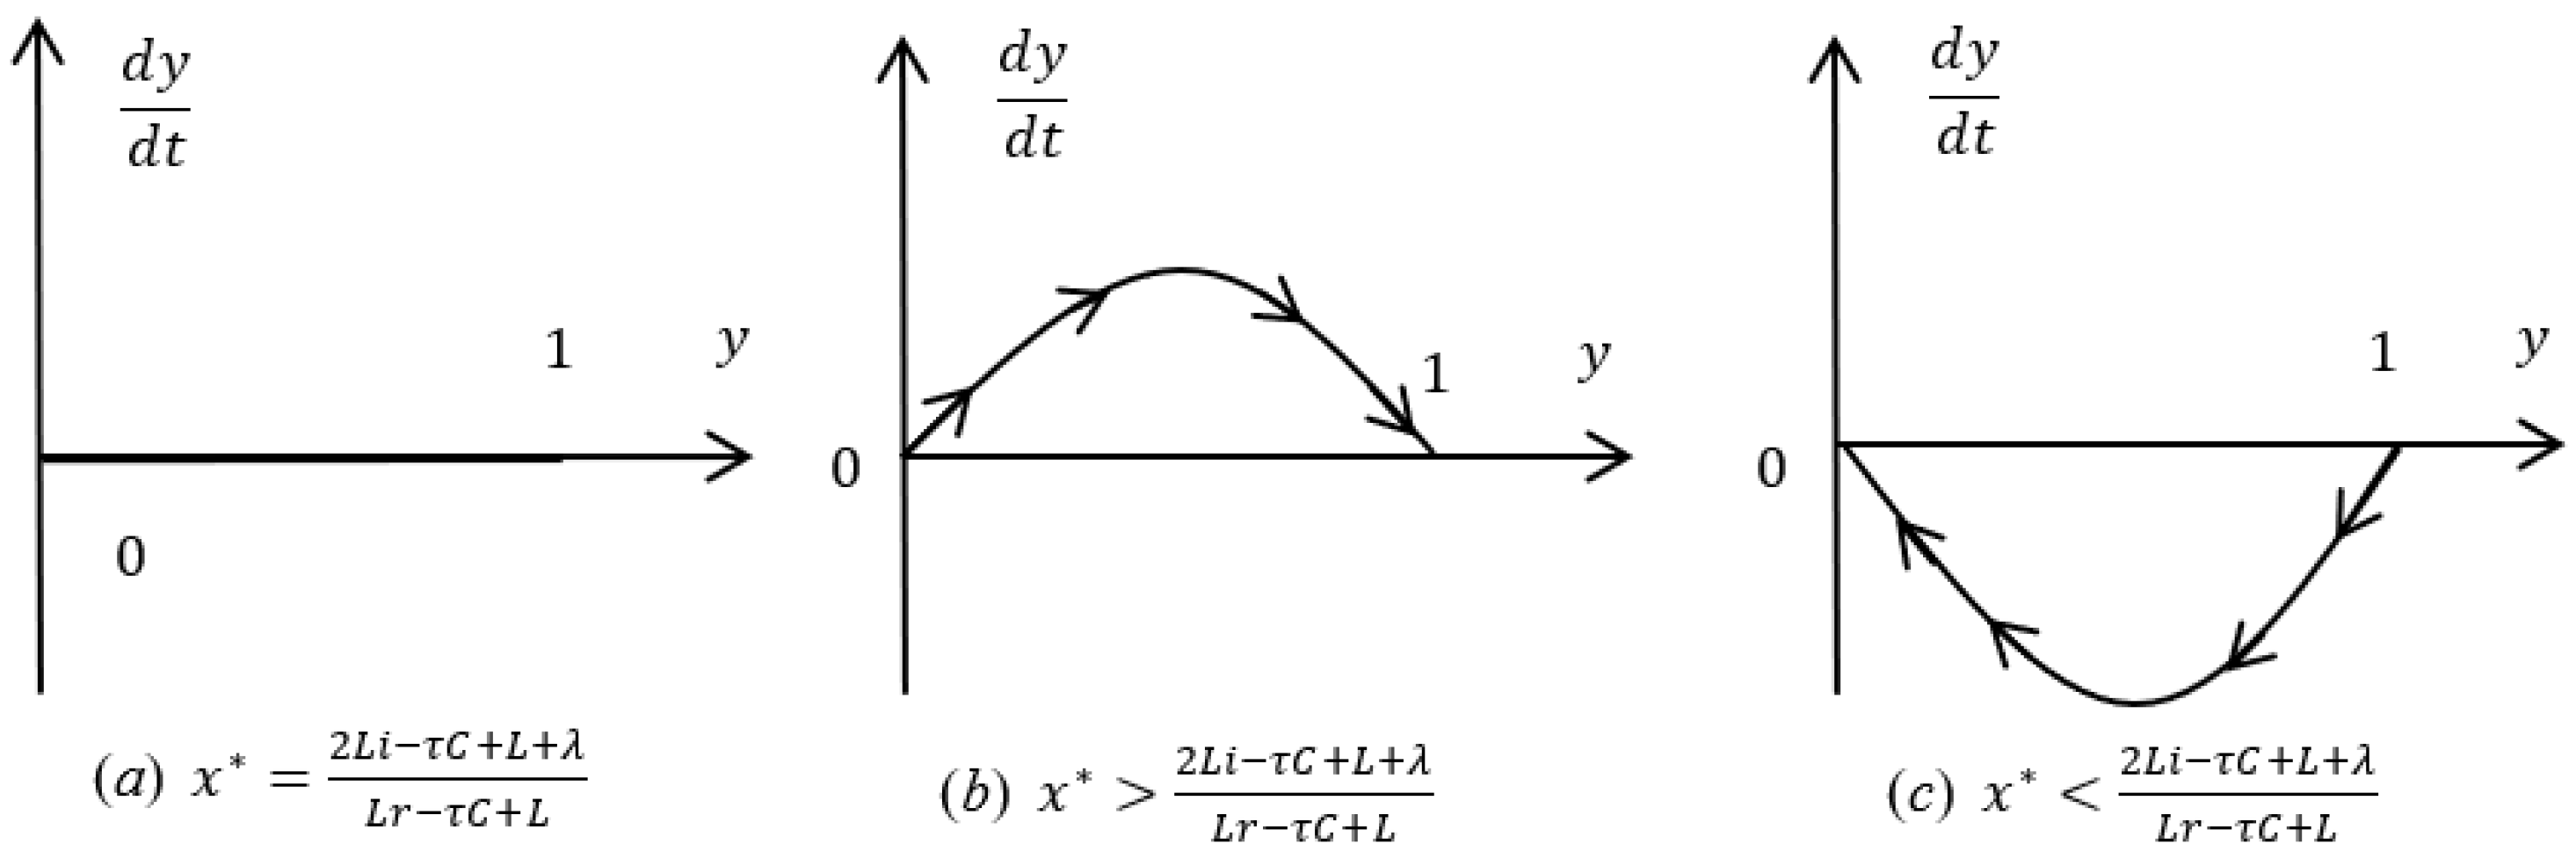
- (a)
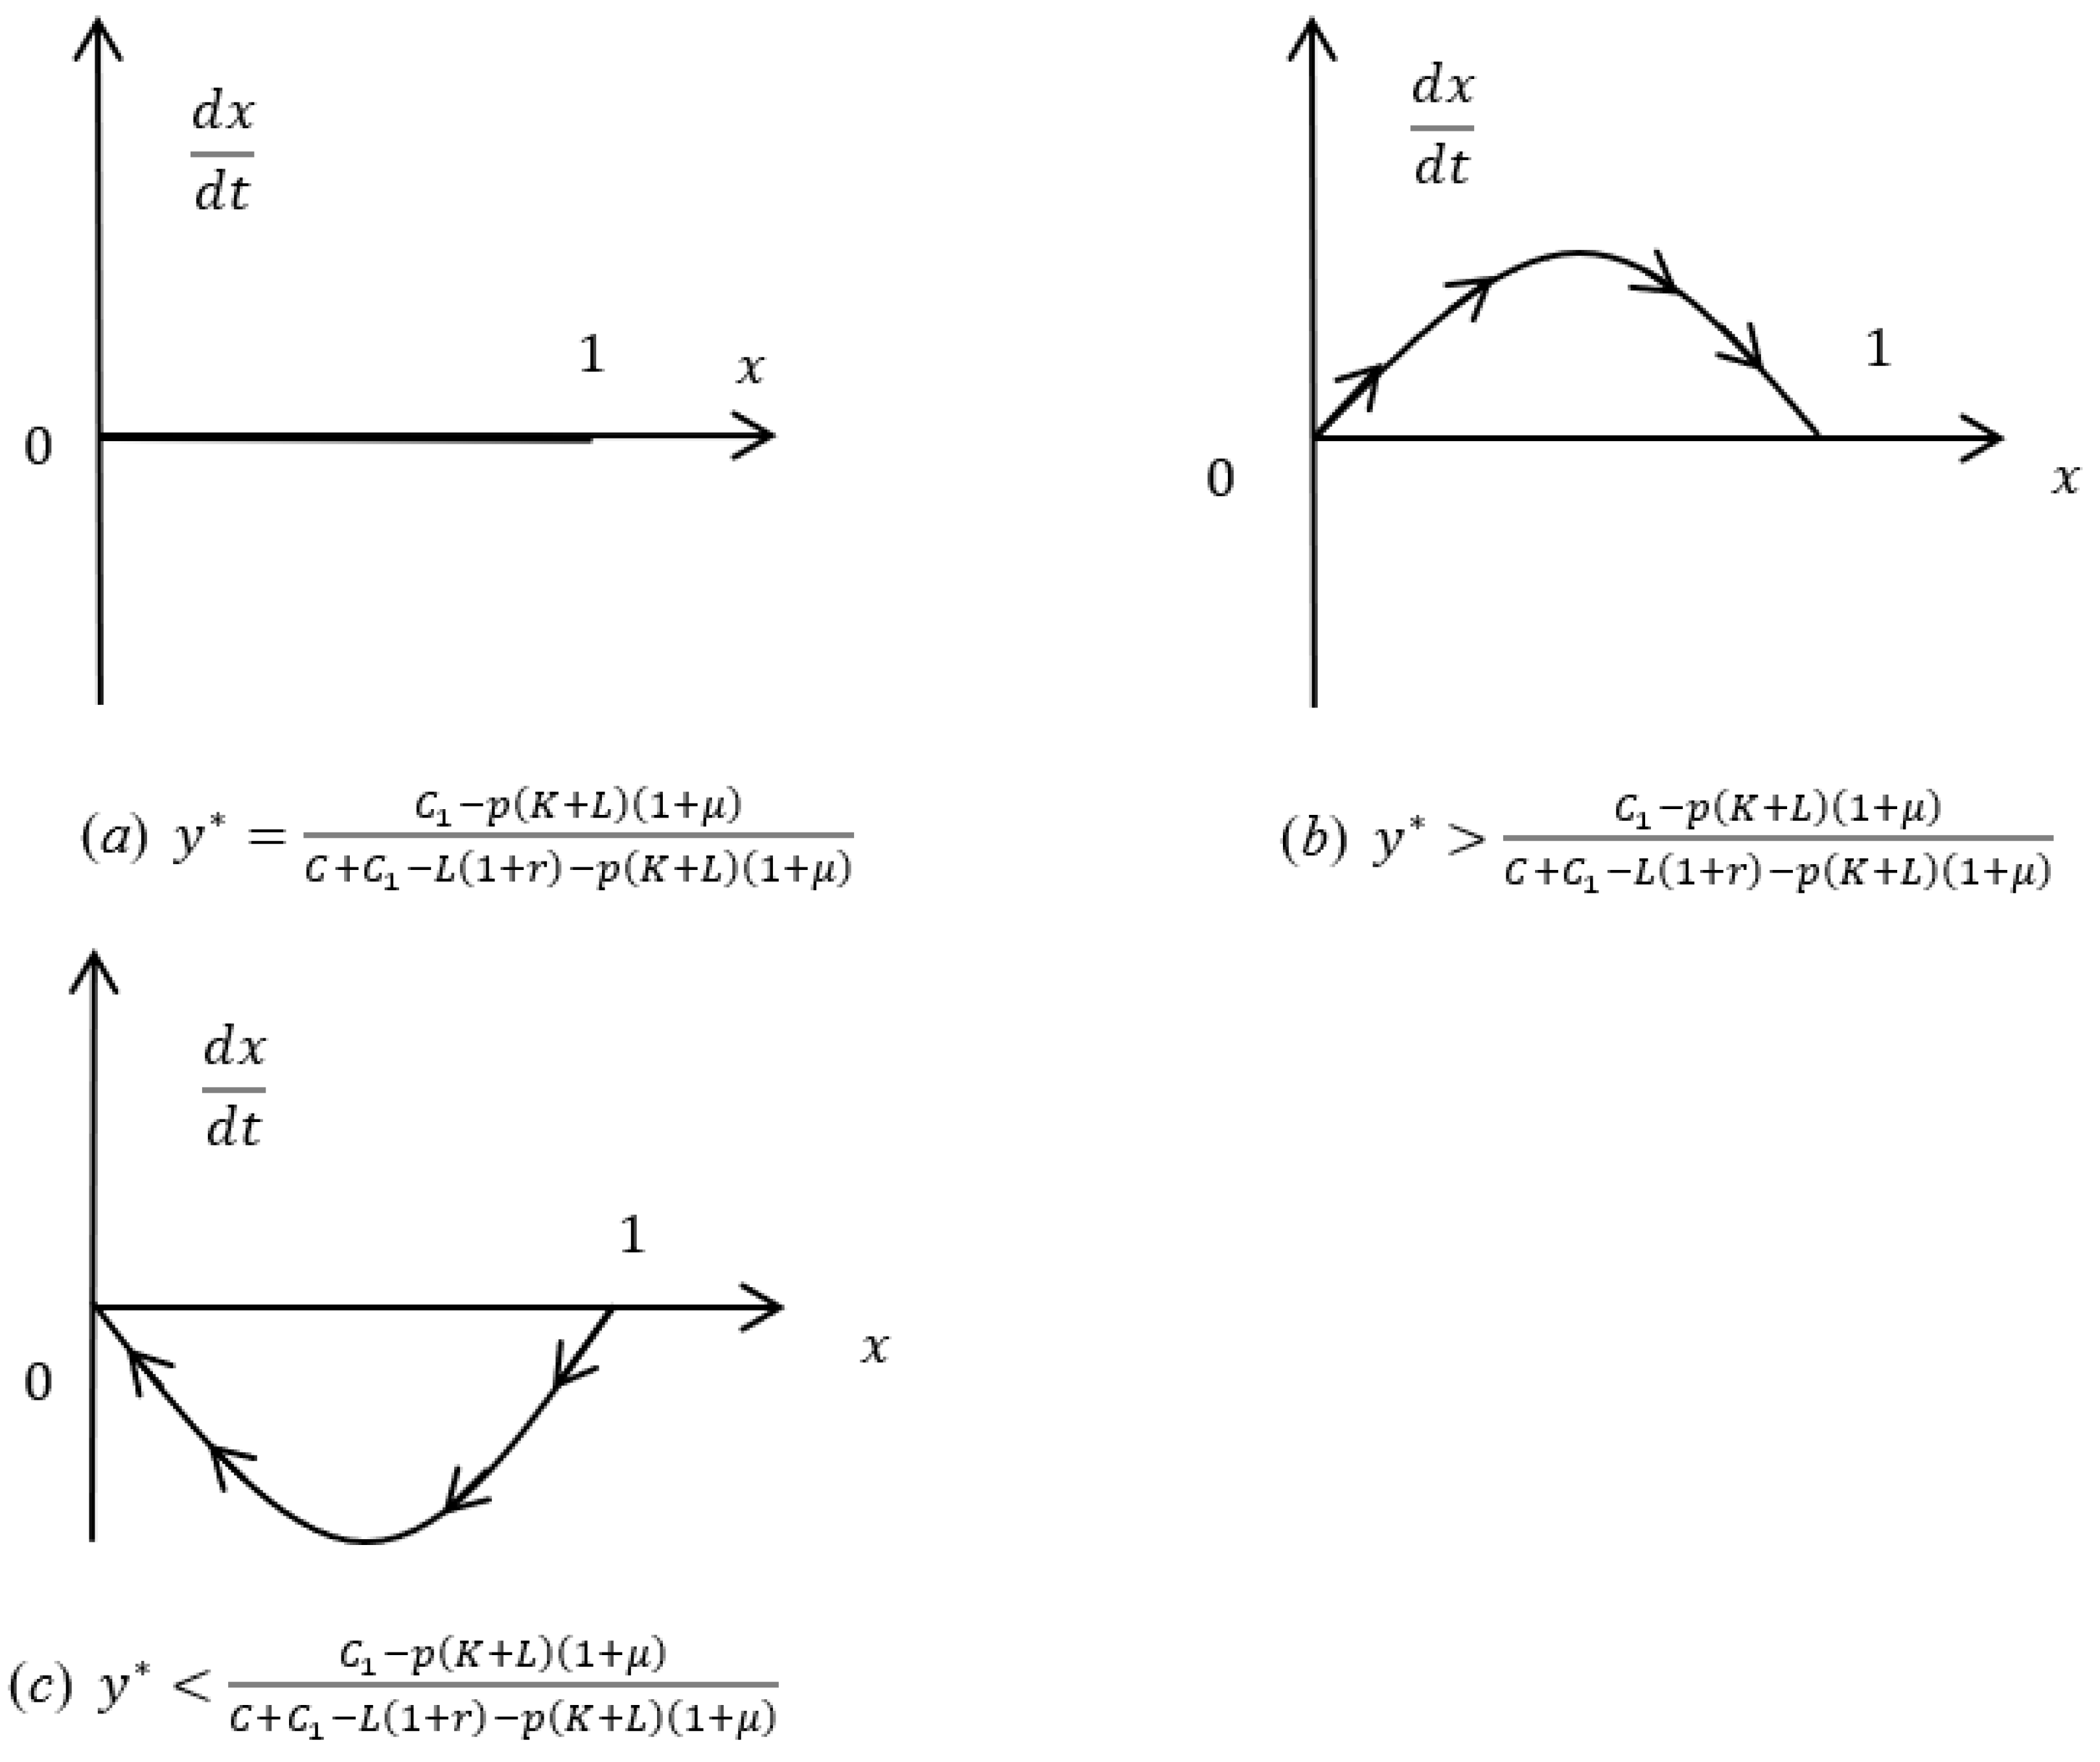
- If , for and , we have and , respectively; then, is the evolutionarily stable strategy; i.e., when banks choose to lend with a probability higher than , “repay” is the evolutionarily stable strategy for MSEs. The replication dynamics of MSEs are shown in Figure 4b.
- (b)
- If , for and , we have and , respectively; then, is the evolutionarily stable strategy; i.e., when banks choose to lend with a probability less than , “default” is the evolutionarily stable strategy for MSEs. The replication dynamics of MSEs are shown in Figure 4c. The replication dynamic phase diagrams of MSEs under different circumstances are shown in Figure 4:
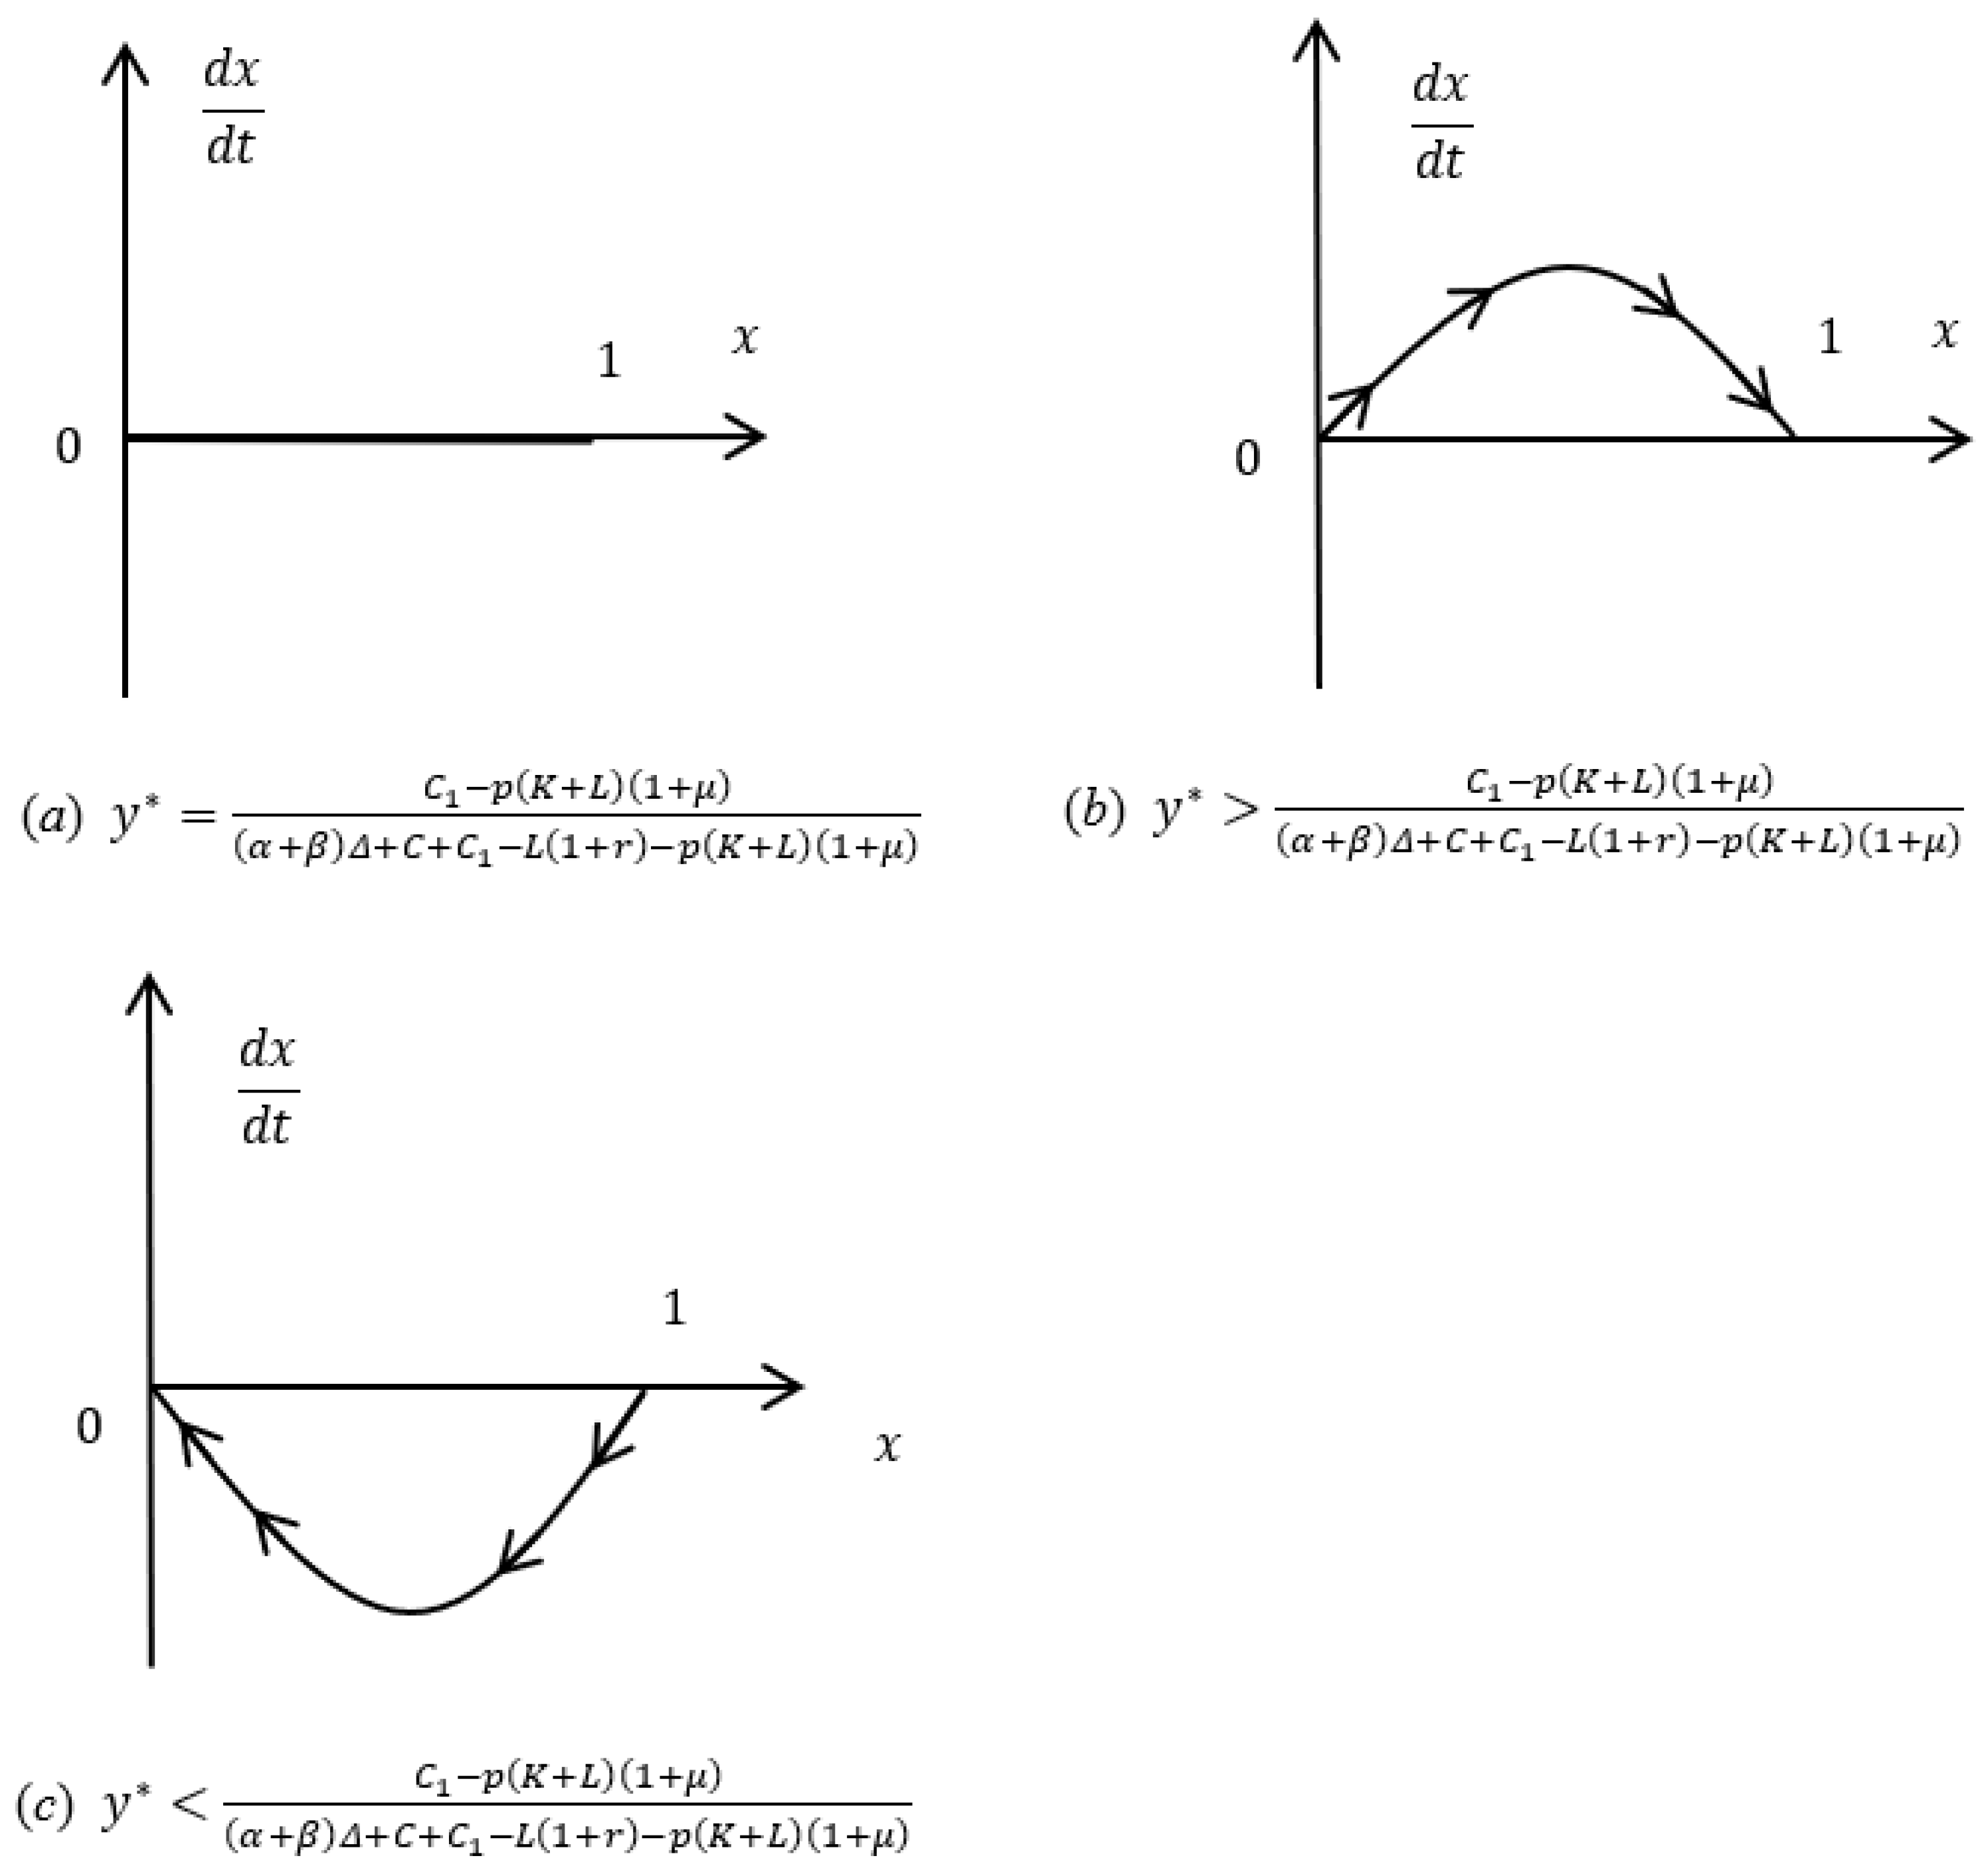
- (a)
- When , is an evolutionarily stable strategy, the replication dynamics of banks are shown in Figure 5b. When MSEs choose to repay with a probability higher than , banks will gradually shift from rejecting loans to lending.
- (b)
- When , is an evolutionarily stable strategy, the replication dynamics of banks are shown in Figure 5c. When MSEs choose to repay with a probability less than , rejecting the loan is an evolutionarily stable strategy for banks. The replication dynamic phase diagrams of banks under different circumstances are shown in Figure 5:
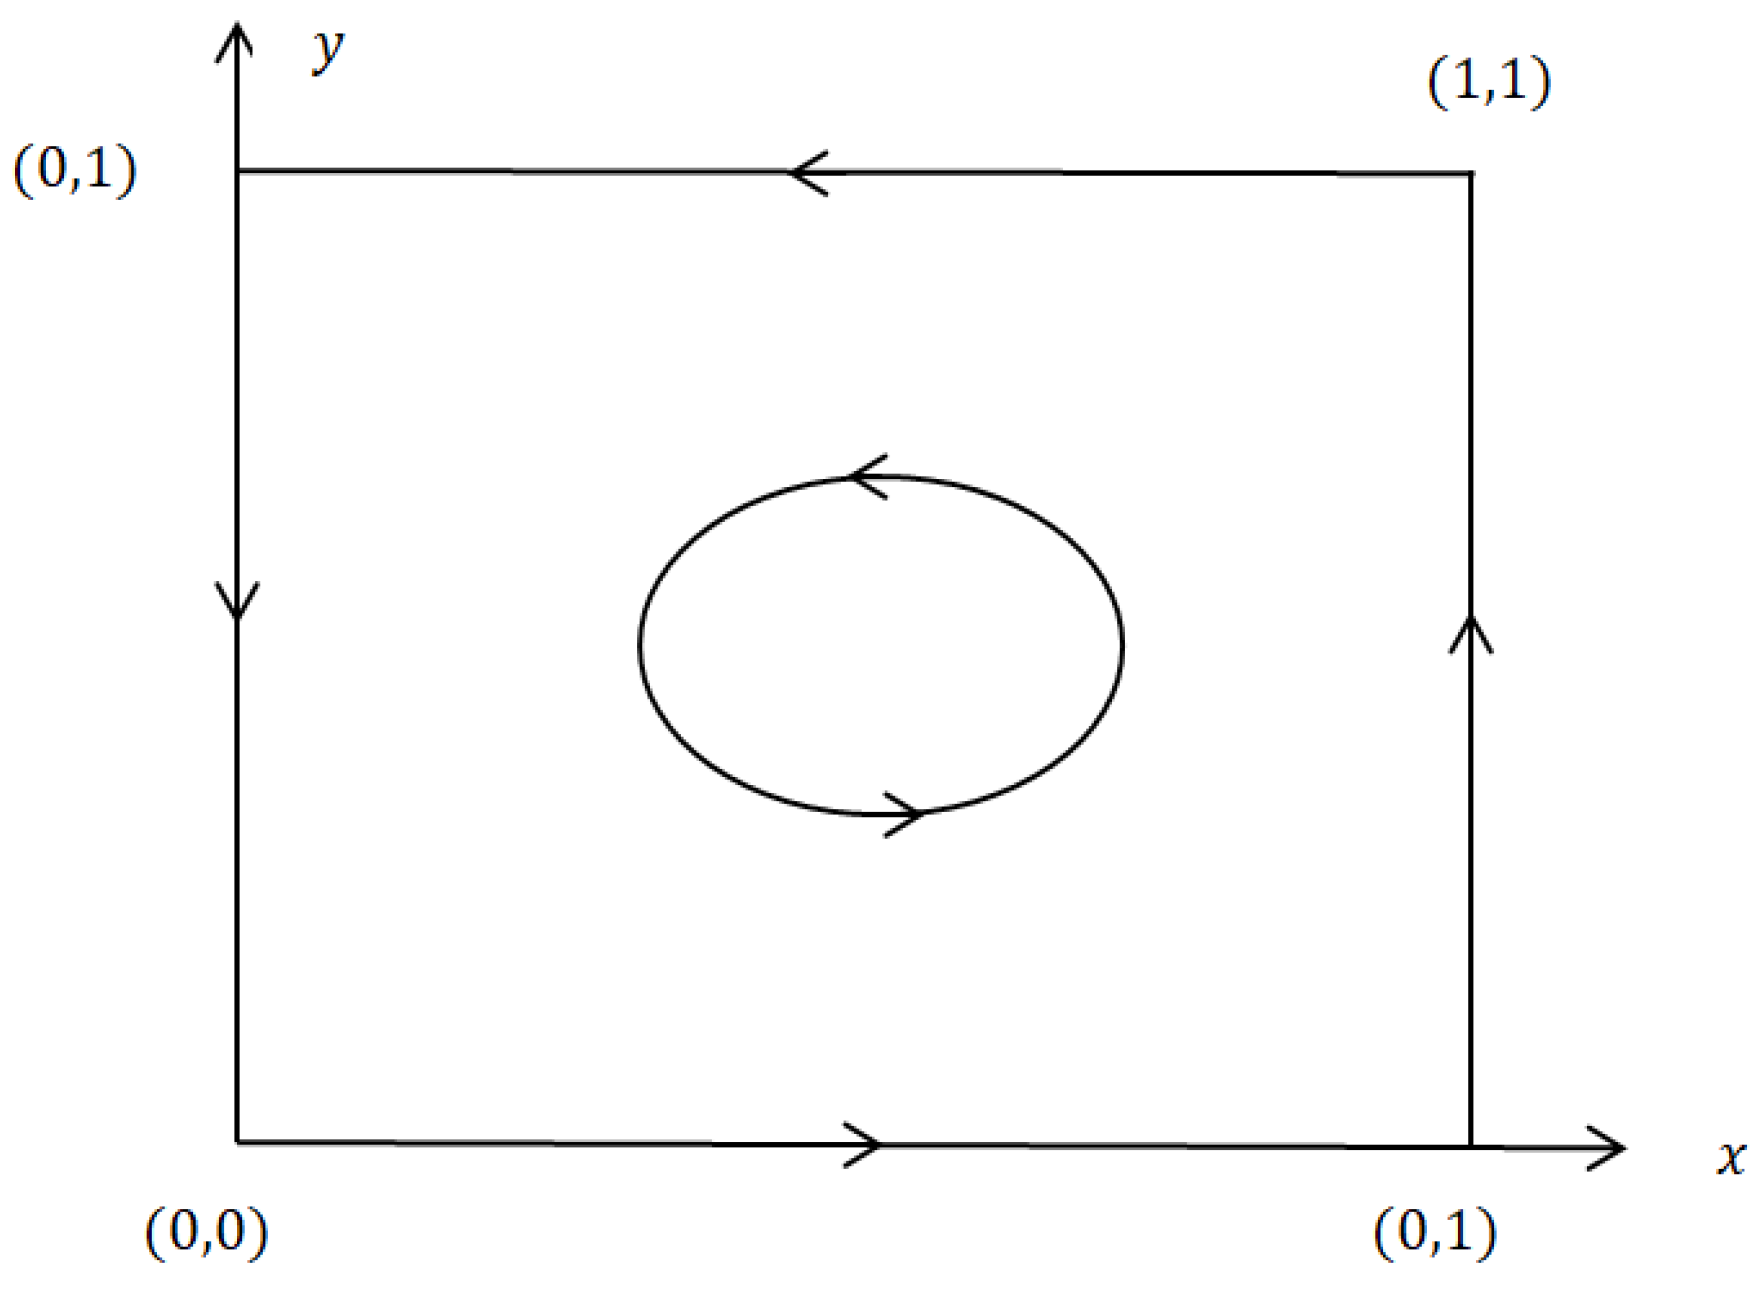
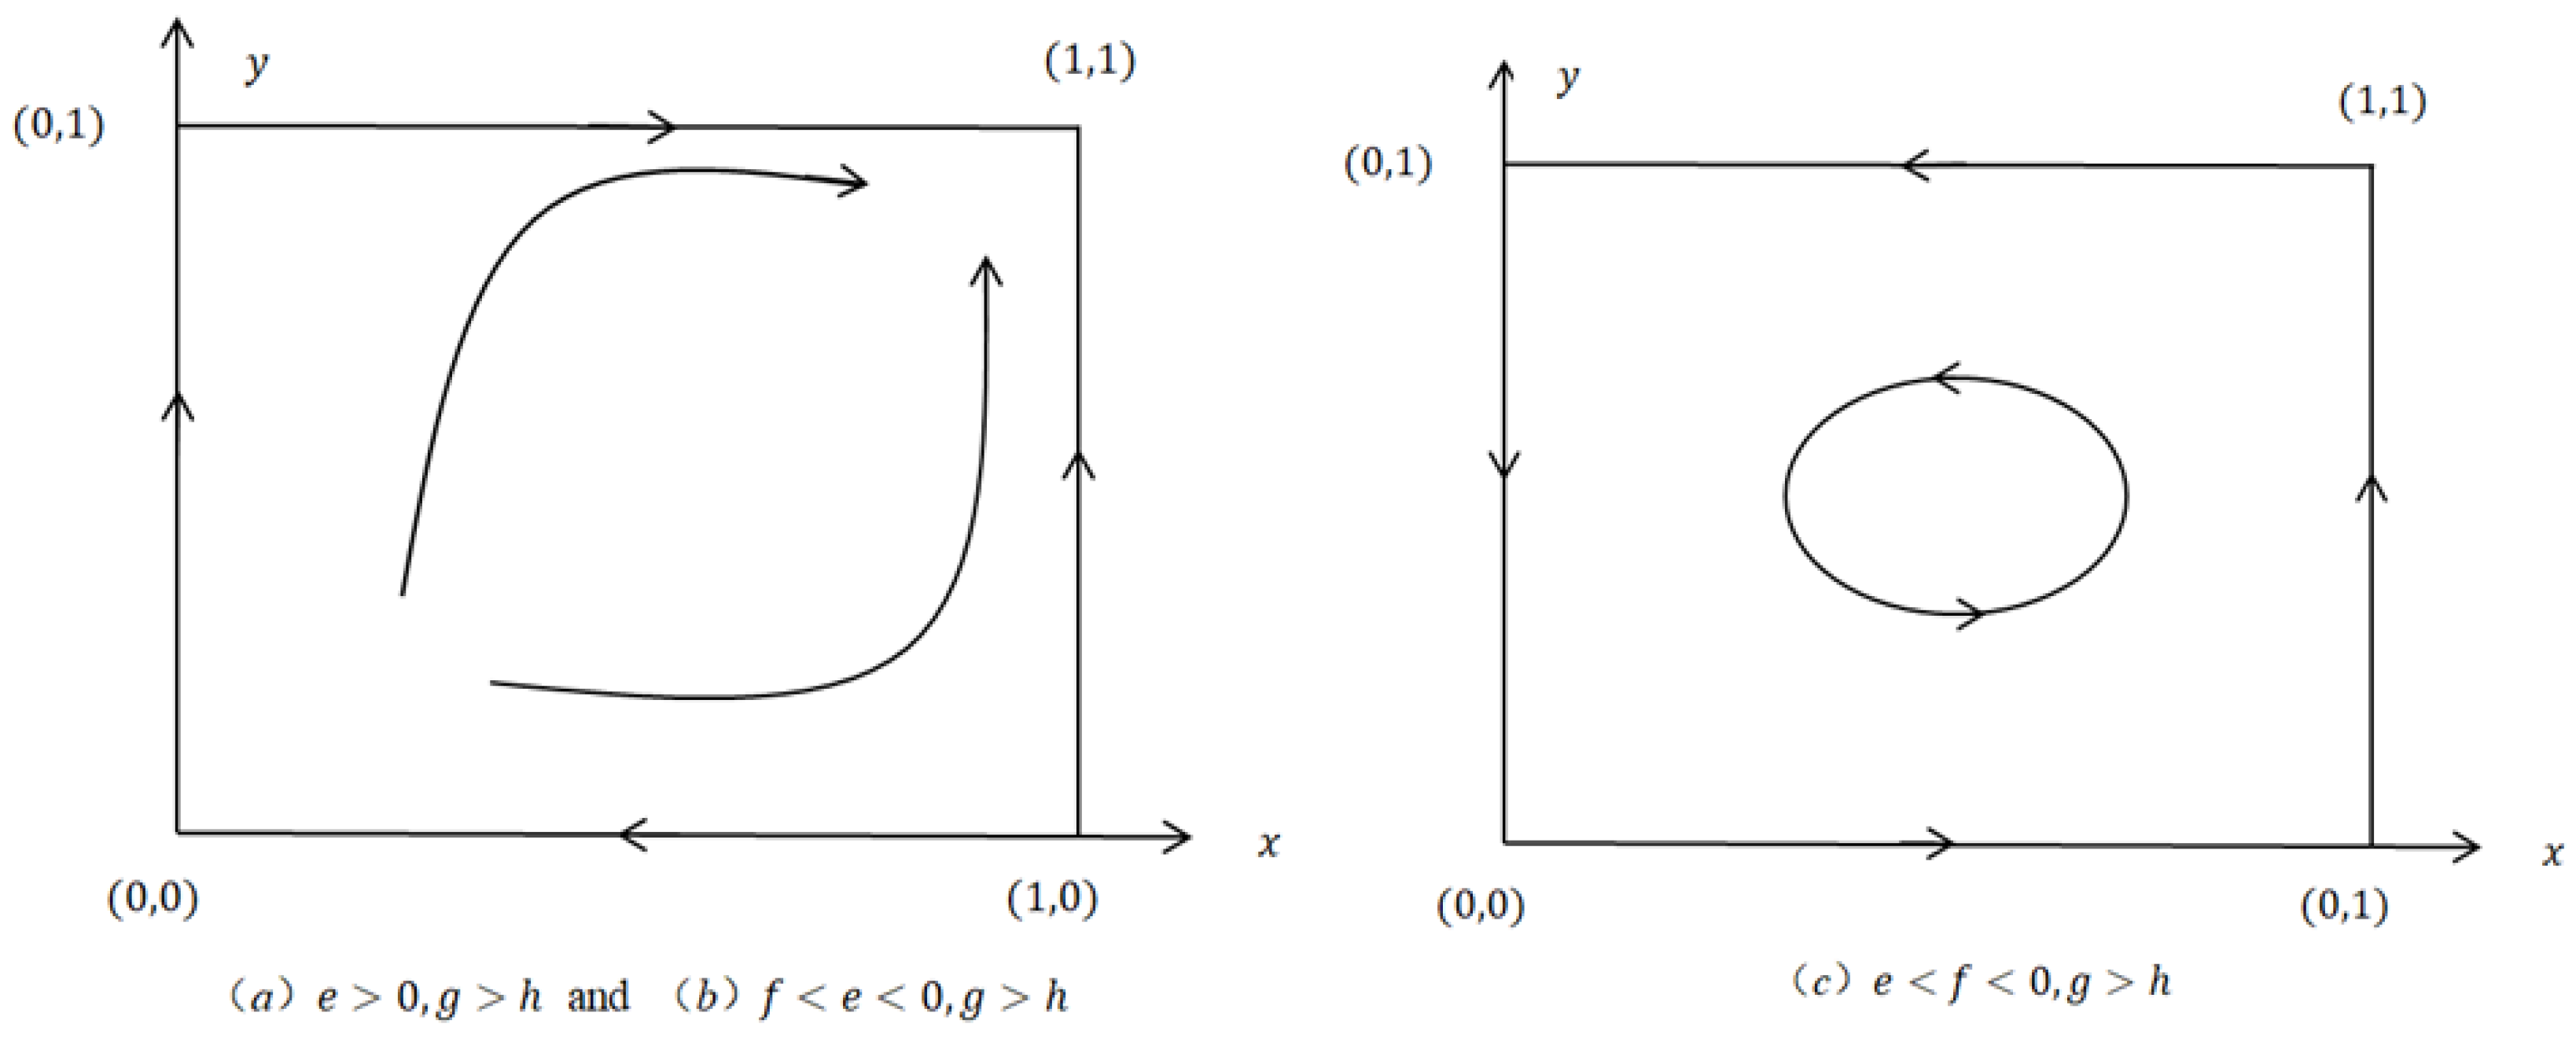
- (2)
- Evolutionary stability analysis of the system
3.2. Evolutionary Game Analysis under Big Data Credit Technology
3.2.1. Game Hypothesis
3.2.2. Model Construct
3.2.3. Model Analysis
- (1)
- The evolution path and evolutionarily stable strategy of MSEs and banks
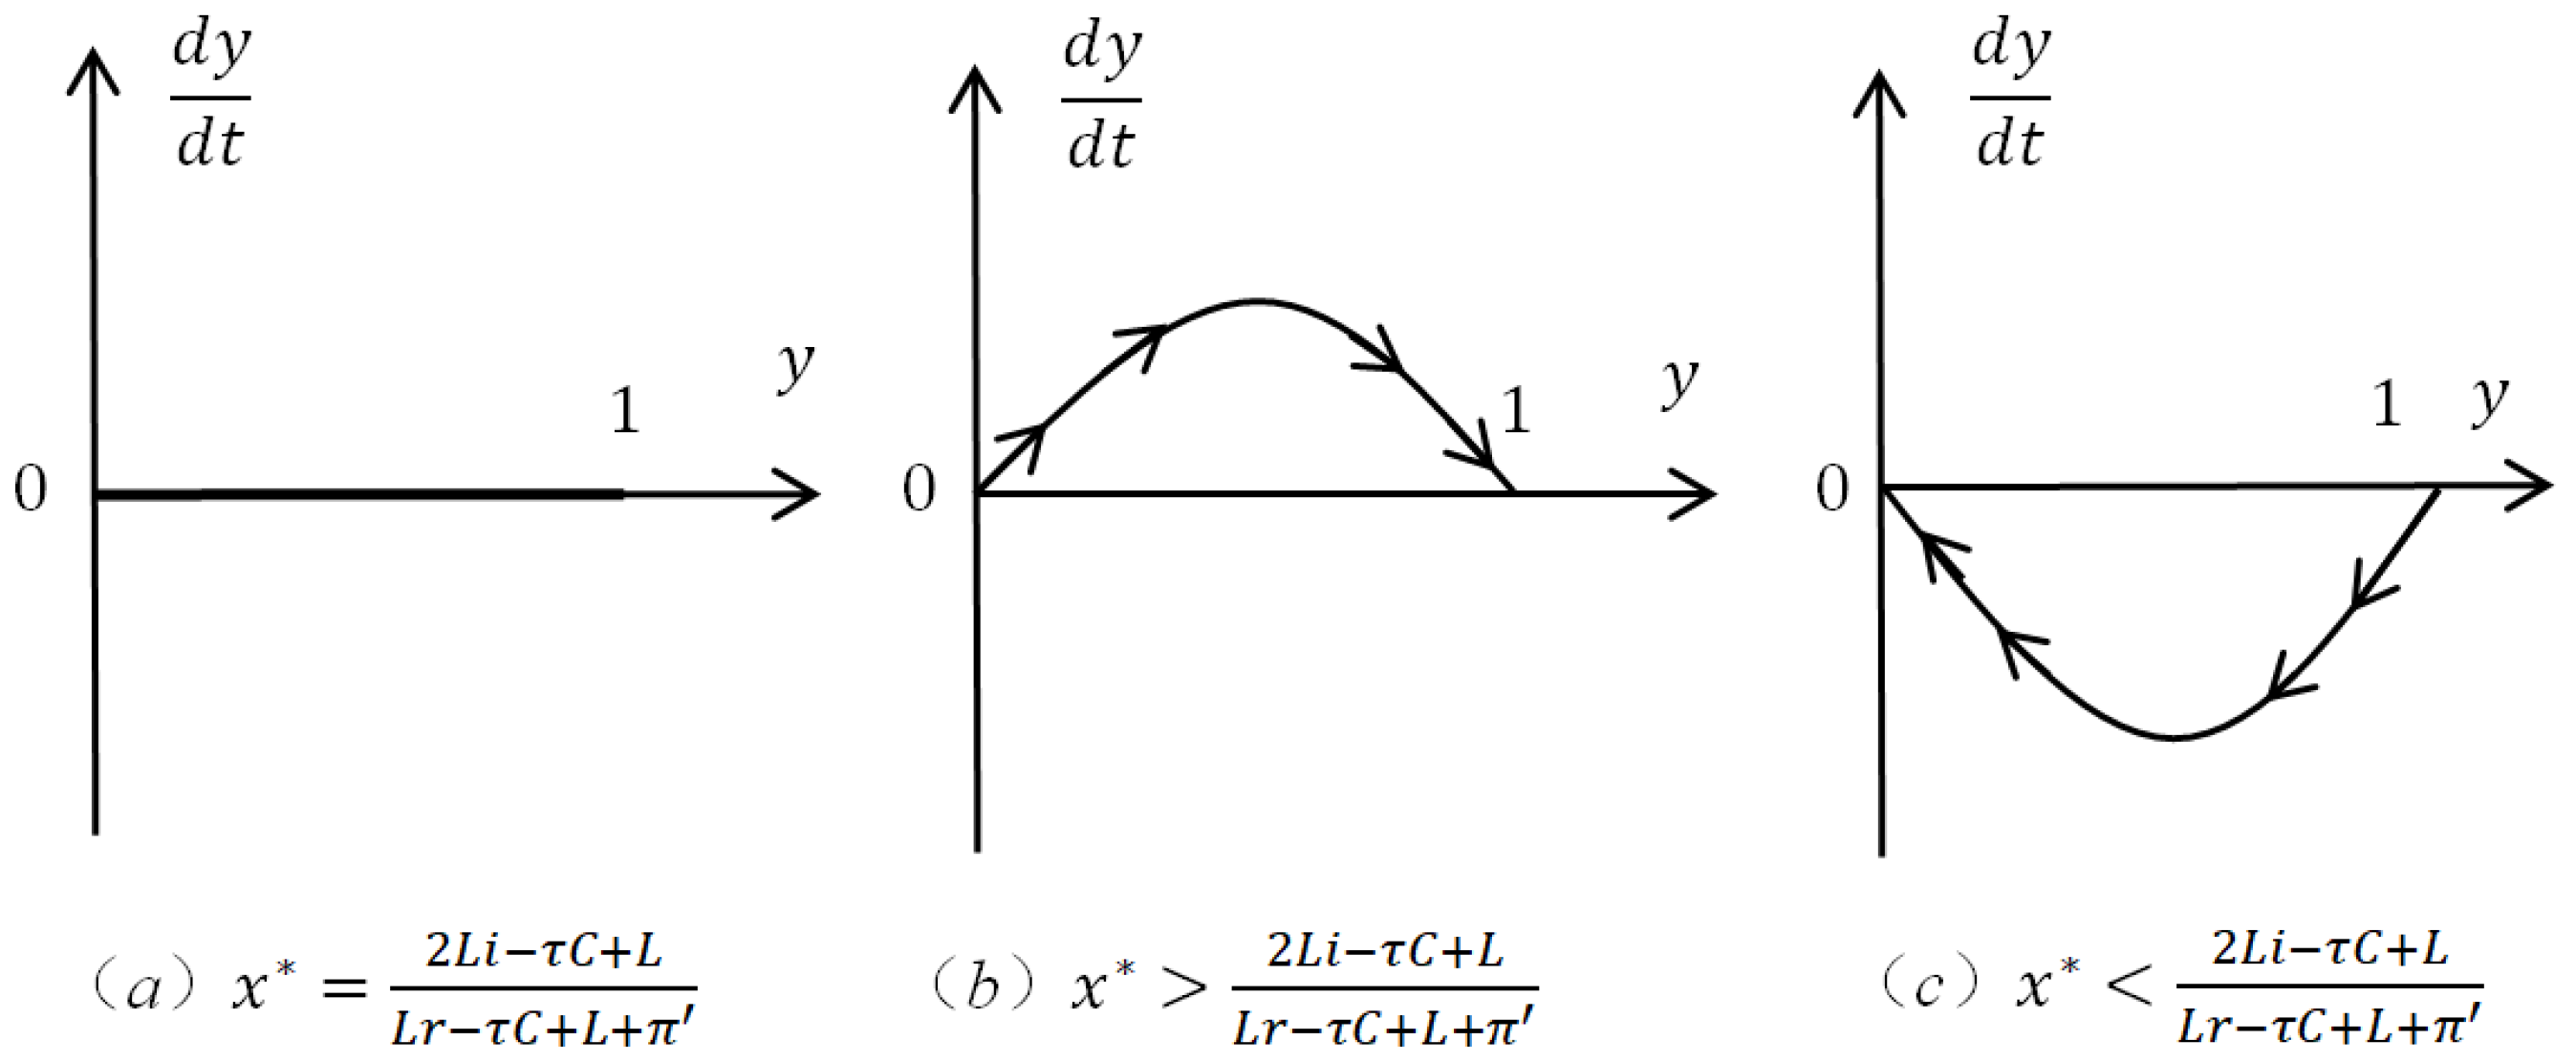
- (a)
- If , always hold; for and , there are and , respectively; therefore, is an evolutionarily stable strategy. The replication dynamics of MSEs are shown in Figure 7b; repaying is an evolutionarily stable strategy for MSEs;
- (b)
- If , always hold; for and , there are and , respectively; therefore, is an evolutionarily stable strategy. The replication dynamics of MSEs are shown in Figure 7c; defaulting is an evolutionarily stable strategy for MSEs;
- (c)
- If ,
- (a)
- When , is an evolutionarily stable strategy; the replication dynamics of banks are shown in Figure 8b. When MSEs choose to repay with a probability higher than , banks will gradually shift from rejecting loans to lending.
- (b)
- When , is an evolutionarily stable strategy; the replication dynamics of banks are shown in Figure 8c. When MSEs choose to repay with a probability less than , rejecting the loan is an evolutionarily stable strategy for banks. The replication dynamic phase diagrams of banks under different circumstances are shown in Figure 8:
- (2)
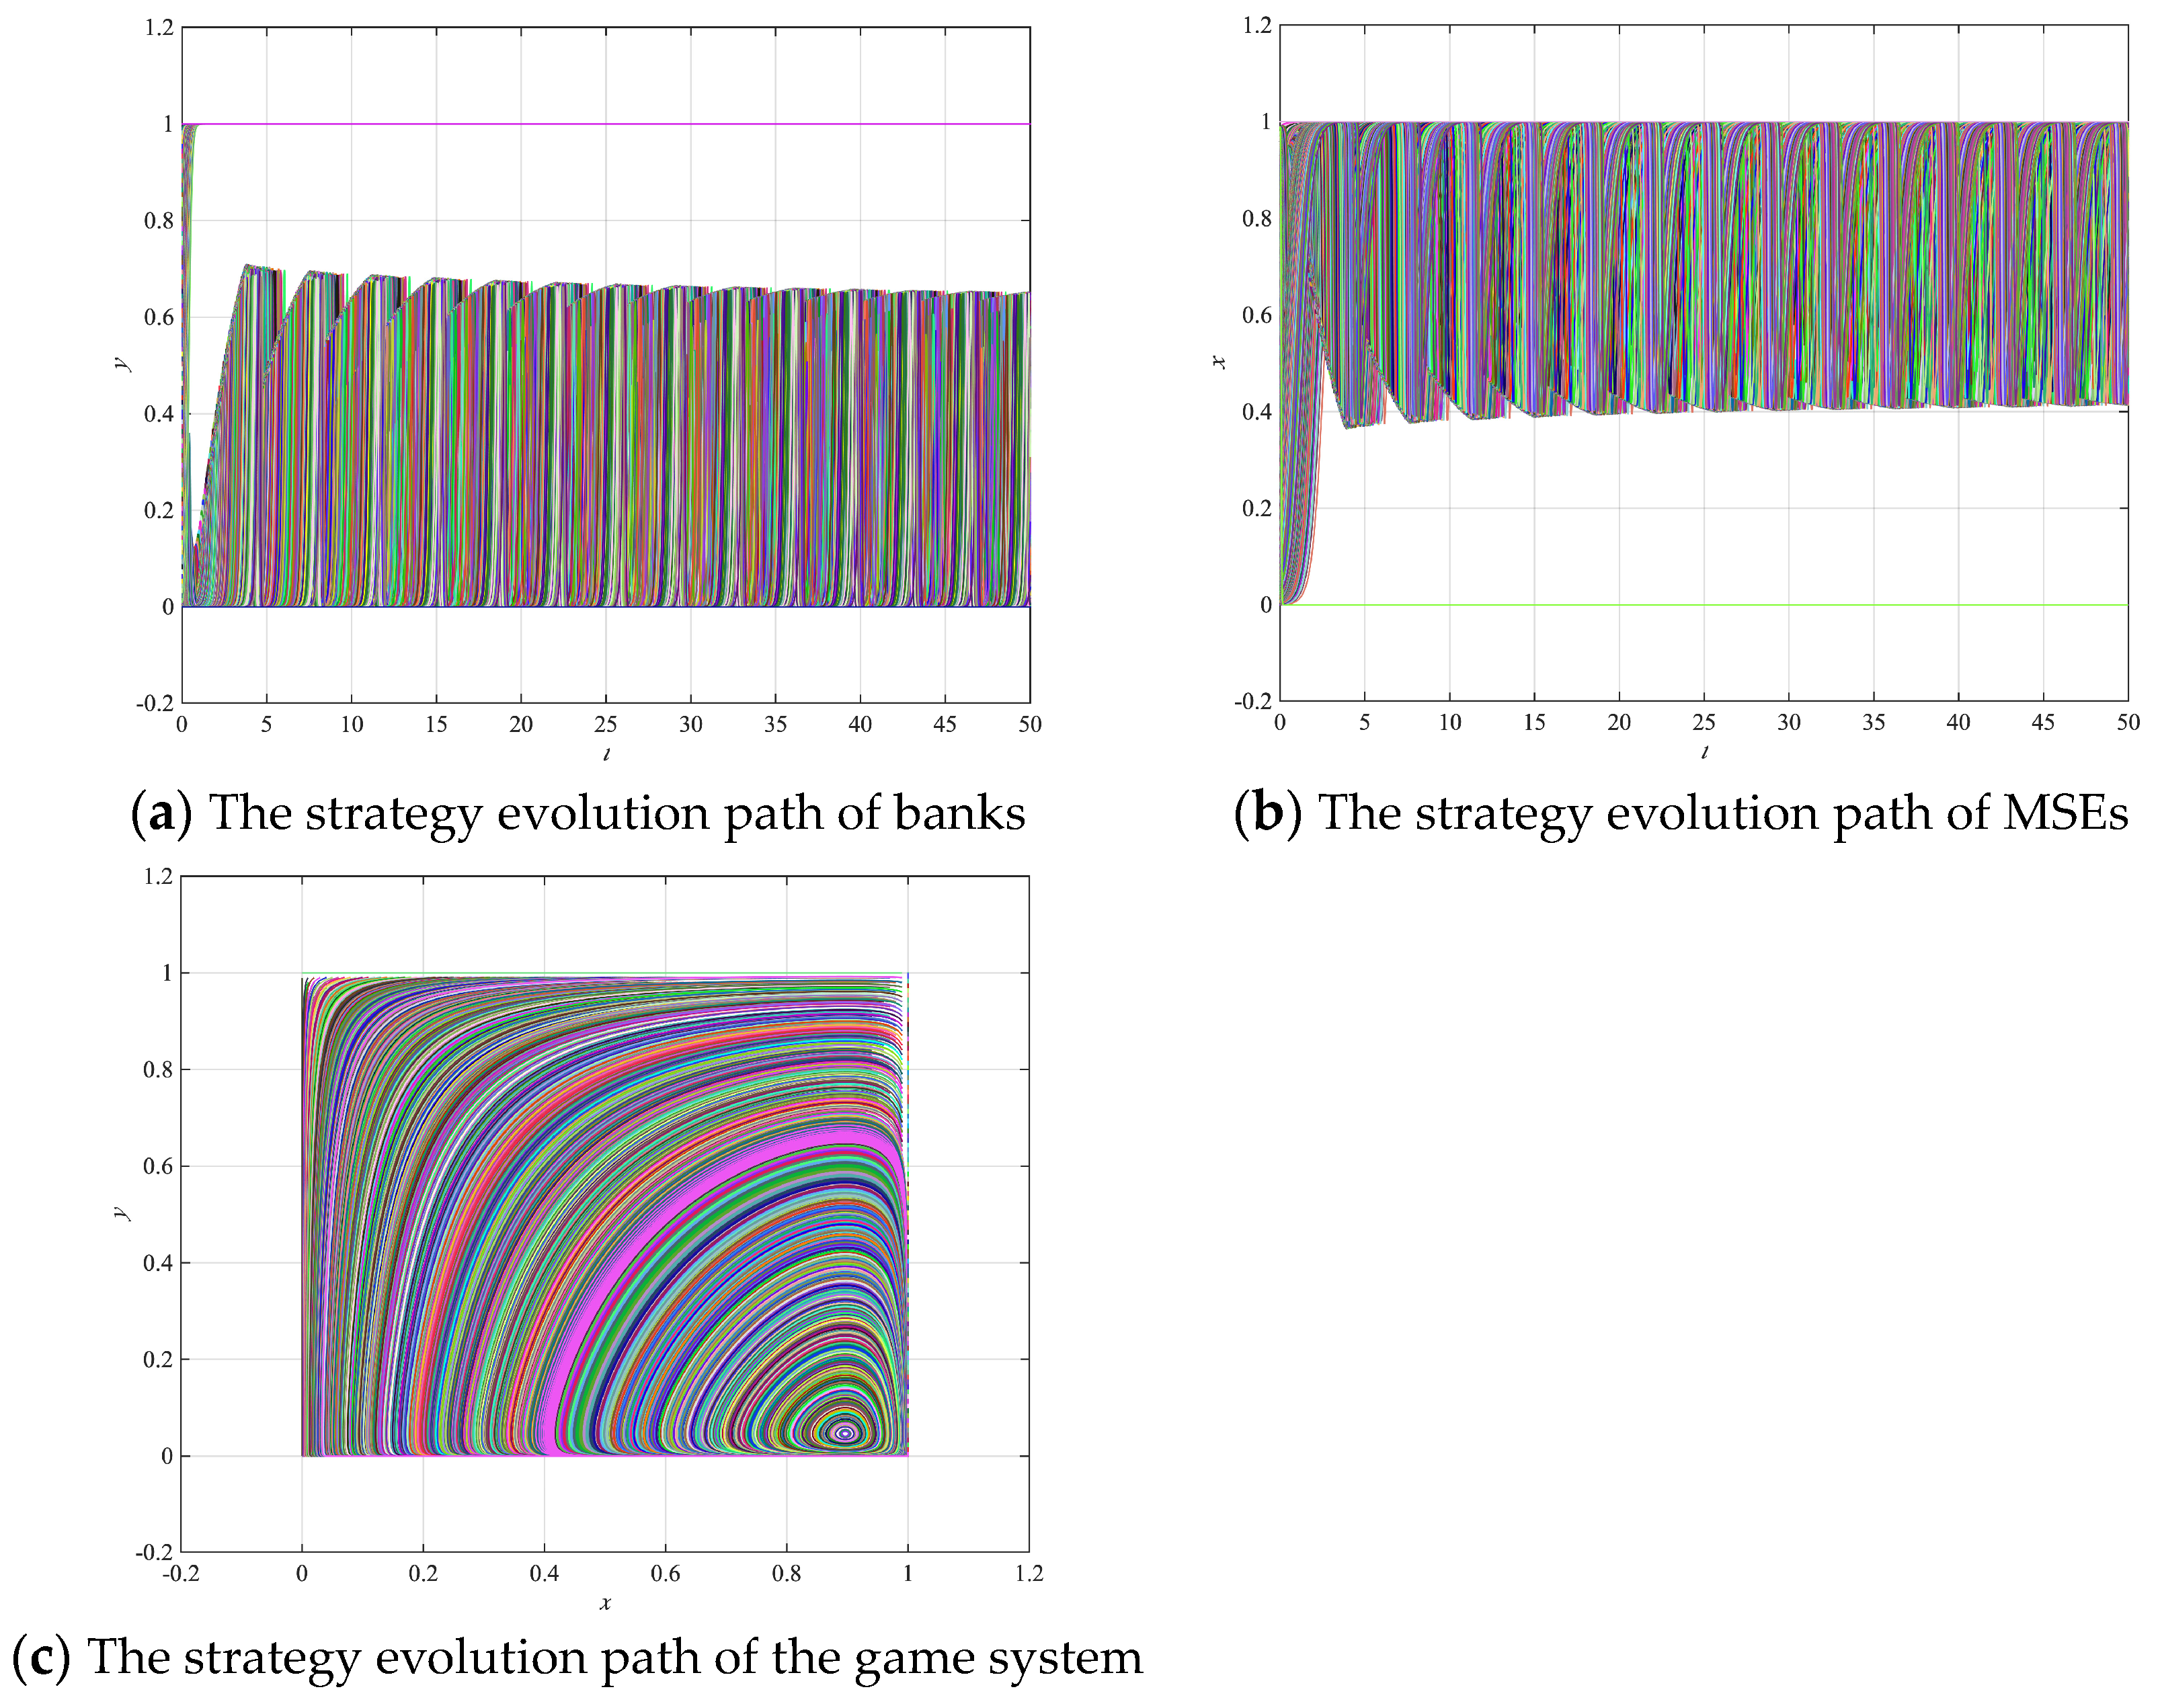
- Evolutionary stability analysis of the system
- (3)
- Model discussion
4. Comparison of MSEs’ Credit Rationing Degree
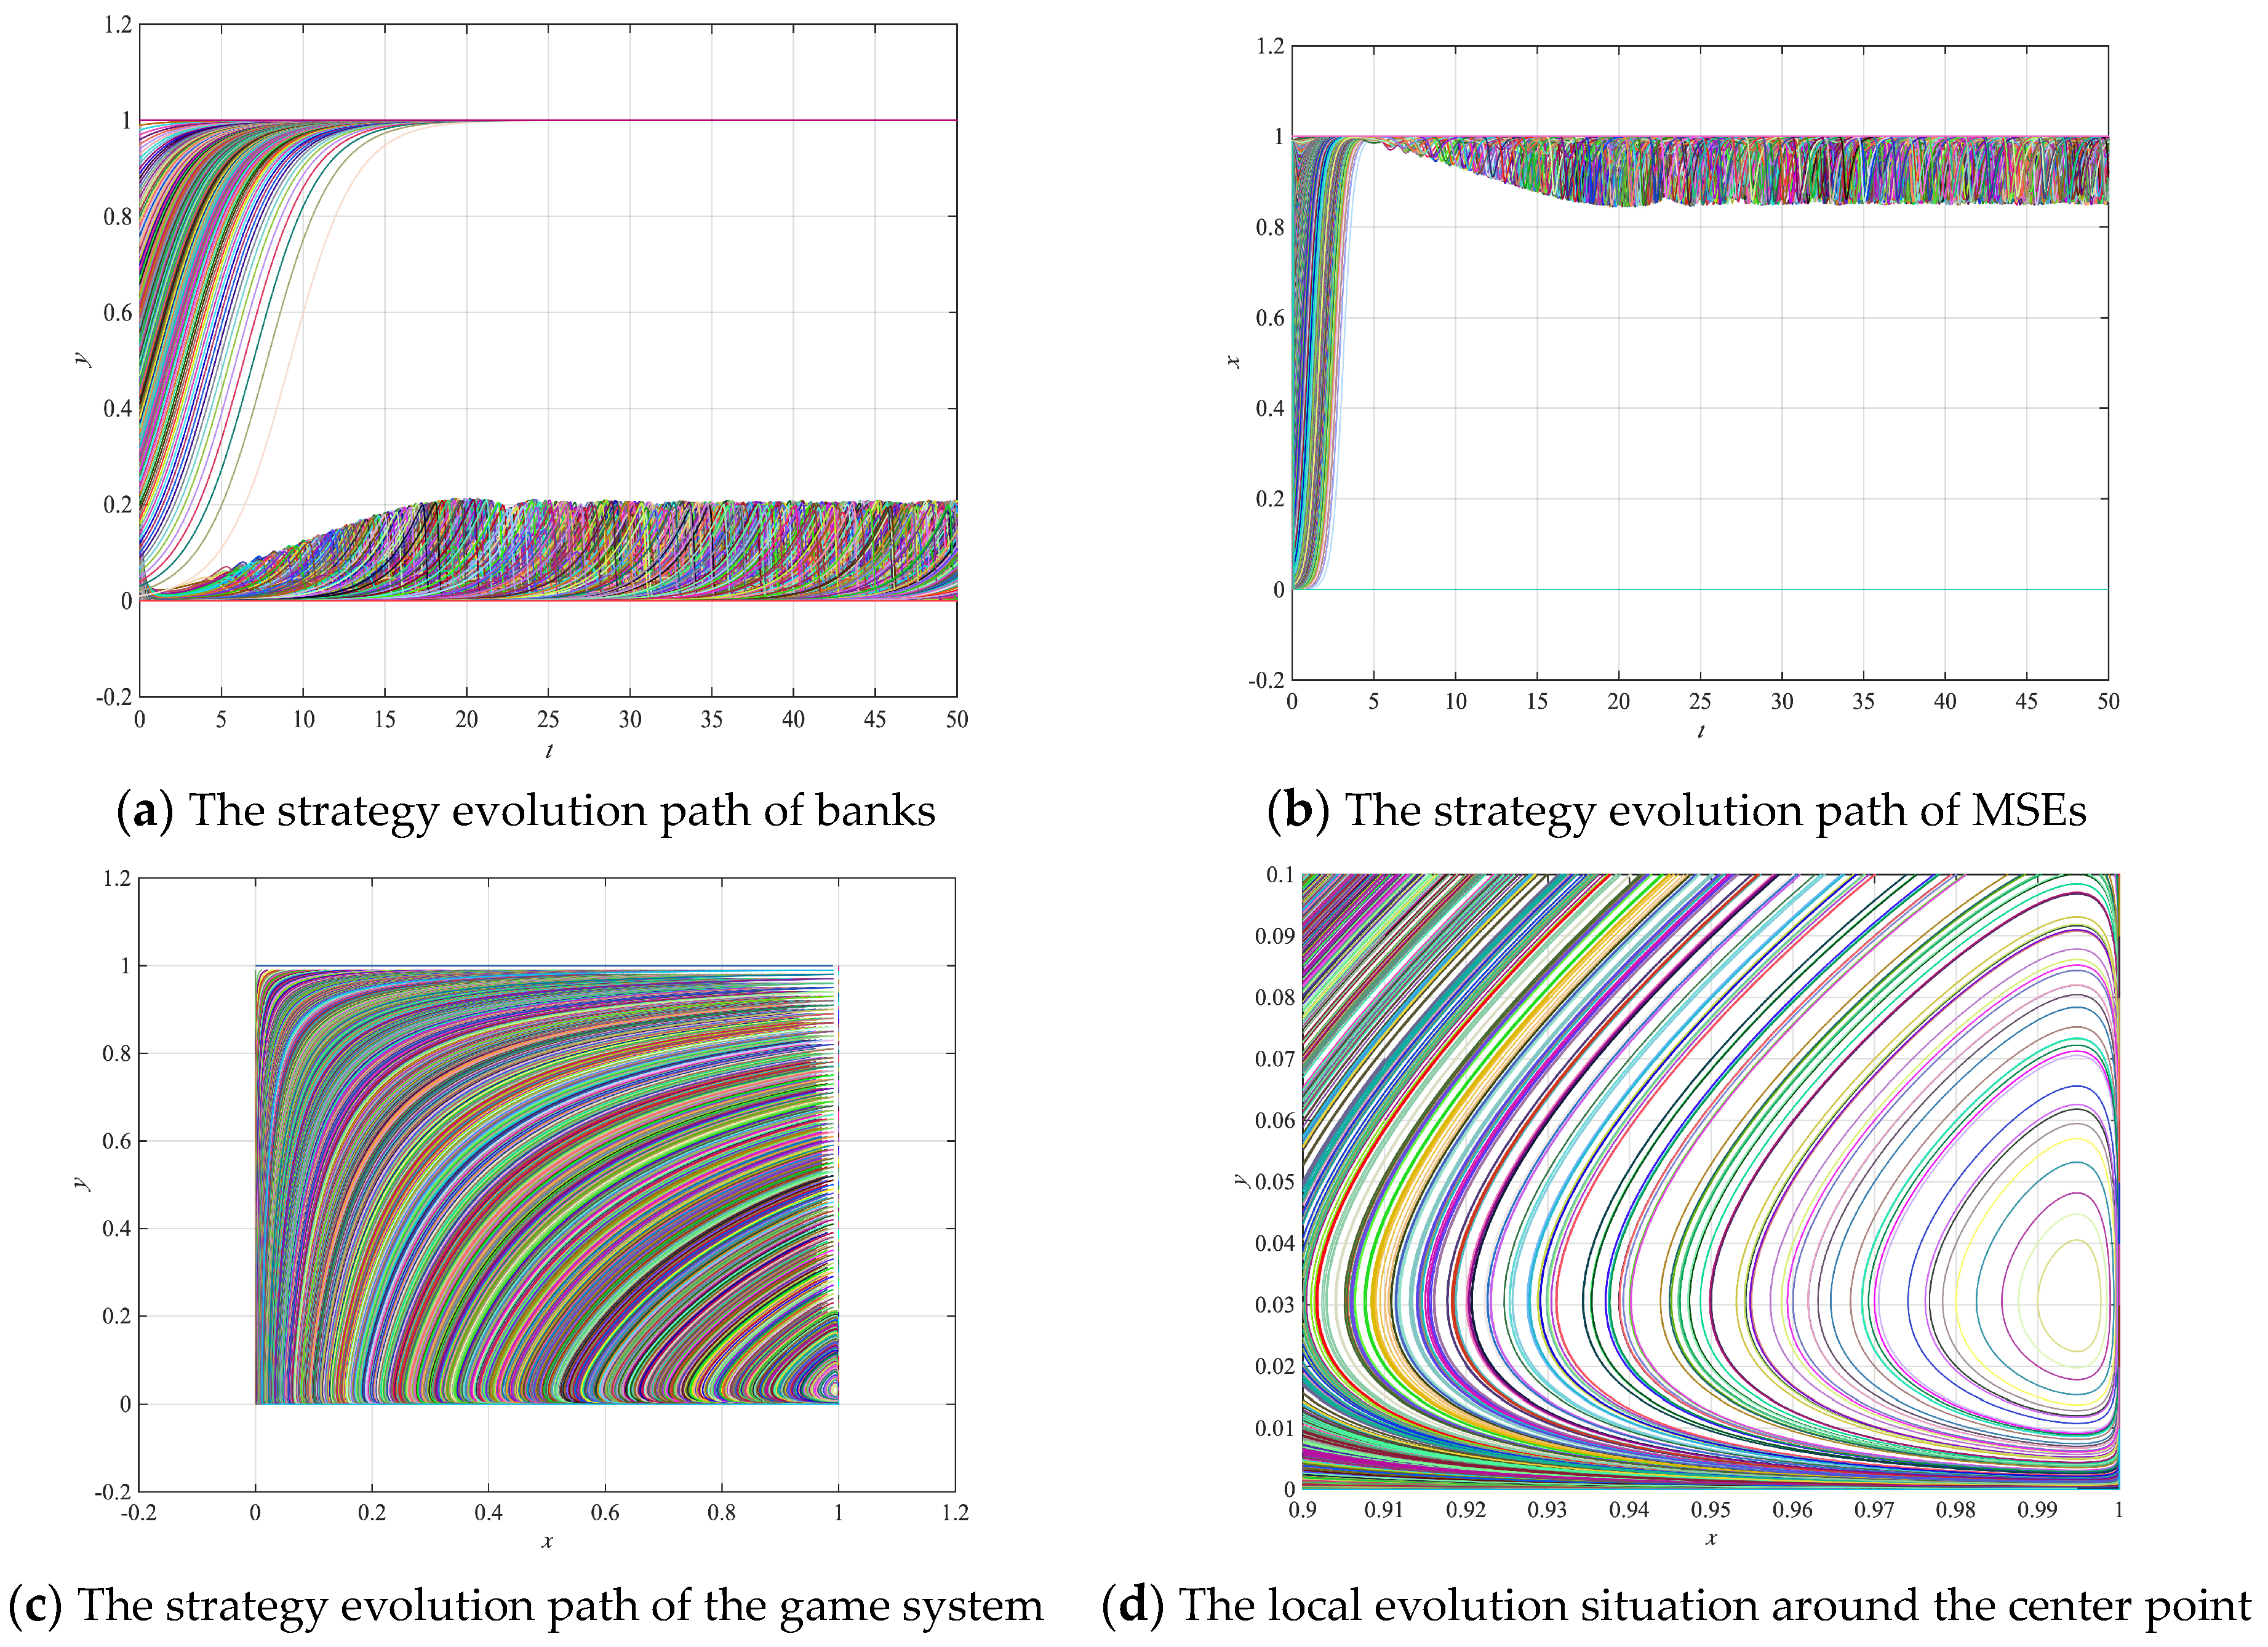
4.1. Simulation Experiment under the Traditional Mode
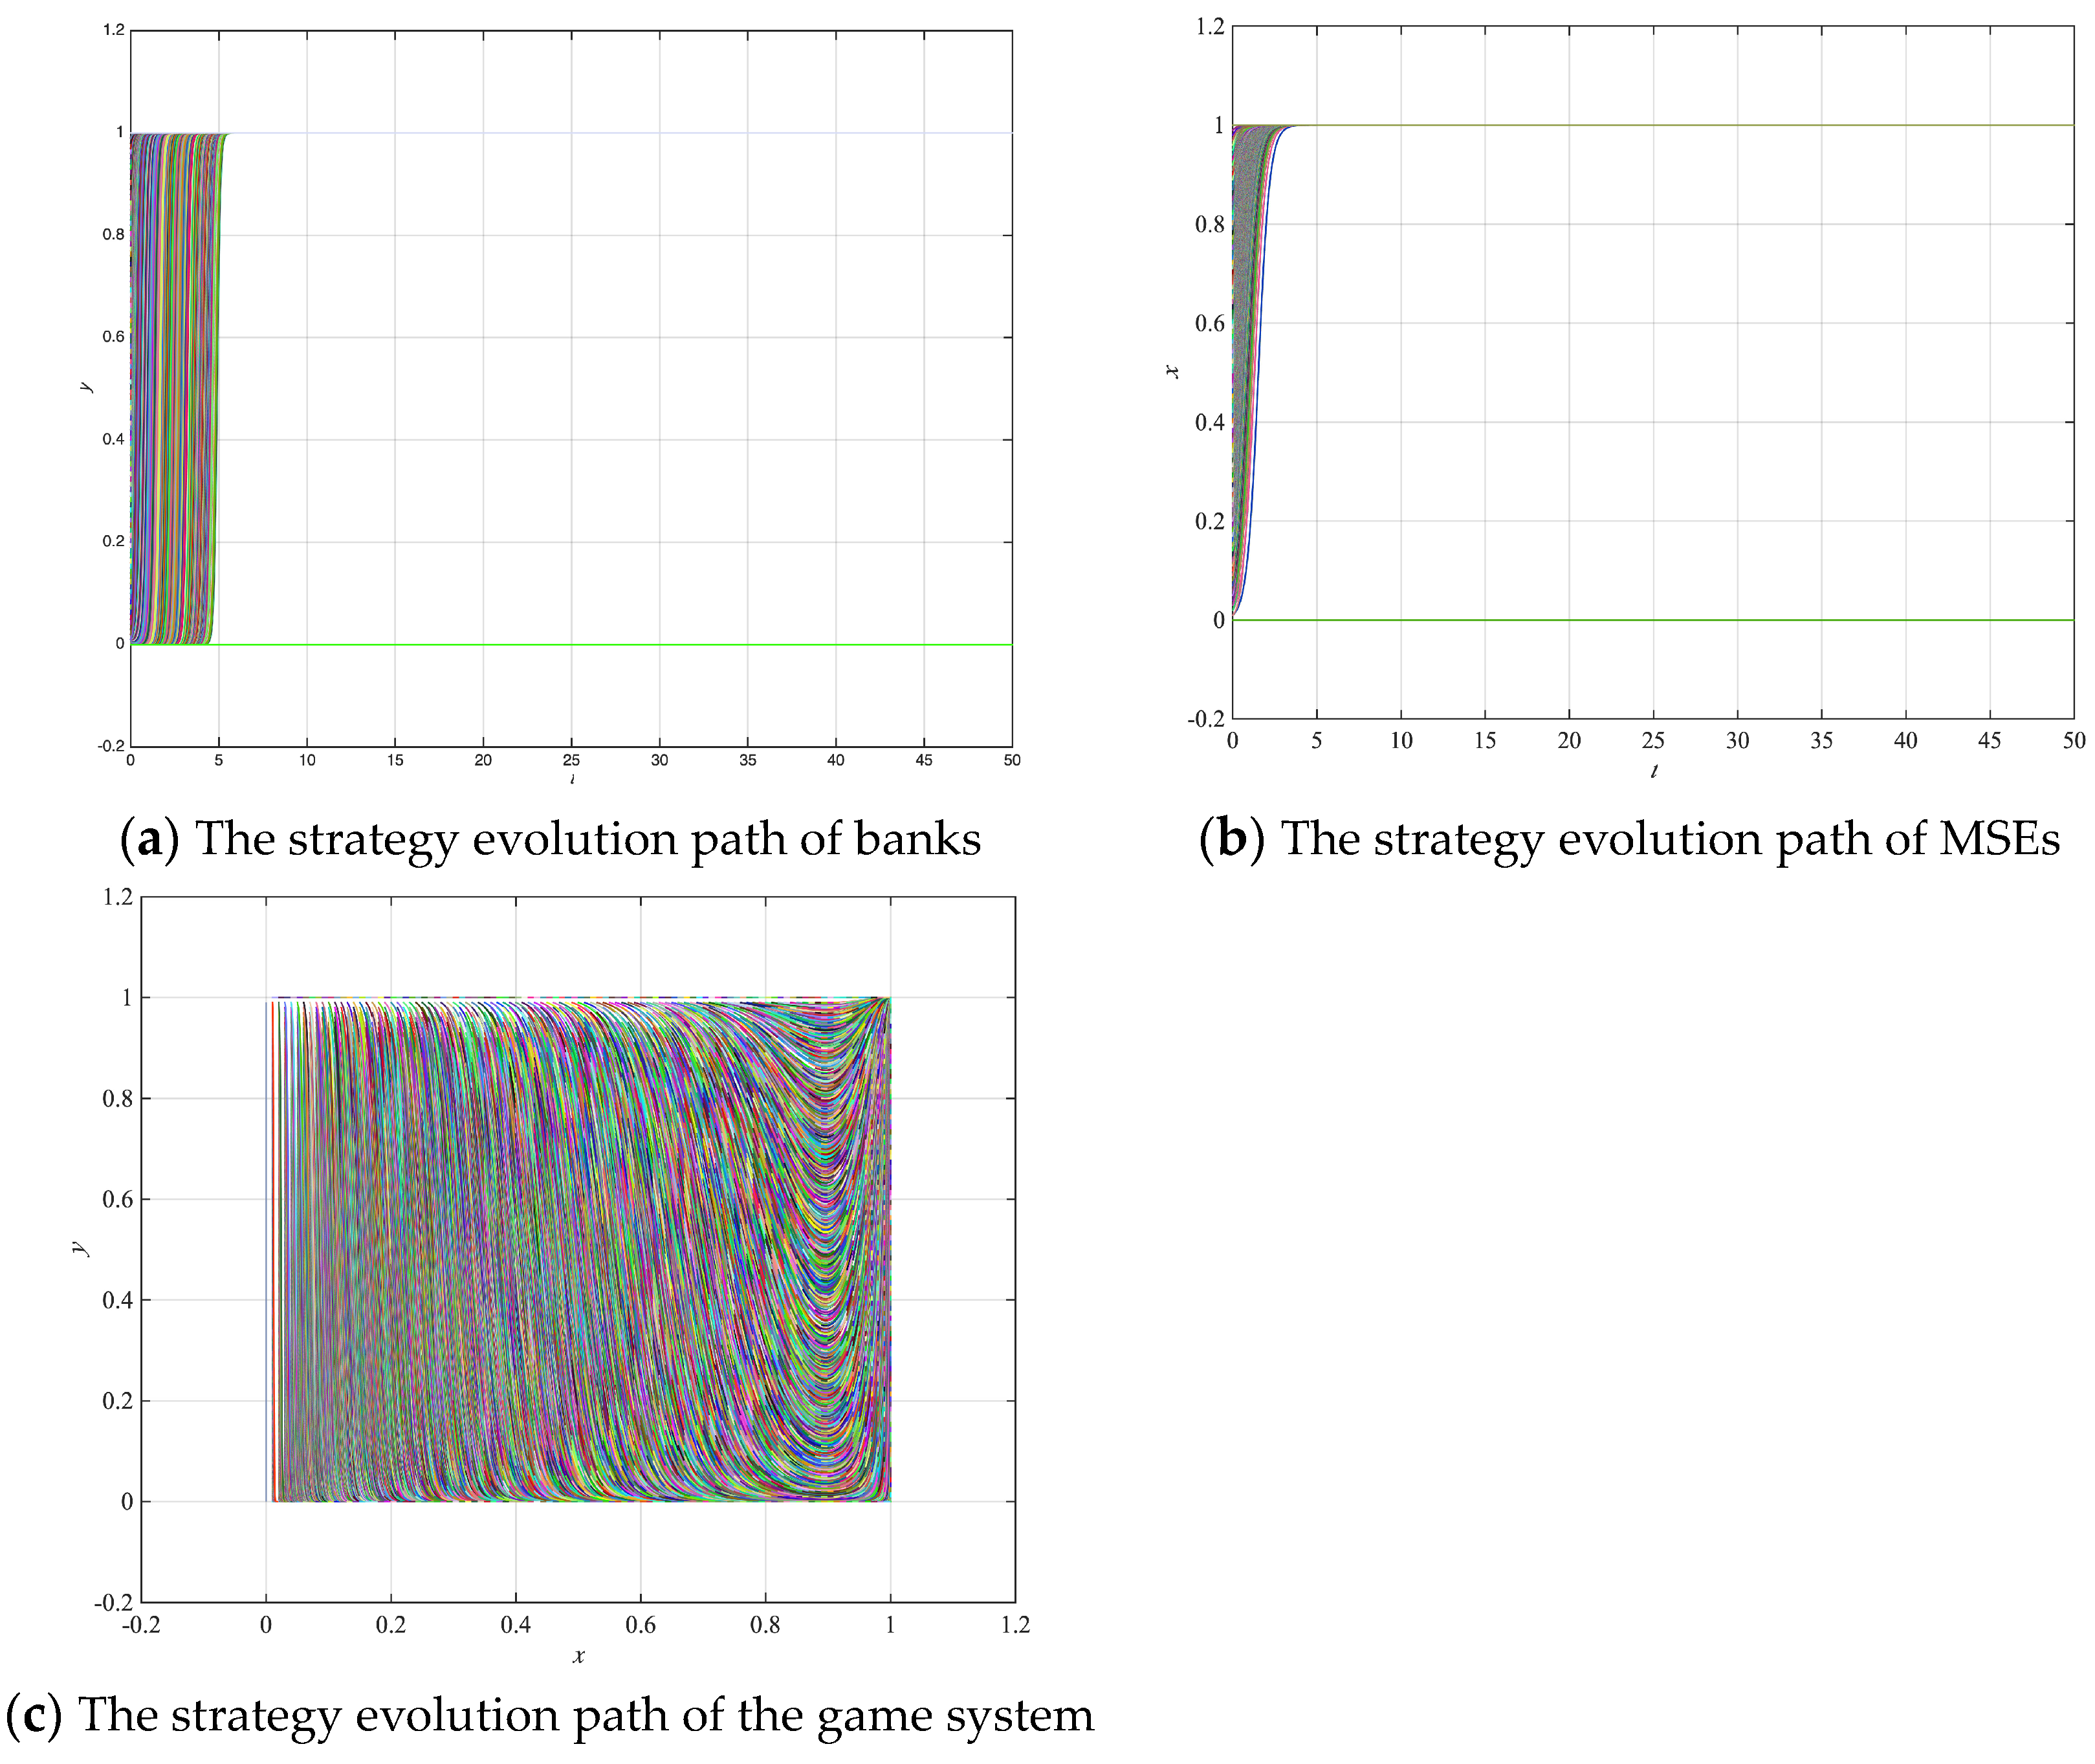
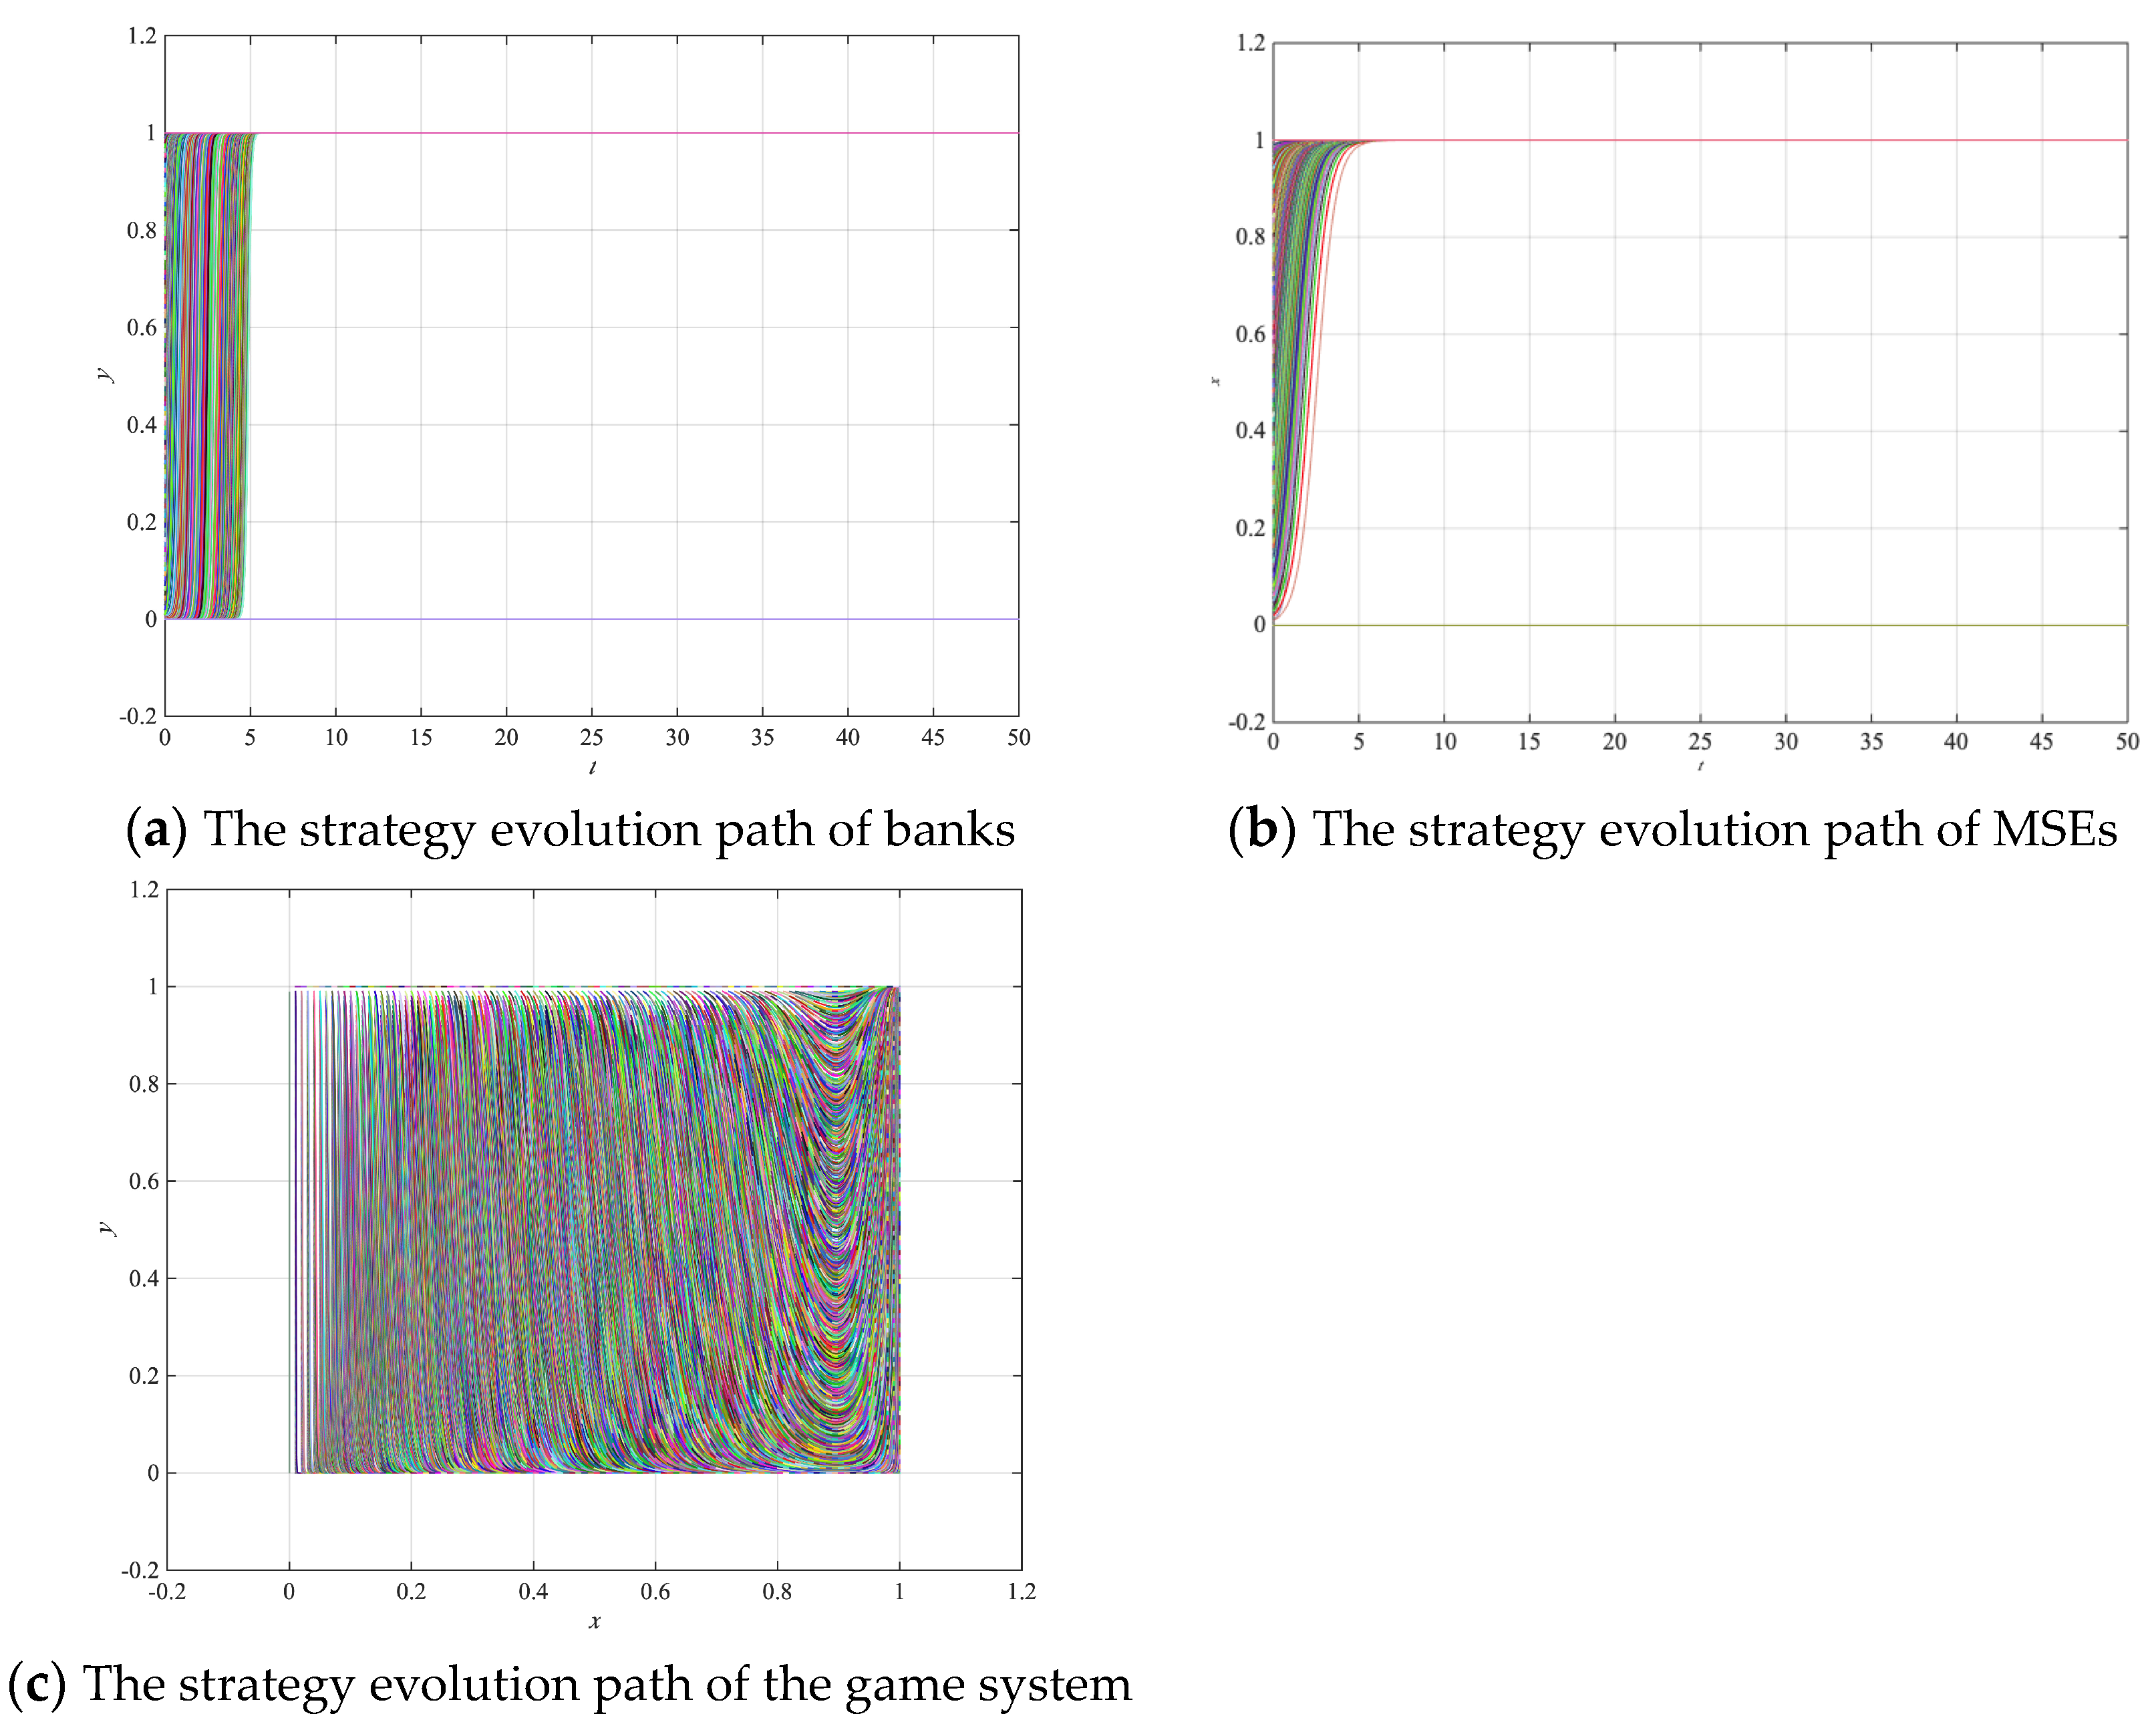
4.2. Simulation Experiment under Big Data Credit Technology
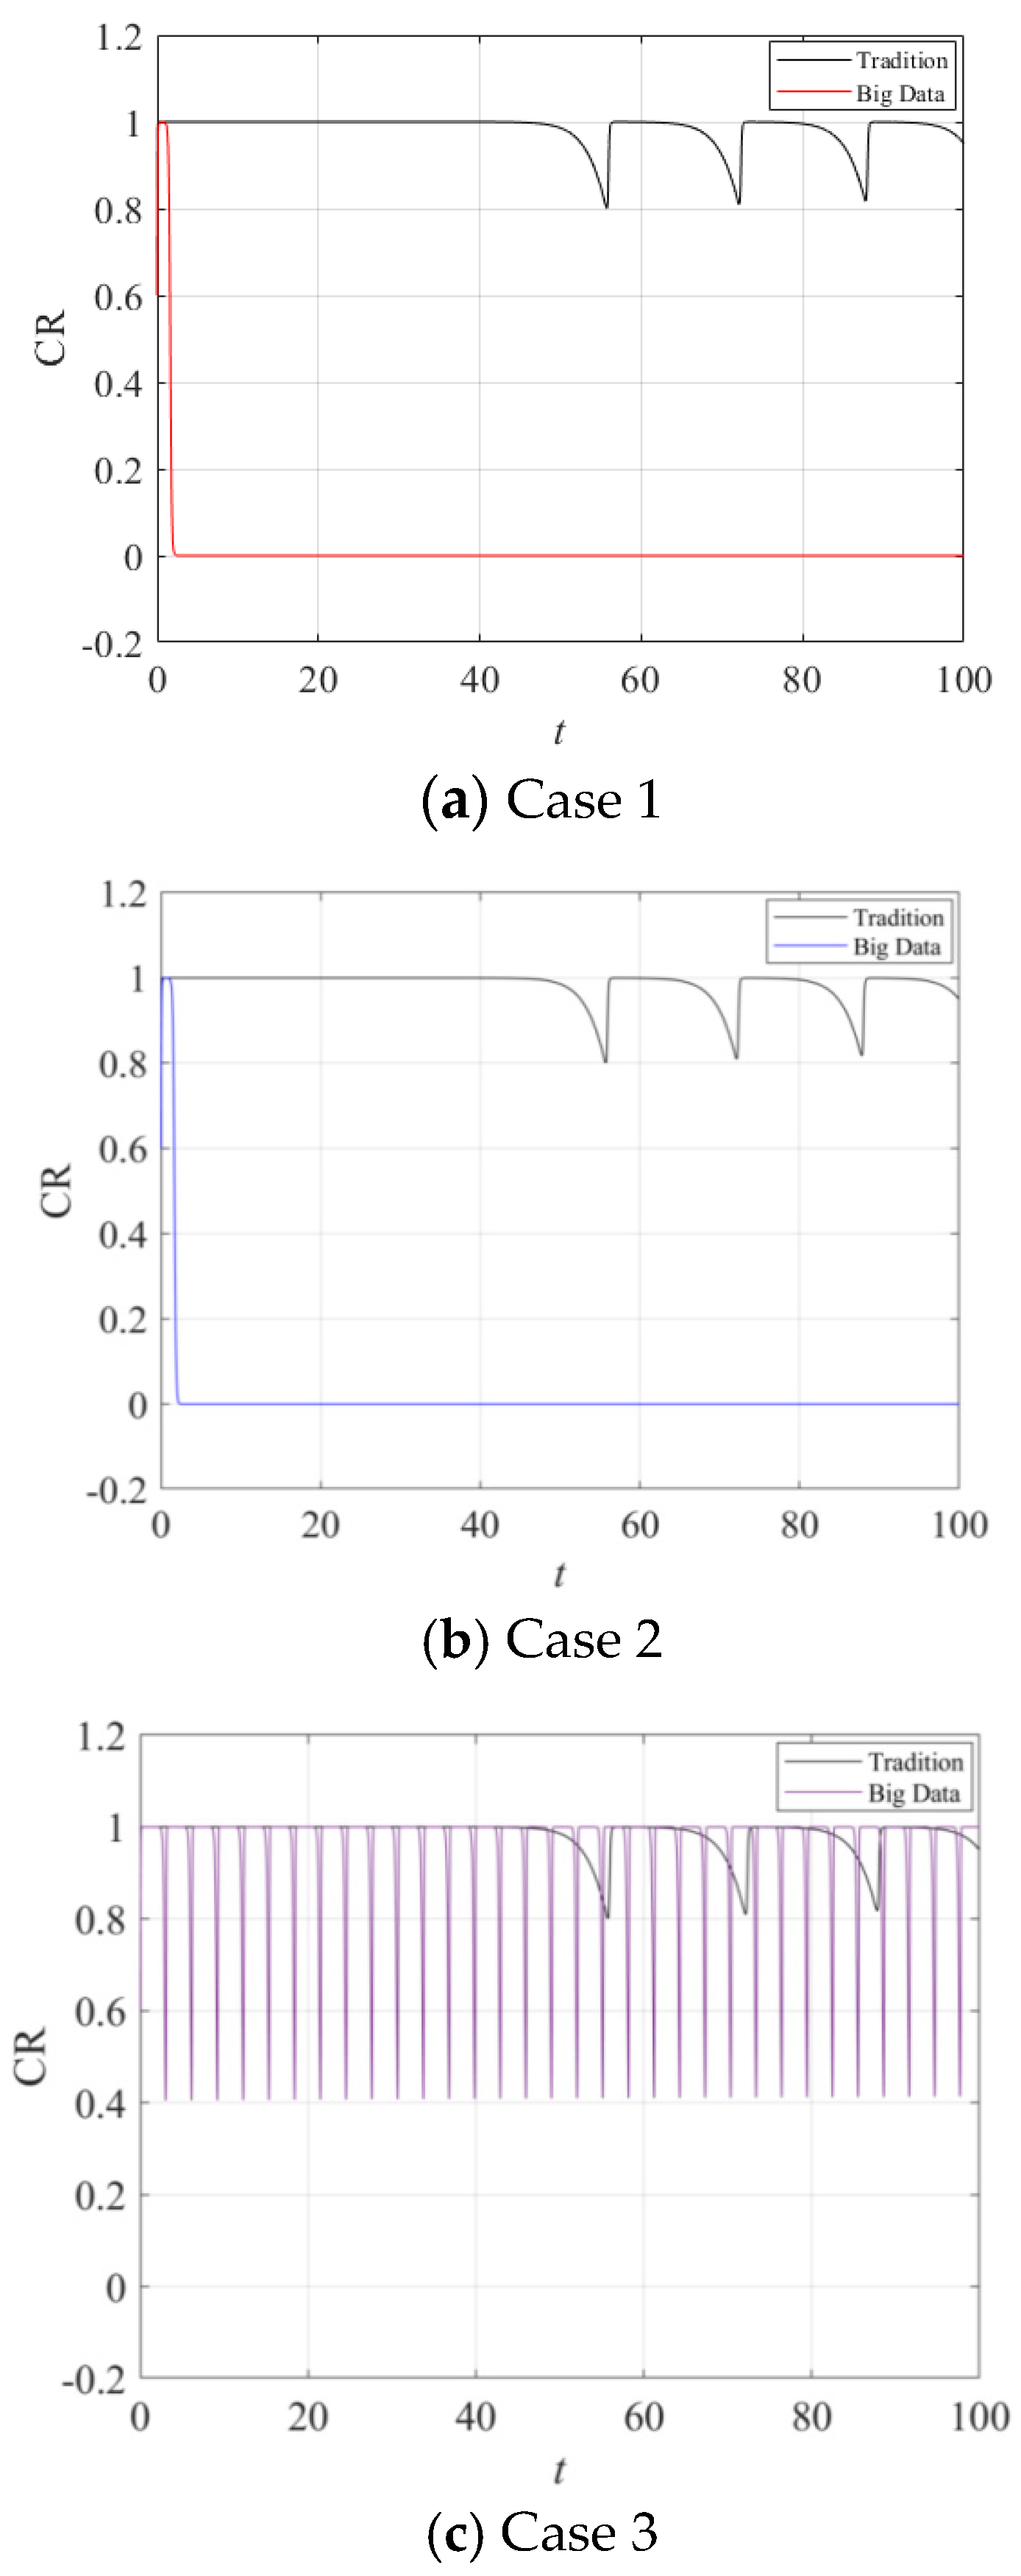
4.3. Comparison of Credit Rationing Degree of MSEs
5. Discussion
5.1. Challenges of Applying Big Data Credit Technology
5.2. Future Prospects
5.3. Contributions
5.4. Implications
6. Concluding Remarks
Author Contributions
Funding
Institutional Review Board Statement
Informed Consent Statement
Data Availability Statement
Conflicts of Interest
References
- Stiglitz, J.E.; Weiss, A. Credit Rationing in Markets with Imperfect Information. Am. Econ. Rev. 1981, 71, 393–410. [Google Scholar]
- Macmillan, H. Report of the Committee on Finance and Industry; CMD 3897; HMSO: London, UK, 1931. [Google Scholar]
- Lu, Z.; Wu, J.; Li, H.; Nguyen, D.K. Local Bank, Digital Financial Inclusion and SME Financing Constraints: Empirical Evidence from China. Emerg. Mark. Financ. Trade 2021, 58, 1712–1725. [Google Scholar] [CrossRef]
- Huber, K. Disentangling the Effects of a Banking Crisis: Evidence from German Firms and Counties. Am. Econ. Rev. 2018, 108, 868–898. [Google Scholar] [CrossRef]
- Moscalu, M.; Girardone, C.; Calabrese, R. SMEs’ Growth under Financing Constraints and Banking Markets Integration in the Euro Area. J. Small Bus. Manag. 2020, 58, 707–746. [Google Scholar] [CrossRef]
- Sen, D.; Ozturk, M.; Vayvay, O. An Overview of Big Data for Growth in SMEs. Procedia-Soc. Behav. Sci. 2016, 235, 159–167. [Google Scholar] [CrossRef]
- Kshetri, N. Big Data’s Role in Expanding Access to Financial Services in China. Int. J. Inf. Manag. 2016, 36, 297–308. [Google Scholar] [CrossRef]
- Wagdi, O.; Tarek, Y. The Integration of Big Data and Artificial Neural Networks for Enhancing Credit Risk Scoring in Emerging Markets: Evidence from Egypt. Int. J. Econ. Financ. 2022, 14, 32–43. [Google Scholar] [CrossRef]
- Vajjhala, N.R.; Ramollari, E. Big Data using Cloud Computing-Opportunities for Small and Medium-sized Enterprises. Eur. J. Econ. Bus. Stud. 2016, 4, 129–137. [Google Scholar] [CrossRef]
- Serena Garralda, J.M.; Tissot, B.; Doerr, S.; Gambacorta, L. Use of Big Data Sources and Applications at Central Banks; IFC Reports 13; Bank for International Settlements: Basel, Switzerland, 2021. [Google Scholar]
- Tsuruta, D. Japan’s Elderly Small Business Managers: Performance and Succession. J. Asian Econ. 2019, 66, 101147. [Google Scholar] [CrossRef]
- Brancati, E. Innovation Financing and the Role of Relationship Lending for SMEs. Small Bus. Econ. 2015, 44, 449–473. [Google Scholar] [CrossRef]
- Thuku, A.G. Factors Affecting Access to Credit by Small and Medium Enterprises in Kenya: A Case Study of Agriculture Sector in Nyeri County. Ph.D. Thesis, United States International University, Kenya, Africa, 2017. [Google Scholar]
- Bai, M.; Cai, J.; Qin, Y. Ownership Discrimination and Private Firms Financing in China. Res. Int. Bus. Financ. 2021, 57, 101406. [Google Scholar] [CrossRef]
- Kofarmata, Y.I.; Danlami, A.H. Determinants of Credit Rationing among Rural Farmers in Developing Areas. Agric. Financ. Rev. 2019, 79, 158–173. [Google Scholar] [CrossRef]
- Kira, A.; He, Z. The Impact of Firm Characteristics in Access of Financing by Small and Medium-sized Enterprises in Tanzania. Int. J. Bus. Manag. 2012, 7, 108–119. [Google Scholar] [CrossRef]
- Nguyen, H.; Qian, R. The Cross-Country Magnitude and Determinants of Collateral Borrowing; Policy Research Working Paper, No. 6001; World Bank: Washington, DC, USA, 2012; Available online: http://hdl.handle.net/10986/19878 (accessed on 20 May 2023).
- Moro, A.; Maresch, D.; Fink, M.; Ferrando, A.; Piga, C. Spillover Effects of Government Initiatives Fostering Entrepreneurship on the Access to Bank Credit for Entrepreneurial Firms in Europe. J. Corp. Financ. 2020, 62, 101603. [Google Scholar] [CrossRef]
- Calabrese, R.; Girardone, C.; Sclip, A. Financial Fragmentation and SMEs’ Access to Finance. Small Bus. Econ. 2021, 57, 2041–2065. [Google Scholar] [CrossRef]
- Aristei, D.; Gallo, M. Are Female-led Firms Disadvantaged in Accessing Bank Credit? Evidence from Transition Economies. Int. J. Emerg. Mark. 2022, 17, 1484–1521. [Google Scholar] [CrossRef]
- Beyhaghi, M.; Firoozi, F.; Jalilvand, A.; Samarbakhsh, L. Components of Credit Rationing. J. Financ. Stab. 2020, 50, 100762. [Google Scholar] [CrossRef]
- Long, J.; Jiang, C.; Dimitrov, S.; Wang, Z. Clues from Networks: Quantifying Relational Risk for Credit Risk Evaluation of SMEs. Financ. Innov. 2022, 8, 91. [Google Scholar] [CrossRef]
- Blanchflower, D.G.; Levine, P.B.; Zimmerman, D.J. Discrimination in the Small-Business Credit Market. Rev. Econ. Stat. 2003, 85, 930–943. [Google Scholar] [CrossRef]
- Masiak, C.; Block, J.; Moritz, A.; Lang, F.; Kraemer-Eis, H. How do Micro Firms Differ in Their Financing Patterns from Larger SMEs? Ventur. Cap. 2019, 21, 301–325. [Google Scholar] [CrossRef]
- De Jonghe, O.; Dewachter, H.; Mulier, K.; Ongena, S.; Schepens, G. Some Borrowers are More Equal than Others: Bank Funding Shocks and Credit Reallocation. Rev. Financ. 2020, 24, 1–43. [Google Scholar]
- Sun, H.; Cen, L.; Jiang, N. Our Empirical Study of Bank Loans Accessibility Influence Factors for SMEs. In Proceedings of the 2013 International Conference on Advanced ICT and Education, Hainan, China, 20–22 September 2013. [Google Scholar]
- Kariya, A. Earnings-Based Borrowing Constraints & Corporate Investments in 2007–09 Financial Crisis. J. Corp. Financ. 2022, 75, 102227. [Google Scholar]
- Shi, Y.; Li, J.; Liu, R. Financing Constraints and Share Pledges: Evidence from the Share Pledge Reform in China. J. Corp. Financ. 2023, 78, 102337. [Google Scholar] [CrossRef]
- Guo, J.; Fang, H.; Liu, X.; Wang, C.; Wang, Y. FinTech and Financing Constraints of Enterprises: Evidence from China. J. Int. Financ. Mark. Inst. Money 2023, 82, 101713. [Google Scholar] [CrossRef]
- Cooperatives Europe. A New SME Strategy: For an Inclusive SME Strategy at EU Level; Cooperatives Europe: Brussels, Belgium, 2020. [Google Scholar]
- Simba, A.; Tajeddin, M.; Dana, L.P.; Ribeiro Soriano, D.E. Deconstructing Involuntary Financial Exclusion: A Focus on African SMEs. Small Bus. Econ. 2023, 76, 1–21. [Google Scholar] [CrossRef]
- Ferri, G.; Murro, P.; Peruzzi, V.; Rotondi, Z. Bank Lending Technologies and Credit Availability in Europe: What Can We Learn from the Crisis? J. Int. Money Financ. 2019, 95, 128–148. [Google Scholar] [CrossRef]
- Vera, D.; Onji, K. Changes in the Banking System and Small Business Lending. Small Bus. Econ. 2010, 34, 293–308. [Google Scholar] [CrossRef]
- Gupta, P.; Tressel, T.; Detragiache, E. Finance in Lower Income Countries: An Empirical Exploration. IMF Work. Pap. 2005, 5, 1–49. [Google Scholar] [CrossRef]
- Swinnen, J.; Gow, H. The Role of Trade Credit and Foreign Investment in Improving the Agricultural Finance Situation in Transition Countries; Agricultural Finance and Credit Infrastructure in Transition Economies; OECD: Paris, France, 1999; pp. 54–66.
- Dai, X.; Verreynne, M.; Wang, J.; He, Y. The Behavioral Additionality Effects of a Tax Incentive Program on Firms’ Composition of R&D Investment. RD Manag. 2020, 50, 510–521. [Google Scholar]
- Beck, T.; Demirgü-Kunt, A. Financial Institutions and Markets across Countries and over Time. Soc. Sci. Electron. Publ. 2010, 24, 77–92. [Google Scholar]
- Arping, S.G.L.; Morrison, A.D. Public Initiatives to Support Entrepreneurs: Credit Guarantees versus Co-funding. J. Financ. Stab. 2010, 6, 26–35. [Google Scholar] [CrossRef]
- Ayadi, R.; Fanelli, A. A New Framework for Euro-Med Cooperation on MSME Support (No. 239); CEPS Policy, Centre for European Policy Studies: Brussels, Belgium, 2011. [Google Scholar]
- Lehmann, A.; Tamirisa, N.T.; Wieczorek, J. International Trade in Services: Implications for the IMF. IMF Policy Discuss. Pap. 2003, 6, 1–25. Available online: https://www.imf.org/external/pubs/ft/pdp/2003/pdp06.pdf (accessed on 15 May 2023).
- Isaksson, A. Access to Formal Finance in Kenyan Manufacturing. Afr. Dev. Perspect. Yearb. 2002, 9, 377–399. [Google Scholar]
- Cucculelli, M.; Peruzzi, V.; Zazzaro, A. Relational Capital in Lending Relationships: Evidence from European Family Firms. Small Bus. Econ. 2019, 52, 277–301. [Google Scholar] [CrossRef]
- Olufunso, F.O.; Francis, A. The Impact of Firm and Entrepreneurial Characteristics on Access to Debt Finance by SMEs in King Williams’ Town, South Africa. Int. J. Bus. Manag. 2011, 6, 170–179. [Google Scholar]
- Ogawa, K.; Sterken, E.; Tokutsu, I. The Trade Credit Channel Revisited: Evidence from Micro Data of Japanese Small Firms. Small Bus. Econ. 2013, 40, 101–118. [Google Scholar] [CrossRef]
- Lohr, S. The Age of Big Data; The New York Times: New York, NY, USA, 2012. [Google Scholar]
- Kaisler, S.; Armour, F.; Espinosa, J.A.; Money, W. Big Data: Issues and Challenges Moving Forward. In Proceedings of the 2013 46th Hawaii International Conference on System Sciences, Maui, HI, USA, 7–10 January 2013; pp. 995–1004. [Google Scholar]
- Kwon, O.; Lee, N.; Shin, B. Data Quality Management, Data Usage Experience and Acquisition Intention of Big Data Analytics. Int. J. Inf. Manag. 2014, 34, 387–394. [Google Scholar] [CrossRef]
- Gandomi, A.; Haider, M. Beyond the Hype: Big Data Concepts, Methods, and Analytics. Int. J. Inf. Manag. 2015, 35, 137–144. [Google Scholar] [CrossRef]
- Vance, A. The Data Knows. Bloom. Bus. Week. 2011, 70–74. [Google Scholar]
- Jaiswal, A.; Bagale, P. A Survey on Big Data in Financial Sector. In Proceedings of the 2017 International Conference on Networking and Network Applications (NaNA), Kathmandu, Nepal, 16–19 October 2017; pp. 337–340. [Google Scholar]
- Jin, B.; Cui, D.; Yang, R. Research on Industrial Chain Credit Reporting Based on Blockchain Technology. Credit. Ref. 2022, 40, 60–65. [Google Scholar]
- Swinkels, J.M. Evolution and Strategic Stability: From Maynard Smith to Kohlberg and Mertens. J. Econ. Theory 1992, 57, 333–342. [Google Scholar] [CrossRef]
- Chan, Y.S.; Kanatas, G. Asymmetric Valuations and the Role of Collateral in Loan Agreements. J. Money Credit. Bank. 1985, 17, 84–95. [Google Scholar] [CrossRef]
- Reilly, A. Non-bank Lending Growth under Threat. Int. Financ. Rev. 2019, 73. [Google Scholar]
- Mushtaq, R.; Gull, A.A.; Usman, M. ICT Adoption, Innovation, and SMEs’ Access to Finance. Telecommun. Policy 2022, 46, 102275. [Google Scholar] [CrossRef]
- Nguyen, C.; Pacheco, A. Confidentiality in Loan Credit Agreements. Int. J. Manag. Financ. 2021, 18, 336–364. [Google Scholar] [CrossRef]
- Saakian, D.B.; Fontanari, J.F. Evolutionary Dynamics on Rugged Fitness Landscapes: Exact Dynamics and Information Theoretical Aspects. Phys. Rev. E Stat. Nonlin. Soft Matter Phys. 2009, 80, 593–598. [Google Scholar] [CrossRef]
- Xie, S. Economic Game Theory, 2nd ed.; Fudan University Press: Shanghai, China, 2002. [Google Scholar]
- Khan, A. Evolutionary Stability of Behavioural Rules in Bargaining. J. Econ. Behav. Organ. 2021, 187, 399–414. [Google Scholar] [CrossRef]
- Friedman, M.F. Decision Analysis and Optimality in Air Traffic Control Conflict Resolution: II. Optimal Heading (Vectoring) Control in a Linear Planar Configuration. Transp. Res. Part B Methodol. 1991, 25, 39–53. [Google Scholar] [CrossRef]
- Zhang, B. Application of Innovative Risk Early Warning Model Based on Big Data Technology in Internet Credit Financial Risk. J. Inf. Technol. Res. 2022, 15, 1–12. [Google Scholar] [CrossRef]
- Wessels, T.; Jokonya, O. Factors Affecting the Adoption of Big Data as a Service in SMEs. Procedia Comput. Sci. 2022, 196, 332–339. [Google Scholar] [CrossRef]
- Cornelli, G.; Doerr, S.; Gambacorta, L.; Tissot, B. Big Data in Asian Central Banks. Asian Econ. Policy Rev. 2021, 17, 255–269. [Google Scholar] [CrossRef]
- Albarrak, N.; Alsanousi, H.; Moulitsas, I.; Filippone, S. Using Big Data to Compare Classification Models for Household Credit Rating in Kuwait. In Proceedings of Sixth International Congress on Information and Communication Technology; Lecture Notes in Networks and Systems; Yang, X.S., Sherratt, S., Dey, N., Joshi, A., Eds.; Springer: Singapore, 2022; p. 216. [Google Scholar]
- Oussous, A.; Benjelloun, F.Z.; Lahcen, A.A.; Belfkih, S. NoSQL Databases for Big Data. Int. J. Big Data Intell. 2017, 4, 171–185. [Google Scholar] [CrossRef]


| Game-Agent | Bank | ||
|---|---|---|---|
| Lend | Reject | ||
| MSEs | Repay | ||
| Default | |||
| Equilibrium Point | Result | ||
|---|---|---|---|
| Saddle point | |||
| Saddle point | |||
| Saddle point | |||
| Saddle point | |||
| () | Center point |
| Game-Agent | Bank | ||
|---|---|---|---|
| Lend | Reject | ||
| MSEs | Repay | ||
| Default | |||
| Parameter Range | ) | |||||
|---|---|---|---|---|---|---|
| Result | Saddle point | Unstable point | Saddle point | |||
| Result | Saddle point | Unstable point | Saddle point | |||
| Result | Saddle point | Saddle point | Saddle point | Saddle point | Center point | |
| Parameters | Variable Meaning | Value |
|---|---|---|
| Collateral requirements (Unit: ¥10,000) | 10 | |
| Amount to be repaid for borrowing from non-bank financing institutions and the borrowing cost of MSEs (Unit: ¥10,000) | 150 | |
| Loan amount (Unit: ¥10,000) | 100 | |
| Interest rate | 0.05 1 | |
| The success probability of MSEs’ project | 0.6 | |
| Private wealth of MSEs (Unit: ¥10,000) | 50 | |
| Return on capital when MSEs’ project is successful | 0.7 | |
| Realization rate of collateral | 0.9 | |
| The risk-free rate of return on bank loans | 0.02 | |
| Transaction cost per loan by the bank (Unit: ¥10,000) | 0.5 |
Disclaimer/Publisher’s Note: The statements, opinions and data contained in all publications are solely those of the individual author(s) and contributor(s) and not of MDPI and/or the editor(s). MDPI and/or the editor(s) disclaim responsibility for any injury to people or property resulting from any ideas, methods, instructions or products referred to in the content. |
© 2023 by the authors. Licensee MDPI, Basel, Switzerland. This article is an open access article distributed under the terms and conditions of the Creative Commons Attribution (CC BY) license (https://creativecommons.org/licenses/by/4.0/).
Share and Cite
Jin, Y.; Zhang, S.; Lei, X. Evolutionary Game Analysis of the Impact of Big Data Credit Technology on the Credit Rationing of Micro and Small Enterprises (MSEs). J. Theor. Appl. Electron. Commer. Res. 2023, 18, 1926-1954. https://doi.org/10.3390/jtaer18040097
Jin Y, Zhang S, Lei X. Evolutionary Game Analysis of the Impact of Big Data Credit Technology on the Credit Rationing of Micro and Small Enterprises (MSEs). Journal of Theoretical and Applied Electronic Commerce Research. 2023; 18(4):1926-1954. https://doi.org/10.3390/jtaer18040097
Chicago/Turabian StyleJin, Yuhuan, Sheng Zhang, and Xiaokang Lei. 2023. "Evolutionary Game Analysis of the Impact of Big Data Credit Technology on the Credit Rationing of Micro and Small Enterprises (MSEs)" Journal of Theoretical and Applied Electronic Commerce Research 18, no. 4: 1926-1954. https://doi.org/10.3390/jtaer18040097