


As a historical discipline, archaeology requires confident dating of sites and contexts to explore cultural changes through time. Consequently, there is renewed attention to attaining high-resolution chronologies enabled by new developments in radiocarbon dating and methods of dating analysis. In this article we explore the histories of what has been called the Poverty Point culture of the lower Mississippi Valley (LMV; see Figure 1) circa 4200 to 3200 cal BP, with the aim of contextualizing the chronology of the type site, Poverty Point. Because the Poverty Point site exhibits complicated material culture elaboration without evidence of agriculture, some assume it is the political and economic center of an exceptionally complex hunter-gatherer political system. These inferences inform hypotheses about the social and political development of preagricultural nonstate societies, as well as ideas about human evolutionary behavior. Time is key to all ideas about Poverty Point's development and its role as an exemplar of historical, political, social, or evolutionary behavior. Specifically, almost all explanations of Poverty Point's complexity require extended temporal duration during which various political or evolutionary processes accumulated gradually over many centuries. In contrast, we advocate for a different view, claiming that Poverty Point achieved its unique characteristics through rapid, punctuated events at the end of the Archaic period.

Figure 1. The southeastern United States showing radiocarbon dated sites attributed to the Poverty Point culture. The inset shows the Southeast in relation to the continental United States. Key to sites: 3AS379, Lake Enterprise; 16CT17, McGuffee; 16CT147, Cowpen Slough; 16FR183, Hays Mound; 16MA47, J. W. Copes; 16OR40, Linsley; 16SJB2, Bayou Jasmine; 16WC5, Poverty Point; 16WC10, Lower Jackson; 22CR504, Teoc Creek; 22HA501/506, Claiborne and Cedarland; 22HU505, Jaketown.
Revised analysis of the chronologies of the interval circa 4200 to 3200 cal BP shows that the material traits usually assumed to define Poverty Point-ness—artifact forms, raw material exchange, earthwork building—developed before the type site was occupied or its earthworks constructed (Grooms et al. Reference Grooms, Ward and Kidder2023; Ward et al. Reference Ward, Grooms, Schroll and Kidder2022). Emerging data indicate that the assumed centers of Poverty Point culture have discrete, independent cultural trajectories and complicated histories. The results of our study build on these observations and demonstrate that a careful analysis of radiocarbon dates and the application of an explicit chronological hygiene process reshape our understanding of site histories at this time. This work establishes that the occupation span of the Poverty Point site is shorter than is often estimated and is more recent than other supposedly contemporary sites and that some of the earthworks at the site were built in an exceptionally brief interval at the end of the site's occupation.
The Poverty Point site (Figure 2) is an icon of Late Archaic (ca. 4500–3200 cal BP) hunter-gatherer elaboration in eastern North America (Anderson and Sassaman Reference Anderson and Sassaman2012:85–86; Milner Reference Milner2021:50–55; Sassaman Reference Sassaman2010). Poverty Point is the largest site in this period; its occupants are famous for constructing large earthworks, for the remarkable reach and quantity of their lithic imports, and for the immense stylistic diversity of their material culture. Because of its size and complexity, the Poverty Point site is identified as the political, economic, and socioreligious center of what is frequently called the Poverty Point culture. The term “Poverty Point culture” is applied to sites sharing aspects of the material culture signature originally identified at the Poverty Point site and that are assumed to be contemporary. These sites are widely distributed across the LMV, from southern Missouri to the Gulf Coast and along the Gulf Coast from central Louisiana to the western Florida panhandle (Webb Reference Webb1982; see Figure 1).
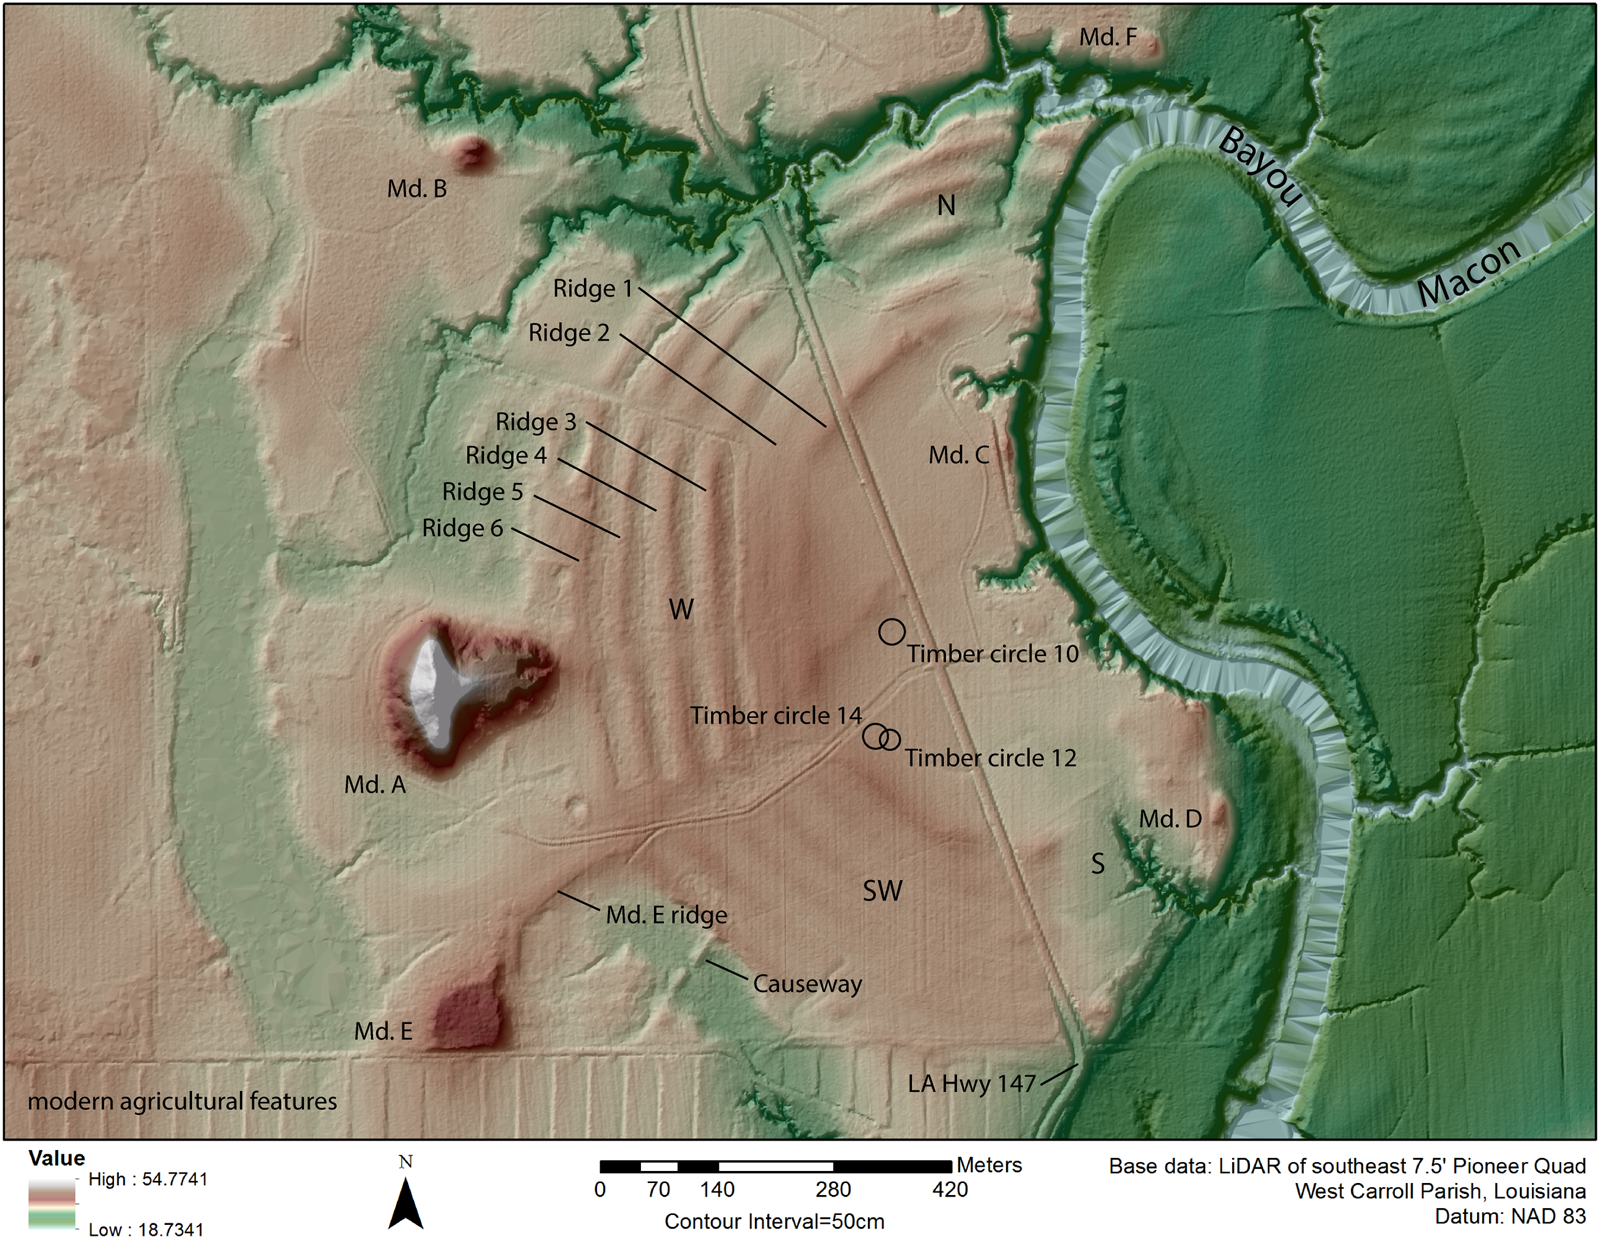
Figure 2. Lidar map of the core area of the Poverty Point site (16WC5) showing the mounds and features noted in the text. The ridges are numbered from 1 to 6 and are divided into four sectors, labeled N (north), W (west), SW (southwest), and S (south). The plaza is the area within Ridge 1. This figure shows only selected timber circles analyzed for this article (after Hargrave et al. Reference Hargrave, Berle Clay, Dalan and Greenlee2021). (Color online)
Considering these places’ iconic status and central place in understanding trajectories of complexity in eastern North America, it is surprising that the chronologies of this time and of these sites are very loosely constrained. Using uncritical interpretations of a growing radiocarbon database, some researchers propose that the Poverty Point site and culture span more than a thousand years from circa 2000 to 600 BC (Fagan Reference Fagan2019:196; Ford and Webb Reference Ford and Webb1956:124; Milner Reference Milner2004:49, Reference Milner2021:50; Webb Reference Webb1982:2–3, Table 1). Recent work at the Poverty Point site has narrowed this span. Connolly (Reference Connolly2006:Table 1) dates the Poverty Point site occupation from approximately 1700 to 1100 BC, whereas a recent discussion of site chronology in support of the site's World Heritage List nomination argues that Poverty Point was “constructed and occupied around 3700–3100 BP” and that earthwork “construction appears to have been ongoing throughout the entire period of occupation at the site” (US Department of the Interior 2013:30, 65, Figure 2.46). Kidder and coauthors (Reference Kidder, Arco, Ortmann, Schilling, Boeke, Bielitz and Adelsberger2009:187) claim that the Poverty Point site was occupied from 3615 to 3165 cal BP. Contemporary texts follow these ideas and suggest that the site occupation lasted for 500–600 years (Anderson and Sassaman Reference Anderson and Sassaman2012:Table 1.1; Pauketat and Sassaman Reference Pauketat and Sassaman2020:312, Table 9.1).
Most analyses assume the earthworks were built and used over the entire duration of site occupation. Gibson (Reference Gibson2019:52) argues, “Earthwork construction spanned around five centuries. . . . Median dates show that mounds and rings were under construction coterminously for nearly 500 years, the mounds for 460 years, from circa 1628 to 1170 B.C., and the rings for 440 years, from circa 1627 to 1187 B.C.” Ortmann (Reference Ortmann2010) suggests that the mounds were built and used from 1750 to 970 cal BC. Kidder and colleagues (Reference Kidder, Arco, Ortmann, Schilling, Boeke, Bielitz and Adelsberger2009), however, argue that the ridges and mounds only were built and used after around 3400 cal BP and that the site occupation ended with a rapid abandonment soon after 3200 cal BP.
Grooms (Reference Grooms2022; Grooms et al. Reference Grooms, Ward and Kidder2023) and Ward (Ward et al. Reference Ward, Grooms, Schroll and Kidder2022) demonstrate that the initial occupation of the Jaketown site—said to be a key Poverty Point culture settlement (Ford et al. Reference Ford, Phillips and Haag1955)—was underway by circa 4500–4000 cal BP and became more intensive and extensive by circa 3600–3400 cal BP. An eventful burst of mound building occurred around 3400 cal BP. These findings demonstrate that the people at Jaketown engaged in practices typically associated with the so-called Poverty Point culture conservatively 400 years earlier than the oldest dates derived from the Poverty Point site.
The empirical data for these chronologies of Poverty Point encompass 157 14C dates from 12 sites amassed since the 1950s (see Supplemental Table 1).Footnote 1 We arrive at this sample by examining existing radiocarbon date lists for Poverty Point age sites in the LMV (Connolly Reference Connolly2006; Greenlee Reference Greenlee2012; McGimsey and Koogh Reference McGimsey and van der Koogh2001; Sims and Connoway Reference Sims and Connoway2000) and assessing published dates from sites identified as Poverty Point by the authors (see references in Supplemental Table 1). Most of the dates in this analysis come from the Poverty Point site (81 dates, 52% of total) and Jaketown (27 dates, 17% of total).
In this analysis, we investigate the age of the Poverty Point culture and individual sites as an open-ended, unresolved span. We apply two approaches to these data. First, we examine the context of all Poverty Point age dates and use an explicit chronological hygiene procedure to assess the suitability of each date for our analysis. Second, we undertake an iterative Bayesian modeling analysis of Poverty Point age dates from sites assigned to the Poverty Point culture and to the Poverty Point site. We combine these analyses to arrive at a current best-estimate model for the ages of the Poverty Point site and its contemporaries.
Our model-based approach starts from the premise articulated by George Box (Box et al. Reference Box, Luceño and del Carmen Paniagua-Quiñones2009:61): “All models are wrong, but some models are useful.” We are not claiming that this analysis is the final word on the chronology of Poverty Point and contemporary sites in the LMV. Our model-building process, however, allows us to define a sample of dates, articulate a series of archaeological and historical hypotheses that account for these chronologies, and provide a structure for testing these hypotheses as more dates are acquired and more sites are added to the roster.
Chronological Hygiene
Radiocarbon dates have been run on samples from Poverty Point age contexts from the early 1950s to the present. The dates have been assayed on various materials from contexts that are often undefined or poorly defined and using an array of lab methods, approaches, and standards.Footnote 2 Some analyses proceed without any assessment of the quality or context of the radiocarbon dates, treating all dates as equal and valid (Gibson Reference Gibson2000:94, 96; Webb Reference Webb1982). Some researchers do screen dates using chronological hygiene. For example, Connolly (Reference Connolly2006:10) excluded dates with errors greater than 100 years, whereas Kidder and coauthors (Reference Kidder, Arco, Ortmann, Schilling, Boeke, Bielitz and Adelsberger2009:Table 10), Gibson (Reference Gibson2019:36), and Greenlee (Reference Greenlee2012:97–101, Table A1) filtered dates based on a mix of date integrity, context evaluation, and exclusion because of large standard errors (see also US Department of the Interior 2013:34–35, Table 7.1).
Approaches to chronometric hygiene evaluate dates based on the material dated, not only emphasizing dates from samples from short-lived organisms, such as seeds and juvenile fauna, but also excluding or down-weighting dates from certain materials. Ashmore (Reference Ashmore1999) and Bayliss (Reference Bayliss2015) make a case for rejecting samples that combine pieces of charcoal, bone, or shell that cannot be demonstrated to be part of a single entity; this includes bulk soil organic matter dates. Further criteria for sample assessment include adequate sample reporting—for example, sample material, stable isotopic data (usually for bone), and information necessary to assess bone collagen quality such as collagen yield and the C:N ratio—and, critically, suitable contexts and context descriptions (Bayliss Reference Bayliss2015; Erlandson et al. Reference Erlandson, Braje and Graham2008; Fitzpatrick Reference Fitzpatrick2006; Gilmore Reference Gilmore2015; Graf Reference Graf2009; Hamilton and Krus Reference Hamilton and Krus2017; Kennett et al. Reference Kennett, Kennett, Culleton, Aura Tortosa, Bischoff, Bunch and Daniel2015; Krus Reference Krus2016; Napolitano et al. Reference Napolitano, DiNapoli, Stone, Levin, Jew, Lane, O'Connor and Fitzpatrick2019; Pettitt et al. Reference Pettitt, Davies, Gamble and Richards2003; Sanchez Reference Sanchez2021; Sanchez et al. Reference Sanchez, Rick, Culleton, Kennett, Buckley, Erlandson and Losey2018; Schmid et al. Reference Schmid, Wood, Newton, Vésteinsson and Dugmore2019; Taché and Hart Reference Taché and Hart2013).
Some hygiene models discard dates based on large standard errors or those that were run before lab standards were fully developed (e.g., Connolly Reference Connolly2006; Sanchez et al. Reference Sanchez, Rick, Culleton, Kennett, Buckley, Erlandson and Losey2018). Hamilton and Krus (Reference Hamilton and Krus2017), however, note that excluding these dates is neither necessary nor justified solely on these criteria. Instead, they make the case that the critical element for evaluating a date is the taphonomy of the dated material and its archaeological context: “While there is no strict best or worst sample, our goal in almost every case is to select a sample whose radiocarbon date is the same as the date it was buried in the context from which it was recovered. Taphonomic understanding is critical for understanding how the dates of the two events (sample death and context formation) are related” (Hamilton and Krus Reference Hamilton and Krus2017:198).
Following Hamilton and Krus, our approach assesses each date and provides an evaluation of its utility based on explicit ranking considerations. In this way, we do not exclude dates outright; by weighting dates using clear guidelines, we delete samples from different model iterations and demonstrate how changing criteria influence results.
We use a four-part ranking of dates (see Supplemental Table 1), with 1 being the most favored and 4 the least favored dates. In these rankings we lean heavily on the schemes identified by Napolitano and coauthors (Reference Napolitano, DiNapoli, Stone, Levin, Jew, Lane, O'Connor and Fitzpatrick2019) and Krus (Reference Krus2016); these authors follow a similar four-part ranking system, but Krus uses 4 as the most-favored ranking. These rankings are reformulated for the contexts of the lower Mississippi River Valley and adjacent coast of the Gulf of Mexico.
First-Order Ranking
The sample is from a single entity (Ashmore Reference Ashmore1999)—short-lived terrestrial material (i.e., plant remains or juvenile fauna) identified to taxon and marine or freshwater shell identified to taxon—and for which there is a reasonable understanding of marine/freshwater reservoir effects and good evidence that the sampled material was deposited fresh during the formation of the context from which it was recovered. The sample must be from a context that provides an accurate date for the deposit from which it was recovered; there also must be adequate information to allow an understanding of how sample death and context formation are related. The date must include suitable sample reporting information, sufficient provenience information, and the processing laboratory name and number.
Second-Order Ranking
Dates include single-entity charcoal or charred material not identified to taxon and marine or freshwater shell not identified to taxon, and for which there is a reasonable understanding of marine/freshwater reservoir effects, or for which there is little evidence or ambiguous evidence that the sampled material was deposited during the use of the context from which it was recovered. The date must include suitable sample reporting information, sufficient provenience information, and the processing laboratory name and number.
Third-Order Ranking
Dates include single-entity charcoal or charred material not identified to taxon and marine or freshwater shell dates not identified to taxon, or where there is no/limited understanding of reservoir effects and/or radiometric dates on human bone apatite, or the sample likely predates the context from which it was recovered and is modeled as a terminus post quem. These dates may also have incomplete or ambiguous contextual information.
Fourth-Order Ranking
Dates include multi-entity samples—for example, combined individual pieces of charcoal, shell samples containing multiple individuals, or bulk sediment—and the sample material or its relationship to the context is unclear or undefined, the sample is identified as contaminated or compromised, or it lacks context information. Additionally, this ranking is used if the material dated is not specified or the measurement was not corrected for fractionation and was derived from maize, cane, or an aquatic organism.
The Context of Poverty Point Age Dates
Using the chronological hygiene criteria outlined here, we assessed radiocarbon dates assigned to Poverty Point and related sites. The easiest category to apply was the fourth-order ranking because multi-entity samples are commonly encountered (see Supplemental Table 1). Among these are soil organic matter (SOM, or humate) assays (Eckmeier et al. Reference Eckmeier, Van der Borg, Tegtmeier, Schmidt and Gerlach2009; Matthews Reference Matthews, Richards, Arnett and Ellis1985; Orlova and Panychev Reference Orlova and Panychev1993; Paul et al. Reference Paul, Follett, Leavitt, Halvorson, Peterson and Lyon1997; Wang et al. Reference Wang, Amundson and Trumbore1996). We excluded multi-entity samples (Ashmore Reference Ashmore1999; Bayliss Reference Bayliss2015:688) where researchers combined multiple pieces of charcoal of unknown ages into one sample to obtain a sample large enough for conventional dating.
We also encountered dates where the sample context was unclear or poorly defined. At the Poverty Point site especially, some dates were selected from unclear contexts (Webb Reference Webb1982:Table 1); often they were selected from redeposited cultural fills in earthworks. Similar concerns about contexts apply to dates from other sites, especially Claiborne, Cedarland, Cowpen Slough, and Linsley.
We also applied the type 4 exclusion to dates run from the Deep Six excavation at the Poverty Point site. All eight dates (Supplemental Table 1, Tx-4965 to Tx-4974) from this excavation were excluded because they either contained lignite, the sample preparation procedure was not clear, or sample contamination was likely (Greene Reference Greene1985, Reference Greene1990).
Type 4 exclusions accounted for 38% of the dates on Poverty Point and related sites (Supplemental Table 1). In most instances, these exclusions were easily identified, and, in the case of multi-entity or contaminated samples, the dates are not reliable for further analysis.
The most challenging exclusion category is Type 3 (16% of the total sample). In some instances, the exclusion was clear, particularly the shell dates in the LMV and coast. In estuarine contexts, dates are commonly run on Rangia shell, a brackish water genus. At present, without specific knowledge of the local correction factor (ΔR), which represents the difference between the reservoir age of the global surface ocean and the surface waters of an estuary, we take a conservative approach and exclude Rangia dates from hygiene-filtered models (Ensor Reference Ensor1999; Hadden and Cherkinsky Reference Hadden and Cherkinsky2016; Hadden et al. Reference Hadden, Hutchinson and Martindale2023; Kibler Reference Kibler1999; Ricklis Reference Ricklis1999, Reference Ricklis, Ricklis, Weinstein and Wells2012). We take a similarly conservative approach with freshwater shell because we cannot control the freshwater reservoir effect among the different drainages in the LMV that flow into the central northern Gulf Coast (Hart et al. Reference Hart, Lovis, Urquhart and Reber2017; Keaveney and Reimer Reference Keaveney and Reimer2012; Philippsen Reference Philippsen2013). Aside from shell dates, most of the type 3 dates are ones with ambiguous or poorly documented contexts.
Type 2 dates comprise 34% of the sample of dates. Most dates in this category lack taxonomic identification or are unidentified charred material. We treated soot dates from steatite in this category (Gilmore Reference Gilmore2015; Krus Reference Krus2016). In a few instances—for example, dates from excavations in Ridge West 3 at Poverty Point (Kidder et al. Reference Kidder, Su, Henry, Grooms and Ervin2021)—we assigned samples with identification to short-lived species as Type 2 because we were unable to make a clear connection between sample death and the context of burial.
Type 1 dates are rare, comprising only 12% of the dates. Only 4 sites—Poverty Point, Jaketown, J. W. Copes, and Lake Enterprise—of the 12 sites in our analysis have Type 1 dates.
Methods
In the following analyses, we apply seven models to three datasets (see Tables 1, 2, 3, and Supplemental Table 1). The datasets are (1) all radiocarbon dates from Poverty Point culture contexts, including the Poverty Point site (labeled CULTURE for clarity); (2) all radiocarbon dates from the Poverty Point site (labeled SITE); and (3) radiocarbon dates identified as terminus post quem (TPQ) for earthwork construction at the Poverty Point site. All models were run using OxCal 4.4 [154] (Bronk Ramsey Reference Bronk Ramsey2009a) applying the IntCal20 calibration curve (Reimer et al. Reference Reimer, Austin, Bard, Bayliss, Blackwell, Ramsey and Butzin2020). For this analysis, we used a single-phase contiguous Oxcal model. Posterior density estimates (modeled age ranges) are rounded to the nearest five years, italicized (Bayliss et al. Reference Bayliss, Ramsey, van der Plicht and Whittle2007:5), and reported at 95.4% highest probability density (hpd) and 68.3 hpd levels. We summarize the datasets used in Model 1 CULTURE and 4 CULTURE with the KDE_Model function in Oxcal (Bronk Ramsey Reference Bronk Ramsey2017; Figures 3 and 4). We also use the KDE_Plot function to visually represent the results of the single-phase Model 4 CULTURE, Model 4 SITE, and Model 5 site earthwork construction TPQ (Figure 8). The CQL code for the models and data for each model iteration are available in the Supplemental Code 1.
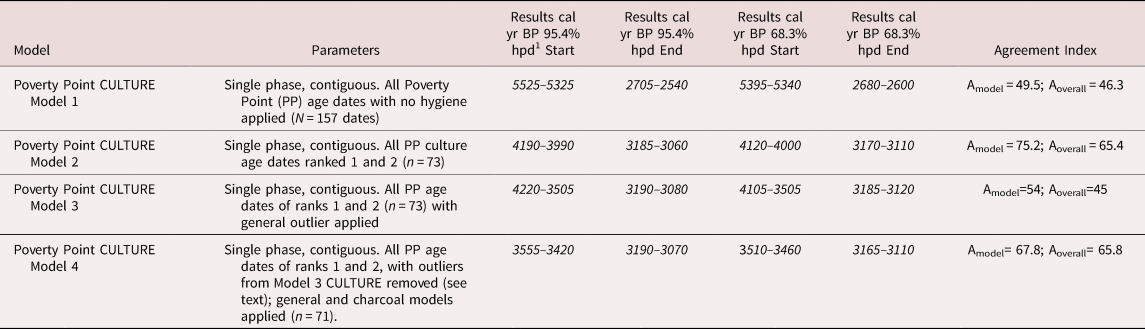
Table 1. Results of Poverty Point CULTURE Models 1–4 Showing Model Parameters, 68.3% hpd and 95.4% hpd Results, and Oxcal Agreement Indices.
1 highest probability density
Table 2. Results of Poverty Point SITE Models 1–4 Showing Model Parameters, 68.3% hpd and 95.4% hpd Results, and Oxcal Agreement Indices.

1 highest probability density
Table 3. Dates Used in Model 5, with Contexts Summarized.
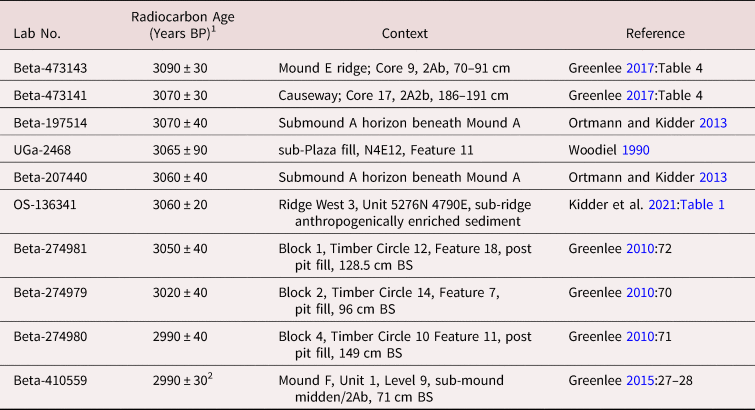
Note: Specific information for each date is in the corresponding reference.
1 Radiocarbon dates are reported as Radiocarbon Years Before Present and calculated using the Libby 14C half-life (5,568 years).
2 This date is listed incorrectly in Hargrave and colleagues (Reference Hargrave, Berle Clay, Dalan and Greenlee2021) as 2960 ± 30.
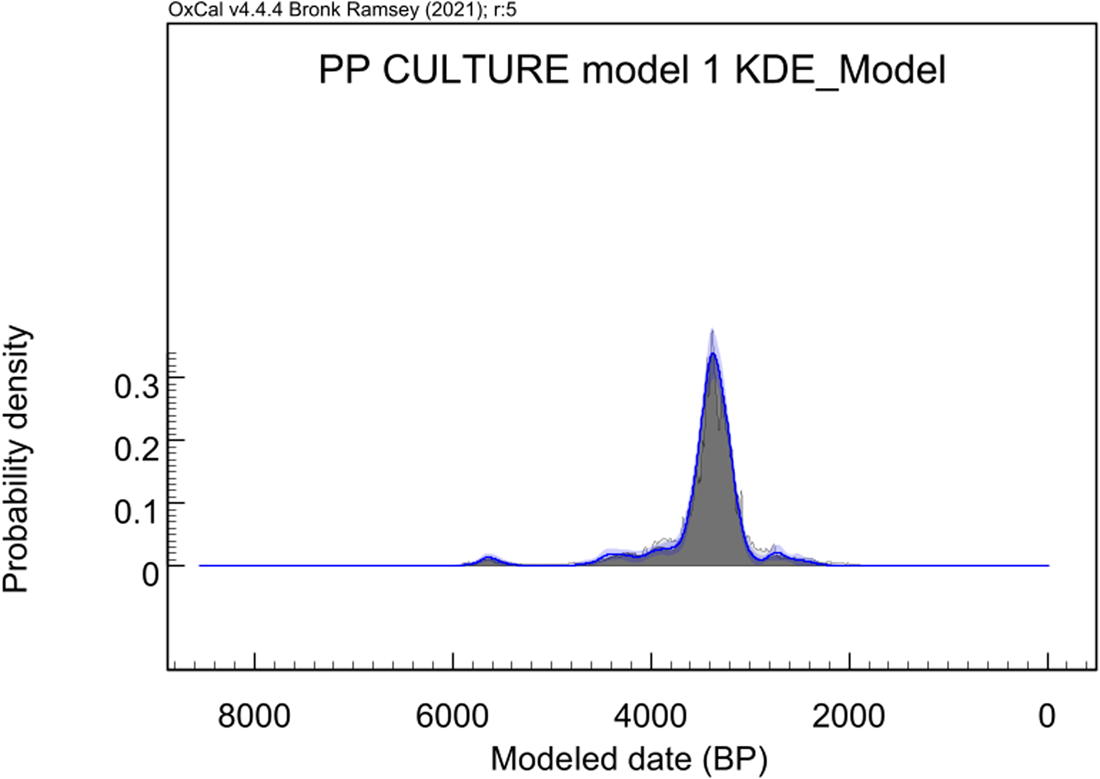
Figure 3. Kernel density estimate (KDE) model of radiocarbon dates attributed to the Poverty Point culture using all dates (N = 157; Model 1 CULTURE). Light gray shows unmodified summed probability distributions, the solid blue line shows the kernel density result, and shaded blue bands around the solid line show the confidence interval around the KDE. (Color online)
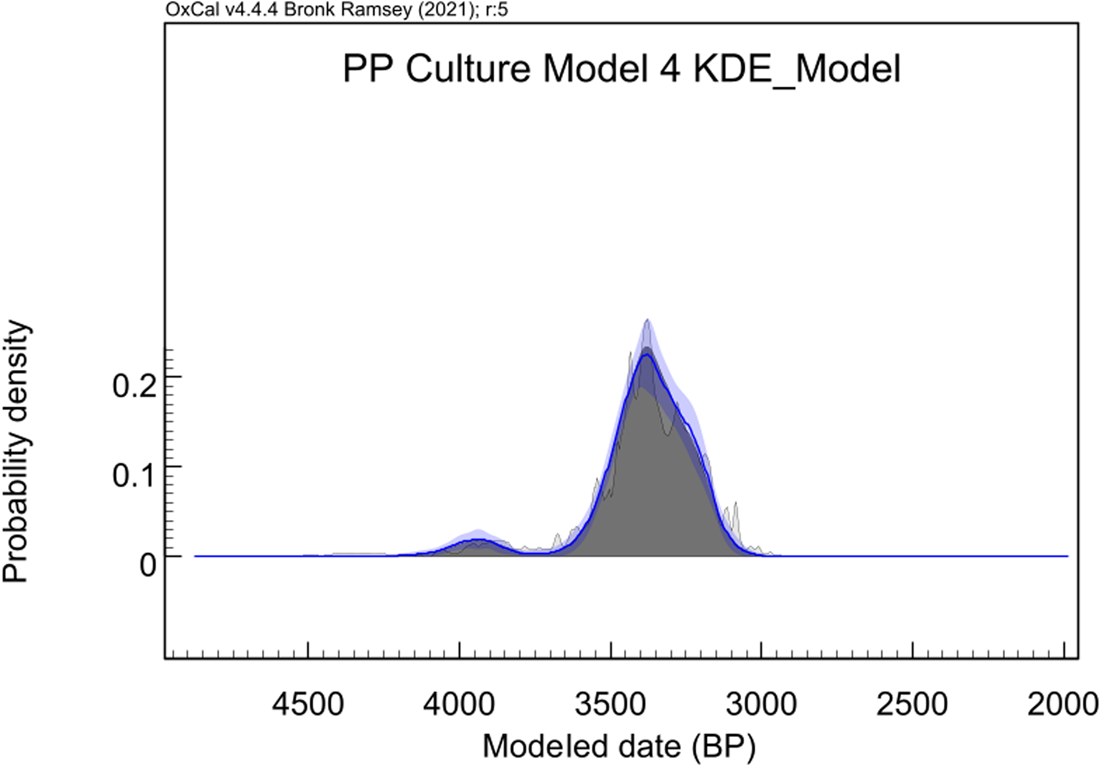
Figure 4. Kernel density estimate (KDE) model of radiocarbon dates attributed to the Poverty Point culture (N = 71) after application of the dating hygiene protocol and modeled with the application of general and charcoal outliers (Model 4 CULTURE). Light gray shows unmodified summed probability distributions, the solid blue line shows the kernel density result, and shaded blue bands around the solid line show the confidence interval around the KDE. (Color online)
In each analysis of the first two datasets (Tables 1 and 2), we start by modeling all dates without any chronological hygiene applied (Model 1); the next iteration excludes all dates of Types 4 and 3 because of their uncertainty (Model 2); and Model 3 applies a general outlier to the dates in Model 2. Model 4—our favored analytic model—deletes any outliers identified in Model 3 and then uses the remaining dates from Model 3 with a charcoal or general outlier function added (Bronk Ramsey Reference Bronk Ramsey2009b). Model 5 uses the data from Model 4 and applies it solely to dates identified as TPQ for earthwork construction at the Poverty Point site (Table 3).
Results: The Histories of the Poverty Point and Related Sites
Unsurprisingly, Model 1 (Figure 3; Tables 1 and 2) demonstrates that an uncritical use of all CULTURE and SITE dates results in an excessively long span of occupation and reflects the biased 14C sampling profile that is dominated by dates from the type site. The poor Agreement Index for Model 1 CULTURE indicates that that there is no temporal coherence to a Poverty Point “culture.” There is no contemporary context-based evaluation that would support the early or the late spans; Model 1 produces results that are both earlier and later than predicted by archaeologists using robust chronologies from nearby regions.
The hygiene approach used to produce Models 2 to 4 results in removing more than 50% of dates from both the CULTURE and SITE models. Model 2 winnows dates at both the older and younger ends of the chronological distribution and provides a reasonable temporal resolution based on the broad context of eastern North American archaeology. Models 3 and 4 refine the results of Model 2, accounting for outliers and including a charcoal outlier to account for old wood–related concerns.Footnote 3 We favor Model 4 because the application of charcoal outlier modeling accounts for the unknown inherent age offset in wood charcoal and soot samples (Bronk Ramsey Reference Bronk Ramsey2009b). Model 4 is at present the most conservative but robust in accounting for the chronology of the Poverty Point site and contemporary sites of this era in the LMV.
We use the SPAN command in OxCal to estimate the occupation duration of the Poverty Point site using the dates from Model 4 SITE (Figure 5). At 95.4% hpd, Figure 5 indicates that the occupation length of the Poverty Point site is from 164 to 397 years. This interval is shorter than previously proposed chronologies for the Poverty Point site. The start dates in Model 4 SITE are not very dissimilar to the estimates provided by Gibson (Reference Gibson2000:96, Reference Gibson2019:52), Connolly (Reference Connolly2006), and Ortmann (Reference Ortmann2010). The end dates, however, are slightly younger than Gibson's, a bit older than Connolly's estimate, and several hundred years older than Ortmann's. In Model 4 SITE, the end date for the Poverty Point site is considerably older than the estimate suggested by Fagan (Reference Fagan2019).
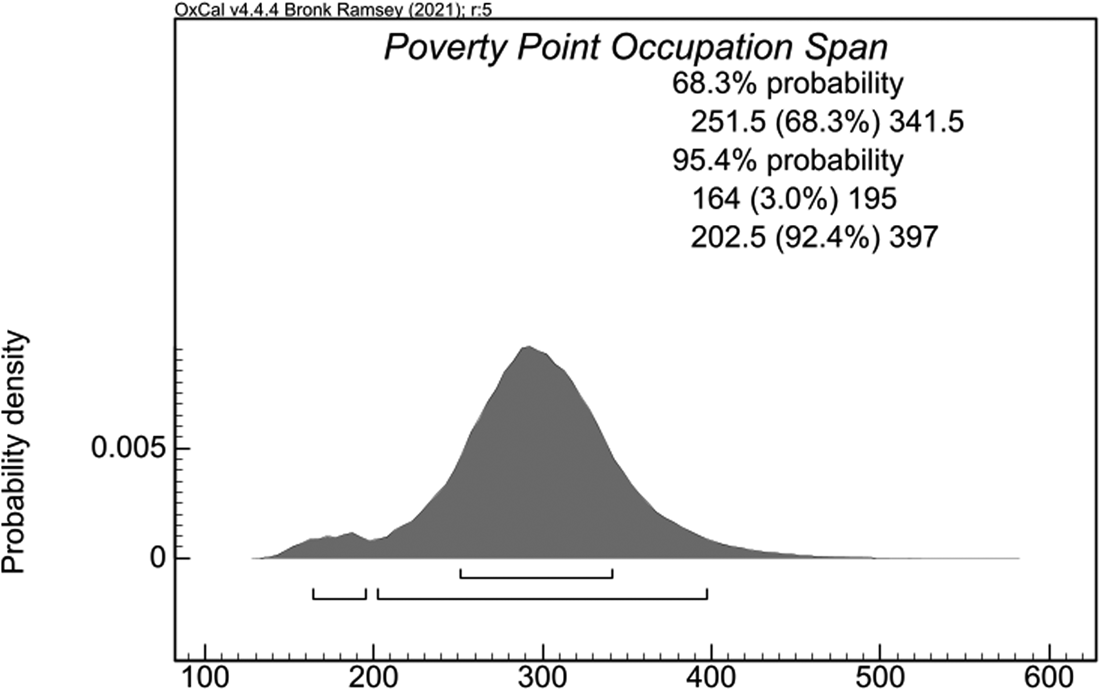
Figure 5. Poverty Point site occupation duration modeled using the OxCal SPAN command using dates from Poverty Point SITE Model 4.
Model 5, which is applied only to certain excavations at the Poverty Point site, uses the hygienically refined samples and applies them to dated contexts that represent TPQ for construction events (Figure 6). Although we think it likely these TPQ dates apply as a whole to each dated earthworks, analytically they only date the sampled location. These samples date pre- or subconstruction contexts beneath several mounds, ridges, earthen features, and plaza fill (see Figure 2, Table 3).
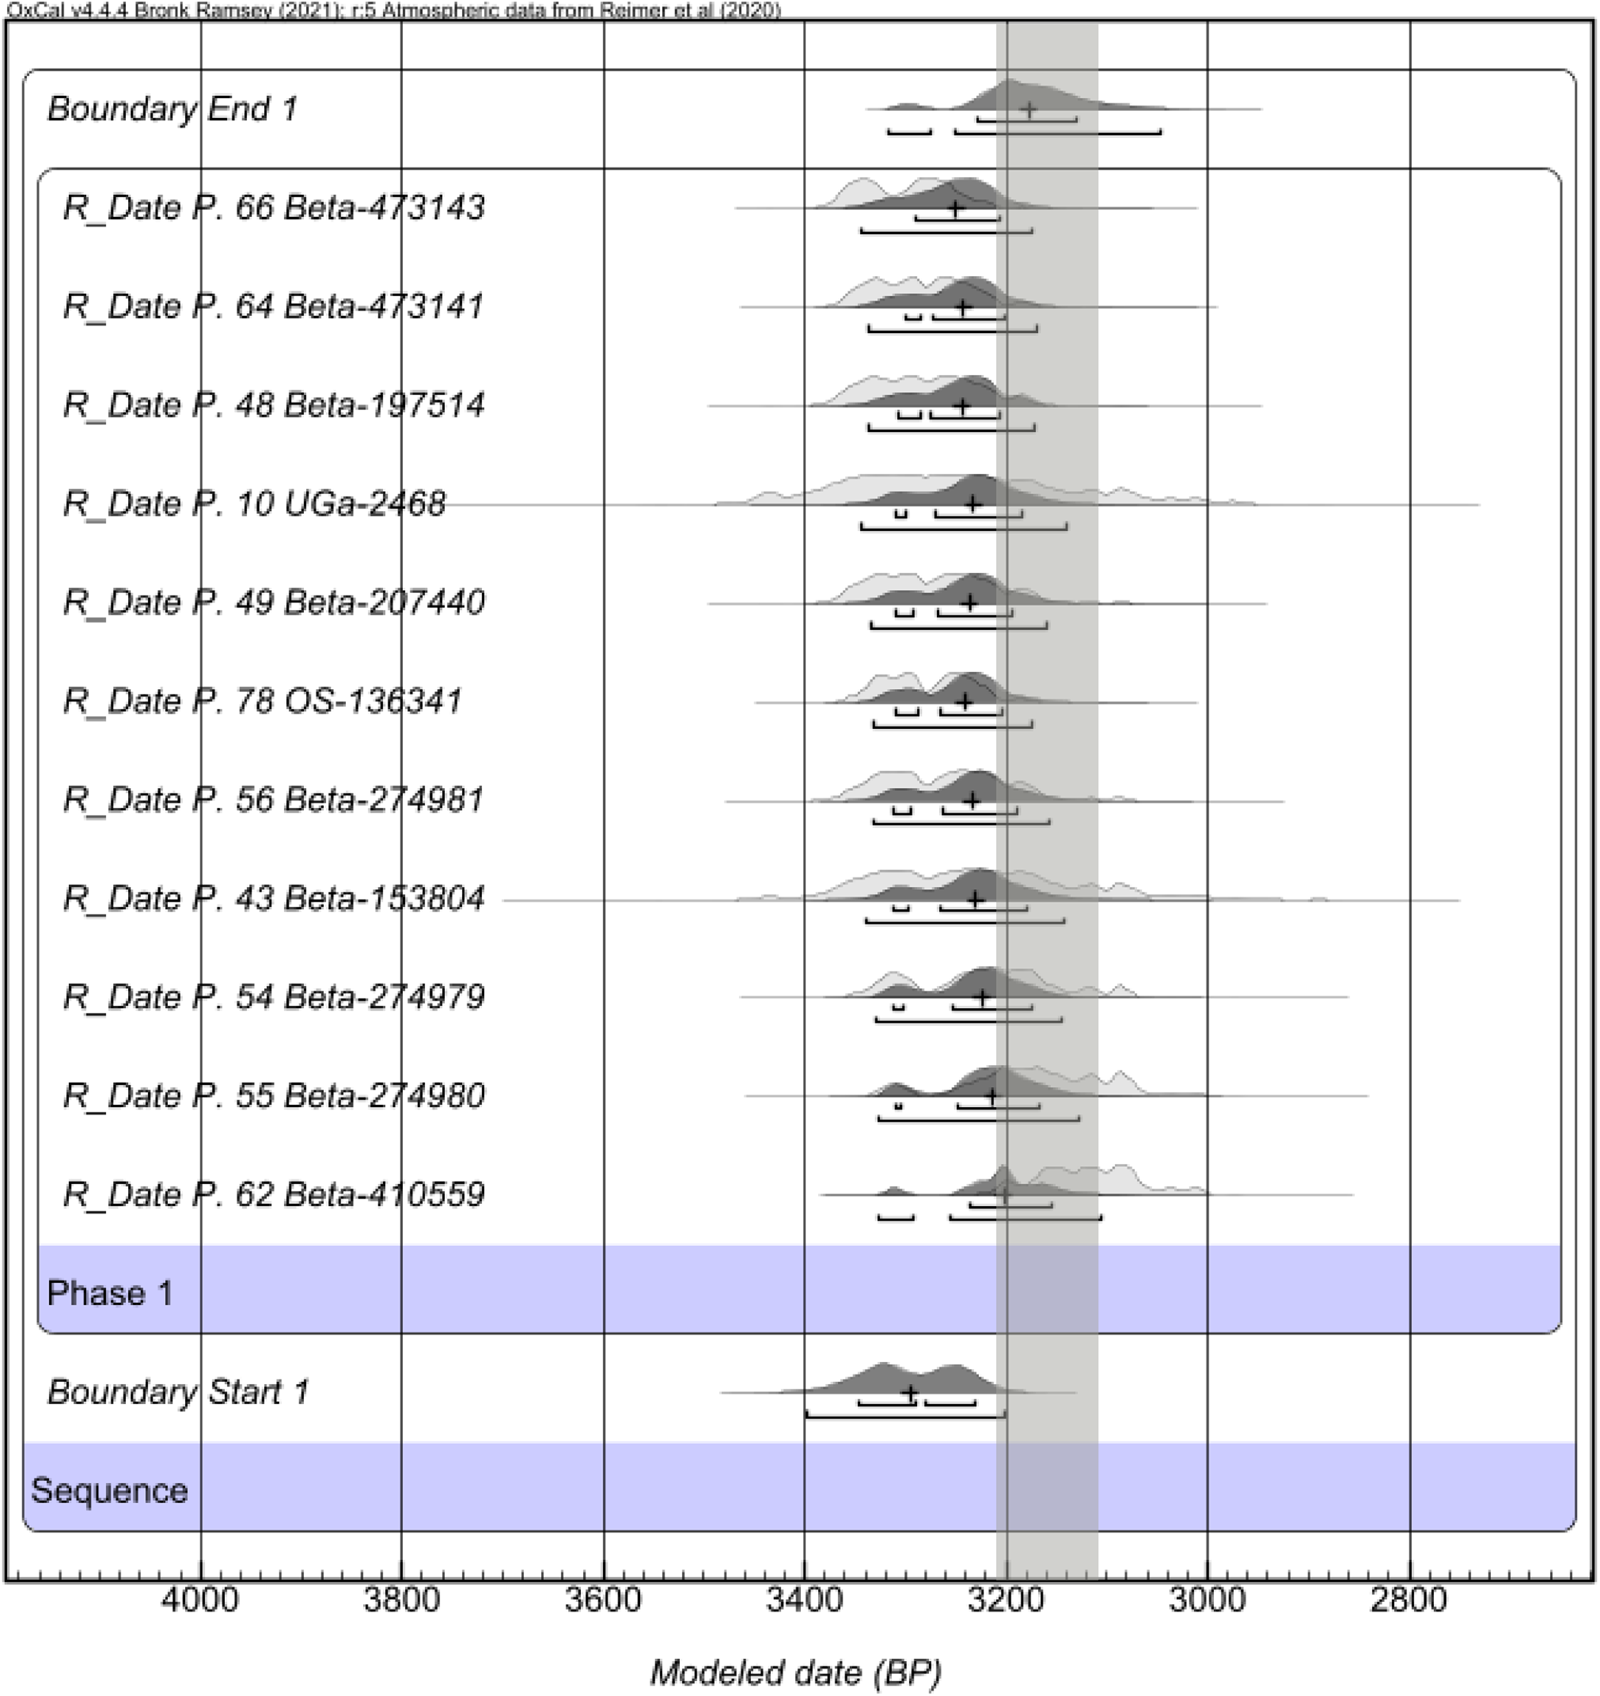
Figure 6. Terminus post quem for earthwork construction at the Poverty Point site based on 11 14C dates (Model 5; see Table 3) from sub-Ridge W3 (Kidder et al. Reference Kidder, Su, Henry, Grooms and Ervin2021) and sub-Ridge N1 (Connolly Reference Connolly2002), sub-Mound A (Ortmann and Kidder Reference Ortmann and Kidder2013), sub-Mound F, sub-Mound E ridge, sub-causeway; and sub-plaza fill (Timber circles 10, 12, and 14 and beneath the current visitor's center; Greenlee Reference Greenlee2017; Hargrave et al. Reference Hargrave, Berle Clay, Dalan and Greenlee2021; Woodiel Reference Woodiel1990). Model 5 yields posterior distributions from 3400 to 3200 cal BP (start) to 3320–3045 cal BP (end) (95.4% hpd; Amodel 101.4, Aoverall 102.5; charcoal and general outliers applied). The light-gray shaded curves are the unmodeled distributions, and the dark-gray shaded areas are the modeled distributions; the small crosses indicate the modeled median. The gray-shaded rectangle is the modeled posterior distribution of the End of the Poverty Point site occupation based on results of Poverty Point SITE Model 4.
Because the procedure for Model 5 is different from those applied in Models 1–4, we outline our approach and underlying assumptions. In all instances, the dates for Model 5 come from excavations demonstrating similar stratigraphic sequences, even though the deposits and circumstances of deposition vary:
• Modern surface
• Human-made construction deposits
• Organically enriched and culturally modified context
• Preoccupation (natural) deposits
All the dates used for Model 5 (Table 3) are from organically enriched/culturally modified contexts stratigraphically below human-made construction deposits.
We begin with the assumption that
• The organically enriched and culturally modified context from which the date was obtained is intact and was not disturbed by intrusions from construction activities or from the modern surface.
• The human-made constructed deposits are composed of heterogeneous materials that may include pieces of charcoal transported to and deposited in or with the construction fill. Radiocarbon dates from construction fill contexts are not in the original location where the charred plant material died and was carbonized and thus can only be considered TPQ for construction activity (e.g., see Kidder et al. Reference Kidder, Su, Henry, Grooms and Ervin2021). Consequently, for this exercise, we ignore dates from these contexts.
• The details of construction vary, but the excavators agree that there are no clear surfaces or stages within the human-made constructed deposits that witnessed sustained human use or prolonged intervals of nonuse. We interpret these data to indicate that these features were erected rapidly (e.g., Kidder et al. Reference Kidder, Su, Henry, Grooms and Ervin2021; Ortmann and Kidder Reference Ortmann and Kidder2013).
• There are no undisturbed contexts (terminus ante quem [TAQ]) from the surface of any constructed deposit at the Poverty Point site that would allow us to date the end of construction, use of the surface of any construction feature, or abandonment of the site.
Figure 7 uses the KDE_Plot function to summarize the length distributions of Model 4 CULTURE, Model 4 SITE, and Model 5 Earthwork TPQ. The KDE_Plot is visually striking and is the best way to summarize relatively simple chronologies. The Start boundary for Poverty Point SITE Model 4 is distinctly earlier than the Start boundary for Model 5 Poverty Point SITE Earthwork TPQ, indicating that earthwork construction likely started well after the site was initially occupied, as was hypothesized by Kidder and coauthors (Reference Kidder, Arco, Ortmann, Schilling, Boeke, Bielitz and Adelsberger2009). This result pushes back at the long-standing assumption that earthwork building was a continuous process at Poverty Point, starting from the beginning of site use and extending to the end.
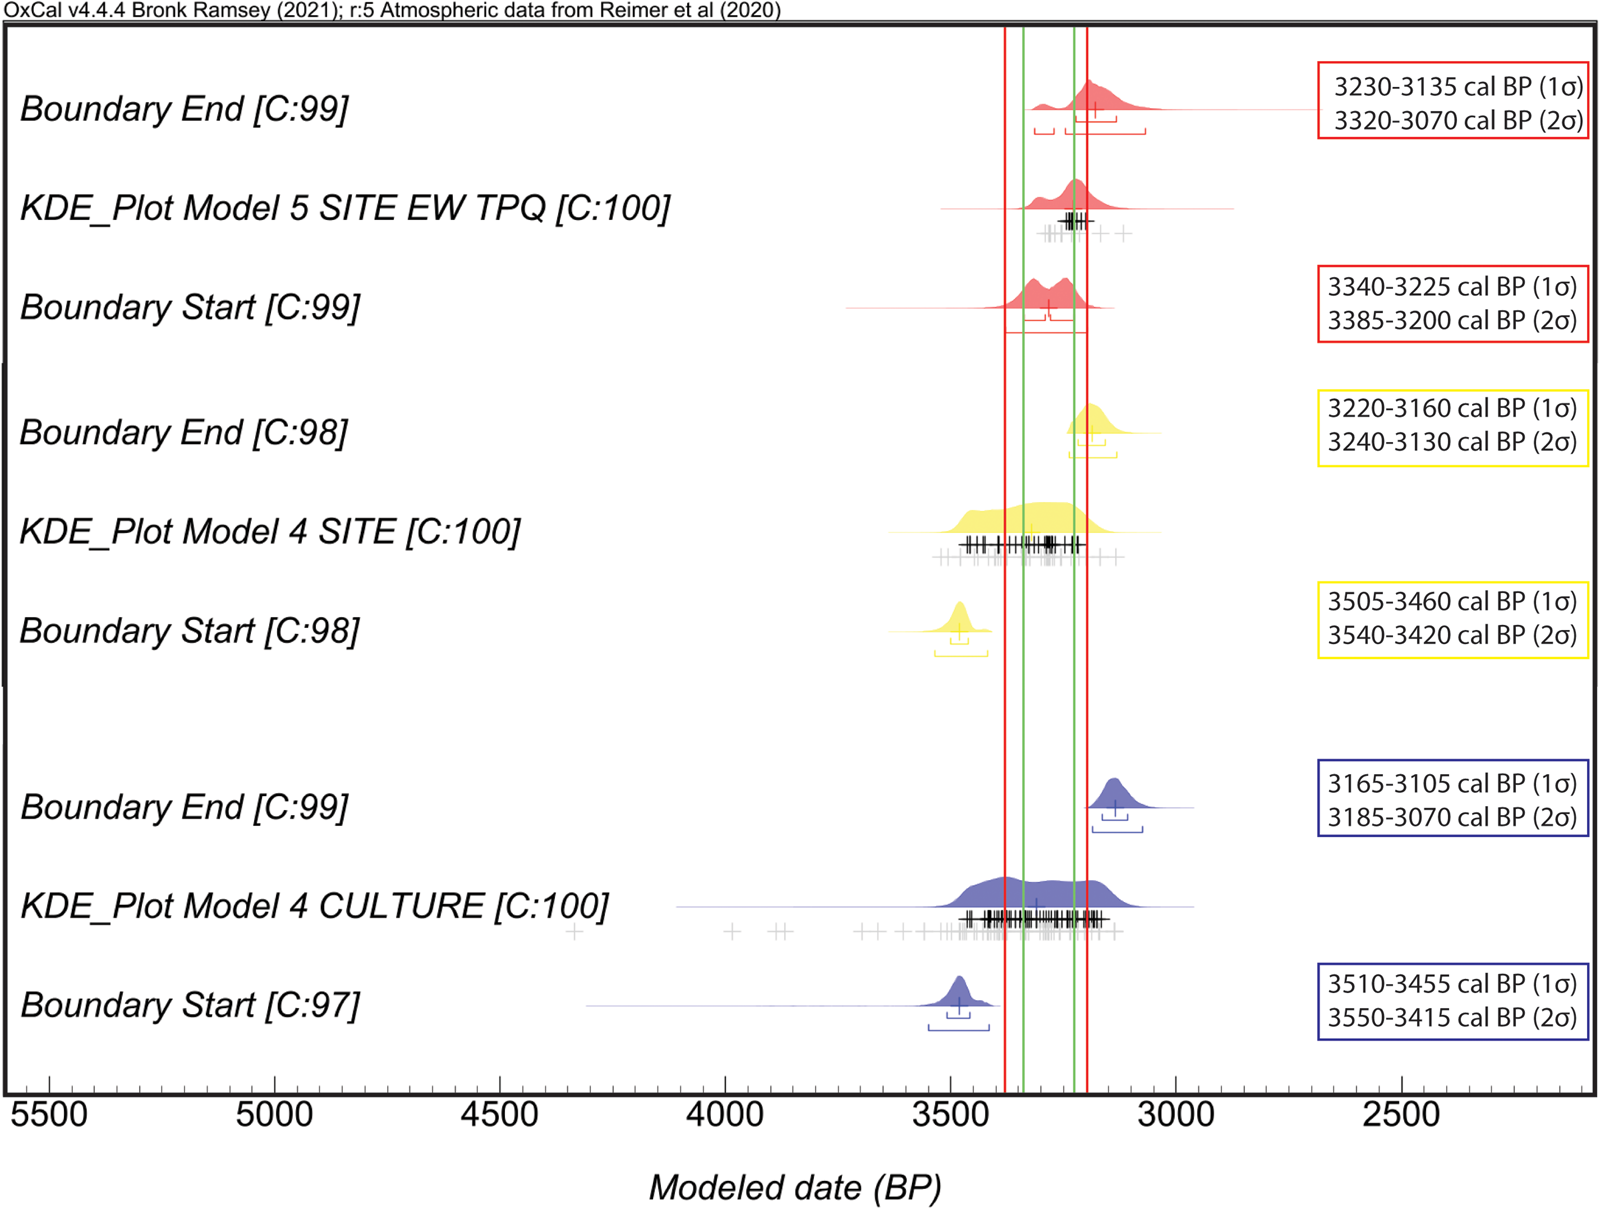
Figure 7. Results from Poverty Point CULTURE Model 4, Poverty Point SITE Model 4, and Poverty Point site Model 5 summarized using the KDE_Plot function. The vertical lines indicate 95.4% hpd (red) and 68.3% hpd (green) intervals. [C:] is the convergence rating, which reflects the reliability of the model. (Color online)
Figure 8 expands this analysis by including the KDE_Plot for Jaketown, Model 4 SITE, and Model 5 Earthwork TPQ. This figure shows how the Jaketown site was occupied substantially earlier than Poverty Point.
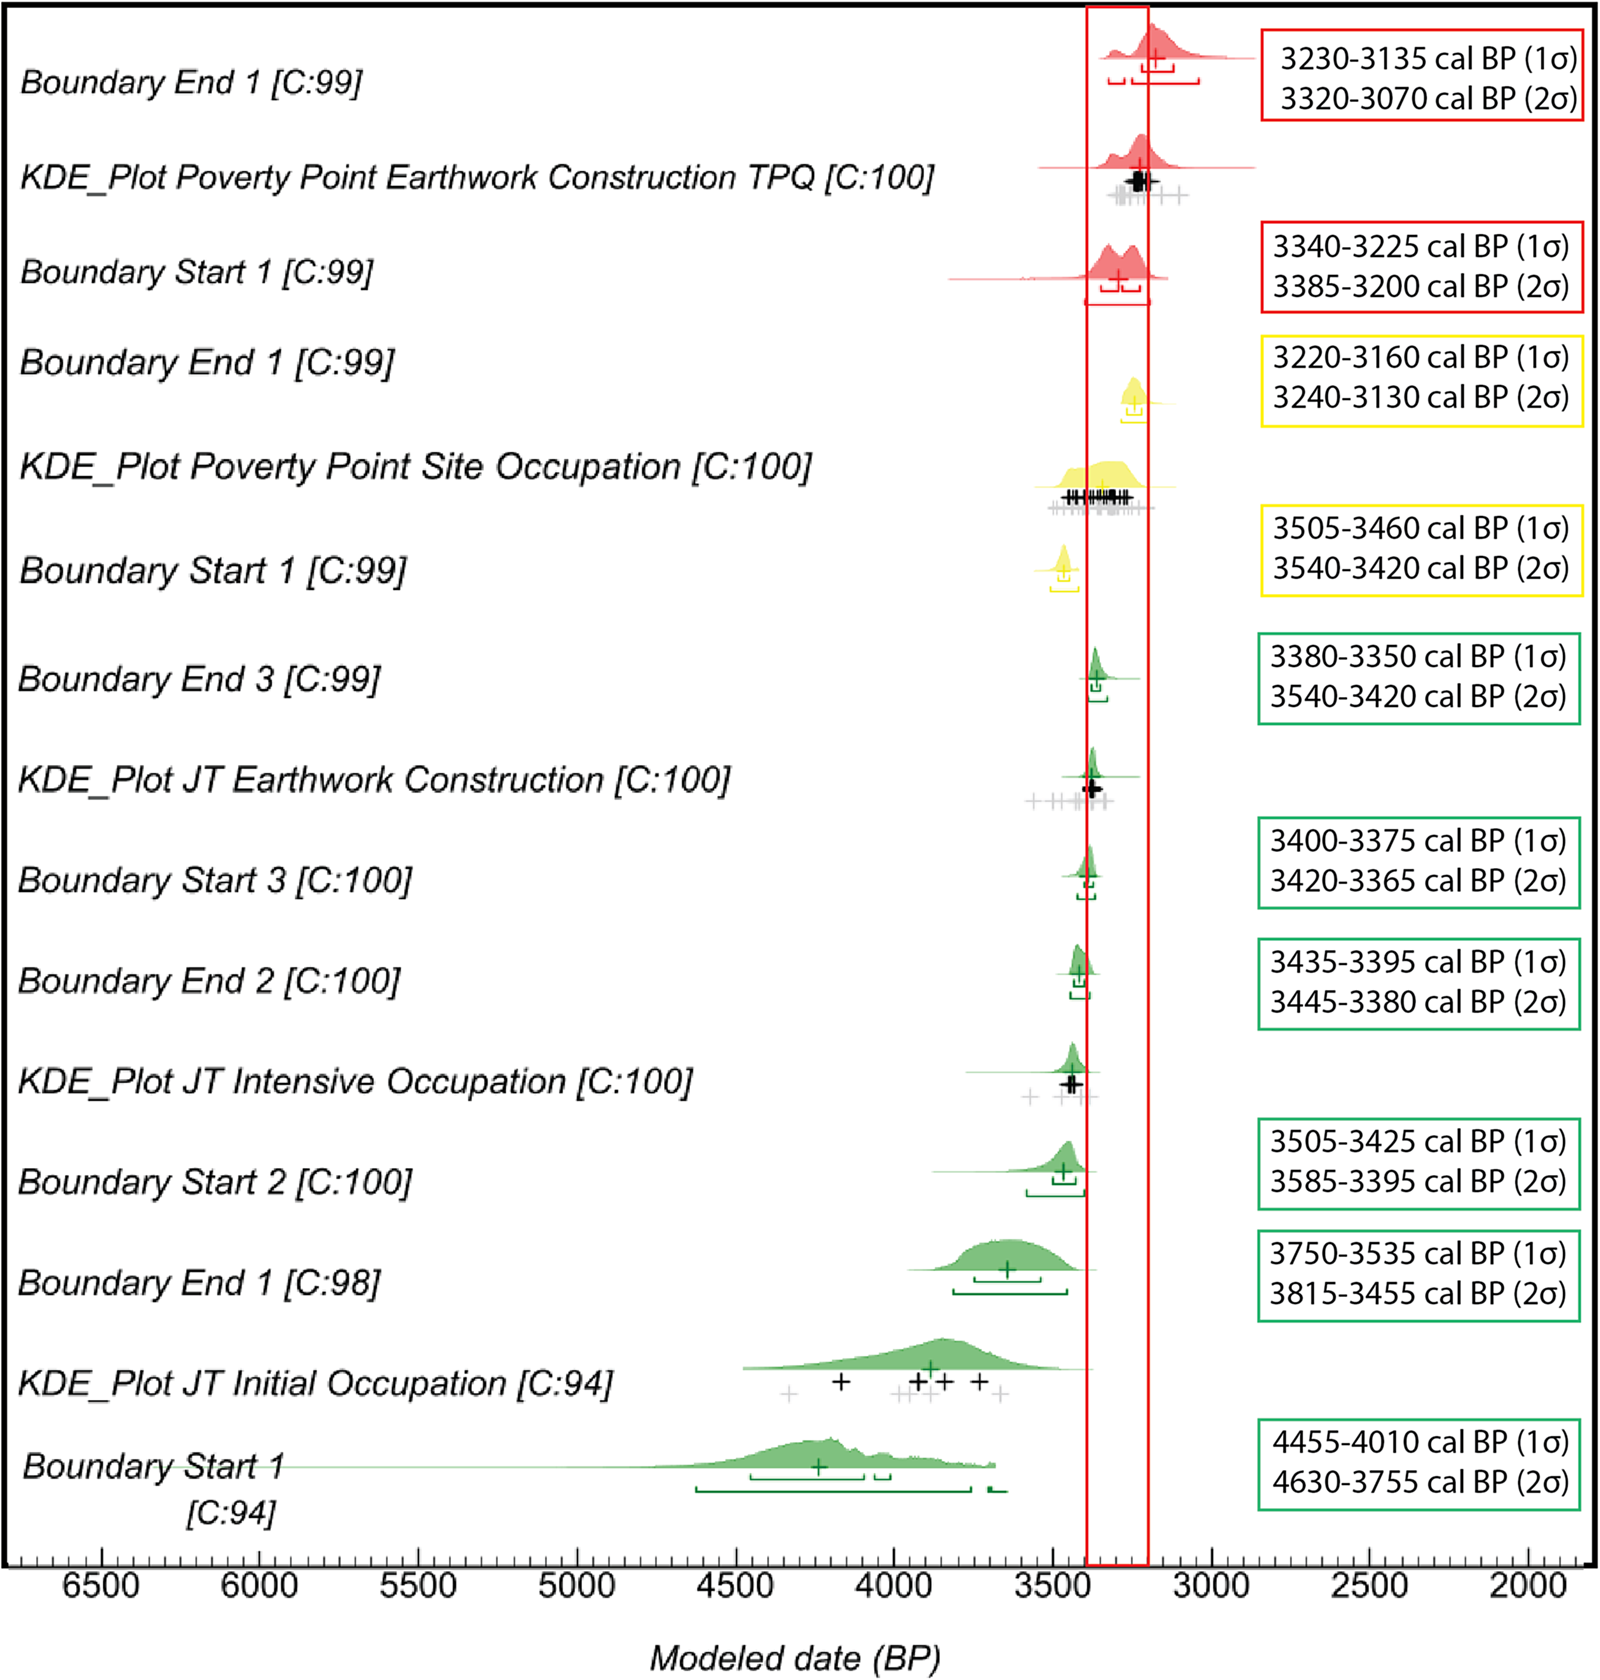
Figure 8. Results from the Jaketown (JT) SITE model (Grooms Reference Grooms2022; Grooms et al. Reference Grooms, Ward and Kidder2023), Poverty Point SITE Model 4, and Poverty Point site Model 5 are summarized using the KDE_Plot function. The vertical rectangle indicates the boundary start for the Poverty Point Earthwork Construction TPQ model at the 95.4% hpd (red) interval. [C:] is the convergence rating, which reflects the reliability of the model. (Color online)
At the 68.3% hpd level, we infer from Figures 6 and 7, and based on the assumption that these TPQ apply to the entire construction being dated, that earthwork building at the Poverty Point site occurred late in the occupation of the site. It is more difficult to deduce when earthwork construction happened at the 95.4% hpd level; even so, the posterior distribution skews toward the latter half of site occupation and partially overlaps with the end range for site occupation (Figure 7). Figure 8 shows that, at 95% hpd, the Jaketown earthwork building Start and End overlap with the Poverty Point Earthwork TPQ Start. Still, Poverty Point earthwork building skews later, and at 68.3% hpd the end of earthwork construction is more recent than at Jaketown.
Because there are no known TAQ for the end of site occupation, the End span for Model 4 is the best estimate for site abandonment. Thus, relative to Model 4 SITE, Model 5 places the construction of several mounds, ridges, and the filling of the plaza at the end of the site's occupation. Although more data are needed to test our hypothesis that earthwork construction happened at the end of site occupation, Model 5 suggests that these earthwork construction events were rapid and occurred nearly at the same time as site abandonment, especially because Model 5 solely relies on TPQ dates. The Jaketown KDE_plots demonstrate that there was a period of site occupation before earthwork construction and that earthwork building occurred at the end of the site occupation. In both ways, Jaketown exhibits a similar historical trajectory with Poverty Point, even though they are not fully contemporary.
Discussion
The iterative approach we deploy here demonstrates that the occupation spans of the Poverty Point site and of contemporary sites change considerably after applying a stringent hygiene protocol. Model 4 CULTURE and Model 4 SITE result in a shorter temporal span than was previously assumed based on an uncritical analysis of numerical dates (Figures 5 and 7). This tighter chronology is enabled by removing a number of dates from consideration. Some dates are unusable because of compromised samples or incomplete/inadequate sample reporting. Some were run in the infancy of radiocarbon dating, and their accuracy cannot be trusted; for example, the dates published by Ford and Webb (Reference Ford and Webb1956:Table 9). Moreover, many were obtained from multiple sample entities at a time when a large quantity of charcoal was required to obtain a conventional date.
Radiocarbon chronologies are at the core of narratives about the Poverty Point site and the sites said to participate in the culture of the same name. Because there was limited critical assessment of the dates and their contexts and the (often extreme) errors associated with some dates, Poverty Point, however defined, was accorded a wide temporal span somewhere between 2000 and 600 BC. Traditional explanations of the Poverty Point culture and site used these dates to emphasize gradual cultural development spanning hundreds to perhaps a thousand years (Crothers Reference Crothers, Gibson and Carr2004; Williams and Brain Reference Williams and Brain1983). In these narratives, Poverty Point emerges out of a generalized Archaic economy and connects in some unspecified way with the people who constructed Middle Archaic (ca. 6000–4000 cal BP) mounds (Gibson Reference Gibson2019; Saunders Reference Saunders, Burger and Rosenswig2012; Saunders and Allen Reference Saunders and Allen1997; Webb Reference Webb1982). These analyses emphasize the emergence of nascent or developmental traits—such as earthwork construction and use, artifact styles, or long-distance trade—that coalesced at the Poverty Point site. From Poverty Point, these characteristics were purportedly repackaged and exported as a suite of traits that represented Poverty Point culture. These assumptions of long-term cultural continuity are so strong they are promoted even when the absence of evidence is acknowledged (Gibson Reference Gibson2019:11, 162–171).
In recent years understanding the chronology of occupation and the sequence of earthwork construction at the Poverty Point site has emerged as a vital element for building explanatory frameworks and testing anthropological theories of emerging complexity among nonagricultural stateless societies. Because of the lengthy span of time resulting from the uncritical use of existing radiocarbon dates, it is unsurprising that most theories about the site's development emphasize that occupation duration and earthwork building were continuous processes carried out by a large, sedentary local residential population over hundreds of years (Clark et al. Reference Clark, Gibson, Zeidler, Bandy and Fox2010:222–224; Connolly Reference Connolly2006; Earle Reference Earle2021; Gibson Reference Gibson2019:52, 170; Hargrave et al. Reference Hargrave, Berle Clay, Dalan and Greenlee2021; Milner Reference Milner2021:50, 54; Stanish Reference Stanish2017:241, 248; US Department of the Interior 2013). This long chronology justifies gradual cultural evolution and multigenerational occupational duration that fostered institutionalized political power and an economy managed by elites (Earle Reference Earle2021:80–85, 156; Gibson Reference Gibson2019:156, 160, 170–172; Stanish Reference Stanish2017:9, 14, 42, 82, 265–266).
In these models, over multiple centuries of occupation at the Poverty Point site, lineages evolved the lasting capacity to direct members of the community to provide labor. One objective of this labor was erecting monuments for ritual purposes. There are various explanations for these monuments. For Gibson and Earle, the goals were attaining power and the capacity to leverage people to increase the material well-being of leaders (Earle Reference Earle2021; Gibson Reference Gibson2019:170–171; Gibson and Carr Reference Gibson, Carr, Gibson and Carr2004). Stanish (Reference Stanish2017:2, 265), in contrast, argues that leaders emerged to manage competition over time and were “rewarded with prestige and other resources.” Rituals developed in these instances because, lacking coercive power, leaders needed means to sustain and reward collective action (Earle Reference Earle2021:51, 69; Stanish Reference Stanish2017:265–266, 269–270). The product, however, was the same: the enhancement of fitness over time for leaders and followers. Other approaches suggest that monument building enhanced evolutionary fitness without it being an intentional goal (Peacock and Rafferty Reference Peacock, Rafferty, Fontijn, Louwen, van der Vaart and Wentink2013). Followers needed incentives to undertake labor, and these “wasteful” energetic expenses were justified as ritual (Hamilton Reference Hamilton1999:348–349; Trigger Reference Trigger1990:122, 125).
Vital to all these theories, however, is the notion that these processes required multicentury temporal duration and the gradual accumulation of political and economic power (e.g., Gibson Reference Gibson2019:170–171; Hamilton Reference Hamilton1999:348–349; Peacock and Rafferty Reference Peacock, Rafferty, Fontijn, Louwen, van der Vaart and Wentink2013; Stanish Reference Stanish2017:14, 82, 271, 265). The archaeological correlates of this expectation is that the monumental constructions at Poverty Point grew slowly; thus, we expect that various construction projects were seeded across the period of occupation, and site expansion took place slowly (e.g., see Gibson Reference Gibson2019; US Department of the Interior 2013).
However, as our analysis shows, Bayesian dating, coupled with systematic hygiene, provides an avenue for developing stronger support for historical reconstructions and thus better interpretations. In contrast with prevailing models arguing for the construction of mounds and earthworks over hundreds of years, our analysis supports the notion—supported by independent evidence—that some of the Poverty Point site earthworks were built in a very short time span at or very near the end of the site's occupation (Greenlee and Dalan Reference Greenlee and Dalan2022; Hargrave et al. Reference Hargrave, Berle Clay, Dalan and Greenlee2021:Table 1; Kidder et al. Reference Kidder, Arco, Ortmann, Schilling, Boeke, Bielitz and Adelsberger2009:118, Reference Kidder, Su, Henry, Grooms and Ervin2021:Table 1; Ortmann Reference Ortmann2010; Ortmann and Kidder Reference Ortmann and Kidder2013; Ortmann and Schmidt Reference Ortmann and Schmidt2016). Although we would like to have higher-resolution dating of individual earthworks, the absence of multiple dates in stratified deposits from a single context makes it impossible to use more refined Bayesian models. Certainly, more data are desirable, but these results challenge models of long-term continuity reaching back to Middle Archaic mound builders (e.g., Gibson Reference Gibson2019; Milner Reference Milner2021) and suggestions that Poverty Point was a sedentary Great Town that was the political and economic center of a far-flung “Poverty Point culture.” These new interpretations of the radiocarbon data, along with recent analyses using multi-method micro-archaeological approaches, suggest a rapid, eventful transformation of the site between 3300 and 3225 cal BP (Spivey et al. Reference Spivey, Kidder, Ortmann, Arco, Gilmore and O'Donoghue2015) and imply the use of an extraordinarily large labor force for a short interval (Kidder Reference Kidder, Sassaman and Holley2011:Table 1; Kidder et al. Reference Kidder, Su, Henry, Grooms and Ervin2021; Ortmann and Kidder Reference Ortmann and Kidder2013).
Model 4 and the hygiene assumptions that underlie it problematize assumptions about a contemporaneous Poverty Point culture and long-term, gradual cultural development at the Poverty Point site and elsewhere. The well-anchored chronology at Jaketown shows that the occupants of the site constructed mounds, used characteristic Poverty Point artifacts, and imported exotic artifacts before these behaviors were expressed at the Poverty Point site (Grooms Reference Grooms2022; Ward et al. Reference Ward, Grooms, Schroll and Kidder2022). Equally relevant, however, is that the particular expressions of material culture, the construction of earthworks, and the sequences of events at Jaketown are different from those seen later at Poverty Point (Grooms Reference Grooms2022). At the same time, the hygiene approach makes it impossible to say, based on present data, whether sites such as Claiborne, Cowpen Slough, or Teoc Creek were contemporaries and thus, as claimed, “historically affiliated” with Poverty Point (Gibson Reference Gibson2019:24).
Conclusions
Our analysis demonstrates that we can improve Poverty Point era chronologies by using systematic hygiene and Bayesian analyses that account for the few dated stratigraphic sequences available for analysis. This work emphasizes that more effort is required for us to have a better understanding of the complicated histories of the time. Careful hygiene analysis, for example, eliminates dates from seven sites that have been—because they were radiocarbon dated—linchpins of understanding the Poverty Point phenomenon. Well-known sites, such as Teoc Creek, Cowpen Slough, and Linsley, no doubt date somewhere in this period, but the legacy radiometric assays from these sites at present cannot be used to sustain a confident age span for their occupation and use.
The Claiborne site is a partial casualty of our hygiene model. Claiborne is unique among the sites in our sample because there are two distinct chronometric datasets. The dates run by the initial excavators suffer from context and sample reporting issues that are typical of the 1970s, and our hygiene approach excludes them from Model 4. Yet, there are 10 AMS soot dates from 12 steatite vessels. These vessels, however, were recovered from a single deposit. As such, they provide only an indication of vessel use lives, and the youngest date indicates a TPQ for the cache itself—but they do not provide a date for site occupation. As a result, a realistic evaluation of the Claiborne site should acknowledge that we do not know the chronology of the site other than its TPQ.
Our analysis further demonstrates that we must revise our understandings of the chronology of the Poverty Point site. For example, the earliest earthwork date is Beta-175059 (3690–3465 cal BP), extracted from the initial stage of Mound B (Kidder et al. Reference Kidder, Ortmann and Allen2004; Ortmann Reference Ortmann2010). Kidder and others have made the case this makes Mound B the earliest monument at the site and that it marks the founding of the site on an axis anchored to the south by the Lower Jackson Mound (Clark Reference Clark, Gibson and Carr2004; Gibson Reference Gibson2007:517–518, Reference Gibson2019:104–105, 167–168, Figures 18, 51; Kidder Reference Kidder and Alt2010, Reference Kidder, Sassaman and Holley2011). However, this date is from mound fill and only marks a TPQ. In addition, the date fails our hygiene protocol because it is a multi-entity sample (Supplemental Table 1). This same issue applies to the Lower Jackson site as well, which is claimed to be a Middle Archaic mound fixing the layout of the Poverty Point site (Gibson Reference Gibson2019). There are Middle Archaic artifacts at Lower Jackson that make this scenario plausible (Saunders et al. Reference Saunders, Allen, LaBatt, Jones and Griffin2001), but the single date from the site is from a preconstruction context and only provides a TPQ for the building of the mound. (The Lower Jackson date also fails our hygiene protocol because it is a multi-entity sample; see Saunders et al. Reference Saunders, Allen, LaBatt, Jones and Griffin2001:75.) Because there are also Poverty Point-age artifacts at the Lower Jackson site, the age of the mound is just as plausibly post-Middle Archaic. Unfortunately, we neither know when the Lower Jackson mound was erected nor its relationship with Mound B.
Poorly resolved regional chronologies are an obstacle in Poverty Point phenomenon research. The low-resolution chronology for Poverty Point and related sites enables normative, gradualist evolutionary assumptions inherent in regional histories of the Late Archaic. The result is a just-so story in which the Poverty Point site is considered the place of origin of Poverty Point cultural identity that emerged over multiple centuries. The extraordinary nature of the Poverty Point site invites the concept that it was the political, social, and economic center of the region and, indeed, possibly the Southeast. However, recent work at Jaketown shows that key practices and traditions, such as particular artifact forms, acquisition of nonlocal lithics, and mound building, originated outside the Poverty Point site.
Our analysis shows that the Poverty Point phenomenon was a unique moment in Native American history and that its origins, extent, and influences are poorly understood and likely far more complicated than previously imagined. The earthworks and the vast array of artifacts at Poverty Point are unique expressions of cultural elaboration in the Archaic period, surpassing in scale anything that came before and much that would come after. For these reasons, the social practices and historical interactions among different groups at this time is an important case study for understanding the range of sociopolitical organizational possibilities among non-agrarian societies. Anthropologists know relatively little about how precontact foraging societies organized themselves (Ames Reference Ames2004), and there is ample ethnographic evidence (Bettinger Reference Bettinger2015; Lévi-Strauss Reference Lévi-Strauss1955; Lowie Reference Lowie1948, Reference Lowie1954; Mauss and Beuchat Reference Mauss, Beuchat and Fox1979; Wengrow and Graeber Reference Wengrow and Graeber2015) of highly flexible sociopolitical configurations among historically known hunter-gatherers that facilitated situational leadership in ways that are more complicated than normative institutional hierarchies (Sanger Reference Sanger2022). As this situation pertains to Poverty Point research, inadequate chronologies and preconceived notions of hunter-gatherer sociality and creativity limit our understanding of the Poverty Point phenomenon.
We are in the midst of major changes in how we conduct radiocarbon dating and how we analyze the results. These changes will provide the means to develop detailed chronologies and thus better histories than previously possible. Archaeological theory turns on the control of time. As a result, relying on out-of-date dating methods and approaches perpetuates out-of-date theories and limits our capacities to understand the forces that contribute to cultural changes. At the cost of surrendering what were hard-won data, we must use critical and iterative chronological models, such as those presented here, if we are to understand anthropological and archaeological models of culture change and contribute to a meaningful and accurate understanding of Native histories across the continent.
Acknowledgments
We are indebted to Dr. Diana Greenlee, Poverty Point Station Archaeologist, Dr. Chip McGimsey, State Archaeologist, and Samuel Huey of the Louisiana Division of Archaeology. We thank Grace Ward (Washington University in St. Louis), Andy Schroll (Tulane University), and Matthew Rooney (Arkansas Archeological Survey) for their cooperation and assistance. This article benefited greatly from the thoughtful comments by two anonymous reviewers.
Funding Statement
Funding has been provided by the National Science Foundation (NSF BCS-2032257 to Grooms and NSF BCS-1953636 to Ward).
Data Availability Statement
No original data were used.
Competing Interests
The authors declare none.
Supplemental Material
The supplemental material for this article can be found at https://doi.org/10.1017/aaq.2023.85.
Supplemental Table 1. Radiocarbon Dates Used in this Analysis.
Supplemental Table 2. All radiocarbon dates attributed to Poverty Point cultural contexts.
Supplemental Table 3. Luminescence Dates from Poverty Point-Related Sites.
Supplemental Code 1. CQL codes for the models and data for each model iteration.


 Open access