
Using semantic story maps to describe a territory beyond its map
Abstract
The paper presents the Story Map Building and Visualizing Tool (SMBVT) that allows users to create story maps within a collaborative environment and a usable Web interface. It is entirely open-source and published as a free-to-use solution. It uses Semantic Web technologies in the back-end system to represent stories through a reference ontology for representing narratives. It builds up a user-shared semantic knowledge base that automatically interconnects all stories and seamlessly enables collaborative story building. Finally, it operates within an Open-Science oriented e-Infrastructure, which enables data and information sharing within communities of narrators, and adds multi-tenancy, multi-user, security, and access-control facilities. SMBVT represents narratives as a network of spatiotemporal events related by semantic relations and standardizes the event descriptions by assigning internationalized resource identifiers (IRIs) to the event components, i.e., the entities that take part in the event (e.g., persons, objects, places, concepts). The tool automatically saves the collected knowledge as a Web Ontology Language (OWL) graph and openly publishes it as Linked Open Data. This feature allows connecting the story events to other knowledge bases. To evaluate and demonstrate our tool, we used it to describe the Apuan Alps territory in Tuscany (Italy). Based on a user-test evaluation, we assessed the tool’s effectiveness at building story maps and the ability of the produced story to describe the territory beyond the map.
1.Introduction
Apart from their role to describe a territory, maps have always geographically supported storytelling and stimulated people’s imagination. Stories based on maps can be found from narratives and newspapers to historical literature. A map can even be integral part of a story to help characters or readers decipher the events [50]. Maps, alone, represent the spatiotemporal structure of a story, i.e., they represent the geography of a territory and the relationships between places, but should be enriched with oral/written events or digital audio/video material to describe the overall territorial complexity. The development of a map faces a perceptive cartographic challenge when it attempts to spatiotemporally represent also the life, emotions, reality, fiction, legends, and expectations associated with the described territory [18]. The process of both creating and annotating a map to face this challenge requires extensive work that could be a story by itself [48].
Story maps are computer science realizations of narratives based on maps. They are online interactive maps enriched with text, pictures, videos, data, and other multimedia information, whose aim is to tell a story over a territory. Story maps are largely used to effectively transmit the message of a narrative through many digital devices (e.g., PCs, tablets, smartphones, interactive displays). Stories represented through story maps include, for example, stage-by-stage narrated travels, territory points of interest, and a territorial change over time [11]. Story maps face a perceptive cartographic challenge by enriching the maps with multimedia data to increase the overall perception of the territory beyond the map. The perceptual gap between the territory as a whole and its narrated representation (i.e., the map) has been long analyzed within Korzybski’s General Semantics [35]. Story maps can help fill this gap by linking spatiotemporal events to emotions, perceptions, and historical context.
A common issue with current software for story map building is the low consideration of story creation as a collaborative process to produce complete and compelling stories. Most software solutions for story map creation are commercial – which reduces their number of users – and only allow users to develop individual stories independent from each other. They seldom include collaborative narrative building and the inter-linking of complementary stories sharing the same topics. Finally, most story map-building tools loosely manage multi-user and security issues for accessing online stories.
In this paper, we describe an online tool – the Story Map Building and Visualizing Tool (SMBVT) – that allows users to create story maps within a collaborative environment and a usable Web interface. The proposed software overcomes common limitations observed for alternative solutions. It is entirely open-source [30] and published as a free-to-use solution [44]. It uses Semantic Web technologies [28,31] in the back-end system to represent stories through a reference ontology for representing narratives [41]. It builds up a user-shared semantic knowledge base that automatically interconnects all stories and seamlessly enables collaborative story building. Finally, it operates within an Open-Science oriented e-Infrastructure (D4Science [6]), which enables data and information sharing within communities of narrators, and adds multi-tenancy, multi-user, security, and access-control facilities [5,7,23]. Our system represents narratives as a network of spatiotemporal events related by semantic relations (part-of, temporal, spatial, and causal relations). A story narrated as a timeline of events (a fabula, in the Russian formalism [51]) corresponds to a sequential report of the narrative events ordered as they occurred over time. A story map is instead a sequence of geospatial events ordered by a storyteller (a plot, in the Russian formalism [49]). SMBVT standardizes the event descriptions by assigning internationalized resource identifiers (IRIs) to the event components, i.e., the entities that take part in the event (e.g., persons, objects, places, concepts). The tool automatically saves the collected knowledge as a Web Ontology Language (OWL) [38] graph and openly publishes it as a Linked Open Data [12] network. This feature allows connecting the story events to other knowledge bases published as Linked Open Data (e.g., Europeana [29], Ornithology Based on Linking Bird Observations with Weather Data [34]).
To demonstrate the potential of our tool to meet a perceptive cartographic challenge, we used it to describe the Apuan Alps territory in Tuscany (Italy). Based on a user-test evaluation, we assessed the tool’s effectiveness at building story maps and the ability of the produced story to describe the territory beyond the map. The results also demonstrate the potential of our tool at overcoming common story map-software shortcomings through collaborative story building.
The paper is organized as follows: Section 2 reports an overview of common story map creation software and describes our proposed tool, its integration with the D4Science e-Infrastructure, and the evaluation case study. Section 3 reports the evaluation results. Finally, Section 4 discusses the results and draws conclusions.
2.Methodology
2.1.Overview of software for story map building
This section reports an overview of available software to create and visualize story maps, focusing on free-to-use solutions. We focus on tools that represent maps as sequences of events with multimedia content associated. These maps can potentially describe a territory as a whole and can be fairly compared with our solution. This overview does not include tools for generating multi-layered maps constituted only by collections of independent positional pins [37,47].
ArcGIS Storymap is a widely used software that allows creating, publishing and sharing interactive map-based narratives [1,3,55]. This software allows customizing maps by adding texts, photos, audio, and video information to the story events and creating personalized and informative stories. Several commercial versions are available, with complementary functionalities, but ArcGIS also offers a basic free version [4]. The free version does not permit using the produced story maps for commercial or governmental purposes. This version has advanced features disabled, e.g., external Web page embedding, advanced map-interaction facilities, theme customization, and controlled accessibility. Moreover, it does not allow importing story entities from existing knowledge bases (e.g., Wikidata). Generally, ArcGIS does not support story inter-linking and information storage on a back-end semantic knowledge base.
Timescape [52] is a map-based storytelling platform that supports (i) story event categorization through different colours, (ii) text, image, and external links attachment to events, (iii) map sharing and embedding on personal Web sites and social media, and (iv) event-commenting. Timescape is commercial software but offers a free version that allows creating up to five story maps. However, according to the information available on the software Web site, the current maintenance and support status is unclear.
StoryMapJS [32] is a free online tool to build story maps, also available as an embeddable JavaScript library. The online tool offers an editor accessible through a personal Google account. Personal accounting is supported through manual configuration-file change. A StoryMapJS story is organized as a sequence of slides, where each slide represents a story event with a specific place associated. Location assignment is facilitated by a location-to-coordinate helping tool. Media contents associated with the events should reside on external repositories or social networks. StoryMapJS embeds optimization algorithms to visualize and inspect large images associated with the events. It uses JSON files for internal data representation and exchange and allows users to publish publicly-accessible story maps on their Web sites.
A widely used approach to story map building is to modify a pre-existing HTML template, that internally uses map-visualization JavaScript libraries, and re-adapt it to new data. For example, story maps based on the Leaflet-Storymaps template [25] guide the users through a point-by-point tour with a scrolling narrative that displays text, images, audio, videos, and scanned-map backgrounds. Readers can scroll the story in a user-friendly way and click on positional pins to inspect narrative events. The HTML template internally reads the story map content from a GeoJSON data set and a custom CSV configuration file. Reusing this template requires expertise on GeoJSON datasets and understanding the CSV configuration file. The lack of a Web interface to re-adapt the data to another story makes this solution practically usable only by Web developers.
Another commonly used template is the free-to-use Mapbox Story Maps template [15]. It consists of two files: one for specifying the story source payload (text, locations, images, and videos) and display options, and another (an HTML file) that reads and interprets the JSON file and displays an interactive story. The two files constitute a static Web application to be published on a Web service. Mapbox offers a commercial cloud service to host the maps and add navigation, content search, and visualization optimization features.
A hybrid approach between HTML coding and story maps building is offered by TimeMapper [46]. This open-source software automatically produces stories from a CSV template file and publishes them on the TimeMapper Web site. Events can be connected to data accessible through public IRIs. A sequence of events having geospatial coordinates associated can become a story map. The story can also be represented as a timeline if time information is attached to the events. TimeMapper is based on commonly used open-source JavaScript libraries for timeline and map visualization, such as Timeline.js [33] and Leaflet [36].
A similar approach is used by Odyssey.js [45], an open-source tool that allows combining maps, narratives, and other multimedia files into a story. To create a story map, the user must compile a JSON template that specifies, for each story event, a title, a description, one map-centring coordinate pair, one positional pin coordinate pair, and hyper-links to images or videos.
2.2.The Story Map Building and Visualizing Tool (SMBVT)
We developed a tool for creating and visualizing story maps through a usable Web interface while using the Semantic Web technologies as back-end support. Our tool is an extension of a previous version named Narrative Building and Visualising Tool [42] (NBVT), which first introduced an ontology specifically created to represent narratives (the Narrative Ontology [41]). NBVT only supported narrative representation as an event timeline and did not support story maps; it required story events always to have temporal information associated and did not support spatial information. This limitation allowed us to improve the software and create the Story Map Building and Visualizing Tool (SMBVT), which supports both timeline and story map representations. Overall, the newly introduced functionalities – explained in the following sections – can be summarised as follows:
– Timeline and story map visualizations are supported as story representations;
– Temporal information is no longer mandatory for the story events;
– Spatial coordinates can be indicated for each event;
– Media objects IRIs (images and videos) can be attached to the events;
– The event sequence can be ordered either by date (fabula) or user-defined order (plot);
– An event “category” can be indicated, which corresponds to distinct icons and colours on the story map;
– A story map preview can be visualized before publication;
– The tool is integrated with the D4Science Open-Science oriented research e-Infrastructure [6];
– The stories can be published online through the e-Infrastructure.
2.2.1.Requirements
The principal requirement of SMBVT was to overcome the limitations of the solutions presented in Section 2.1. The scientific communities we support in international projects have the necessity to describe the value chains, ecosystem services, and biodiversity of their territories [14,24,43]. However, these communities cannot afford the costs of the available commercial platforms and often do not have sufficient IT expertise to modify story map templates. Moreover, their members require to collaborate when creating a story by exchanging data, opinions, locations, and historical facts. Thus, it was essential for us to design a platform that supported such an active collaboration between the community members.
On the other hand, these communities involve hundreds of researchers who do not know each other. This condition might hinder information exchange and reduce the interconnection between the produced stories. To this aim, our platform was requested to support a collaboration mechanism (passive collaboration) that automatically connected one story to the other community-produced stories (after the user’s agreement). The combination of active and passive collaboration aims to produce one overall “story of stories” for the community. In summary, our software requirements were the following:
– Re-use open-source software;
– Produce a free-to-use software with a ready-to-use online and accessible endpoint;
– Support online data and idea exchange, and social networking facilities (active collaboration);
– Connect all user-stories within one overall story (passive collaboration);
– Guarantee high-standard multi-user, multi-tenancy, and security service levels;
– Produce a user-friendly Web interface tool for story map creation;
– Produce usable story maps;
– Produce a satisfactory product for describing the territory as a whole, beyond the map, to manage a perceptive cartographic challenge;
– Make the product general enough to be applicable to many areas and topics.
Our system was developed as an open-source software (GPLv3 licence11) made up of several components. A free-to-use instance [44] is hosted on the D4Science e-Infrastructure and is accessible after free registration to the platform. The Web interface was designed to optimize the visualization of the story maps to meet perceptive cartographic challenges (Section 2.2.2). The back-end system was constituted by a Semantic Web-oriented architecture that supported passive collaboration (Section 2.2.3). The integration with an Open-Science oriented e-Infrastructure enabled active collaboration features, while satisfying high-standard multi-user and security requirements (Section 2.3).
2.2.2.Web interface for story map building
SMBVT offers an online graphical interface to create stories. This interface facilitates story-event building and event sequencing and contextualization. At the story creation time, the user writes a title that corresponds to the subject of the narrative. The system automatically associates this title to a Wikipedia entity (subject entity) and proposes it to the user for approval. The tool then queries Wikipedia (through official Wikipedia APIs) to extract all Wikipedia pages directly linked to the subject entity. Finally, the tool queries Wikidata (through its official SPARQL Query Service) to associate names, descriptions, and images to the entities included in the Wikipedia pages. Since Wikidata is an ontological knowledge base [54], this operation also retrieves Internationalized Resource Identifiers (IRIs) for the extracted entities. The user can also define new entities with associated names, descriptions, and Wikidata IRIs and Narrative Ontology classes. Therefore, these operations prepare the tool to build stories involving events already linked to a reference semantic knowledge base (Wikidata) in compliance with the Linked Open Data paradigm [27]. All the SMBVT entity retrieval operations towards Wikidata and Wikipedia are based on “mature and stable technology, actively supported and improved” [40,56,57]. Therefore, we did not re-evaluate the performance of these operations.
Fig. 1.
a. The story map building and visualising tool (SMBVT) interface for story map creation; b. A preview of a story map produced by our tool; c. A preview a story timeline produced by our tool.
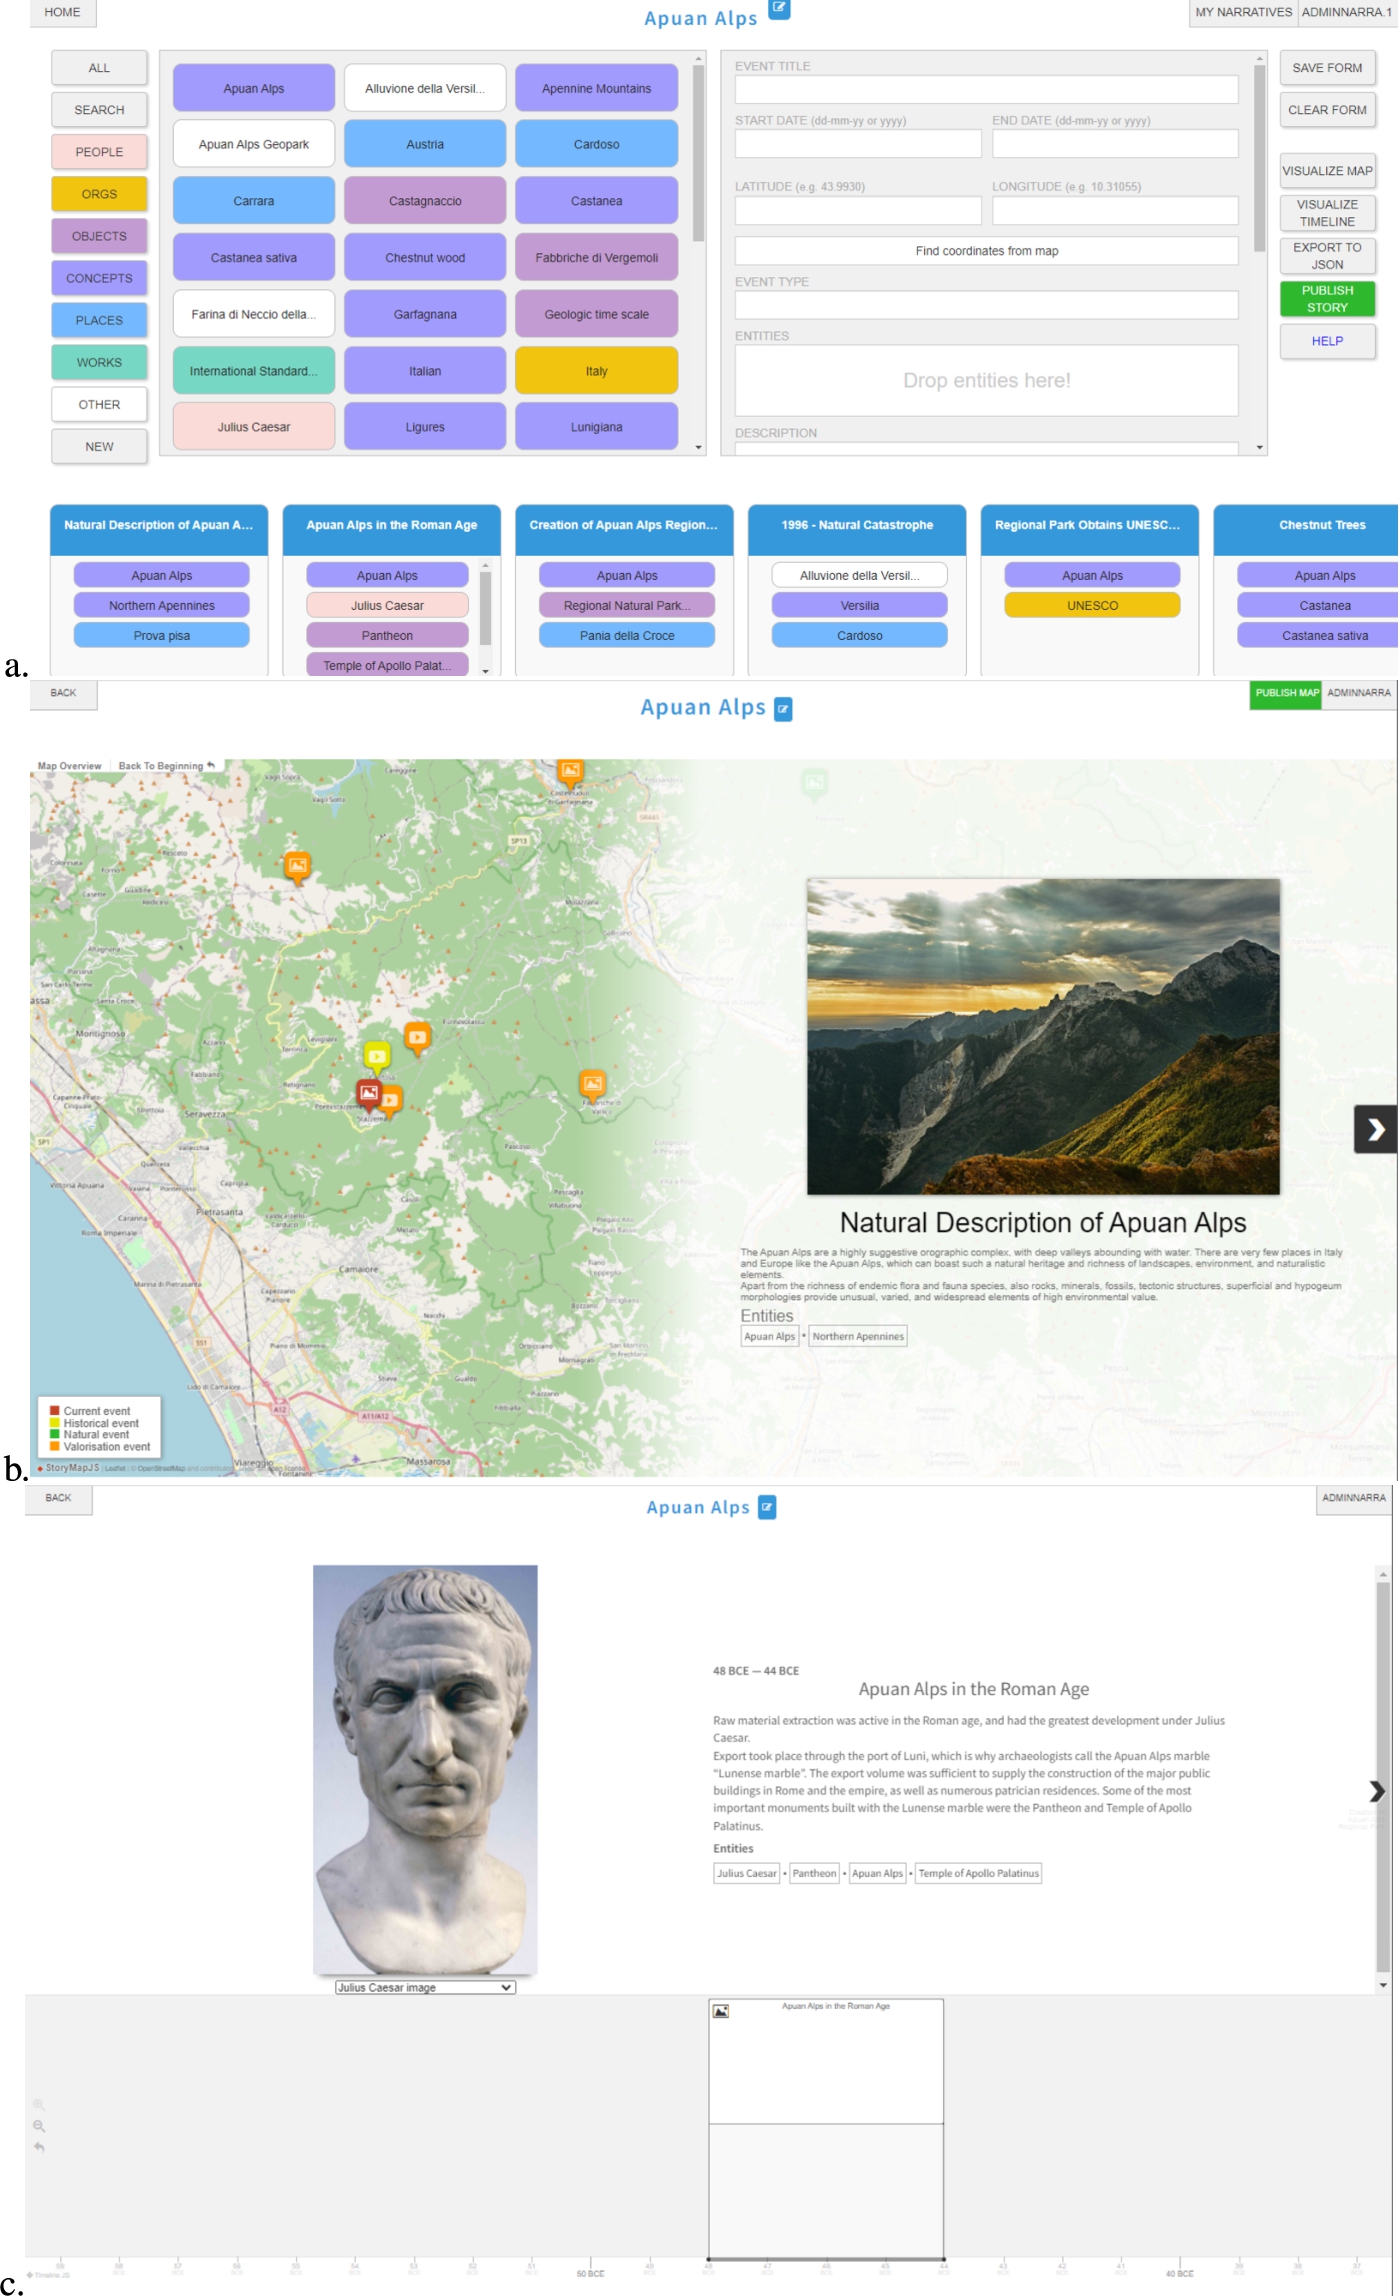
After the initialization phase, the tool displays the extracted Wikidata entities at the left-hand side of the screen (Fig. 1-a). These entities are classified into seven categories: person, organisation, object, concept, work and other (e.g., animals, fictional characters). They correspond to the top classes of the Narrative Ontology. Each entity is colour-coded according to its category. Through the icon at the right side of the title, the user can change the narrative title to differentiate it from the subject entity name (which was not possible in the previous NBVT software). The right-hand side panel allows creating the story events. Each event can involve a subset of the entities from the left-hand side part of the interface. Entities can be dragged and dropped into the “ENTITIES” event panel. Additionally, the user can complete the entity-definition form by adding the following information:
– The event name (title)
– Associated temporal information (start and end dates)
– Associated geographical coordinates (latitude and longitude)
– An event categorization among “historical”, “natural”, and “productive” (typology)
– A descriptive text
– User’s private notes (optional)
– The principal media object IRI (i.e., a YouTube video)
– Links to digital objects residing on external knowledge bases (e.g., Europeana digital objects) (optional)
The user should fulfil at least one among the temporal and geographical fields to contextualize the narrative event. Narratives of territories will likely have geographical information for most events and time indications for historical events. Conversely, a biography will likely have more historical events than geographical events.
The event categorization allows associating informative icons and colours to the geospatial events. Although the categories are general, they were initially conceived for territory modelling and will likely be extended in the future. Specifically, a “historical” event is related to the territory history (e.g., ancient Romans’ natural resource exploitation); “natural” events refer to natural aspects (e.g., biodiversity, landscape, ecosystem); “productive” events regard products, commerce, and manufacturing (e.g., the components of a local economy).
The interface allows users to insert hyperlinks into the descriptive event texts. In particular, the widget for writing the event descriptions allows inserting HTML tags. This functionality, for example, can be used to hyperlink a specific word in the text to a Wikidata entity. Instead, the entities dragged and dropped into the “ENTITIES” event panel will appear as overall hyperlinks to Wikidata entities under the event description. This hyperlinking approach is also suited for users unfamiliar with the HTML markup language.
After pressing the “SAVE FORM” button, an event is finally created and is reported in the lower “story” panel with a concise representation. The event form is re-populated for content modification or deletion by clicking on an event. The user can order the created events in the lower “story” panel to build up the plot of the story, i.e., the sequence of events as it should be narrated. If temporal information is available for specific events, a fabula – i.e., the sequence of events narrated as they occurred over time – is automatically created for these events.
The “VISUALIZE MAP” button generates a preview of the narrative as a story map (Fig. 1-b), which reports the event sequence as the user-defined plot. Only the events with geographical coordinates associated will be included in the story map.
The “VISUALIZE TIMELINE” button re-uses the previous NBVT functions to visualize an event timeline according to the fabula (Fig. 1-c). The timeline will only include the events with temporal information associated.
The “EXPORT to JSON” button returns the complete event sequence – with all images and media objects and ontological IRIs associated – as a JSON file (Section 2.2.3). This file allows users to obtain a structured, offline representation of the story. The JSON format can directly be parsed by many software solutions and programming languages. JSON is indeed an open-standard description, and a language-independent data-interchange format that uses human-readable text to store and transmit data objects consisting of attribute–value pairs and arrays. It is commonly used for electronic data exchange, including web client-server interactions.
The “PUBLISH STORY” button asks the user if (s)he agrees to make the story become part of an overall knowledge base shared within a community of practice (Section 2.4). If the user agrees, the story is transformed into an OWL graph and stored in a semantic SPARQL server that collects the stories (Section 2.2.3). This operation can later be withdrawn by opening a support ticket through the D4Science e-Infrastructure.22 At the same time, the button publishes the story on the D4Science e-Infrastructure and produces a public link to the story map. This link can be shared through the moderated-access collaborative environments in which the tool is available (Section 2.4).
Finally, the “HELP” button allows users to access a short user guide of SMBVT.
2.2.3.Back-end services
The SMBVT back-end architecture extends the previous NBVT architecture [42] to meet our target requirements for story map representation (Fig. 2). The Web application directly orchestrates all user operations behind the scenes. It was developed as an open-source Java Tomcat application [30]. The interface uses the back-end services to store narrative information, generate semantic knowledge, and produce the story map/timeline visualizations.
Fig. 2.
The architectural schema of our Story Map Building and Visualising Tool (SMBVT).
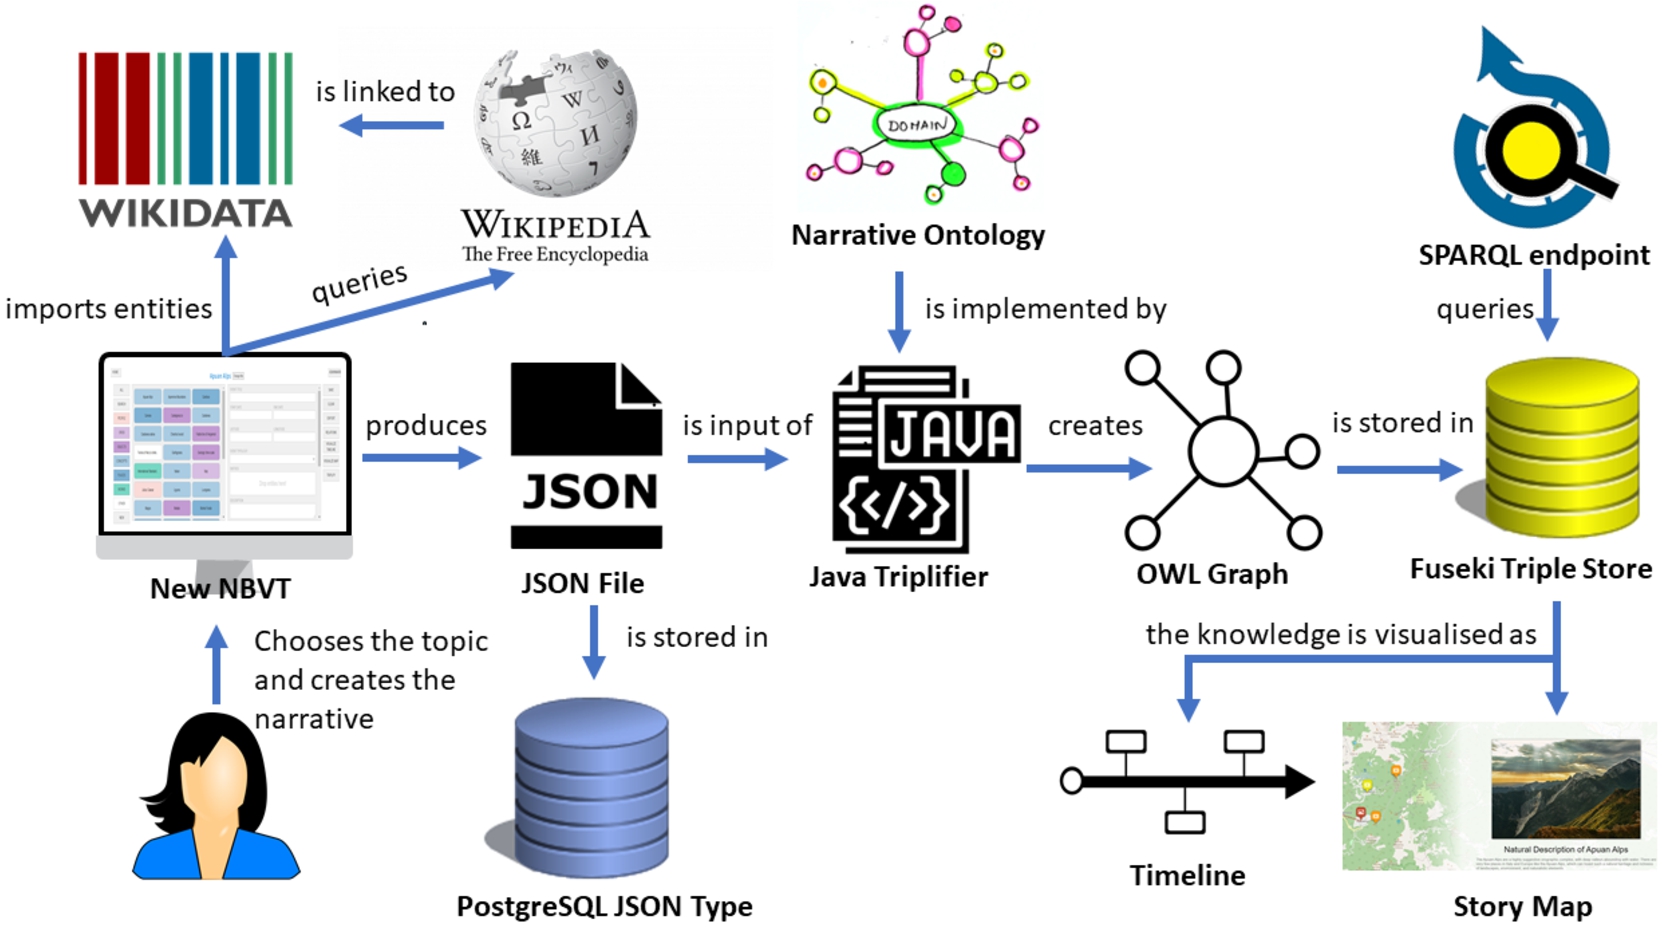
Internally, our software uses a JSON schema to represent narrative events [9] structured according to the Narrative Ontology classes. The Wikidata entities extracted at the story creation time are organized into a structured PostgreSQL-JSON database that optimizes queries to JSON-represented data. The PostgreSQL-JSON database stores all the event data specified in the event-creation form. At the “SAVE FORM” button press, the Web application transforms the data into JSON files and directly stores them in the PostgreSQL-JSON database. An overall JSON file including the entire set of story events (the story JSON file) is produced when pressing the “EXPORT TO JSON” button. Our previous NBVT software stored data in an unstructured CouchDB-based storage system, which had lower querying performance, system security and reliability.
“PUBLISH STORY” button press, the application retrieves the story JSON file from the database and transforms it into a Web Ontology Language (OWL) graph. This graph complies with the Narrative Ontology [41] model. The graph is then stored to an Apache Jena Fuseki SPARQL server [2]. The previous NBVT software used Blazegraph [13] for the same purpose, which is no longer maintained. The Fuseki SPARQL server provides a SPARQL endpoint that allows querying the complete graph of collected stories. This server organizes the user stories as the sub-graphs of one overall story graph that is compliant with the Narrative Ontology. Overall, the knowledge base enrichment operation implements an automatic (passive) collaboration. All user-story graphs follow the same ontological model; therefore, a SPARQL query can easily search the overall graph without distinguishing the stories. For example, queries on the overall graph can retrieve (i) the number of “productive” events using one specific entity across stories, (ii) the nations that share the same entities in “productive” events, (iii) the co-occurrence frequency of two entities across stories, (iv) the most frequent entities across event typologies, (v) the most geographically extended stories (i.e., those having the most extended bounding box around event locations). We will further explain how this approach contributes to collaborative story building in Section 2.4.
We foresee different SMBVT installation configurations (i.e., front-end application and back-end services) for different communities of practice. The SPARQL endpoint of one community’s story-graph is accessible to that community’s members-only (through the D4Science access management facilities, Section 2.3), including analysts willing to extract patterns from the overall graph. However, since the graphs produced by two communities are compliant with the Narrative Ontology and might share Wikidata entities, two community graphs can be easily merged into one. This operation makes it easy, for example, to merge the stories produced by two communities to serve a new community (Section 2.4).
2.2.4.Story map visualisation
The SMBVT-produced story maps place the narrative events on an interactive map while respecting a browsing order based on the user-defined plot. Each story event is associated to one positional pin, one image/video, one title and descriptive text, and hyperlinks to Wikidata entities and external digital objects (e.g., Web pages and Europeana objects). A dashed line connects each event to the previous story event (Fig. 3-a and -b).
Fig. 3.
a. An event of our story map case study on Apuan Alps regarding the beauty of the centuries-old Chestnut trees; b. an event of the same story map that includes a video about the valorization and preservation of the local economy.
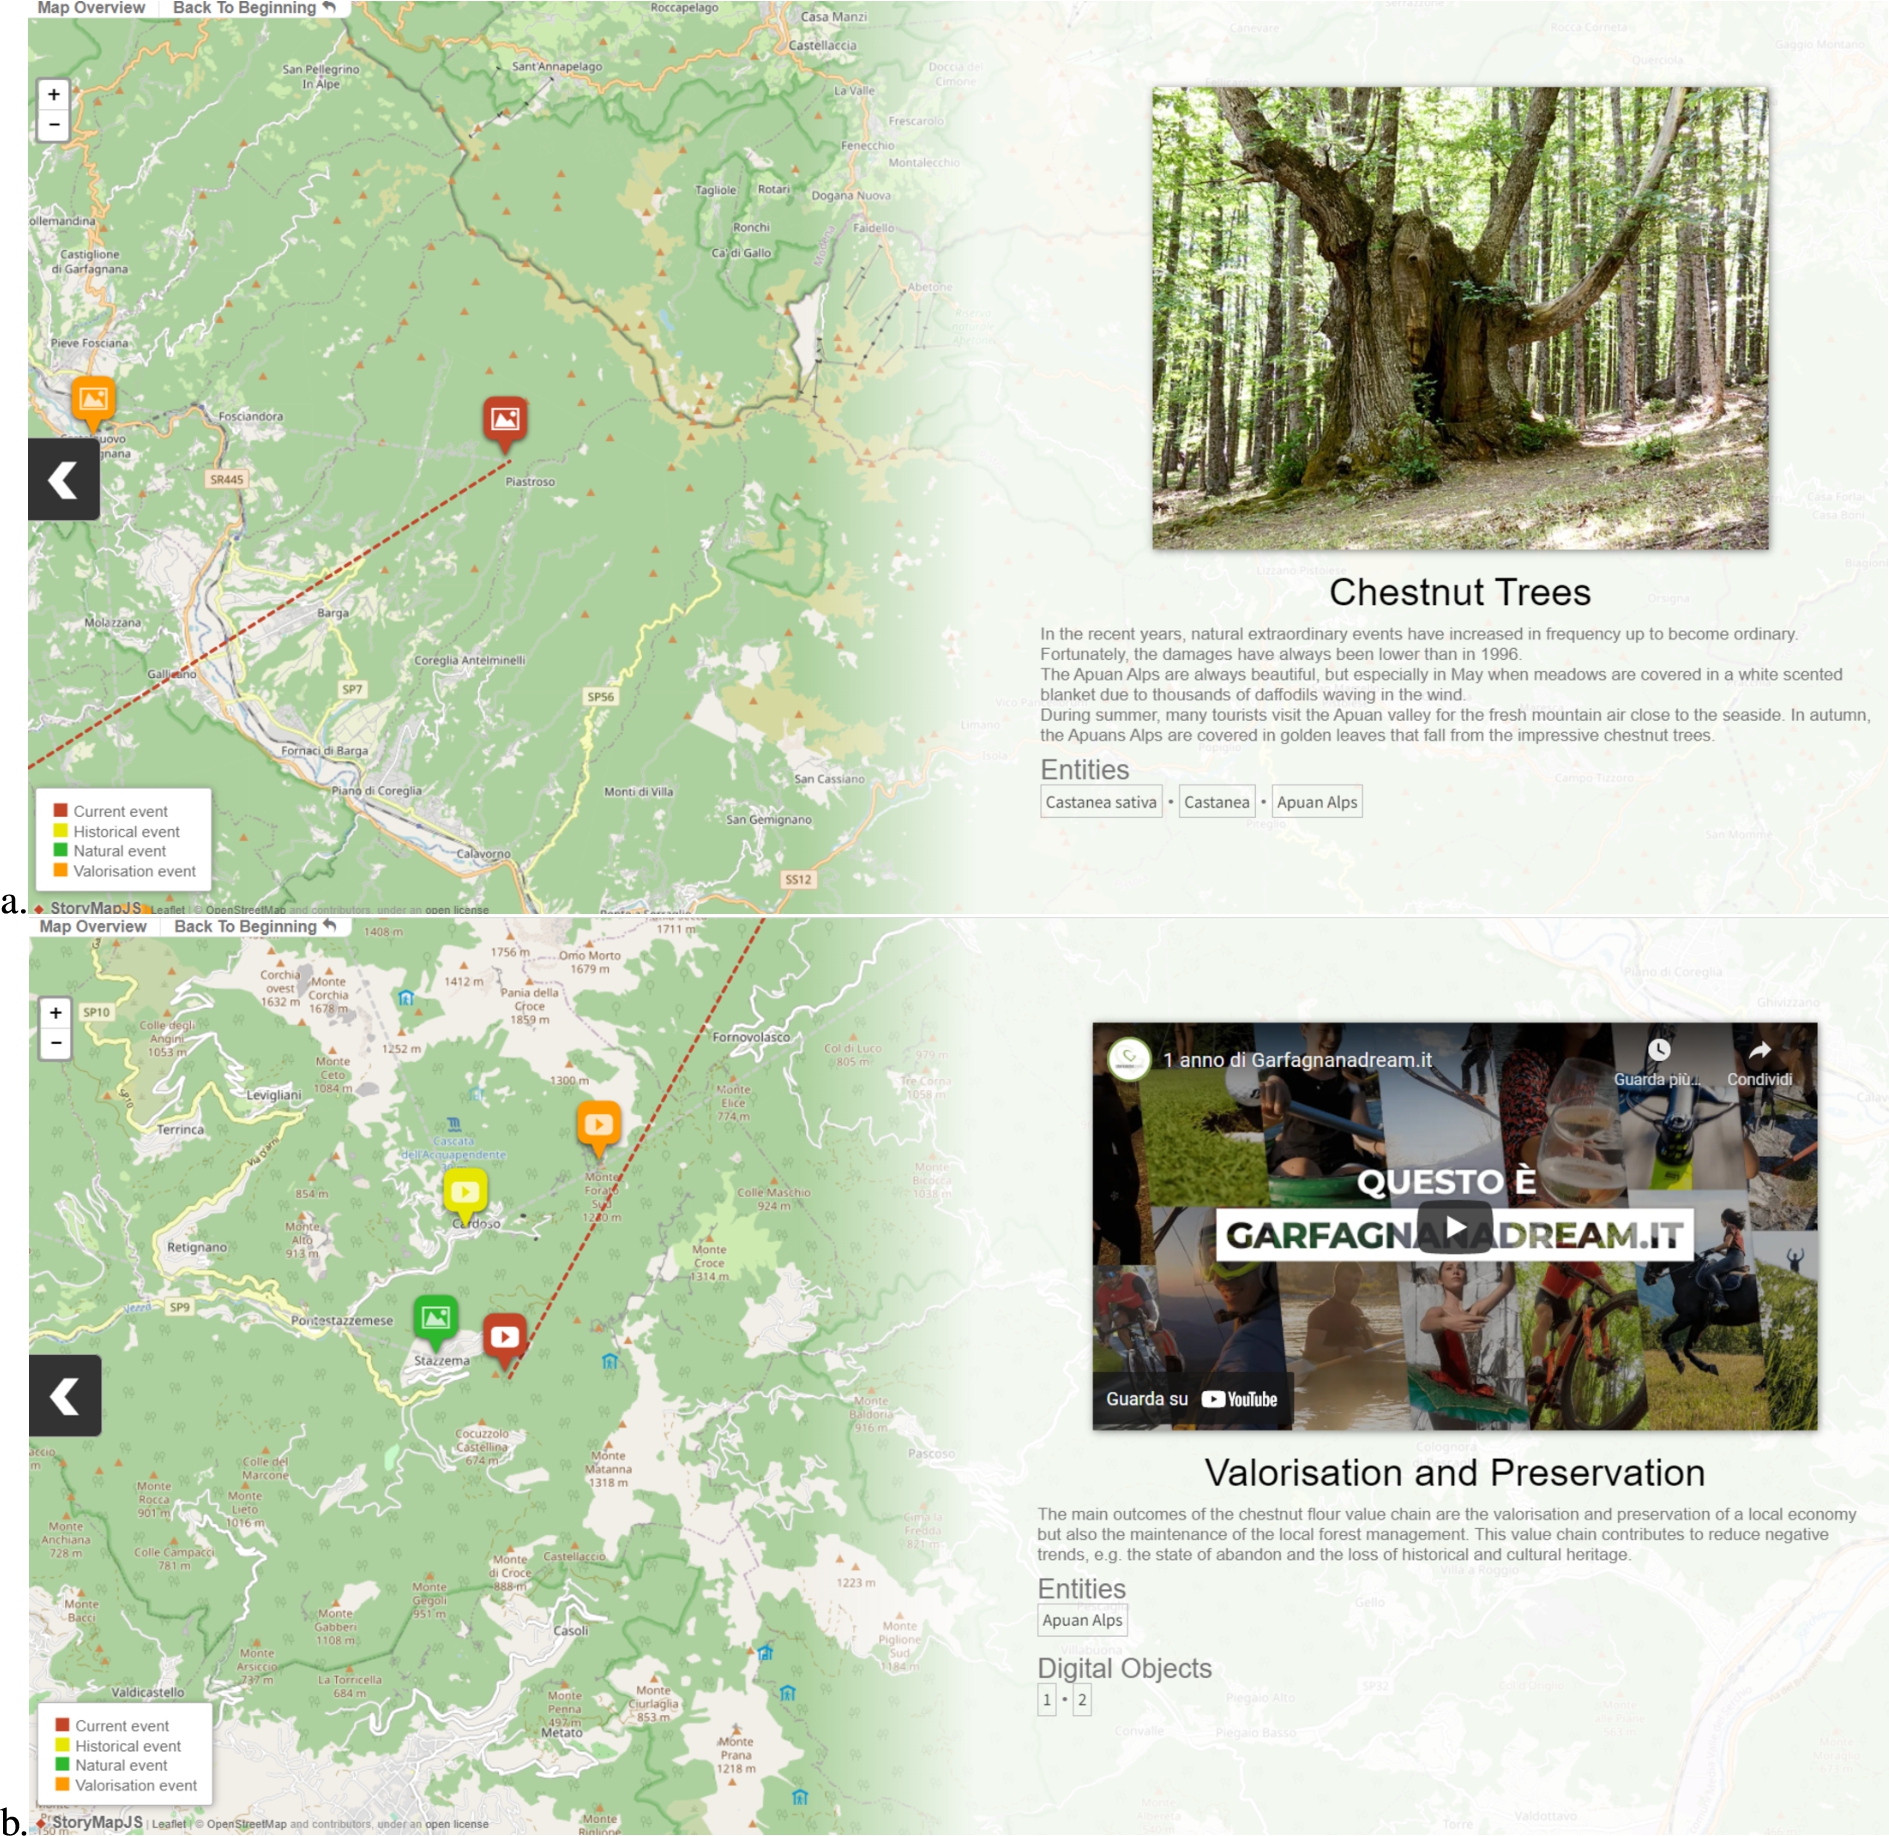
Our implementation re-uses StoryMapJS [32] for map interaction and event browsing and visualization. We chose StoryMapJS also to manage large background maps and images associated with the events. For our purposes, StoryMapJS was custom re-configured to suit the SMBVT visualization style. Since StoryMapJS natively supports data represented as JSON files, integration only required mapping the SMBVT JSON schema to the StoryMapJS JSON schema. StoryMapJS represents a story map as a sequence of “slides”. Each slide corresponds to one story event and is composed of two parts. The first part is a background map displayed on the left-hand side of the screen, with events’ positional pins distributed according to their geographic coordinates. We configured StoryMapJS to display the event positional pins with different colours (and image/video icons) depending on their typology: yellow for “historical” events, green for “natural” events, and orange for “productive” events. The selected-event positional pin is highlighted in red, and a vector line is traced towards the previous event to keep track of the event sequence. An overlaid legend explains the meaning of the different colours. Map zooming and panning are enabled through interface buttons and mouse click events. The second part is the event information, displayed on the right-hand side of the screen. All information specified through the event-compilation form is reported. When the story map is produced, these data are automatically transformed from the SMBVT PostgreSQL-JSON schema to the StoryMapJS JSON schema. The event preview image (or video) is the “media object” specified in the event compilation form. Other media content is available in the Wikidata links associated with the component entities and in the external digital object links.
When a story map is published, SMBVT generates a static Web application that embeds all required JSON data, JavaScript instructions, and libraries. This application is then transferred to a public-access D4Science-hosted Apache Tomcat Web service, invisible to external Web crawlers, and a link to the application is returned to the user. Each publication operation overwrites the previous application so that the public link always points to the latest version.
2.3.Integration with an open science-oriented e-infrastructure
Open Science e-Infrastructures are networks of IT resources that principally support (i) the open publication of data and documents, (ii) the extraction of new knowledge from Big Data, and (iii) collaboration between users. Generally, they aim at supporting modern research that satisfies the Reproducibility, Repeatability, and Re-usability of models and data [19]. Open Science e-Infrastructures can serve multiple scientific communities, orchestrate heterogeneous data formats and repositories, and support collaborative experimentation. They can embed cloud computing systems with standardized interfaces that manage large computations on Big Data while tracking computational parameters [20,23]. D4Science is a free-to-use fully-compliant Open Science-oriented e-Infrastructure [5], constituted by a network of hardware and software resources (e.g., Web services, databases, semantic knowledge bases) that enable remote user collaboration, data exchange, and collaborative data-intensive processing. D4Science can manage heterogeneous access policies to data payloads, catalogues, computational resources, and Web services. It offers data sharing facilities to all users through a distributed file system (the Workspace) along with a social networking platform that allows users to share information and data [17,20]. D4Science allows creating Virtual Research Environments (VREs) to reserve collaboration and computational facilities for specific researchers’ communities of practice. Collaboration within one community of practice improves the interconnection between the members of multidisciplinary communities, within the hypothesis that combining complementary ideas would produce new knowledge. For example, a D4Science VRE focusing on Marine Science can connect marine biologists with AI experts to include biological knowledge into AI models [16,19]. Similarly, VREs can manage independent communities, such as computational linguists [22] and geothermal energy scientists [53], that could eventually share methodologies for cross-application (e.g., to extract classification tags from geothermal documents). D4Science manages multiple access modalities to different VRE users (e.g., managers, members, system administrators). Each VRE usually serves one community of practice and includes social networking facilities that can directly re-use the data residing on the users’ private Workspace and create focussed discussions within the VRE. Secure access is guaranteed for all hosted facilities, including services, data, and catalogues through a high-standard accounting system [6].
We integrated SMBVT with the D4Science high-standard accounting, multi-tenancy, and security services and made it available within a VRE [44] created for the MOVING European project [43] scientific community that focuses on mountain value chains valorization. The VRE offers user-access moderation to the project administrators. Moreover, it offers data sharing and social networking facilities on the VRE home page to practically foster active collaboration. The SMBVT creation and visualization interfaces and the back-end services are available to all VRE users and are part of the resources offered by D4Science to the MOVING community. The SMBVT back-end re-uses the D4Science users and roles to control access and manage story authorship through secured credential exchange with the D4Science systems. The D4Science Open Science-oriented features also allow either re-installing or re-using SMBVT across different VREs. If two communities working in different VREs decided to share knowledge within a new VRE, a merged semantic knowledge base would be offered in the back-end system. For example, a VRE community focusing on mountain value chains might desire to merge stories with a VRE community working on mountain ecosystems to inter-link value chains and ecosystems, and possibly discover new correlations and causal relations.
2.4.Collaboration
SMBVT offers two types of collaborative features to community of practice users. On the one hand, it offers active collaboration, which consists of social networking and data sharing facilities within a VRE, through the D4Science social facilities (Section 2.3). Shared information can be in the form of a user’s “post” the platform automatically sends to all VRE members, containing information about events, data, and locations. The post can include data available on users’ private Workspaces. These data will appear in the post as HTTP links either accessible to the VRE members only (private links) or to everyone (public links). They can thus be re-used in different story maps created by the community members. The VRE social networking facilities also allow replying to a post and upvoting it.
On the other hand, SMBVT offers passive collaboration as an automatic feature managed by the back-end system. When the user voluntarily presses the “PUBLISH STORY” button, the system adds an ontological graph representation to the ontological knowledge base dedicated to the VRE community of practice. Different user-generated stories (user-graphs) might share the same event entities (e.g., the same person, object, or place). Consequently, the semantic knowledge base automatically connects the events that share the same components. This operation creates an overall story graph that interconnects all stories. Therefore, this mechanism implements a “many stories-to-one story” transformation, in which all individual user stories eventually become the sub-graphs of one overall story. For example, in the context of the MOVING project [43], the stories of two value chains insisting on the same territory but focusing on different aspects (e.g., sheeps and potatoes) would be sub-stories sharing territorial locations. These stories would directly be inter-linked through event coordinates. Furthermore, two countries (e.g., Austria and the Czech Republic) could share the same value chain type (e.g., beer production) with similarities in the production and supply chains. The stories of these value chains would automatically be interconnected through their shared event-entities.
The automatically created interconnections allow inferring new knowledge – e.g., previously unseen spatial correlations, causality, frequent events and entities – by exploring the overall graph through SPARQL queries. For example, different MOVING participants could generate many story maps describing European mountain value chains. Our system would automatically inter-link these stories through the SMBVT ontological knowledge base. Querying this overall graph would reveal new interesting evidence such as (i) the similarities between different nations’ value chains (e.g., are there countries that export the same product to the same countries? How much complementary are the products of two nations?), (ii) the most common use of the value chain components (e.g., are sheeps more used for wool than cheese in Europe?), (iii) the most common value chain, (iv) the value chains with the largest geographical extent. In summary, the combination of active and passive collaboration in SMBVT is principally committed to extract new knowledge through information sharing, linking, and semantic inference.
2.5.Case study and evaluation methodology
We described the Apuan Alps territory in Tuscany (Italy) as a case study. The information and associated multimedia content about this territory was provided by scholars of the Department of Agriculture, Food and Environment of University of Pisa. Apuan Alps are particularly suited to studying the difference between maps and territories. They are a highly suggestive orographic complex, with deep valleys and abundant water resources. Since the Roman age, territorial resources have been exploited; white marble was extracted and used from public to private buildings throughout Caesar’s empire. Cultural and natural heritage is bound to its peculiar biological and geological features, i.e., the endemic species and the particular rocks, minerals, fossils, tectonic structures, superficial and hypogeum morphology. However, the ecosystem is vulnerable because of abandonment, climate change, and periodic natural catastrophes (e.g., in 1996, an extraordinary rainfall caused flooding, casualties and severe damages). To monitor and preserve the area, the Apuan Alps Regional Park was instituted in 1985, and in 2015 obtained the status of “UNESCO Global Geopark”. Apuan Alps are visited in all seasons, and in Autumn they are particularly fruitful for the chestnut flour value chain. Chestnut woods, including resident centennial chestnut trees, have long been integral support of this area’s economy. Chestnut flour is still widely used for traditional food and exported outside the region. This territory’s cultural and economic heritage is strictly bound to chestnut flour production. Overall, the Apuan Alps include a rare mixture of natural, landscape, and cultural factors, whose representation requires more than a set of map and raster data. Its description as a story map should transmit the beauty, sensations, and ecological and cultural importance of this territory.
We, therefore, represented Apuan Alps through a story map (https://dlnarratives.eu/Storymaps/Apuan_Alps/) that concisely described (i) the focal points of the landscape and history, (ii) its fragility, (iii) the sensations associated with chestnut trees, (iv) the chestnut flour value chain and its importance for people’s life and local traditional food. The story map enriched locations with image and video contents about the above aspects. Positional-pin colours and icons referred to the type of event represented in that location, i.e., image/video icons were associated with historical references (yellow-historical events), environmental information (green-natural events), and institutional/traditional information (orange-productive events). The implemented story map consisted of 10 events associated with several Wikidata entities. Some events had additional digital objects associated, in the form of videos and documents residing on external Web sites. Although ten events did not represent the full complexity of the territory, the story map was direct, concise, easy to follow, and touched all the essential topics we wanted to represent, i.e., landscape, salient historical and environmental background, general information about the Park, important natural events, and the chestnut flour value chain.
The Apuan Alps story map was proposed to experts of mountain value chains involved in the MOVING European project. However, these experts were not familiar with story maps. We first evaluated if the user experience was satisfactory, the graphical representation was clear and friendly, and the interface was usable. Then, we verified if the story map overall extended a pure map representation to describe the territory, i.e., if it met a perceptive cartographic challenge. Specifically, we evaluated if the story map correctly represented the emotional, historical, and natural context of the Apuan Alps and transmitted chestnut flour’s cultural and economic value. Overall, we used the content-rich Apuan Alps case study to evaluate if our representation could effectively represent the territory beyond the map.
2.5.1.Online surveys
As evaluation approach, we used two anonymous surveys developed with Google Forms [26]. The first survey collected suggestions and comments from 5 researchers, expert in story map usage and creation, who had used SMBVT to create the story map. The second survey collected the opinions of 38 end-users who had interacted with the Apuan Alps story map.
The first survey included 18 questions regarding the tool usability. We focused the survey questions on the following general aspects: (i) general interaction with the interface, (ii) ease to import Wikidata entities in the tool, (iii) usefulness of entities to facilitate and accelerate the creation of the story map, (iv) usability of the interface to create a single event, and (v) effectiveness of the event sorting facility. The participants in the first survey were aged between 31 to 50 years and were all researchers. This choice reduced the number of participants but increased result reliability. All participants were practically involved in creating the Apuan Alps story map and had complementary expertise and points of view. They were all regular Android-smartphone and Android-tablet users who access the Internet more than once per day for scientific interests. Their primary used Internet browsers were either Google Chrome (75%) or Mozilla Firefox (25%), from either Windows (75%) or Linux (25%) Operating Systems.
The second survey included 22 questions about the main aspects of the Apuan Alps story map usability and usefulness to represent the territory. In particular, we focused the questions on the following general aspects: (i) navigation usability, (ii) informative effectiveness of the Wikidata entities and digital objects, images, and videos attached to the events, (iii) awareness of the territory in which the story took place, (iv) description of the territory beyond the map. Specific attention was given to the responsiveness of the layout and the accessibility of the story map from different devices (PCs, smartphones and tablets). The participants in this second survey were aged between 31–50 years (56%), 20-30 years (20%), and 51-65 years (24%). Most of them were researchers (56%) but also University professors (15%), students (9%), and other unspecified professions (20%) were involved. All participants were regular smartphone or tablet users (78% Android, 21% Apple, 1% Android-tablet-only) who access the Internet more than once per day for private or scientific interests. They used Google Chrome as the primary Internet browser, from Windows (50%, with 6% Windows 8.1 and 44% Windows 10), Mac OS (38%), Linux (3%), or unspecified (3%) Operating Systems. Interestingly, 91% of the users declared unfamiliarity with story maps.
In both surveys, questions were posed through multiple-choice answers and textual areas (to ask for personal comments or suggestions). For six questions in each survey, we used a 5-point Likert scale value from 1 (totally negative) to 5 (totally positive) to express multiple-choice opinions. The other questions either asked for open-text answers or regarded general demographic, professional, and technological information.
3.Results
This section presents the evaluation of our SMBVT tool (Section 3.1) and the proposed story map study case created through it (Section 3.2).
3.1.Evaluation of SMBVT
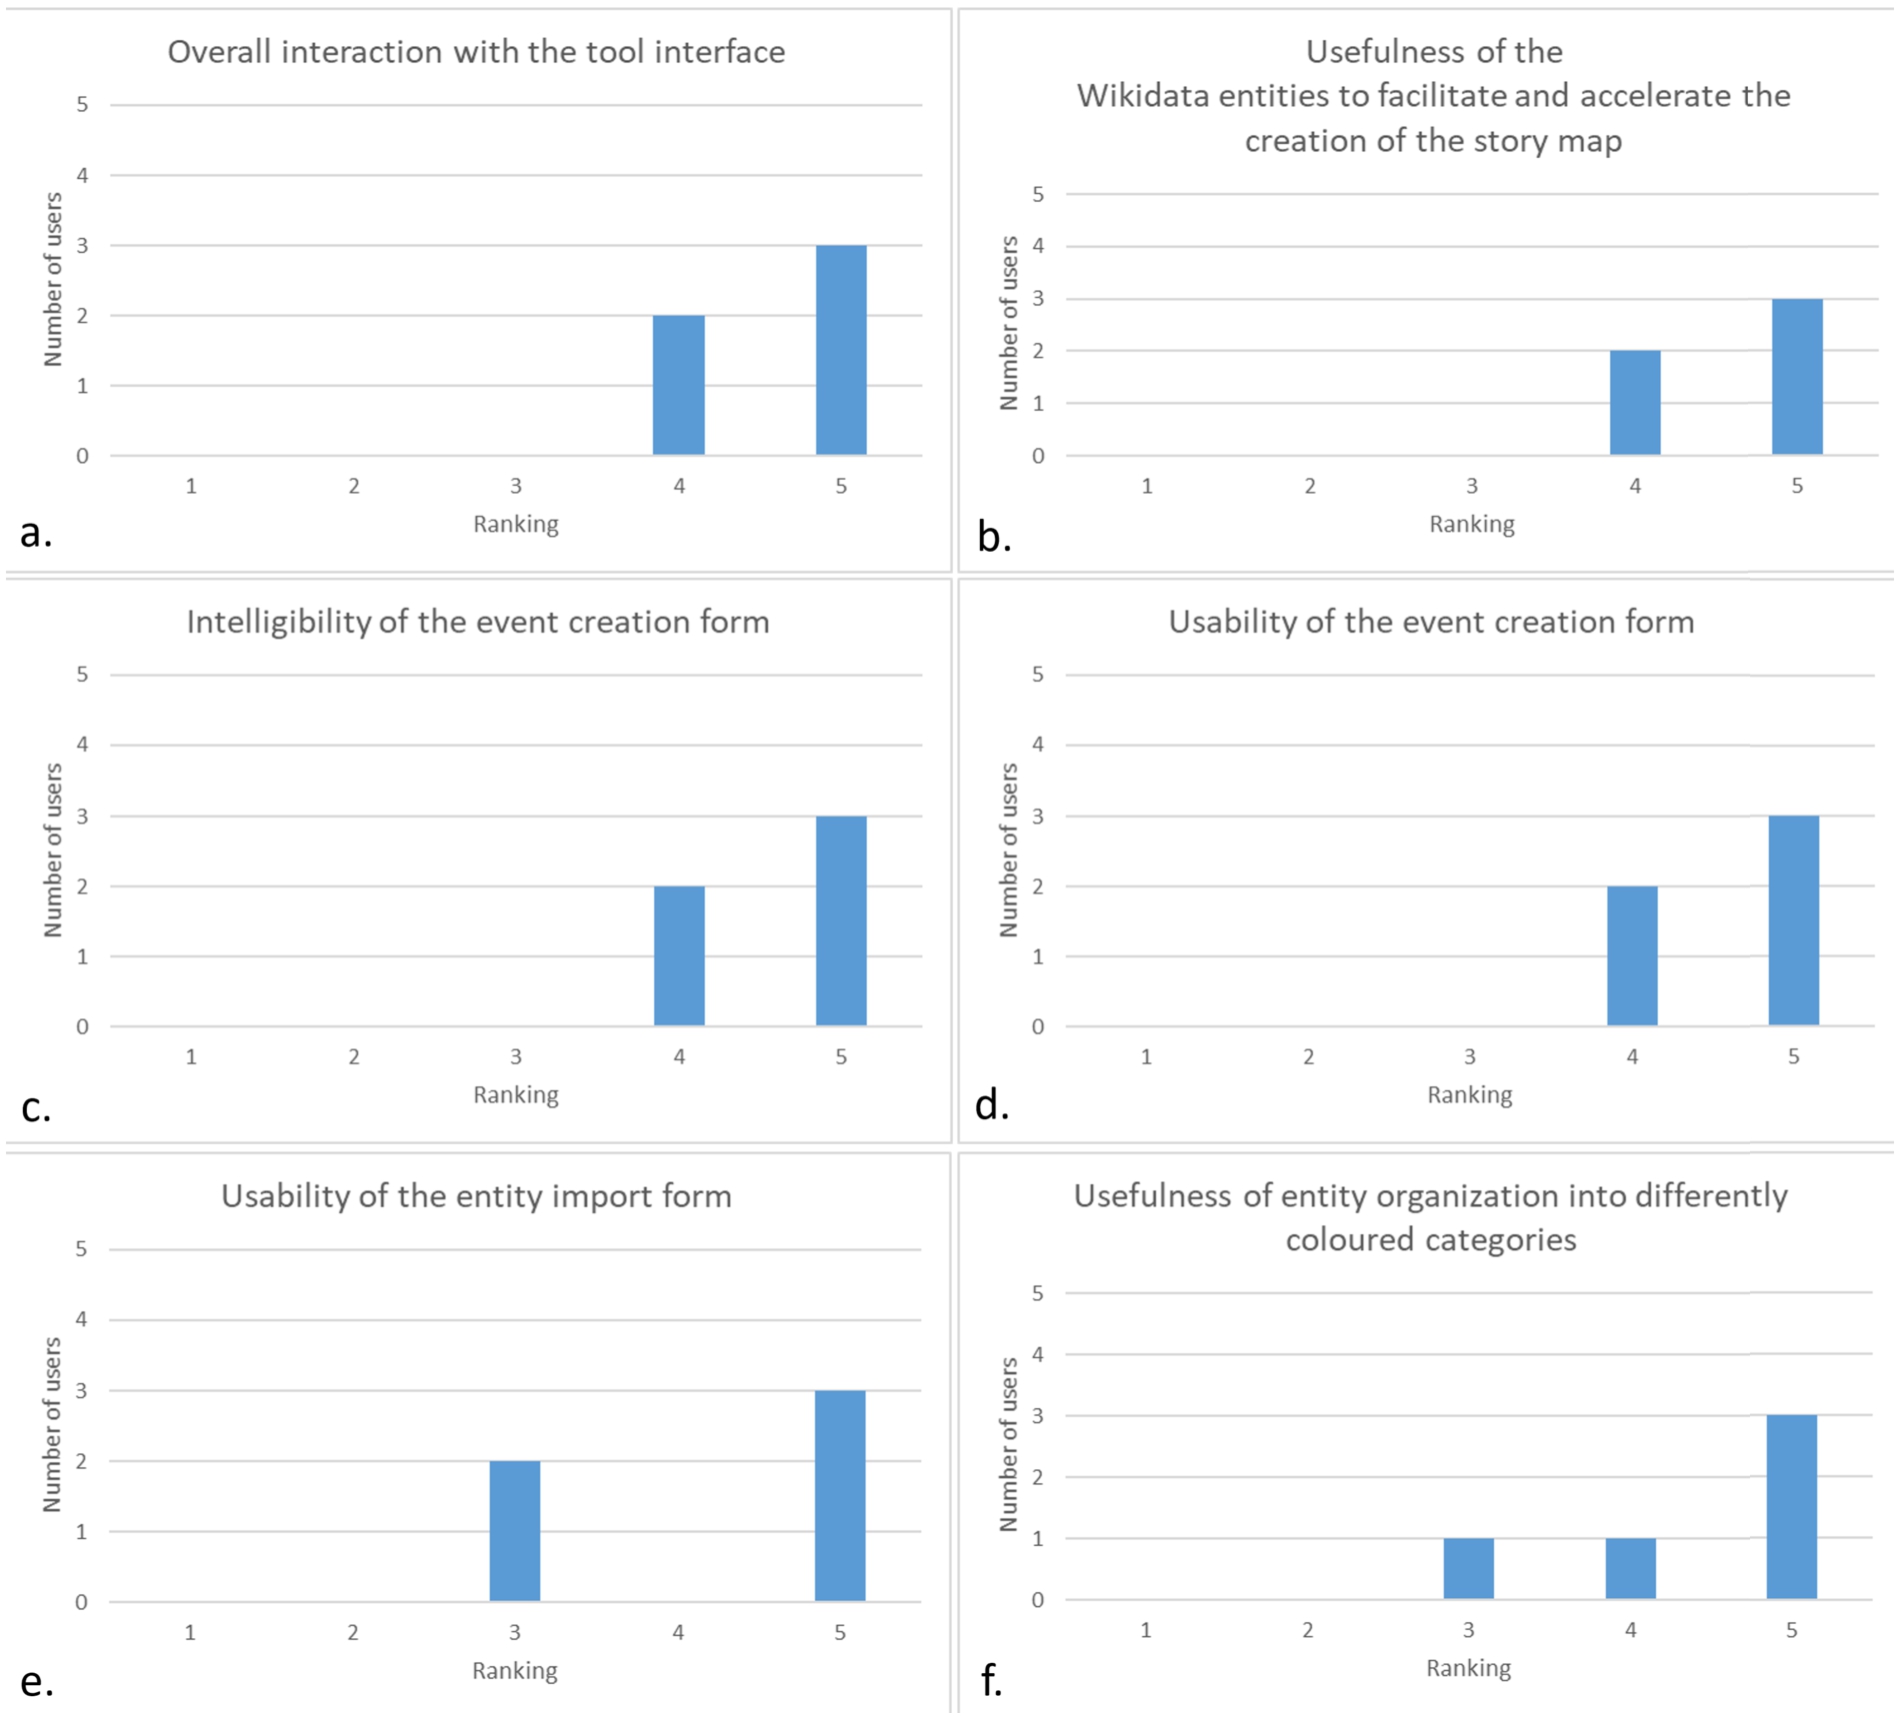
In the following, we analyze the results of our first survey, which focused on the story map building tool (Fig. 4). As for the overall interaction with the tool interface, 3 users considered it very positive (5-ranking), and 2 users as positive (4-ranking) (Fig. 4-a). The same positive scoring (i.e., 3 users assigning 5-ranking and 2 users assigning 4-ranking) was observed for (i) the usefulness of the automatically imported Wikidata entities to facilitate and accelerate the story map creation, (ii) the intelligibility and (iii) usability of the event creation form (Figs 4-b-d). As for custom-entity importing, 3 users considered it very easy to use (5-ranking), and 2 users as moderately easy to use (3-ranking) (Fig. 4-e). Regarding the usefulness of entity organization into differently coloured categories, 3 users assigned a 5-ranking, one user assigned 4-ranking, and another one assigned 3-ranking (Fig. 4-f). Thus, the tool was overall evaluated as being sufficiently usable.
Fig. 4.
Evaluation statistics of the 5-point Likert scale rankings assigned to our story map building tool about: a. the overall interaction with the tool interface; b. the usefulness of the Wikidata entities to facilitate and accelerate the creation of the story map; c. the intelligibility and d. usability of the event creation form; e. the usability of the entity import form; f. the usefulness of the proposed entity organization into differently coloured categories.
Textual comments raised suggestions to improve usability by (i) adding specific captions to the image/videos attached to an event (2 users), (ii) customizing the name of the external digital objects referring to Web sites or other knowledge bases (1 user), (iii) assigning a larger panel to the event creation form (1 user), (iv) producing informative messages about what the system is doing behind the scenes (e.g., entity retrieval from Wikidata, event saving, OWL graph production) to enhance operational transparency. Suggestions were also given to improve the tool functionalities. In particular, one user suggested adding the possibility of directly connecting a story to other specific stories already published on the system, i.e., choosing among a list of already created stories to make users jump to another story from a specific event. Another user suggested enabling an option to choose between different background maps (e.g. political, environmental, street). Finally, another user asked for a function to attach polygonal areas other than positional pins to events. We will take all these requests into account in our future SMBVT releases.
Fig. 5.
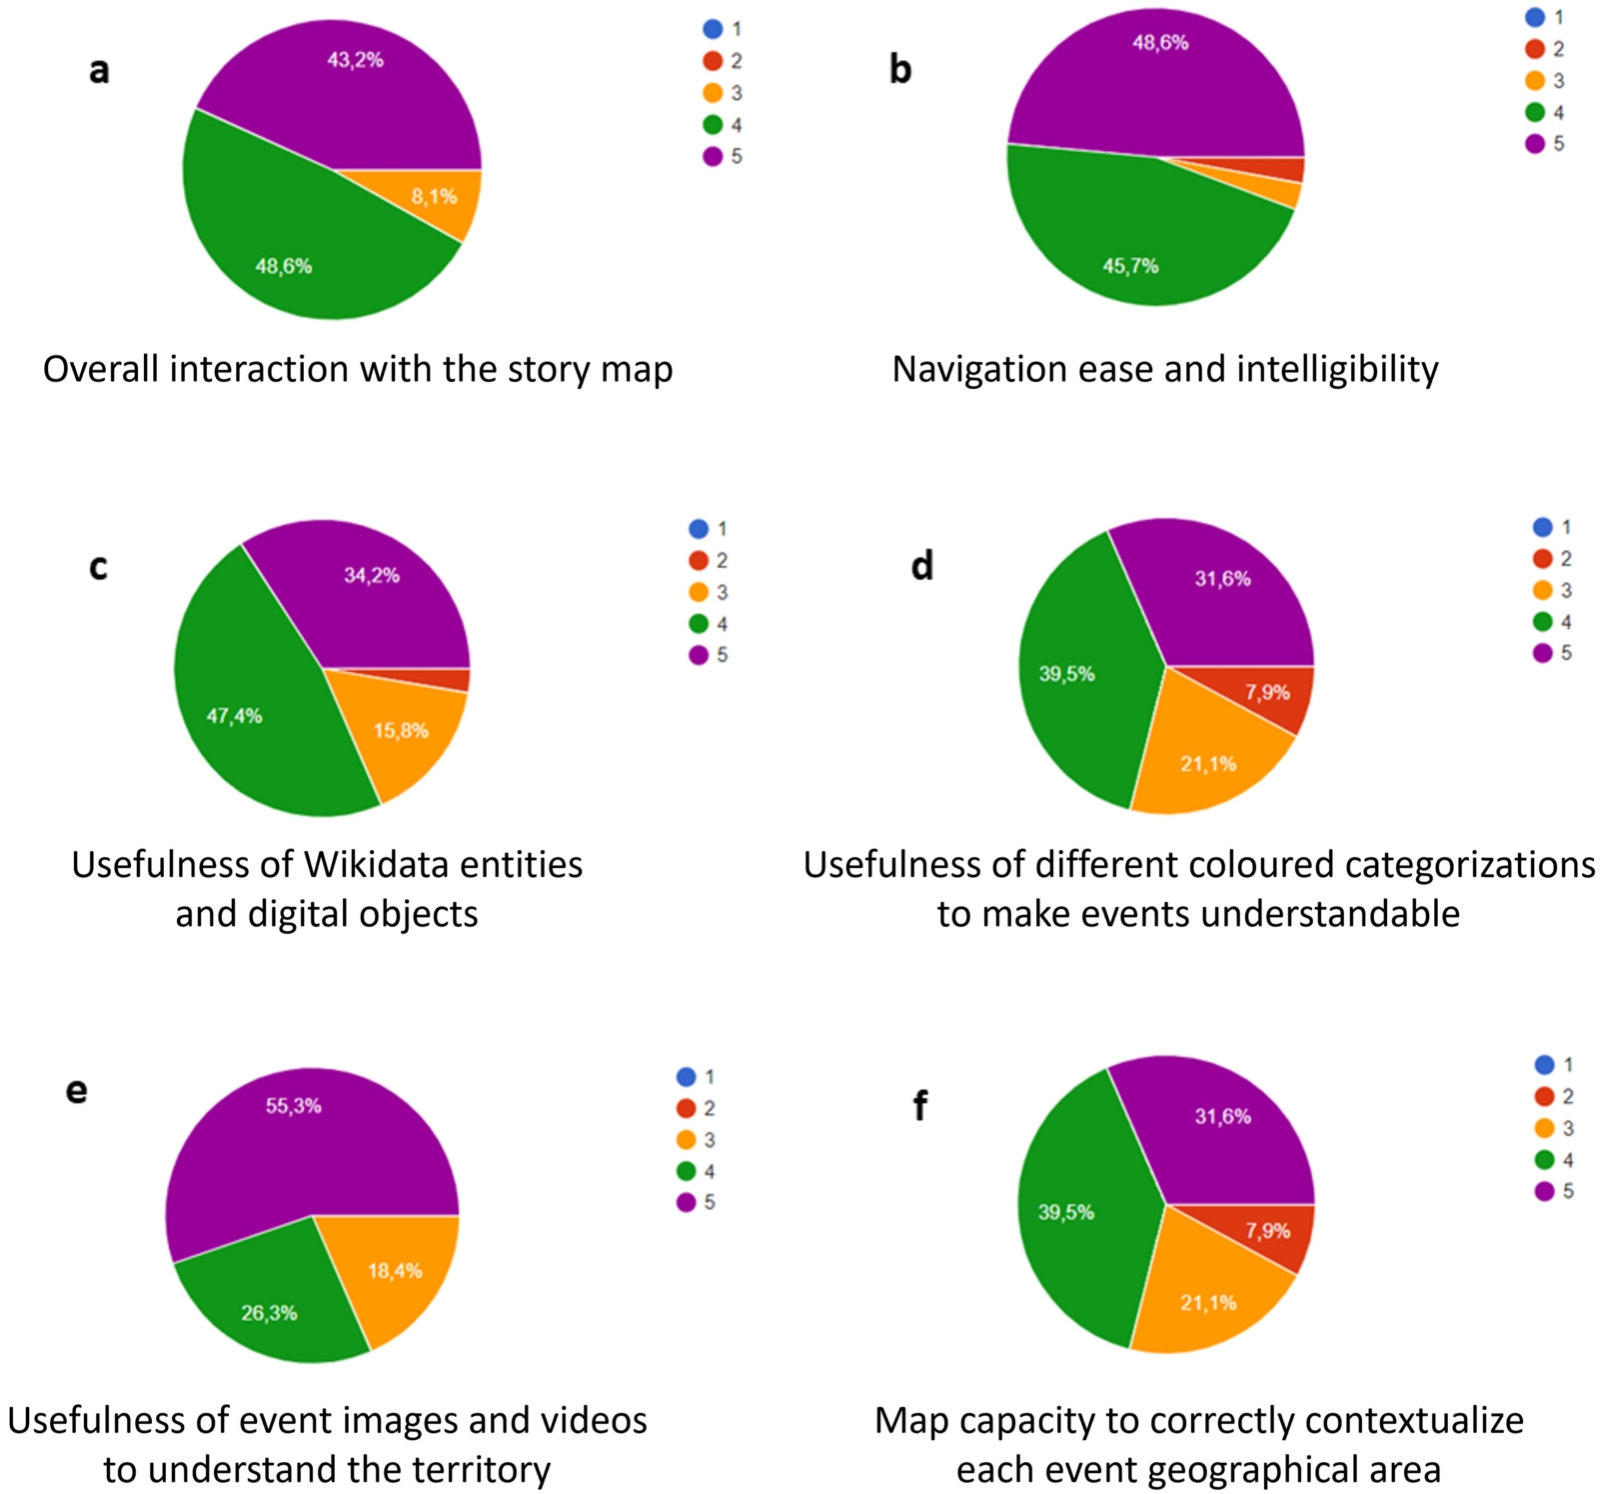
Evaluation statistics of the 5-point Likert scale rankings assigned to our Apuan Alps story map case study about: a. the overall interaction with the story map; b. the navigation ease and intelligibility; c. the usefulness of Wikidata entities and digital objects; d. the usefulness of different coloured categorizations to make events understandable; e. the usefulness of event images and videos to understand the territory; f. the map capacity to correctly contextualize each event geographical area within the territory.
3.2.Case study evaluation
In the following, we analyze the results of our second survey, which focused on the evaluation of the Apuan Alps story map. As for the overall interaction with the story map (Fig. 5-a), rankings were all positive, with 43.2% of the users ranking 5, 48.6% ranking 4, and 8.1% ranking 3. No user assigned a 2-ranking or 1-ranking. Only 15% of the users accessed the story map through a mobile device; 60% from Android smartphones, 20% from iPhones, and 20% from Android tablets. Of these users, 50% assigned a 5-ranking, 25% a 4-ranking, and 25% a 3-ranking to usability from their mobile devices. No user reported issues encountered using mobile devices.
As for story map navigation ease and intelligibility, 47.4% assigned a 5-ranking and 47.4% assigned a 4-ranking. One user assigned a 3-ranking and another user assigned a 2-ranking (Fig. 5-b). As for Wikidata entities and digital objects usefulness to understand the territory and the story, 34.2% of the users assigned a 5-ranking, 47.4% a 4-ranking, 2.6% a 3-ranking, and 2.6% a 2-ranking. No user assigned a 1-ranking (Fig. 5-c). As for the usefulness of different coloured categorizations to make events directly understandable (Fig. 5-d), 31.6% of the users assigned a 5-ranking, 39.5% a 4-ranking, 21.1% a 3-ranking, and 7.9% a 2-ranking. No user assigned a 1-ranking. As for the usefulness of event images and videos to understand the territory, 55.3% of the users assigned a 5-ranking, 26.3% a 4-ranking, 18.4% a 3-ranking. No user assigned a 2-ranking or 1-ranking (Fig. 5-e). For what regards the map capacity to correctly contextualize each event geographical area within the territory, 47.4% of the users assigned a 5-ranking, 39.5% a 4-ranking, 10.5% a 3-ranking, and 2.6% a 2-ranking (Fig. 5-f).
We asked the users about the main problems encountered when visualising and navigating the story map. The textual comments indicated that most users did not experience significant problems with navigation and interaction. A few users suggested making some information more concise, which depended on the verbosity of some event description rather than systematic errors. Several users highlighted the usefulness of the story map to (i) generate interest and increase interaction about the topic of the story; (ii) help associating the places with the events of the story, increasing their understanding; (iii) give an immediate overview to external visitors and people interested in quickly knowing the key features of a region; (iv) organize information scattered throughout the territory in a logical rationale; (v) enrich the narrative and improve its understanding by adding media and interactive elements; (vi) enhance the didactic aspects of the narration; (vii) overall represent the territory characteristics beyond the map. There were suggestions about the improvement of the story map to fill the gap between map and territory, which can be summarised in the following points: (i) adding captions to images and videos; (ii) showing more pictures; (iii) showing the boundaries of the area corresponding to the event; (iv) improving human factor representation; (v) adding touristic information and local products; (vi) assigning informative labels to the external digital objects attached to the events.
4.Discussion and conclusions
In this paper, we have described SMBVT, a Web tool that allows creating story maps and publishing them as either interactive timelines or maps. Through a case study on the Apuan Alps mountain region, we have evaluated the usability of the tool and the produced story map. Interestingly, non-critical suggestions on improving the tool usability and functionality emerged from experts’ evaluation. The limited statistical reliability of the SMBVT usability assessment – due to few researchers using the tool to build story maps – was compensated by the fact that all the researchers involved had sufficient expertise to produce reliable qualitative indications and directions of improvement. Instead, the case study quantitative evaluation undoubtedly indicated that the final users had a positive experience, although most were not previously familiar with story maps. The Apuan Alps story map was generally considered intuitive, informative, and usable from multiple devices. No critical issue was raised concerning the story map usability. Suggestions for improvement regarded story map enrichment with more data, project activities, and links to other stories. These requests can be satisfied by adding additional events to the current story maps [10]. We also overcame the issues related to the lack of image and video captions and name labels for the digital objects. Indeed, the current version of the SMBVT building interface allows users to add captions to images and videos and assign labels to digital objects. We are also working on automatically visualising the polygons associated with the Local Administrative Unit in which the events of the stories occur. Another requirement of the tool that arose from the questionnaire was the possibility of adding more than one image per event. We are evaluating a different visualisation JavaScript library to introduce this functionality. However, no critical issue was raised concerning the capacity to describe territorial aspects beyond the map. The results indeed indicate that SMBVT allowed producing and representing the territory concisely and comprehensively. Overall, it contributed to filling the gap between map and territory because the study case communicated information about the life, emotions, reality, and expectations associated with the territory. Thus, it overcame a perceptive cartographic challenge.
SMBVT also includes an effective representation of the story as a sequence of events on a timeline [42]. Moreover, it adds the possibility to connect the story events to an external reference knowledge base (Wikidata) and other Linked Open Data networks (e.g., Europeana). Specifically, the mountain value chains produced in the MOVING European project could directly become part of the European cultural heritage knowledge base collected by Europeana [29]. Collaboration is an additional key feature, which can be either active (through voluntary information exchange between community members) or passive (through automatic story inter-linking). Moreover, semantic technologies support quick knowledge merging between different communities’ stories, which likely end in discovering new knowledge and revealing co-occurrences, cause-effect relations, and correlations [19]. A new feature, under beta testing, endows each story map published with a button to explore the shared knowledge base behind the scenes and evaluate how a just-published story contributes and connects to it. After a story publication, the user can already press a “SEARCH” button in the top bar of the story map and explore the entities that co-occur with the events and entities of his/her story or the narratives sharing similar entities. This feature relies upon the fact that the knowledge base is updated on-the-fly at the story publication time. The evaluation of the effectiveness of this feature, and its possible enhancements, will be the focus of our future studies.
In summary, SMBVT introduces utterly new features for story map building such as (i) Semantic Web technologies, (ii) collaboration, (iii) a free-to-use Web tool, (iv) multi-user, multi-tenancy, and security facilities, (v) automatic connection to Wikidata and other Linked Open Data networks. These features make SMBVT overcome the common drawbacks of other commercial and open-source solutions. Moreover, by allowing users to generate participatory story maps and disseminate new knowledge, SMBVT potentially contributes to discover forms of human-nature interactions and help design sustainable environmental management pathways. We believe that SMBVT can give a relevant contribution to the development of policy-relevant research, promote interdisciplinarity, and facilitate open science. As visualization tools have the power to boost the capacity to explore information, foster understanding, and encourage learning, they can be used as “boundary objects” between different communities (scientists of different disciplines, scientists with policy-makers or with civil society) to allow interaction and creation of shared meanings [39]. Story maps, with the power of geographical information, can promote citizens’ awareness about the territory, and can support researchers in engaging local stakeholders around policy-related local issues. In a context where the availability of data is no longer a bottleneck for decisions, this research avenue is bound to grow consistently in the next future.
As a recent achievement confirming the quality and usability of the tool, SMBVT has won the Digital Humanities (DH) Awards 2022 in the “Best DH tool or suite of Tools” category [8], after we offered the tool openly to build and inspect story maps through the Digital Humanities Awards portal.
As future work, we will propose SMBVT to the MOVING European project’s scientific community, which studies mountain areas’ ecology to create extensive collections of interconnected stories [43]. Consequently, this application will create an extensive knowledge base from which general European trends and relations will be inferred. We anticipate that creating such a knowledge base cannot be the result of manual effort only (i.e., of community members using the tool). Necessarily, automatic services to extract information from written stories and documents will be required to generate events out of written and multimedia documents automatically. Fortunately, the technology in this field is sufficiently mature to reach this target [10,21,22]. Therefore, automatic systems will use SMBVT as-a-service to transform the extracted events into story maps and enrich the overall back-end knowledge base, while improving the possibility of extracting new knowledge.
Acknowledgements
This work has received funding from the European Union’s Horizon 2020 research and innovation programme under the MOVING project (grant agreement no 862739).
References
[1] | A. Alemy, S. Hudzik and C.N. Matthews, Creating a user-friendly interactive interpretive resource with ESRI’s ArcGIS story map program, Historical archaeology 51: (2) ((2017) ), 288–297. doi:10.1007/s41636-017-0013-7. |
[2] | Apache, Jena Fuseki SPARQL server, Available at https://jena.apache.org/documentation/fuseki2/. |
[3] | ArcGIS, ArcGIS Story Map Building Tool, available at: https://storymaps.arcgis.com. |
[4] | ArcGIS, ArcGIS Story Map licensing, available at: https://doc.arcgis.com/en/arcgis-storymaps/reference/licensing.htm. |
[5] | M. Assante, L. Candela, D. Castelli, R. Cirillo, G. Coro, L. Frosini, L. Lelii, F. Mangiacrapa, V. Marioli, P. Pagano et al., The gCube system: Delivering virtual research environments as-a-service, Future Generation Computer Systems 95: ((2019) ), 445–453. doi:10.1016/j.future.2018.10.035. |
[6] | M. Assante, L. Candela, D. Castelli, R. Cirillo, G. Coro, L. Frosini, L. Lelii, F. Mangiacrapa, P. Pagano, G. Panichi et al., Enacting open science by D4Science, Future Generation Computer Systems 101: ((2019) ), 555–563. doi:10.1016/j.future.2019.05.063. |
[7] | M. Assante, L. Candela, D. Castelli, G. Coro, L. Lelii and P. Pagano, Virtual research environments as-a-service by gCube, PeerJ Preprints 4: ((2016) ), e2511v1. doi:10.1016/j.future.2018.10.035. |
[8] | D.H. Awards, Best DH tool or suite of tools, (2023) , available at: http://dhawards.org/dhawards2022/results/. |
[9] | V. Bartalesi, JSON schema of the internal SMBVT data representation, available at: https://dlnarratives.eu/schema%20JSON.json. |
[10] | V. Bartalesi, G. Coro, E. Lenzi, P. Pagano and N. Pratelli, From unstructured texts to semantic story maps, International Journal of Digital Earth 16: (1) ((2023) ), 234–250. doi:10.1080/17538947.2023.2168774. |
[11] | V. Bartalesi, D. Metilli, N. Pratelli and P. Pontari, Towards a knowledge base of medieval and renaissance geographical Latin works: The IMAGO ontology, Digital Scholarship in the Humanities ((2021) ). doi:10.1093/llc/fqab060. |
[12] | C. Bizer, T. Heath and T. Berners-Lee, Linked data: The story so far, in: Semantic Services, Interoperability and Web Applications: Emerging Concepts, IGI Global, (2011) , pp. 205–227. doi:10.4018/978-1-60960-593-3.ch008. |
[13] | Blazegraph, The Blazegraph Database, available at: https://blazegraph.com/. |
[14] | Blue Cloud, The Blue Cloud European project, Project Web site, https://blue-cloud.d4science.org/. |
[15] | M. Box, Map Box Storymaps template, available at: https://www.mapbox.com/solutions/interactive-storytelling. |
[16] | L. Candela, D. Castelli, G. Coro, L. Lelii, F. Mangiacrapa, V. Marioli and P. Pagano, An infrastructure-oriented approach for supporting biodiversity research, Ecological Informatics 26: ((2015) ), 162–172. doi:10.1016/j.ecoinf.2014.07.006. |
[17] | L. Candela, D. Castelli, G. Coro, P. Pagano and F. Sinibaldi, Species distribution modeling in the cloud, Concurrency and Computation: Practice and Experience 28: (4) ((2016) ), 1056–1079. doi:10.1002/cpe.3030. |
[18] | S. Caquard and W. Cartwright, Narrative cartography: From mapping stories to the narrative of maps and mapping, The Cartographic Journal 51: (2) ((2014) ), 101–106. doi:10.1179/0008704114Z.000000000130. |
[19] | G. Coro, Open science and Artificial Intelligence supporting Blue Growth, Environmental Engineering & Management Journal (EEMJ) 19(10) ((2020) ). |
[20] | G. Coro, L. Candela, P. Pagano, A. Italiano and L. Liccardo, Parallelizing the execution of native data mining algorithms for computational biology, Concurrency and Computation: Practice and Experience 27: (17) ((2015) ), 4630–4644. doi:10.1002/cpe.3435. |
[21] | G. Coro, F.V. Massoli, A. Origlia and F. Cutugno, Psycho-acoustics inspired automatic speech recognition, Computers & Electrical Engineering 93: ((2021) ), 107238. doi:10.1016/j.compeleceng.2021.107238. |
[22] | G. Coro, G. Panichi, P. Pagano and E. Perrone, NLPHub: An e-infrastructure-based text mining hub, Concurrency and Computation: Practice and Experience 33: (5) ((2021) ), e5986. doi:10.1002/cpe.5986. |
[23] | G. Coro, G. Panichi, P. Scarponi and P. Pagano, Cloud computing in a distributed e-infrastructure using the web processing service standard, Concurrency and Computation: Practice and Experience 29: (18) ((2017) ), e4219. doi:10.1002/cpe.4219. |
[24] | EcoScope, The EcoScope International project for ecocentric management and healty marine ecosystems, Project Web site, https://ecoscopium.eu/. |
[25] | A. Frenvik Sveen, Leaflet Storymaps template, available at: https://github.com/atlefren/storymap. |
[26] | Google INC, Google Forms software, Available at, https://www.google.com/intl/en-GB/forms/about/. |
[27] | P. Hitzler and K. Janowicz, Linked data, big data, and the 4th paradigm, Semantic Web 4: (3) ((2013) ), 233–235. doi:10.3233/SW-130117. |
[28] | P. Hitzler, M. Krotzsch and S. Rudolph, Foundations of Semantic Web Technologies, Chapman and Hall/CRC, (2009) . |
[29] | A. Isaac and B. Haslhofer, Europeana linked open data–data. Europeana. Eu, Semantic Web 4: (3) ((2013) ), 291–297. doi:10.3233/SW-120092. |
[30] | ISTI-CNR, The SMBVT source code, available at: https://github.com/EmanueleLenzi92/SMBVT and https://zenodo.org/record/8004637. |
[31] | K. Janowicz, S. Scheider, T. Pehle and G. Hart, Geospatial semantics and linked spatiotemporal data–past, present, and future, Semantic Web 3: (4) ((2012) ), 321–332. doi:10.3233/SW-2012-0077. |
[32] | Knightlab, StoryMap JS tool for narrative building, available at: https://storymap.knightlab.com. |
[33] | Knightlab, Timeline JS library, available at: https://timeline.knightlab.com/. |
[34] | M. Koho, E. Hyvönen and A. Lehikoinen, Ornithology based on linking bird observations with weather data, in: European Semantic Web Conference, Springer, (2014) , pp. 75–85. doi:10.1007/978-3-319-11955-7_7. |
[35] | A. Korzybski, A non-Aristotelian system and its necessity for rigour in mathematics and physics, in: Science and Sanity: An Introduction to Non-Aristotelian Systems and General Semantics, Lancaster, (1933) . |
[36] | Leaflet, Leaflet JS library, available at: https://leafletjs.com/. |
[37] | Map Creator, Map Creator online tool, available at: https://www.mapcreator.io. |
[38] | D.L. McGuinness, F. Van Harmelen et al., OWL web ontology language overview, W3C recommendation 10(10) (2004), 2004. |
[39] | G.J. McInerny, M. Chen, R. Freeman, D. Gavaghan, M. Meyer, F. Rowland, D.J. Spiegelhalter, M. Stefaner, G. Tessarolo and J. Hortal, Information visualisation for science and policy: Engaging users and avoiding bias, Trends in ecology & evolution 29: (3) ((2014) ), 148–157. doi:10.1016/j.tree.2014.01.003. |
[40] | MediaWiki, MediaWiki Action API, (2023) , available at: https://www.mediawiki.org/wiki/API:Main_page. |
[41] | C. Meghini, V. Bartalesi and D. Metilli, Representing narratives in digital libraries: The narrative ontology, Semantic Web ((2021) ), 1–24. doi:10.3233/SW-200421. |
[42] | D. Metilli, V. Bartalesi and C. Meghini, A Wikidata-based tool for building and visualising narratives, International Journal on Digital Libraries 20: (4) ((2019) ), 417–432. doi:10.1007/s00799-019-00266-3. |
[43] | MOVING, The MOVING European project – Mountain Valorisation through Interconnectedness and Green Growth, Project Web site, https://www.moving-h2020.eu/. |
[44] | Moving European Project, The Moving EU Project Virtual Research Environment for Story Map Building, Available at https://moving.d4science.org/group/moving-gateway after free registration. |
[45] | Odyssey, Odyssey Story Maps template, available at: http://cartodb.github.io/odyssey.js/. |
[46] | Open Knowledge Foundation Labs, TimeMapper – Make Timelines and TimeMaps fast! https://timemapper.okfnlabs.org/, 2023-11-27. |
[47] | OpenStreetMap, UMap online tool, available at: https://umap.openstreetmap.fr/it/. |
[48] | G. Peterle, Carto-fiction: Narrativising maps through creative writing, Social & Cultural Geography 20: (8) ((2019) ), 1070–1093. doi:10.1080/14649365.2018.1428820. |
[49] | P. Petrov, Fabula/Sjuzhet, The Encyclopedia of Literary and Cultural Theory, (2010) . |
[50] | M.-L.M. Ryan and C. Maps, The Construction of Narrative Space.ǁ Narrative Theory and the Cognitive Sciences, D. Herman, ed., Vol. 214: , CSLI, Stanford, (2003) , p. 42. doi:10.1075/ni.11.1.01her. |
[51] | V. Shklovsky et al., Art as Technique, Literary Theory: An Anthology 3, (1917) . |
[52] | T. Timescape, Story Map Building Tool, available at: https://www.recombine.net/projects/timescape.html. |
[53] | E. Trumpy, G. Coro, A. Manzella, P. Pagano, D. Castelli, P. Calcagno, A. Nador, T. Bragasson, S. Grellet and G. Siddiqi, Building a European geothermal information network using a distributed e-infrastructure, International Journal of Digital Earth 9: (5) ((2016) ), 499–519. doi:10.1080/17538947.2015.1073378. |
[54] | D. Vrandecic, The rise of Wikidata, IEEE Intelligent Systems 28: (4) ((2013) ), 90–95. doi:10.1109/MIS.2013.119. |
[55] | N. Walshe, Using ArcGIS online story maps, Teaching Geography 41: (3) ((2016) ), 115–117. |
[56] | Wikidata, Wikidata Query Service, (2023) , available at: https://query.wikidata.org/. |
[57] | Wikipedia, Wikipedia API description, (2023) , available at: https://wikipedia.org/w/api.php. |

