

Abstract
While the electron beam powder bed fusion (EB-PBF) process is recognized for generating parts with high surface roughness, the impact of wall thickness remains relatively understudied and shows inconsistent literature results. This study addresses this gap by performing a full factorial Design of Experiments (DoE) to examine Ti-6Al-4V specimen surfaces built in three distinct orientations (vertical, upskin, and downskin) and six wall thickness levels (0.5, 1.0, 2.0, 2.5, 3.0, and 4.0 mm). Findings reveal orientation-dependent effects of wall thickness on surface roughness, particularly for thicknesses below 1.0 mm. Vertical surfaces show increased roughness with decreasing wall thickness, in which 0.5 mm-thick specimens exhibited the highest Ra roughness values. In contrast, no particular trend was observed for upskin surfaces, with 0.5 mm specimens displaying roughness values comparable to the 2.0 to 4.0 mm range of specimens. Yet, downskin surfaces of 0.5 mm specimens showed significantly lower Ra roughness compared to their thicker counterparts, a trend opposite of that of vertical surfaces. These behaviors may relate to scanning strategies and electron beam parameters, particularly when building smaller cross-sectional areas.
Export citation and abstract BibTeX RIS
1. Introduction
Ti-6Al-4V is an alpha-beta titanium alloy that exhibits superb specific strength and has been historically employed in the military and civil aviation sectors [1]. It has also piqued the interest of the automotive [2, 3] and biomedical [4, 5] sectors. However, due to its elevated melting point (1670 °C) and high chemical reactivity, it is challenging to process this alloy with traditional manufacturing methods like casting [6, 7]. Yet, the additive manufacturing (AM) technology of powder bed fusion (PBF) has proven to be highly efficient for processing titanium alloys and producing parts with comparable or even superior mechanical properties [8].
1.1. The electron beam powder bed fusion (EB-PBF) process
The EB-PBF process, defined by ISO/ASTM DIS 52900 [9], utilizes an electron beam as an energy source to melt metallic powders layer by layer and create dense solid components. In this process, each layer of deposited powder material undergoes two electron beam scanning stages: powder heating and powder melting.
The powder heating stage uses a defocused electron beam to ensure a constant temperature profile across the powder bed while loosely sintering the feedstock material to prevent powder particle repulsion [10–12]. The melting stage, on the other hand, employs a focused electron beam to selectively scan specific regions of the bed and fuse the powder material. This step usually includes two processes: contour and hatch melting.
The contour (or contouring) step involves melting the perimeters of the parts, which, in EB-PBF, is usually done with a spot-melting strategy known as MultiBeam. This strategy maintains several active melt pools along a line for faster scanning and supposedly improved surface quality [13]. However, it was found that the spot-melting strategy in EB-PBF produces parts with inferior surface quality when compared to parts produced using continuous contour scanning [14, 15]. The hatch (or hatching) step, on the other hand, utilizes a high-power electron beam in continuous scanning to melt the bulk of parts, typically following a rotating square pattern to avoid anisotropy [16, 17]. After the melting stage, a post-heating step is often employed to balance the temperature on the powder bed [11].
The EB-PBF process offers several advantages over PBF processes that use lasers as energy sources (L-PBF). Notably, EB-PBF is conducted in a high-vacuum chamber to prevent the deflection of electrons and ensure the chemical stability of reactive metals like Ti-6Al-4V [18, 19]. Additionally, the high temperatures maintained within the manufacturing chamber during EB-PBF significantly reduce residual stresses in the final parts compared to L-PBF [20].
1.2. EB-PBF and surface roughness
EB-PBF shows great potential in producing lightweight and intricate parts [21, 22]. However, it is known to produce parts with intrinsic rough surface finishes. EB-PBF parts exhibit surface roughness levels comparable to sand casting and forging processes [23], with arithmetic mean deviation roughness (Ra) values reaching up to 50 μm [24, 25]. These rough surfaces have negative effects on friction, wear, and mainly fatigue performance, as they promote stress concentration and crack initiation points along the surface [26–31]. Nevertheless, surface finishing techniques like machining have been demonstrated to enhance the fatigue life of Ti-6Al-4V parts by EB-PBF [32–36]. Yet, the as-built surface roughness of EB-PBF parts was also found to positively influence cell proliferation, blood coagulation, and the osseointegration of Ti-6Al-4V orthopedic and dental implants [37–43].
According to the literature [44], the primary causes for surface roughness in EB-PBF are as follows:
- (1)
- (2)Adhesion of partially melted powder particles: This phenomenon is considered the primary mechanism behind surface roughness in EB-PBF [49, 50]. It is caused by the high thermal gradient between melted regions and surrounding powder. The heat transferred from the solid regions to the adjacency area is enough to partially melt powder particles that attach to these solid surfaces, forming round protuberances [17, 51, 52].
- (3)Irregular surface morphology: These irregularities are closely linked to the intrinsic thermal interactions of the EB-PBF process, particularly the hydrodynamic effects experienced by molten material during phase changes [53]. Thermocapillary effects and melt pool instabilities can lead to the displacement of molten material, which solidifies and forms sharp protuberant structures on EB-PBF surfaces [26, 46, 54, 55]. Additionally, lack-of-fusion irregularities can occur when the thermal energy provided by the electron beam is insufficient to melt the powder particles, resulting in the formation of elongated voids and pores [10, 56].
The surface quality of EB-PBF parts is heavily influenced by the thermal interactions the material experiences, meaning that parameters related to energy transfer can potentially impact surface topology. Process parameters such as beam current, focus offset, and scanning speeds have been shown to affect the surface roughness of Ti-6Al-4V parts [15, 49, 57–61]. Other factors known to affect the as-built surface roughness include the arrangement of parts in the build chamber [62–65] and the inclination angle of surfaces [47]. While the wall thickness of parts has been found to affect the microstructure [66–68] and the mechanical properties [69, 70], the relationship between wall thickness and surface roughness remains less understood.
1.3. Wall thickness and surface roughness in EB-PBF
Safdar et al [49] investigated the influence of wall thickness and other process parameters on vertical surfaces (surfaces built at 90°) of Ti-6Al-4V specimens by EB-PBF. They observed that, as the wall thickness increased, so did the surface roughness. The authors explained this trend as a consequence of the greater amount of energy required to melt and build thicker geometries. This increased energy usage led to more surrounding powder particles attaching to the surfaces, resulting in rougher surface finishes.
Algardh et al [71] explored the influence of wall thickness and powder size distribution on the roughness of vertical lateral surfaces. The authors found a reverse trend compared to Safdar et al [49], with thinner samples exhibiting higher roughness values. A similar trend was also observed by Razavi et al [72], though with slightly different thickness levels. Razavi et al [72] further investigated the roughness of inclined surfaces built at a 45° angle, both upskin and downskin, and found that the inclined surfaces followed the same trend as the vertical surfaces. The authors attributed this trend to the reduced number of electron beam scan lines required for producing thinner geometries, potentially leading to irregular surface morphology and surface defects [72].
More recently, Segersäll et al [73] examined the influence of wall thickness on surface roughness and fatigue of EB-PBF parts. However, in their study, the wall thickness did not seem to significantly influence the surface quality of the specimens.
The conflicting results among these studies can be attributed to several factors. One notable factor is the lack of detailed descriptions of the experimental design in these studies, particularly the process parameters used and the part arrangement inside the build platform, making it challenging to assess and compare the results accurately.
Considering the dissimilar results in the literature and the importance of surface roughness in enhancing the reliability and quality of parts [74], this work aims to further investigate the effects of varying wall thicknesses on the surface roughness of Ti-6Al-4V by EB-PBF. To that end, an experiment was conducted to evaluate whether different wall thickness levels affect the surface roughness of vertical, upskin, and downskin surfaces and how they affect them.
2. Materials and methods
2.1. Specimen design
For this experiment, two distinct specimens were designed: one for analyzing the vertical surface (figure 1(a)) and another for evaluating both upskin and downskin surfaces (figure 1(b)) built at an inclined angle of 65°. This inclination angle was selected to ensure a successful build without the need for support structures, allowing the measurement and characterization of the downskin surfaces. Both specimens were dimensioned for tactile roughness measurements with an evaluation length of 40 mm, according to the guidelines of ISO 4288 [75] for the expected range of Ra roughness.
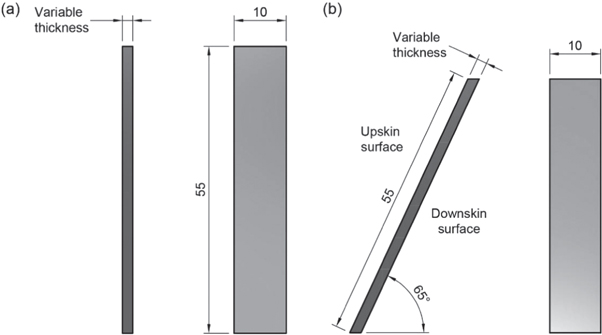
Figure 1. Vertical (a) and inclined (b) specimens designed for tactile surface measurement.
Download figure:
Standard image High-resolution imageTo investigate the influence of wall thickness on surface roughness, the specimens were produced with nominal thickness values of 0.5, 1.0, 2.0, 2.5, 3.0, and 4.0 mm. Each thickness level was manufactured four times, resulting in a total of 48 specimens (24 vertical and 24 inclined) for comprehensive analysis.
2.2. Specimen fabrication by EB-PBF
The EB-PBF equipment utilized in this experiment was the Arcam Q10plus machine by GE Additive (USA). The Ti-6Al-4V feedstock powder used was also supplied by GE Additive, with a particle size distribution ranging from 45 to 105 μm.
All specimens were produced using the default theme for this material on the EB-PBF equipment for a layer height of 50 μm (Ti6Al4V_Q10plus version 5.2.23). The most relevant process parameters for the heating and melting stages are presented in table 1, while the arrangement of specimens inside the build platform is illustrated in figure 2. To minimize dissimilar thermal accumulation in the powder bed, thicker samples were positioned closer to thinner ones. Additionally, to reduce the effects of energy accumulation in the resulting surface roughness, all specimens were placed at equal distances between them [65].
Table 1. Machine process parameters used for specimen fabrication.
| Heating | Preheat | Focus offset | 44 mA |
| Heating focus offset | 100 mA | ||
| Offset to part | 4 mm | ||
| Surface temperature | 940 C | ||
| Preheating I | Max beam current | 16 mA | |
| Beam speed | 18000 mm s−1 | ||
| No. of repetitions | 2 | ||
| Average current | 0 mA | ||
| Line order | 20 | ||
| Line offset | 0.4 mm | ||
| Preheating II | Max beam current | 19 mA | |
| Beam speed | 18000 mm s−1 | ||
| No. of repetitions | 2 | ||
| Average current | 5.4 mA | ||
| Line order | 20 | ||
| Line offset | 0.4 mm | ||
| Melt | Contours | Number of contours | 3 |
| Block offset | True | ||
| Outer contour | Beam current | 5 mA | |
| Max beam current | 5 mA | ||
| Speed | 750 mm s−1 | ||
| Line offset | 0.22 mm | ||
| Focus offset | 5 mA | ||
| Inner contour | Beam current | 8 mA | |
| Max beam current | 8 mA | ||
| Speed | 800 mm s−1 | ||
| Line offset | 0.135 mm | ||
| Focus offset | 5 mA | ||
| Hatch | Use rotating hatch | True | |
| Linear current compensation | True | ||
| Beam current | 15 mA | ||
| Max beam current | 30 mA | ||
| Manual speed | 4530 mm s−1 | ||
| Speed function | 60 | ||
| Line offset | 0.20 mm | ||
| Focus Offset | 36 mA |
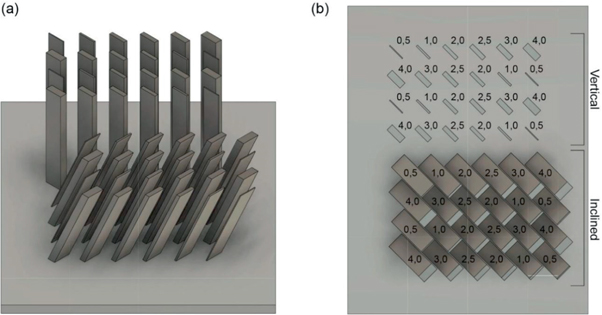
Figure 2. (a) Part arrangement for all 48 specimens fabricated and (b) distribution of specimens based on geometry and wall thickness (in mm).
Download figure:
Standard image High-resolution imageAfter production, the unprocessed powder surrounding the specimens was removed using Arcam's Powder Removal Station (PRS) system. Each specimen was identified before removal from the build platform to record its exact position. The specimens were then manually removed from the build platform as the minimal contact area between them facilitated the detachment.
2.3. Surface measurement
Surface roughness measurements were conducted using a Talysurf PGI 830 tactile profilometer from Taylor Hobson (UK) equipped with a 2.0 μm conical diamond tip. The measurements were performed with a sampling length of 50 mm and a measurement speed of 0.5 mm s−1. For each surface, three parallel measurements were taken in a direction perpendicular to the lay (figure 3), following the guidelines specified in ISO/ASTM 52902 [76]. In total, 288 profile measurements were registered from the 96 surfaces analyzed in this study.
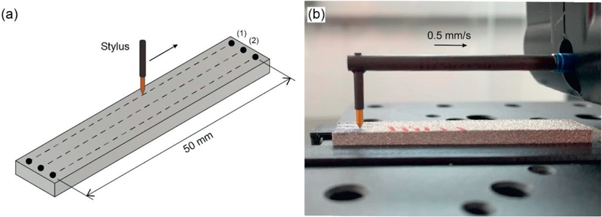
Figure 3. Procedure for surface roughness measurement with a stylus profilometer.
Download figure:
Standard image High-resolution image2.4. Surface characterization
The surface roughness characterization was performed using the Mountains® 9 software from Digital Surf (France). A cut-off filter of 8 mm was used in accordance with ISO 4288 [75] for the expected Ra roughness values. The evaluation length was set to five cut-offs (40 mm), with a half cut-off distance discarded from the start and end of each sampling length. It is worth noting that the revised ISO standard for surface analysis (ISO 21920-3:2021 [77]) recommends characterizing surface roughness along the entire evaluation length instead of over five cut-off distances. However, for the comparative purposes of this study, this revised approach would not significantly affect the results.
The roughness parameters used for the analysis were the arithmetic mean deviation (Ra), the skewness (Rsk), and the kurtosis (Rku) of the profile. The average roughness parameter Ra evaluates the profile's deviations about the mean line within an evaluation length and is one of the most commonly used roughness parameters in the industry. The profile's skewness (Rsk) assesses the even distribution of peaks and valleys in a given profile, while the Kurtosis (Rku) measures the profile's sharpness.
These roughness parameters were selected based on their prevalence in the literature on surface roughness with EB-PBF [78–80] and according to the recommendations of ISO/ASTM 52902 [76]. For each sample, three surface profiles were measured (figure 3(a)) and characterized. The mean of these three profiles was then calculated. Additionally, some surfaces were also observed under a ZEISS EVO MA 15 scanning electron microscope from Zeiss (Germany) to investigate any differences in surface morphology.
2.5. Preliminary and statistical analysis
A preliminary analysis was conducted to verify whether the position of the specimens in relation to the build platform had any influence on their surface roughness. The results indicated no significant variation in roughness parameters for specimens with the same thickness but built in different locations on the build platform. As a result, same-thickness specimens were considered replicas for the subsequent analysis.
A full factorial analysis was performed for the Ra parameter. The factorial analysis involved two factors: surface orientation (vertical, upskin, and downskin) and wall thickness levels (0.5, 1.0, 2.0, 2.5, 3.0, and 4.0 mm), with four replicates of each combination.
3. Results
The Ra values obtained for all specimens fell within the expected range for EB-PBF with Ti-6Al-4V, ranging from 21 to 35 μm. Table 2 presents the numerical results for the full factorial analysis, while the interaction plots for the effects of surface orientation and wall thickness can be observed in figure 4.
Table 2. ANOVA results for the factorial analysis of Ra versus wall thickness and surface orientation.
| Source | DF | Adj SS | Adj MS | F-Value | P-Value |
|---|---|---|---|---|---|
| Model | 17 | 1022.44 | 60.143 | 64.25 | 0.0000 |
| Linear | 7 | 862.99 | 123.284 | 131.69 | 0.0000 |
| Thickness | 5 | 36.92 | 7.385 | 7.89 | 0.0000 |
| Surface orientation | 2 | 826.06 | 413.032 | 441.21 | 0.0000 |
| 2-Way Interactions | 10 | 159.45 | 15.945 | 17.03 | 0.0000 |
| Thickness*Surface orientation | 10 | 159.45 | 15.945 | 17.03 | 0.0000 |
| Error | 54 | 50.55 | 0.936 | ||
| Total | 71 | 1072.99 |

Figure 4. Interaction plot for Ra roughness versus wall thickness and surface orientation.
Download figure:
Standard image High-resolution imageThe wall thickness had distinct impacts on the surface roughness of vertical, upskin, and downskin surfaces. Due to these different effects, the results for each type of surface will be presented and analyzed separately in the following sections.
3.1. Vertical surfaces
Figure 5 displays the boxplot graphs for Ra for each thickness level of the vertical specimens. The Ra values ranged between 22 and 29 μm, which is consistent with the literature for this surface orientation [24, 30, 62]. Table 3 shows the average values of the Rsk and Rku parameters.

Figure 5. Boxplot graph for the Ra surface roughness parameters for the vertical surfaces.
Download figure:
Standard image High-resolution imageTable 3. Mean values and standard deviation for the Rsk and Rku parameters of vertical surfaces.
| Nominal thickness [mm] | Rsk (Standard deviation) [μm] | Rku (Standard deviation) [μm] |
|---|---|---|
| 0.5 | −0.1399 (0.0116) | 2.92 (0.08) |
| 1.0 | 0.0063 (0.0559) | 2.93 (0.10) |
| 2.0 | 0.0382 (0.0206) | 3.01 (0.05) |
| 2.5 | −0.0166 (0.0391) | 2.97 (0.19) |
| 3.0 | −0.0811 (0.0346) | 2.95 (0.09) |
| 4.0 | −0.0727 (0.0717) | 2.97 (0.10) |
The 0.5 mm specimens consistently exhibited the highest Ra roughness values across all thickness levels, ranging from 26.21 to 28.80 μm. The 1.0 mm and 2.0 mm specimens had the best overall surface quality, with the lowest recorded Ra of 21.90 μm belonging to a 2.0 mm specimen. The remaining specimens displayed similar roughness levels, falling within the 24–25 μm range.
The profile skewness (Rsk) values for the 0.5 mm specimens suggest a prevalence of valleys in the surface morphology compared to other thickness levels. For a visual comparison, figure 6 shows scanning electron microscope (SEM) images of the vertical surfaces with the highest and lowest Ra values. Both surfaces exhibited similar levels of adhered particles, but the underlying surface morphology of the 0.5 mm specimen displayed deep valley structures, which were not observed in the 2.0 mm specimen.
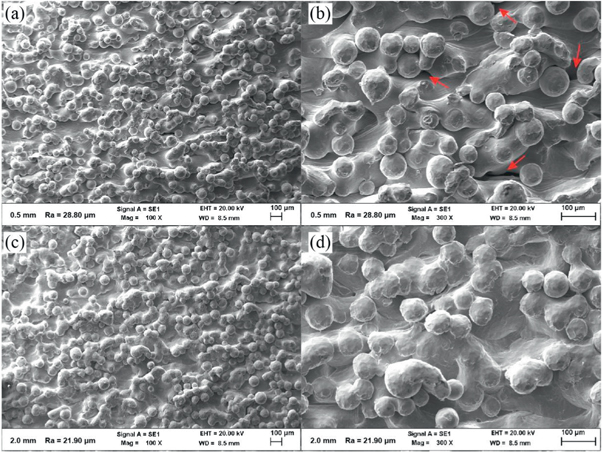
Figure 6. SEM micrographs for vertical surfaces with thicknesses of (a)(b) 0.5 mm (Ra = 28.80 μm) and (c)(d) 2.0 mm (Ra = 21.90 μm).
Download figure:
Standard image High-resolution image3.2. Upskin surfaces
Figure 7 shows the boxplot graphs for Ra of the upskin surfaces, while table 4 presents the Rsk and Rku parameters. The upskin surfaces displayed the highest surface roughness levels among all surface orientations, with Ra values ranging from approximately 28 to 35 μm.

Figure 7. Boxplot graph for the Ra surface roughness parameter for the upskin surfaces.
Download figure:
Standard image High-resolution imageTable 4. Mean values and standard deviation for the Rsk and Rku parameters of upskin surfaces.
| Nominal thickness [mm] | Rsk (Standard deviation) [μm] | Rku (Standard deviation) [μm] |
|---|---|---|
| 0.5 | 0.2012 (0.0783) | 2.05 (1.30) |
| 1.0 | − 0.0205 (0.0532) | 2.87 (0.10) |
| 2.0 | 0.0961 (0.0102) | 2.80 (0.07) |
| 2.5 | 0.1701 (0.0470) | 2.73 (0.11) |
| 3.0 | 0.2066 (0.0490) | 2.74 (0.12) |
| 4.0 | 0.1238 (0.0550) | 2.85 (0.12) |
The roughness levels were very similar across nearly all specimens, with the exception of the 1.0 mm specimens, which exhibited notably lower values. In particular, the 1.0 mm specimens also showed Rsk values closer to zero compared to other thickness levels. This indicates a surface morphology with a similar peak-to-valley ratio rather than the predominant peak topology observed in all the other specimens.
To visually compare the upskin surfaces, figure 8 shows scanning electron microscope (SEM) images of a 0.5 mm and a 1.0 mm specimen. Both images reveal the distinct protuberant structures characteristic of upskin surfaces. However, the 1.0 mm specimen, which had the lowest Ra value recorded, appears to have more partially melted particles adhered to its surfaces, particularly under the protuberant structures.

Figure 8. SEM micrographs for upskin surfaces with thickness of (a)(b) 1.0 mm (Ra = 28.03 μm) and (c)(d) 0.5 mm (Ra = 33.90 μm).
Download figure:
Standard image High-resolution image3.3. Downskin surfaces
The boxplot graphs for the Ra roughness parameters obtained from the downskin surfaces are presented in figure 9 and the Rsk and Rku parameters are shown in table 5.

Figure 9. Boxplot graph for the Ra surface roughness parameter for downskin surfaces.
Download figure:
Standard image High-resolution imageTable 5. Mean values and standard deviation for the Rsk and Rku parameters for the downskin surfaces.
| Nominal thickness [mm] | Rsk (Standard deviation) [μm] | Rku (Standard deviation) [μm] |
|---|---|---|
| 0.5 | 0.0857 (0.0672) | 3.06 (0.11) |
| 1.0 | 0.2879 (0.0867) | 3.01 (0.10) |
| 2.0 | 0.2305 (0.0741) | 3.07 (0.13) |
| 2.5 | 0.2352 (0.0321) | 2.96 (0.09) |
| 3.0 | 0.2087 (0.0420) | 2.95 (0.12) |
| 4.0 | 0.0268 (0.0866) | 2.91 (0.18) |
Overall, the Ra values of downskin surfaces are comparable to those of the vertical specimens. However, the surface quality of the 0.5 mm specimens was consistently better compared to the other specimens. The Ra values for the 0.5 mm downskin surfaces ranged between 20.77 and 21.99 μm, while the remaining thickness levels exhibited Ra values around 24 to 28 μm. This is a novel result in the literature.
The profile's skewness (Rsk) values of the downskin surfaces were typically positive, indicating a predominance of peaks in their surface profiles. The exceptions were the 0.5 mm and 4.0 mm specimens, which displayed Rsk values closer to zero, suggesting a more balanced surface morphology in comparison.
Figure 10 shows SEM images of the downskin surfaces of a 0.5 mm and a 2.0 mm specimen. Both surfaces exhibit characteristic protrusions and partially adhered particles. However, the protrusions appear more apparent for the 2.0 mm specimen (figure 10(d)).
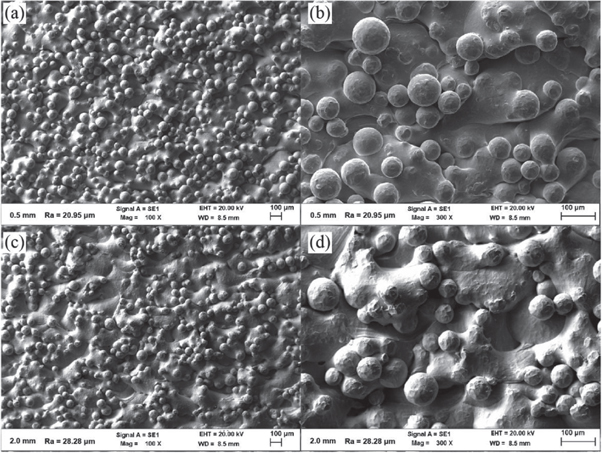
Figure 10. SEM micrographs for downskin surfaces with thickness of (a)(b) 0.5 mm (Ra = 20.95 μm) and (c)(d) 2.0 mm (Ra = 28.28 μm).
Download figure:
Standard image High-resolution image4. Discussion
Since the topology and the severity of mechanisms behind the surface roughness generation in EB-PBF differ according to the orientation, it could be expected that the wall thickness would affect vertical, upskin, and downskin surfaces differently. The experimental results confirm this hypothesis.
To facilitate the interpretation of the results regarding the influence of wall thickness on surface roughness, the discussion will be conducted separately for each surface type. Nevertheless, some aspects of the experiment remain relevant for the analysis regardless of the surface orientation.
Since all specimens were manufactured using the same feedstock powder, and the inclination angle was kept constant (90° for vertical surfaces and 65° for upskin and downskin surfaces), the influence of the staircase effect on the surface roughness should be relatively similar among surfaces in the same orientation. Therefore, the staircase case effect is unlikely to be the primary factor responsible for major differences in surface roughness between surfaces of the same type.
4.1. Vertical surfaces
The higher roughness parameters observed in the 0.5 mm vertical specimens, (similar to the findings of Karlsson et al [71]) can be better understood by examining the scanning strategy employed for melting differently sized cross-sectional layers during processing.
When building larger cross-sectional layers (figures 11(a) and (b)), the two melting steps described earlier are utilized: the contours are initially melted using a spot-melting strategy, while the solid interior is melted with a hatch melting strategy. However, as the cross-sectional layer area is reduced, the region built by the hatch scanning decreases until the layer is fully melted solely by contours (figure 11(c)). Further reductions in the cross-sectional area would trigger the 'Block Offset' function, in which one single contour line is employed to melt a given region [81], as illustrated in figure 11(d).
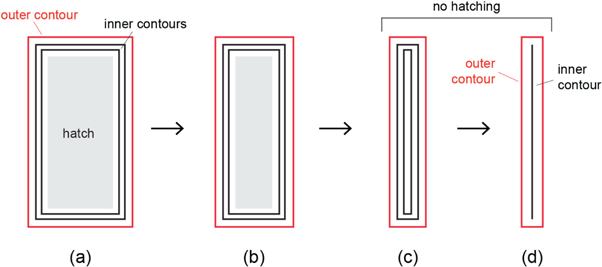
Figure 11. Scanning strategies for varying cross-sectional areas in EB-PBF.
Download figure:
Standard image High-resolution imageThe 0.5 mm vertical specimens had the smallest cross-sectional area among all the specimens and were constructed solely using low-power contour scans (table 1). As a consequence, these regions received lower thermal energy during the melting process compared to larger cross-sectional layers.
To maintain a uniform temperature distribution in the powder bed, the post-heating step compensates for this difference by providing additional energy to cooler regions, especially those close to smaller cross-sectional areas [82]. According to Galati et al [47], the extra energy supplied to these smaller cross-sectional areas during the post-heating step could elevate the temperatures in the surrounding powder bed region to a point where more powder particles could partially melt and subsequently attach to the solid surfaces. This circumstance could plausibly explain the higher roughness values observed in the vertical 0.5 mm specimens.
Razavi et al [72] propose that the reduced number of scan lines required to melt smaller cross-sectional areas may lead to insufficient melting, resulting in irregular surface structures and open defects that contribute to a rougher surface finish. While this could explain the behavior observed for the vertical surfaces in the present study, the reasons might also be due to the process parameters employed for melting reduced cross-sections.
In the EB-PBF process, the outer contours are usually melted using a low-powered electron beam to purposively not induce surrounding powder particles to melt and attach to surfaces. In our experiment, a reduced beam current of 5 mA was employed for the outer contours, whereas the inner contours were melted with 8 mA, as shown in table 1. Based on the line offset values for the contours (table 1), it is evident that the 0.5 mm specimens were predominantly built using outer contour scanning.
Building entire parts with low-power electron beams through a spot-melting scanning strategy might lead to inadequate melting and the formation of lack-of-fusion surface defects, characterized by open cavities and deep recesses in the surface [83]. The negative skewness values observed for the 0.5 mm specimens (indicating a predominance of valleys over peaks) and the deep recesses visible in figure 6(b) could be associated with these lack-of-fusion defects, a condition not observed in the 2.0 mm surface (figure 6(d)).
4.2. Upskin surfaces
The upskin surfaces displayed the highest Ra roughness among all surface orientations in this study. While many authors suggest that upskin surfaces generally exhibit better surface quality compared to vertical and downskin surfaces, this appears to be only true for surfaces with inclination angles ranging from 10° to 30° according to Triantaphyllou et al [25]. These authors observed that at a 60° inclination angle, the upskin surfaces of Ti-6Al-4V specimens showed higher Ra roughness values than both the vertical and corresponding downskin surfaces [25], a behavior consistent with the inclined specimens built at 65° in this study.
The upskin surfaces of 0.5 mm specimens did not follow the same behavior observed for the vertical surfaces, as their Ra values were comparable to those of the 2.0 to 4.0 mm specimens. This discrepancy could be attributed to the fact that surfaces built with different orientations are affected differently by the mechanisms that generate surface roughness. Additionally, the slightly larger cross-sectional area of inclined specimens may have played a role in this case.
The diagram in figure 12 shows that, for an inclination angle of 65°, the cross-sectional area of inclined specimens is approximately 10% larger than the cross-section of vertical specimens of the same thickness. While a 10% increase may seem minor, it could have allowed for more inner contour scans to be performed, thereby increasing the total amount of energy provided to the area and potentially reducing the defects induced by insufficient melting. The study by Brown et al [69] on L-PBF and 304 L demonstrated that a slight increase in the hatching area percentage could nearly eliminate surface lack-of-fusion defects in thin-walled parts. While this is not strictly the case here, as no hatch scans were used to build the 0.5 mm specimens, it indicates that higher-powered scans can reduce lack-of-fusion defects, especially for thinner parts.

Figure 12. Horizontal cross-sectional areas of vertical and inclined specimens.
Download figure:
Standard image High-resolution image
The 1.0 mm specimens exhibited the lowest roughness parameters among all upskin surfaces, and the reason for this behavior remains to be understood. The SEM images in figure 8(a) and figure 8(b) show a 1.0 mm specimen surface seemingly with a higher number of adhered particles than the 0.5 mm specimen, which might appear counter-intuitive considering the lower roughness levels of the 1.0 mm upskin surface. It is possible that the presence of partially melted particles between the peak structures could reduce the overall height of the profile during measurement with a profilometer. This could also explain the distinct skewness values for the 1.0 mm upskin surfaces that indicate a more balanced peak and valley ratio when compared to other specimens. Additional surface analysis using optical equipment or x-ray computer tomography (XCT) technologies would be necessary to explain this behavior.
4.3. Downskin surfaces
The results for the downskin surfaces present a novel behavior not previously reported in the literature, where the 0.5 mm specimens exhibit better surface quality compared to the 1.0–4.0 mm ones. In fact, the downskin surfaces of 0.5 mm specimens showed the lowest Ra roughness parameters in the entire experiment.
According to the literature [47, 82], the surface morphology of downskin surfaces is dominated by partially melted attached particles and irregular surface structures. These irregular structures are created by unsupported molten material in the melt pool pulled by gravity, which penetrates the powder bed underneath [84], leading to the formation of typical downskin protrusions. The vertical displacement of molten material is aggravated by deeper melt pools generated by higher levels of accumulated thermal energy [85]. These distinct structures can be observed in the SEM images in figure 10, being inherently different from the protrusions observed in the upskin surfaces (figure 8), which are formed by overflown material from lateral movement of the melt pool.
Considering that the 0.5 mm specimens are primarily built with low-powered contour scans compared to the thicker specimens, it is possible that the relatively lower energy provided during melting can positively affect the roughness of downskin surfaces. Shallower melt pools can alleviate the vertical displacement of molten material and, therefore, reduce the extent of the protrusions characteristic of downskin surfaces. The SEM images in figure 10 also seem to support this argument. While both surfaces are covered by a comparable number of partially melted particles, the downskin protrusions are more apparent in the 2.0 mm specimen (figure 10(d)) than in the 0.5 mm specimen (figure 10(b)). This suggests that the lower energy input in the 0.5 mm specimens might be contributing to the smoother downskin surfaces observed in these thinner parts.
5. Conclusion
This study investigated the influence of wall thickness on the surface roughness of Ti-6Al-4V specimens produced by EB-PBF. Two distinct specimen designs were manufactured to characterize the roughness of vertical and inclined (upskin and downskin) surfaces, with six wall thickness levels (0.5, 1.0, 2.0, 2.5, 3.0, and 4.0 mm). Four specimens for each thickness level were produced, resulting in a total of 48 specimens (24 vertical specimens and 24 inclined specimens). The surfaces were measured by a tactile profilometer according to the recommendations in ISO/ASTM 52902 [76] and characterized according to ISO 4288 [75] for the roughness parameters of Ra, Rsk, and Rku. The main findings of this study can be summarized as follows:
- The specimen wall thickness has an impact on surface roughness, particularly for thicknesses below 1.0 mm. Additionally, the orientation of the surfaces plays a significant role in how the wall thickness affects the resulting surface roughness.
- For vertical (90°) surfaces, 0.5 mm-thick specimens displayed the highest Ra roughness values compared to thicker specimens ranging from 1.0 to 4.0 mm.
- For upskin surfaces built at a 65° inclination angle, the 1.0 mm specimens displayed the best overall surface quality, while the 0.5 mm specimens showed Ra roughness values comparable to the 2.0–4.0 mm specimens.
- For downskin surfaces built at a 65° inclination angle, the 0.5 mm specimens showed significantly lower Ra surface roughness parameters compared to the thicker specimens, a novel result in the literature for this type of surface.
- The causes for these different behaviors may be attributed to the scanning strategy and electron beam parameters used for melting reduced cross-sectional areas.
The study's findings demonstrate that the as-built surface roughness of Ti-6Al-4V by EB-PBF is influenced by varying wall thickness values. Additionally, these effects are not uniform across all surface orientations (vertical, upskin, and downskin), as seen in the distinct Ra roughness trends observed for vertical and downskin surfaces.
Acknowledgments
This study was financed in part by the Coordenação de Aperfeiçoamento de Pessoal de Nível Superior—Brasil (CAPES)—Finance Code 001. This research was performed in part thanks to the resources and facilities of LAprint at the Information Technology Center (CTI) Renato Archer under the Brazilian Ministry of Science and Technology.
Data availability statement
All data that support the findings of this study are included within the article (and any supplementary files).