


Introduction: the potential of AI-assisted surveys
Archaeological surveys conducted through the manual inspection of high-resolution satellite imagery hold transformational promise for regional and supra-regional research. Traditional pedestrian surveys covering many thousands of square kilometres can be prohibitively expensive and time-consuming, especially when conducted in physically challenging landscapes such as the central Andean cordillera. In contrast, manual satellite prospection allows archaeologists to efficiently survey hundreds of thousands of square kilometres for visible features and to generate reliable data (Casana & Cothren Reference Casana, Cothren, Comer and Harrower2013; Ur Reference Ur, Comer and Harrower2013; Parcak Reference Parcak2017, Reference Parcak2019; Wernke et al. Reference Wernke, VanValkenburgh and Saito2020). Furthermore, it allows regions that were once geographically or politically inaccessible to be investigated through the inspection of freely available satellite imagery (Casana & Cothren Reference Casana, Cothren, Comer and Harrower2013).
Nevertheless, manual satellite survey methods are labour- and time-intensive, and the low frequency of archaeological features in many landscapes can make for monotonous work. Far from being a trivial issue, observer fatigue dramatically increases the likelihood of false negatives (Körber et al. Reference Körber, Cingel, Zimmermann and Bengler2015), meaning that important archaeological features may go unrecorded. Reliable satellite survey also requires surveyors to have extensive training in both archaeology and satellite image interpretation (Casana Reference Casana2020: 95), increasing the cost of inspecting large areas without archaeological features. Facing these challenges, researchers have sought to automate satellite prospection to cover large areas more quickly, completely and efficiently (Zingman et al. Reference Zingman, Saupe, Penatti and Lambers2016; Lasaponara & Masini Reference Lasaponara and Masini2018; Trier et al. Reference Trier, Cowley and Waldeland2018; Lambers et al. Reference Lambers, Vaart and Bourgeois2019; Somrak et al. Reference Somrak, Džeroski and Kokalj2020; Davis et al. Reference Davis, Caspari, Lipo and Sanger2021).
Despite the latent benefits, there are reasons to be sceptical about the prospects that fully automated approaches might replace manual archaeological imagery survey. Archaeological features missed by automated detection (false negatives) may contain vital information, while locations incorrectly identified as archaeological loci (false positives) may mislead the researcher as they examine large-scale patterns. Automated surveys are also incapable of capturing unique features or of recognising the complex relationships that exist between archaeological features (Casana Reference Casana2020).
Here, we propose an approach that seeks to avoid some of these downsides. Rather than fully replacing manual with automated methods, we promote an AI-assisted approach that employs deep learning to augment the results of manual surveys by directing the surveyor's attention toward locations that are most likely to contain archaeological features. To evaluate its potential, we compare the results of a deep-learning model for identifying archaeological structures in the southern Peruvian highlands to data collected and edited by a team of experts through the Geospatial Platform for Andean Culture, History and Archaeology (Geo-PACHA). Our results suggest AI-assisted survey provides an additive check on features of interest and reduces the burden of examining survey grids devoid of visible archaeological features, which in the case of GeoPACHA approached 95 per cent of grid cells. We envision a near-term future in which human–machine teaming approaches will surpass the sensitivity and specificity rates of either approach when deployed exclusively. In turn, these results can be further augmented and verified through on-the-ground pedestrian surveys.
Manual (brute-force) methods
Manual satellite surveys have been referred to as “brute force” techniques, in contrast to automated surveys (Casana Reference Casana2014: 226; Wernke et al. Reference Wernke, VanValkenburgh and Saito2020: S61). Some brute-force methods, such as Albert Lin's search for Genghis Khan and Sarah Parcak's GlobalXplorer utilise ‘citizen scientists’ (volunteers) to quickly survey large areas and obtain measures of confidence in their findings through repeated observations by non-specialists (Lin et al. Reference Lin, Huynh, Lanckriet and Barrington2014; Parcak Reference Parcak2019). Such approaches are suited for generating presence/absence information, but non-specialists cannot leverage contextual knowledge to record detailed metadata (Casana Reference Casana2020). Presence/absence data may flag areas of interest for further investigation by specialists, but without specialist intervention applications are limited to broad and atemporal settlement pattern analyses. Other research programs, such as the CORONA Atlas project and GeoPACHA (Casana & Cothren Reference Casana, Cothren, Comer and Harrower2013; Wernke et al. Reference Wernke, VanValkenburgh and Saito2020), rely on trained specialists to ensure the quality of the collected data and provide deeper and richer metadata about the observations made. To date, these methods have proven highly effective in identifying archaeological features over vast areas but remain time-consuming and require team members to have significant training and domain knowledge. They are also subject to constraints of human vigilance (attention span), a factor that may be especially significant in large-scale, extended imagery survey campaigns.
Research on human vigilance has repeatedly demonstrated, across diverse domains, that even trained specialists can be poor at detecting “rarely occurring, low-signal-to-noise-ratio signals embedded in the context of varying background configurations” (Harris Reference Harris2002: 18; see also Körber et al. Reference Körber, Cingel, Zimmermann and Bengler2015; Shingledecker et al. Reference Shingledecker, Hertz, Andrews and Wolf2017). The distribution of archaeological features in the southern Peruvian highlands follows such a pattern: GeoPACHA surveyors identified archaeological features in only five per cent of survey grids (see Wernke et al. Reference Wernke2023). In such circumstances, even well-trained experts may miss visible archaeological features due to lower vigilance from distraction, boredom and fatigue. Automated survey methods may help to alleviate these problems by reducing time spent examining locations that lack features and refocusing surveyors’ attention on possible locations of missed features.
Automated methods
Traditional remote-sensing approaches to automated object detection/classification have relied on pixel-wise spectral comparisons to identify features of interest (Parcak Reference Parcak2009; Comer & Harrower Reference Comer and Harrower2013). However, archaeological features vary widely in their construction materials or (as in the case of the Andes) are constructed of similar materials to the background landscape, resulting in little to no spectral difference between features of interest and their surroundings (Garrison et al. Reference Garrison, Houston, Golden, Inomata, Nelson and Munson2008; Alexakis et al. Reference Alexakis, Sarris, Astaras and Albanakis2009). Thus, as remote-sensing specialists know well, there is no generalised spectral signature that can be used to differentiate these diverse features from their surrounding landscape, though there may be spectral signatures for particular cases or archaeological correlates (Lasaponara & Masini Reference Lasaponara and Masini2007; Saturno et al. Reference Saturno, Sever, Irwin, Howell, Garrison, Wiseman and El-Baz2007; Parcak Reference Parcak2009, Reference Parcak2017; Agapiou et al. Reference Agapiou, Hadjimitsis, Sarris, Georgopoulos and Alexakis2013). In contrast, state-of-the-art computer vision models such as Convolutional Neural Networks examine the correlations between proximate pixels, enabling the detection of morphological variation at the scale of the objects of interest, in addition to spectral variation at the pixel level (Sevara et al. Reference Sevara, Pregesbauer, Doneus, Verhoeven and Trinks2016). These technological improvements open new opportunities for detecting archaeological features using computational methods. Furthermore, rapid improvement in computer vision in the past decade has allowed models in select fields to meet (and, in a rare but growing number of cases, to surpass) specialist capabilities (He et al. Reference He, Zhang, Ren and Sun2015; Dodge & Karam Reference Dodge and Karam2017; Bewes et al. Reference Bewes, Low, Morphett, Pate and Henneberg2019; Buetti-Dinh et al. Reference Buetti-Dinh2019; Byeon et al. Reference Byeon, Domínguez-Rodrigo, Arampatzis, Baquedano, Yravedra, Maté-González and Koumoutsakos2019). Archaeology may similarly benefit from these methods.
Even with such improvements, there remain concerns with automated surveys. Current state-of-the-art models in archaeological site detection are more akin to citizen scientists than to trained specialists. False positives/negatives are persistent problems, and the best models only provide location and morphological information with little to no metadata concerning context or relationships between features. Such results may be useful for guiding broad analyses or to assist human specialists but may miss important dimensions necessary for detailed analyses.
In addition to practical concerns with automated techniques, conceptual problems must be addressed. Due to their complexity, deep-learning algorithms are like black boxes (Latour & Woolgar Reference Latour and Woolgar1979) which are impossible for researchers to completely understand. If one cannot concretely explain why a given model makes any particular evaluation about the presence or absence of archaeological features, one may doubt the trustworthiness of the information the model produces. Fortunately, computer science researchers in the field of Explanatory AI have provided researchers with a series of tools, such as Grad-CAM (Selvaraju et al. Reference Selvaraju, Cogswell, Das, Vedantam, Parikh and Batra2020), Layer-Wise Relevance Propagation (Montavon et al. Reference Montavon, Binder, Lapuschkin, Samek, Müller, Samek, Montavon, Vedaldi, Hansen and Müller2019) and others (Rai Reference Rai2020; Tjoa & Guan Reference Tjoa and Guan2021), to evaluate model behaviour at the level of individual predictions as well as the global results of the model. Furthermore, this concern is not unique to data produced through automated means: humans are also black boxes. A researcher working with data collected via brute-force survey by citizen scientists or even trained professionals may struggle to delineate an explicit hermeneutics of archaeological imagery survey, which is a complex interplay of visual cues, prior knowledge and decision-making resulting in the evaluation of the presence or absence of archaeological features (Davis Reference Davis2020).
Nevertheless, some aspects of archaeological survey remain inaccessible to computational methods. As recognised by Casana (Reference Casana2014: 228), a human researcher is “engaging in a discursive, analytic process, thinking creatively about features we see” and is capable of “identifying unique or unusual features”. Neither of these vital characteristics is possible using automatic techniques. In contrast to automated identification of the presence or absence of a feature, archaeologists are searching for what such presences and absences mean concerning their relationships to each other and the archaeological record. Given this fact, researchers cannot relinquish our ability to think analytically and creatively about the features we see. Humans must remain active participants in the acquisition and analysis of archaeological data and take the time to examine the features we identify in their larger context.
Despite these caveats, we argue that automated surveys hold great promise. The automated identification of archaeological features at regional and supra-regional scales provides contexts for deciding where best to focus human creativity and analytical thinking. Much like a trowel, shovel or backhoe, automation tools are not appropriate in all circumstances, but AI-assisted surveys may be invaluable to address questions at a supra-regional scale.
Data sources
Satellite imagery
For our preliminary automated survey, satellite imagery from DigitalGlobe's WorldView 2 and WorldView 3 satellite constellations (since purchased by Maxar) were used to produce and test models to detect archaeological structures. The imagery, covering approximately 11 500sq km between the cities of Arequipa and Cuzco (Figure 1) is a Standard 2A level product, radiometrically and atmospherically corrected, and geometrically pre-processed using a coarse elevation model by DigitalGlobe (Pour et al. Reference Pour, Zoheir, Pradhan and Hashim2021). The images were then mosaiced, pan-sharpened using the OrfeoToolbox Bayesian Fusion algorithm (Grizonnet et al. Reference Grizonnet, Michel, Poughon, Inglada, Savinaud and Cresson2017) and scaled from 32-bit to 8-bit to reduce computational storage and processing requirements. Traditional machine-learning datasets such as ImageNet are composed of 8-bit Red, Green and Blue (RGB) images. Therefore, to facilitate transfer learning on pre-trained networks the RGB spectral bands were extracted to bring the images more in line with these data (Deng et al. Reference Deng, Dong, Socher, Li, Li and Fei-Fei2009).

Figure 1. GeoPACHA and automated survey study regions (figure by authors).
Archaeological data for automated survey
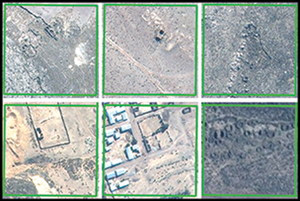
Archaeological features of interest in the automated survey were relict buildings (Figure 2), defined as round or rectilinear structures, no more than 30m in their largest dimension, lacking modern roofing and maintenance. Using QGIS, an open-source Geographic Information System (QGIS Development Team 2009), a grid of 76.8 × 76.8m squares (256 × 256 pixels at 0.3m resolution) was generated covering the imagery and 5000 squares were randomly selected for manual inspection. The presence or absence of archaeological structures was recorded for each square. Of these, approximately one per cent (n = 47) yielded examples of archaeological structures. These data were augmented with an additional 308 squares containing archaeological structures previously known to the authors to provide sufficient positive examples for model training and validation. Initial modelling efforts revealed that modern structures were often confused with archaeological structures, so an additional 1183 squares containing modern structures were added as negative examples to the dataset. Removing squares that fell on the edge of an image, or where the imagery was obscured by clouds, resulted in a total of 6428 labelled squares for model training, validation and testing. Finally, image chips (small images extracted from the source image to train the deep-learning model) that correspond to the label squares were created using Raster Vision (raster-vision 2022).

Figure 2. Examples of archaeological structures used for training the automated survey model. Note that archaeological structures may be isolated or associated with other archaeological or modern features (figure by authors; image copyright held by Maxar, reproduced under the NextView End User Licence Agreement).
The labelled image chips were split into sets for training (n structures = 298, n negatives = 3919), validation (n structures = 24, n negatives = 486), and testing (n structures = 33, n negatives = 485). Any chips within 400m of each other were grouped and the resulting groups were split with 80 per cent of groups placed in the training set, 10 per cent in the validation set and 10 per cent in the testing set. This ensured that all chips from within a single locus, or located in closely neighbouring loci, were not split between training and validation sets, thereby minimising the effects of spatial autocorrelation on model evaluation. Finally, the training data were augmented using vertical and horizontal flips and random rotations. This increases the number of images available for training to reduce overfitting and improve the model's ability to identify archaeological structures in any orientation. The validation set was used to monitor and evaluate the training progress. However, as one modifies model hyperparameters to optimise performance the model becomes fitted to the validation set. A separate test set was therefore reserved for independent evaluation of future versions of the model.
GeoPACHA data
The automated survey results were compared to those acquired through brute-force methods via GeoPACHA. As described by Wernke and colleagues, GeoPACHA is a “browser-based geospatial platform for discovering and documenting archaeological sites in the Andes through systematic visual survey of satellite and historical aerial imagery by a network of trained teams” (Wernke et al. Reference Wernke, VanValkenburgh and Saito2020: S62). In this case, GeoPACHA data from a survey area overlapping with our automated survey area offer an independent means of comparing the two methods. The GeoPACHA database currently contains 36 248 recorded archaeological loci. The south-western survey zone, edited by Wernke, covered 78 372km2 and recorded 14 685 loci with attribute data. This dataset was collected entirely independently from the automated survey data described above and provides an independent test of the model across approximately 3000km2 where the two surveys overlap and in which GeoPACHA identified 844 loci (Figure 3). These data should therefore be of sufficiently high quality and quantity to evaluate the capabilities of the automated survey.

Figure 3. Data produced by the GeoPACHA (with locus types included for reference) and automated surveys for the geographic region of surveying overlap. Note the similarity in the distribution of identified sites between the surveys (figure by authors).
Methods
Deep learning
Innovations in deep learning (a machine-learning technique inspired by neural networks which uses consecutive layers of computation to represent complex features) in the past decade have dramatically improved the capabilities of computer vision models. However, training such models from scratch requires datasets of thousands or millions of labelled example images. Such datasets are often beyond the scale available for archaeological data. Fortunately, a method known as transfer-learning makes it possible to repurpose models that have been pre-trained on standard datasets such as ImageNet (Deng et al. Reference Deng, Dong, Socher, Li, Li and Fei-Fei2009) to work on new problems with much smaller datasets. This research uses transfer-learning on the well-known ResNet-50 (He et al. Reference He, Zhang, Ren and Sun2015) computer vision model, trained on ImageNet, to classify satellite imagery chips for the presence or absence of archaeological features.
We used an open-source framework for deep learning on remote-sensing data, known as Raster Vision (raster-vision 2022), to train and deploy our automated survey. Training data were used to transfer-train a ResNet-50 model using the standard Adam optimiser for 20 epochs (full passes through the training data), with a learning rate of 0.0001 (for rapid and stable optimisation) and a batch size of 20 images (to speed up computation). The model was checked against the validation set to evaluate overfitting. Methodological details, code and model parameters are included at github.com/geopacha.
Data comparison
The GeoPACHA dataset enables comparison of the results of the automated survey directly with high-quality, independently produced data. However, some translation is necessary to make the datasets comparable. The automated survey algorithm marks 76.8 × 76.8m chips that contain archaeological features, while GeoPACHA data record a single point for each locus, located near the surveyor's estimation of the centre of the locus. In the GeoPACHA dataset, all features within 100m of each other are designated as a part of the same locus. Therefore, a locus with two components separated by a space of 80m would be marked in the space between the components, where there are no archaeological features for the automated survey to find. Furthermore, differences in pre-processing between the Worldview imagery and the imagery sources (Bing or Google) used for GeoPACHA produced differences in loci locations. To account for these differences, any chip identified by the automated survey as containing an archaeological feature which was located within 100m of a GeoPACHA locus was designated as having identified that locus.
Of the 844 loci identified in GeoPACHA for the survey area (Wernke et al. Reference Wernke, VanValkenburgh and Saito2020), 391 locations marked in GeoPACHA were not identified by the automated survey. A manual review of these 391 loci found 102 that were not visible in the satellite imagery used for the automated survey while the remaining 289 were visible but unmarked by the automated survey (false negatives). These loci were either obscured in the automated imagery dataset (due to clouds, shadows or destruction) or had been mapped from their record in published works (and labelled as such in GeoPACHA). These loci were not visible in the Worldview imagery, and so could not be identified by the automated survey. Excluding these loci from the analysis left 742 loci in the GeoPACHA dataset that are also visible in the Worldview imagery for the automated survey region. Approximately 20 features identified in the GeoPACHA dataset do not meet the working definition of archaeological structures used in the construction of the automated survey. These are large-scale constructions such as fortifications or corrals that were clearly of archaeological relevance but did not contain structures smaller than 30m in dimension. While it is expected that the model would not identify these features because training data were not designed to do so, these features were not excluded from the following analysis because there are indeed visible archaeological features at these locations which were not identified by the automated survey. As discussed above, one of the advantages of human surveyors over automated methods is their ability to engage in the creative process of identifying features of archaeological interest that fall outside narrow definitions. The choice to penalise the model for not identifying visible archaeological features for which it was not designed reflects this shortcoming and offers a more realistic picture of working with automated survey data. While the model can (and will) be re-trained to identify such features, the following analysis reflects its current capabilities and is therefore a conservative estimate of the automated survey's potential performance.
Results
The automated survey successfully identified 453 visible loci that were also identified in the GeoPACHA dataset. In these locations, GeoPACHA and the automated survey were in agreement and we have high confidence in the presence of visible archaeological features. This leaves 289 loci visible in GeoPACHA data that the automated survey failed to identify. However, in addition to the loci identified by GeoPACHA, the automated survey identified 1031 other locations as having archaeological structures that were not identified in the GeoPACHA dataset. A manual review of these locations found that 315 locations did indeed contain structures that met the definition of an archaeological structure used in this analysis. This brings the total of known loci in the area identified through the combined surveys to 1057. Of these, GeoPACHA surveyors identified 742 (a recall rate of approximately 70%), while the automated survey identified a comparable 766 (a recall rate of approximately 73%). The results are summarised in Figure 4. Of course, there may be more archaeological features visible in the imagery which were not identified by either the GeoPACHA or the automated surveys; however, we expect that the number of unidentified visible features in the region is very small.

Figure 4. Confusion matrix for the GeoPACHA survey shows decent recall and very few false positives, while the automated survey had a decent recall but many false positives (figure by authors).
While the two surveys had a similar recall rate, GeoPACHA surveyors far outperformed the automated survey in terms of precision. It is difficult to evaluate how many of the 742 loci identified by GeoPACHA surveyors were incorrectly marked as archaeological features without visiting these features on the ground. However, following our inspection of the data, we expect that the number of falsely identified loci is negligible, likely less than one per cent. In the automated survey, there were 716 false positives wherein the model mistakenly identified modern structures, rocks or other natural formations as archaeological structures. Therefore, 48 per cent of all the loci identified by the automated survey were false positives. As a result, the F1 score (used for evaluating model performance) for the automated survey is approximately 61 per cent while GeoPACHA surveyors achieved an F1 score of approximately 82 per cent.
Discussion
Managing false negatives
We found it surprising that the team of expert GeoPACHA surveyors and the automated algorithm had similar recall rates, with each missing approximately 30 per cent of the visible archaeological features identified between the two surveys. Human vigilance constraints may have played a role in producing this pattern. Most of the features identified in the study area are estancias (pastoralist corral and residential complexes), which often have both modern and archaeologically relevant components. GeoPACHA surveyors for this region were asked to record an estancia if it appeared to contain components that lacked roofs or evidence of maintenance for part or all of the estancia complex. After viewing many modern estancias that did not contain unmaintained structures, researchers may have been less likely to observe archaeological features when they were present due to fatigue or uncertainty about whether a structure met the standard of ‘unmaintained’.
Regardless of the underlying factors, the relatively low recall rate for both surveys suggests that future analyses must account for biases caused by missing data, regardless of whether data come from an automated survey or expert surveyors. For more rigorous analyses, it may be necessary for teams to resurvey areas that have already been inspected to ensure that as complete a dataset as possible has been collected, establish quantifiable metrics for how much data are likely missing and evaluate biases. Comparisons to terrestrial surveys are also necessary to account for the archaeological features that were missed because the features were not visible from the satellite imagery. Fortunately, archaeologists are accustomed to these sorts of considerations as archaeological data are always partial, contingent and uncertain due to taphonomic and sampling biases.
Managing false positives
Our results suggest that while the automated survey was not subject to fatigue or uncertainty, it was also less discerning. That is, the automated survey identified some archaeological features missed by GeoPACHA surveyors, but it often misidentified modern structures and complexes as archaeologically relevant loci, and it occasionally misidentified rocks, trees and other landscape components as archaeological features. This issue might be addressed by increasing the size of the training dataset, enhancing data augmentation and using all eight available spectral bands of the satellite imagery to provide the algorithm with more information about the materials of the identified features.
In any case, the problem with false positives will likely persist as the unbalanced nature of the data is a fundamental problem. Convolutional Neural Networks tend to perform best when there are similar numbers of positive and negative examples, while archaeological features are uncommon on the landscape. Therefore, it remains necessary for human researchers to manually check the results of even highly reliable automated models to eliminate false positives. Rather than surrendering control to an algorithm, using AI to assist in the survey process appears optimal, with humans acting as the ultimate arbiters of presence or absence and identifying unique or unusual features the model may have missed.
Conclusions
While manual and automated methods have been counterpoised as mutually exclusive approaches to archaeological imagery survey, our experiences suggest they can be productively combined along a spectrum of human–machine teaming approaches. In this article, our AI-assisted approach is shown to have identified over 300 more archaeological loci in the study area than either manual or automated survey alone. These results suggest that when automated methods are used to focus and expand human interpretation, rather than replace it, they can make satellite surveys more robust, consistent and reliable. Post hoc comparison between different survey methods, such as the one presented above, allows for independent evaluation of results and can help to highlight shortcomings in data produced by different approaches. However, because it requires multiple surveys to be completed independently of each other, it also demands excess work and provides little immediate benefit to the surveyors themselves. A more productive alternative is to use automated and manual survey methods in tandem, to improve results and relieve some of the time and fatigue burdens on expert surveyors.
We envision three particularly promising approaches for AI–human teaming in archaeological imagery survey. First, automated methods can be used for ‘low-probability filtering’—identifying regions with no clear archaeological features and allowing researchers to exclude them to focus on areas that have a higher probability of containing features of interest. This approach would not only reduce the overall time taken to survey, but also help the researcher to maintain vigilance as they will discover features of interest more frequently and suffer less fatigue. Alternatively, automated survey can be employed as ‘quality control’, that is, as a secondary check during the survey process, identifying areas that the researcher should review again before marking a location as not containing features of archaeological interest. One of the great advantages of this second technique is that human researchers maintain control over the process throughout, enabling them to record the kinds of complex metadata that are still beyond the abilities of automated approaches.
Third, and perhaps most excitingly, the automation/manual survey process can take a ‘recursive teaming’ approach, with manual survey data feeding back into the automated survey algorithm to improve its results, which can then guide further manual survey. The model analysed above was trained using a mere 298 positive examples of archaeological structures, and the simplest and most powerful way of improving deep-learning algorithms is to provide them with more training data. GeoPACHA contains over 36 000 loci with archaeological features. Using these data as training data could dramatically improve the capabilities of the automated system, allowing it to better guide manual surveyors to identify features missed in their initial efforts, and to expand to new areas. This loop can be condensed further: human-guided incremental machine learning enables models to improve dynamically as new data are added, rather than having to repeatedly train from scratch (Gil et al. Reference Gil2019; He et al. Reference He, Mao, Shao and Zhu2020; Yang & Tang Reference Yang and Tang2020). Such approaches allow the researcher and the automated system to work together, simultaneously improving the results of both. Indeed, this is the path we are pursuing going forward.
Advances in computer vision techniques in the last decade have made it important to revisit their usefulness in conducting archaeological surveys using satellite imagery. In some domains, such as medical imaging, automated search/classification algorithms are approaching or surpassing human capacity for identifying features of interest but their application in archaeology is just beginning. Our research demonstrates that deep-learning methods when used in tandem with manual surveys show great promise for large-scale regional and supra-regional surveys.
Acknowledgements
The satellite images used in this paper were provided gratis through a Digital Globe Foundation in kind satellite imagery grant (Steven A. Wernke, PI). Computational infrastructure was provided by the Vanderbilt University Spatial Analysis Research Laboratory. Though this article benefited from input from several colleagues and collaborators, any errors therein are entirely our own.
Funding statement
Implementation-level funding for GeoPACHA was provided by an American Council of Learned Societies Digital Extension Grant (Steven A. Wernke, PI; Parker VanValkenburgh, co-PI). Graduate student funding and machine-learning model development were supported by NSF Grant Award 2106717 (Wernke, PI) and NSF Grant Award 2106766 (VanValkenburgh, PI). Initial development of GeoPACHA was supported by a National Endowment for the Humanities Level II Digital Humanities Startup Grant (Grant HD-229071-15, Wernke, PI), and a Center for Advanced Spatial Technology (CAST) Spatial Archaeometry Research Collaborations (SPARC) grant (Wernke, PI; VanValkenburgh, co-PI).


 Open access