
Understanding the Role of CDH4 in Multiple System Atrophy Brain
Abstract
Background:
Multiple system atrophy (MSA) is a rapidly progressive neurodegenerative disease clinically characterized by parkinsonism, cerebellar ataxia, and autonomic dysfunction. A major pathological feature of MSA is the presence of α-synuclein aggregates in oligodendrocytes, the myelinating cells of the central nervous system. A genome-wide association study revealed that the CDH4 gene is associated with MSA. However, virtually nothing is known about the role of CDH4 in the context of MSA.
Objective:
Our aim was to compare the expression of CDH4 between MSA and control brains, and to investigate its relationship with α-synuclein in oligodendrocytes.
Methods:
RNA and protein were prepared from putamen, motor cortex white matter, cerebellum, and superior occipital cortex tissues collected from MSA (N = 11) and control (N = 13) brains. The expression of CDH4 was measured at mRNA and protein levels by qPCR and western blotting. Oligodendrocyte cells were cultured on plates and transfected with CDH4 cDNA and its impact on α-synuclein was analyzed.
Results:
Firstly, we found that CDH4 in MSA brain was significantly elevated in the disease-affected motor cortex white matter in MSA (N = 11) compared to controls (N = 13) and unaltered in the disease-unaffected superior occipital cortex. Secondly, we determined that increases in CDH4 expression caused changes in the cellular levels of α-synuclein in oligodendrocytes.
Conclusions:
When put together, these results provide evidence that support the GWAS association of CDH4 with MSA.
INTRODUCTION
Multiple system atrophy (MSA) is a rapidly progressing neurodegenerative disease characterized by autonomic dysfunction, parkinsonism, and cerebellar ataxia. The clinical phenotype of motor dysfunction distinguishes MSA into predominantly parkinsonian (MSA-P) or cerebellar (MSA-C) subtypes, primarily affecting striatonigral and olivopontocerebellar structures, respectively [1]. Disease-affected regions of MSA brain contain characteristic hallmark of glial cytoplasmic inclusions (GCI) that contain α-synuclein aggregates in oligodendrocytes [2, 3]. α-Synuclein is usually present in the synapse, with a putative role in vesicular trafficking [4]. An early MSA pathogenic event involves the relocalization of the key oligodendrocyte microtubule protein TPPP from the cell processes to the soma, followed by α-synuclein accumulation [5]. The interaction between these proteins induces phosphorylation and aggregation of α-synuclein, resulting in GCI formation [6]. Previous in vitro modelling demonstrated that exogenous application of preformed α-synuclein fibrils in oligodendrocyte precursor cells triggered increases in the abundance and oligomerization of endogenous α-synuclein [7].
A GWAS study of European and North American MSA patients identified genes associated with MSA [8]. Interestingly, the study could not recapitulate previously identified risk associations in SNCA and COQ2, but revealed single-nucleotide polymorphisms (SNP) in a small number of novel genes at P value above the cut-off benchmark of 1.0x10⁻⁸. Of these, a G/A SNP was identified in the CDH4 gene [8], which encodes a Ca2 +-dependent cell adhesion glycoprotein called cadherin-4 (CDH4; also called R-cadherin). Cadherins mediate the cell-to-cell adhesion, providing both structural and cellular organization, and are involved in dynamic intracellular signaling events with Wnt/β-catenin and RHO GTPases [9, 10].
Research into the role of cadherins in neurodegeneration is limited, with little known about the role of CDH4 in neurodegenerative diseases. SNPs previously identified in the CDH4 locus were shown to be associated with lifespan [11] and cerebral brain volume in an aging cohort [12]. Increases in CDH4 expression have been detected in brain-derived microvascular endothelial cells in Huntington’s disease [13]. And, a SNP in CDH4 has been identified in patients with subjective cognitive decline [14]. CDH2, which shares 74% homology with CDH4 [15], has been implicated in Alzheimer’s disease pathology, with protein fragments present in diseased brain [16]. When murine primary neurons were treated with amyloid-β42, the binding of CDH2 was disrupted and caused cell death [17]. Also, evidence of perturbed CDH2 protein processing has been shown in the cerebrospinal fluid of Parkinson’s disease patients [18]. Taken together, these data suggest that cadherins are likely to be involved in neurodegenerative processes.
To date, the role of CDH4 in MSA pathogenesis is unknown. In this study, we assessed the expression of CDH4 in MSA and control brain. We also altered CDH4 levels in oligodendrocytes and assessed its impact on α-synuclein levels. We provide evidence for a possible role of CDH4 in MSA.
MATERIALS AND METHODS
Human brain tissues
Frozen postmortem brain tissues were obtained from Sydney Brain Bank and NSW Brain Tissue Resource Centre with ethics approval from the University of Sydney (approval number 2019/589). Samples from the putamen, motor cortex white matter, cerebellum and superior occipital cortex from pathologically diagnosed MSA-P (N = 6), MSA-C (N = 5), and controls (N = 13) without neuropathology or neurological or psychiatric disorders or cognitive impairment were used in this study (Table 1).
Table 1
Demographics of control and MSA cases
| Case # | Age (y) | Sex (M/F) | MSA-P or MSA-C | Disease duration (y) |
| Control 1 | 79 | M | – | – |
| Control 2 | 103 | M | – | – |
| Control 3 | 89 | F | – | – |
| Control 4 | 101 | F | – | – |
| Control 5 | 93 | F | – | – |
| Control 6 | 88 | F | – | – |
| Control 7 | 84 | M | – | – |
| Control 8 | 93 | F | – | – |
| Control 9 | 100 | M | – | – |
| Control 10 | 84 | M | – | – |
| Control 11 | 80 | F | – | – |
| Control 12 | 97 | F | – | – |
| Control 13 | 88 | M | – | – |
| MSA 1 | 61 | M | P | 12 |
| MSA 2 | 61 | M | P | 2 |
| MSA 3 | 71 | F | P | 6 |
| MSA 4 | 72 | F | P | 5 |
| MSA 5 | 84 | F | P | 22 |
| MSA 6 | 74 | F | P | 7 |
| MSA 7 | 82 | M | C | 7 |
| MSA 8 | 64 | M | C | 8 |
| MSA 9 | 74 | M | C | 13 |
| MSA 10 | 69 | M | C | 8 |
| MSA 11 | 70 | M | C | 5 |
Cell culture
Oligodendrocyte cell lines MO3.13 (human derived oligodendrocytes; ATCC) and OLN-AS7 (rat oligodendrocyte expressing human α-synuclein; a gift from Poul Henning Jensen) were cultured in Dulbecco’s modified Eagle’s medium containing 10% fetal calf serum, 2 mM glutamine, 100 IU/ml penicillin and 100μg/ml streptomycin, at 37°C in humidified air containing 5% CO2. With OLN-AS7 cells, 100μg/ml Zeocin (Invitrogen) was added. Cells were transfected with human CDH4 cDNA (Origene, cat# RC210970) using Lipofectamine 2000 (Invitrogen) following the manufacturer’s protocol.
RNA extraction, reverse transcription, and qPCR
RNA was extracted from cells and tissues using TRIzol Reagent (Invitrogen) as per manufacturer’s protocol. All procedures were carried out using RNase-free reagents and consumables. One μg of RNA was reverse transcribed into cDNA using Moloney-murine leukemia virus (M-MLV) reverse transcriptase and random primers (Promega, Madison, WI, USA) in 20μl reaction volume. Quantitative PCR (qPCR) assays were carried out using a Mastercycler ep realplex S (Eppendorf) and the fluorescent dye SYBR Green (Bio-Rad), following the manufacturer’s protocol. Briefly, each reaction (20μl) contained 1×mastermix, 5 pmol of primers and 1μl of cDNA template. Primer sequences are shown in Table 2. Amplification was carried out with 40 cycles of 94°C for 15 s and 60°C for 1 min. Gene expression was normalized to the geometric mean of three housekeeper genes, GAPDH, β-actin and PPIA. A no-template control was included for each PCR amplification assay. The level of expression for each gene was calculated using the comparative threshold cycle (Ct) value method using the formula 2–ΔΔCt (where ΔΔCt =ΔCt sample— ΔCt reference).
Table 2
qPCR primer sequences
| Gene | Sequence | Product size (bp) |
| CDH4 | F: GCAGAAAGGAAAGAAGGTCGTG | 147 |
| R: GAGTTCTCGGGCACGTTGATG | ||
| SNCA | F: TAGGCTCCAAAACCAAGGAGG | 199 |
| R: CCTTCTTCATTCTTGCCCAACT | ||
| β-actin | F: TCATGAAGTGTGACGTGGACATCCGT | 285 |
| R: CCTAGAAGCATTTGCGGTGCACGATG | ||
| GAPDH | F: AATGAAGGGGTCATTGATGG | 108 |
| R: AAGGTGAAGGTCGGAGTCAA | ||
| PPIA | F: AGGGTTCCTGCTTTCACAGA | 211 |
| R: GTCTTGGCAGTGCAGATGAA |
Brain tissue protein extraction
Tris-buffered saline (TBS) soluble and sodium dodecyl sulphate (SDS)-soluble proteins were serially extracted from 50 mg of fresh-frozen brain tissue as previously described [19]. In brief, tissue samples were homogenised in ten volumes TBS homogenization buffer (20 mM Tris, 150 mM NaCl, pH 7.4, 5 mM EDTA, 0.02% sodium azide) containing protease inhibitor cocktail (Roche) using Qiagen tissue lyser (3×30 s, 30 Hz cycles), followed by centrifugation at 100,000×g for 1 h at 4°C, with supernatant collected as the TBS-soluble fraction containing cytosolic proteins. The pellet was resuspended in SDS solubilization buffer (TBS homogenization buffer containing 5% SDS) using 3×30 s, 30 Hz cycles with Qiagen Tissue Lyser, and centrifuged at 100,000×g for 30 min at 25°C, with supernatant collected as the SDS-soluble fraction containing membrane-associated proteins. Protein concentration was measured using bicinchoninic acid assay (Pierce BCA Protein Assay Kit) following the manufacturer’s instructions.
Cell protein extraction
Cells growing in plates were washed with ice-cold PBS and treated with lysis buffer (20 mM Tris-HCl, pH 7.5, 150 mM NaCl, 1 mM EDTA, 1% Nonidet P40, 0.5% deoxycholate, 0.1% sodium dodecyl sulfate and protease inhibitors). Cell homogenates were transferred to microcentrifuge tubes and centrifuged at 12,000 g for 20 min at 4°C. The protein concentration of the resulting supernatant was measured using bicinchoninic acid assay (Pierce BCA Protein Assay Kit) following the manufacturer’s instructions.
Western blotting
Protein lysates (10μg for tissue, 20μg for cells) were heated at 95°C for 5 min in sample buffer (3.2% SDS, 32% glycerol, 0.16% bromophenol blue, 100 mM Tris-HCl, pH 6.8, 8% 2-mercaptoethanol) and then electrophoresed on Criterion stain-free 4-20% SDS-PAGE gels (Bio-Rad). The gels were transferred onto nitrocellulose membranes at 90 volts for 90 min. The membranes were blocked with TBS containing 5% w/v non-fat dry milk and probed with anti-CDH4 antibody (Abcam, ab109242, 1 : 2,000) or anti-α-synuclein (BD Biosciences, #610787, 1 : 2,000) overnight at 4°C. They were then washed three times in TBS containing 0.1% Tween 20 and incubated with horseradish peroxidase-conjugated secondary antibody for 2 h at room temperature. Signals were detected using enhanced chemiluminescence and Gel Doc System (Bio-Rad). The blots were stripped and probed for housekeeper protein β-actin. The signal intensity was quantified using Image Lab (Bio-Rad) and NIH ImageJ software (v1.45 s).
Immunofluorescence
OLN-AS7 cells grown in 8-well chamber slides were fixed with 4% paraformaldehyde. They were then permeabilized (1 x PBS, 0.25% Triton X-100), blocked (1 x PBS, 3% BSA) and incubated with α-synuclein antibody (BD Biosciences, #610787, 1 : 100) overnight at 4°C. Cells were washed with PBS prior to incubation with Alexa Fluor 488 fluorophore-conjugated goat anti-mouse antibody (Thermo Fisher, 3% BSA, 1 : 250) for 1 h. The cells were washed and counterstained with 4’,6-diamidino-2-phenylindole (DAPI, 1μl/ml in PBS) for 7 min. A coverslip was mounted to the slide using mounting media, and the cells were visualised with a confocal microscope (Nikon C2 Confocal Microscope). Ten randomly selected microscopic fields were captured for both control and CDH4-transfected cells at 20x magnification. Each field contained 10-30 cells. The relative α-synuclein intensity was calculated by dividing the total immunofluorescence quantity of α-synuclein by the cell count in each field using Image J Vl.47 software.
Statistical analysis
Statistical analyses of tissue studies were performed using SPSS Statistics software (IBM, Chicago, Illinois). Multivariate analyses (general linear model) were used to determine differences between the MSA and control groups. There was a significant difference in age between the groups (p = 0.000003), and therefore age was included as a co-variate in the multivariate analyses. There were no significant differences in sex (p = 0.444) nor postmortem delay (p = 0.851). Pearson’s correlations were used to determine associations between measurements. Statistical analysis of cell studies was performed using Student’s t-test on Excel. For all analyses, significance was set at p < 0.05. Graphs were generated using GraphPad Prism 9.
RESULTS
CDH4 expression is elevated in MSA brain
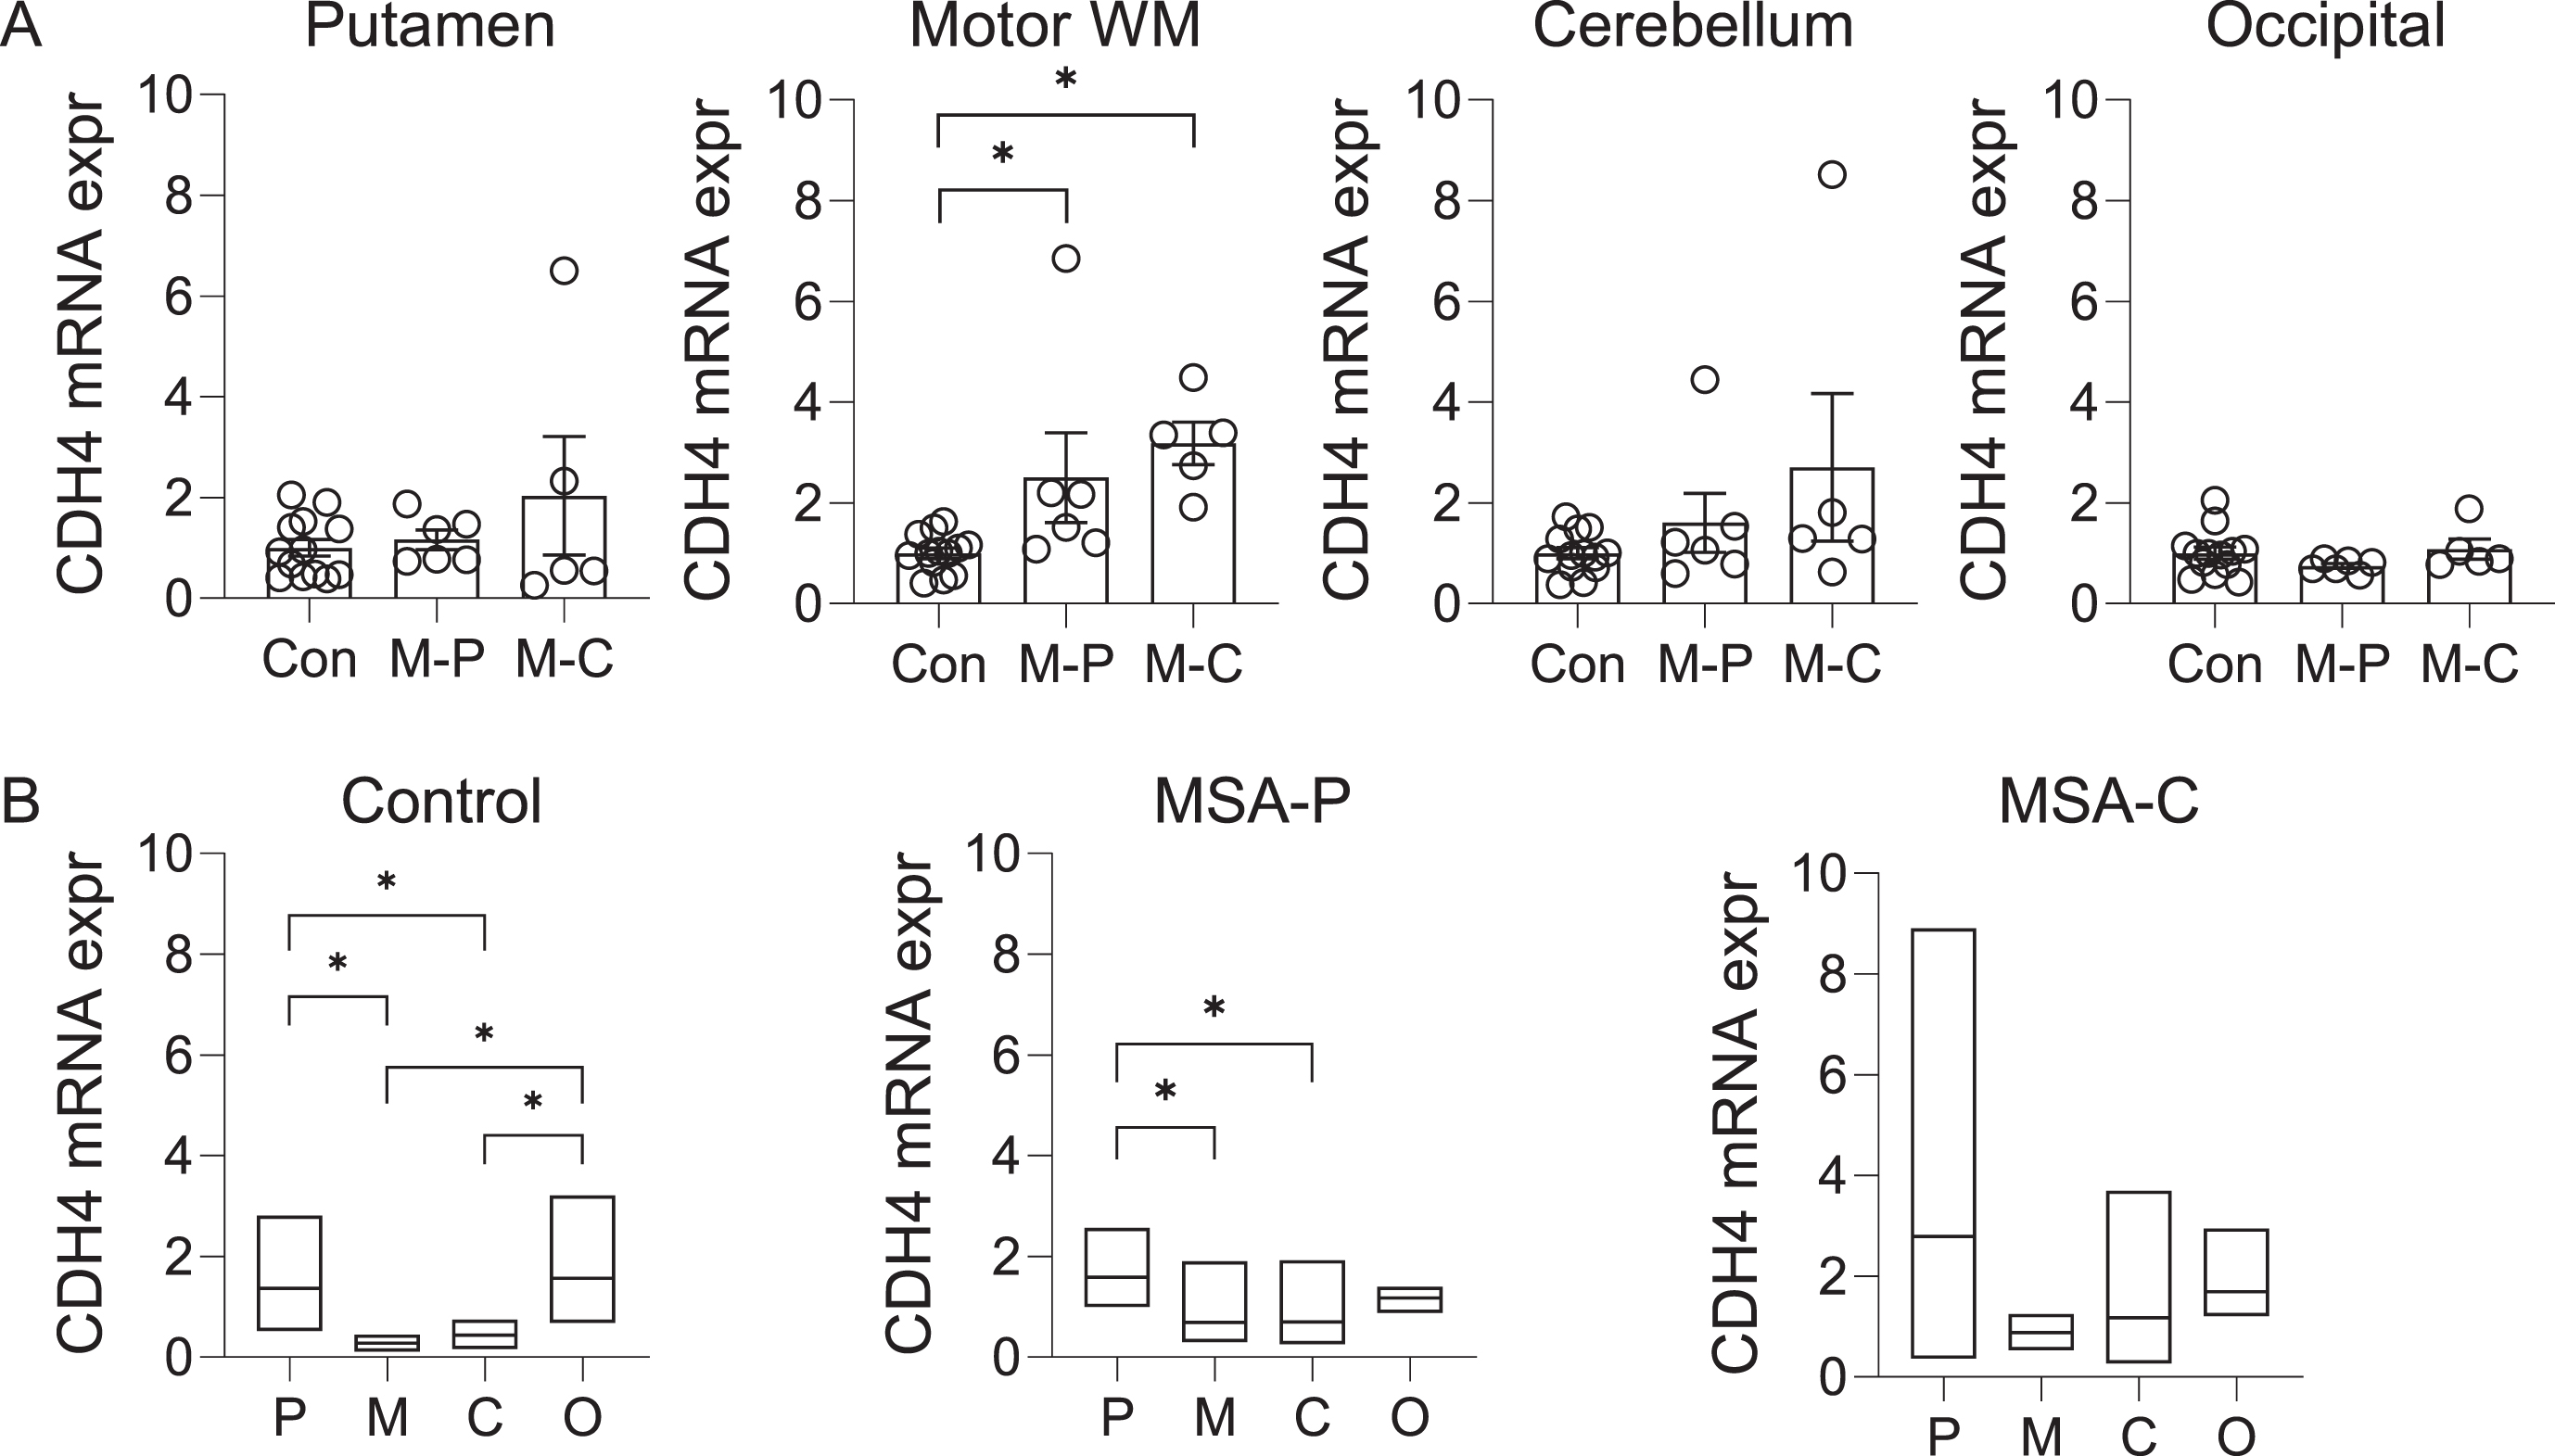
The CDH4 gene was shown to be associated with MSA at p value of 3.97x10⁻⁶ [8]. To gather clues to the role of CDH4 in MSA pathogenesis, we analyzed the expression of CDH4 in MSA-P, MSA-C and control brain in the disease-affected putamen, motor cortex white matter and cerebellum, and the disease-unaffected superior occipital cortex. CDH4 mRNA expression was significantly increased in the motor cortex white matter in both MSA-P and MSA-C compared to controls (Fig. 1A). There was also a trend for increase in the putamen and the cerebellum (Fig. 1A). CDH4 mRNA expression was not altered in the superior occipital cortex (Fig. 1A). Also, no significant differences were observed between the two MSA subtypes (Fig. 1A). We also analyzed the regional differences in CDH4 expression in each of the three groups. In controls, CDH4 expression was significantly higher in the putamen and superior occipital cortex compared to the motor cortex white matter and cerebellum (Fig. 1B). In MSA-P, CDH4 expression was significantly higher only in the putamen (Fig. 1B). In MSA-C, no significant differences were observed between the regions.
Fig. 1
CDH4 mRNA expression in control and MSA brain. A) Relative mRNA expression of CDH4 in control (Con), MSA-P (M-P), and MSA-C (M-C) in the putamen, motor cortex white matter, cerebellum, and superior occipital cortex. Data represent mean and SE as error bars; * p < 0.05. B) A comparison of mRNA expression in the putamen (P), motor cortex white matter (M), cerebellum (C), and superior occipital cortex (O) within each cohort. The box plots depict mean with maximum and minimum values; *p < 0.05.
We also analyzed CDH4 expression at the protein level by western blotting. The expression of the 120-kDa CDH4 protein was significantly increased in the MSA-P motor cortex white matter compared with controls, whereas a trend for increase was observed in the MSA-C motor cortex white matter (Fig. 2A). A weaker 100-kDa band (likely to be a non-glycosylated form of CDH4) was also detected, however, this band was not significantly altered in either MSA-P or MSA-C compared to controls (data not shown).
Fig. 2
CDH4 protein expression in control and MSA brain. A) CDH4 protein expression in control (Con), MSA-P (M-P), and MSA-C (M-C) in the motor cortex white matter and superior occipital cortex as measured by western blotting. The CDH4 bands were normalized to β-actin. Data represent mean and SE as error bars; *p < 0.05. B) Correlation of CDH4 and α-synuclein protein levels in the motor cortex white matter.
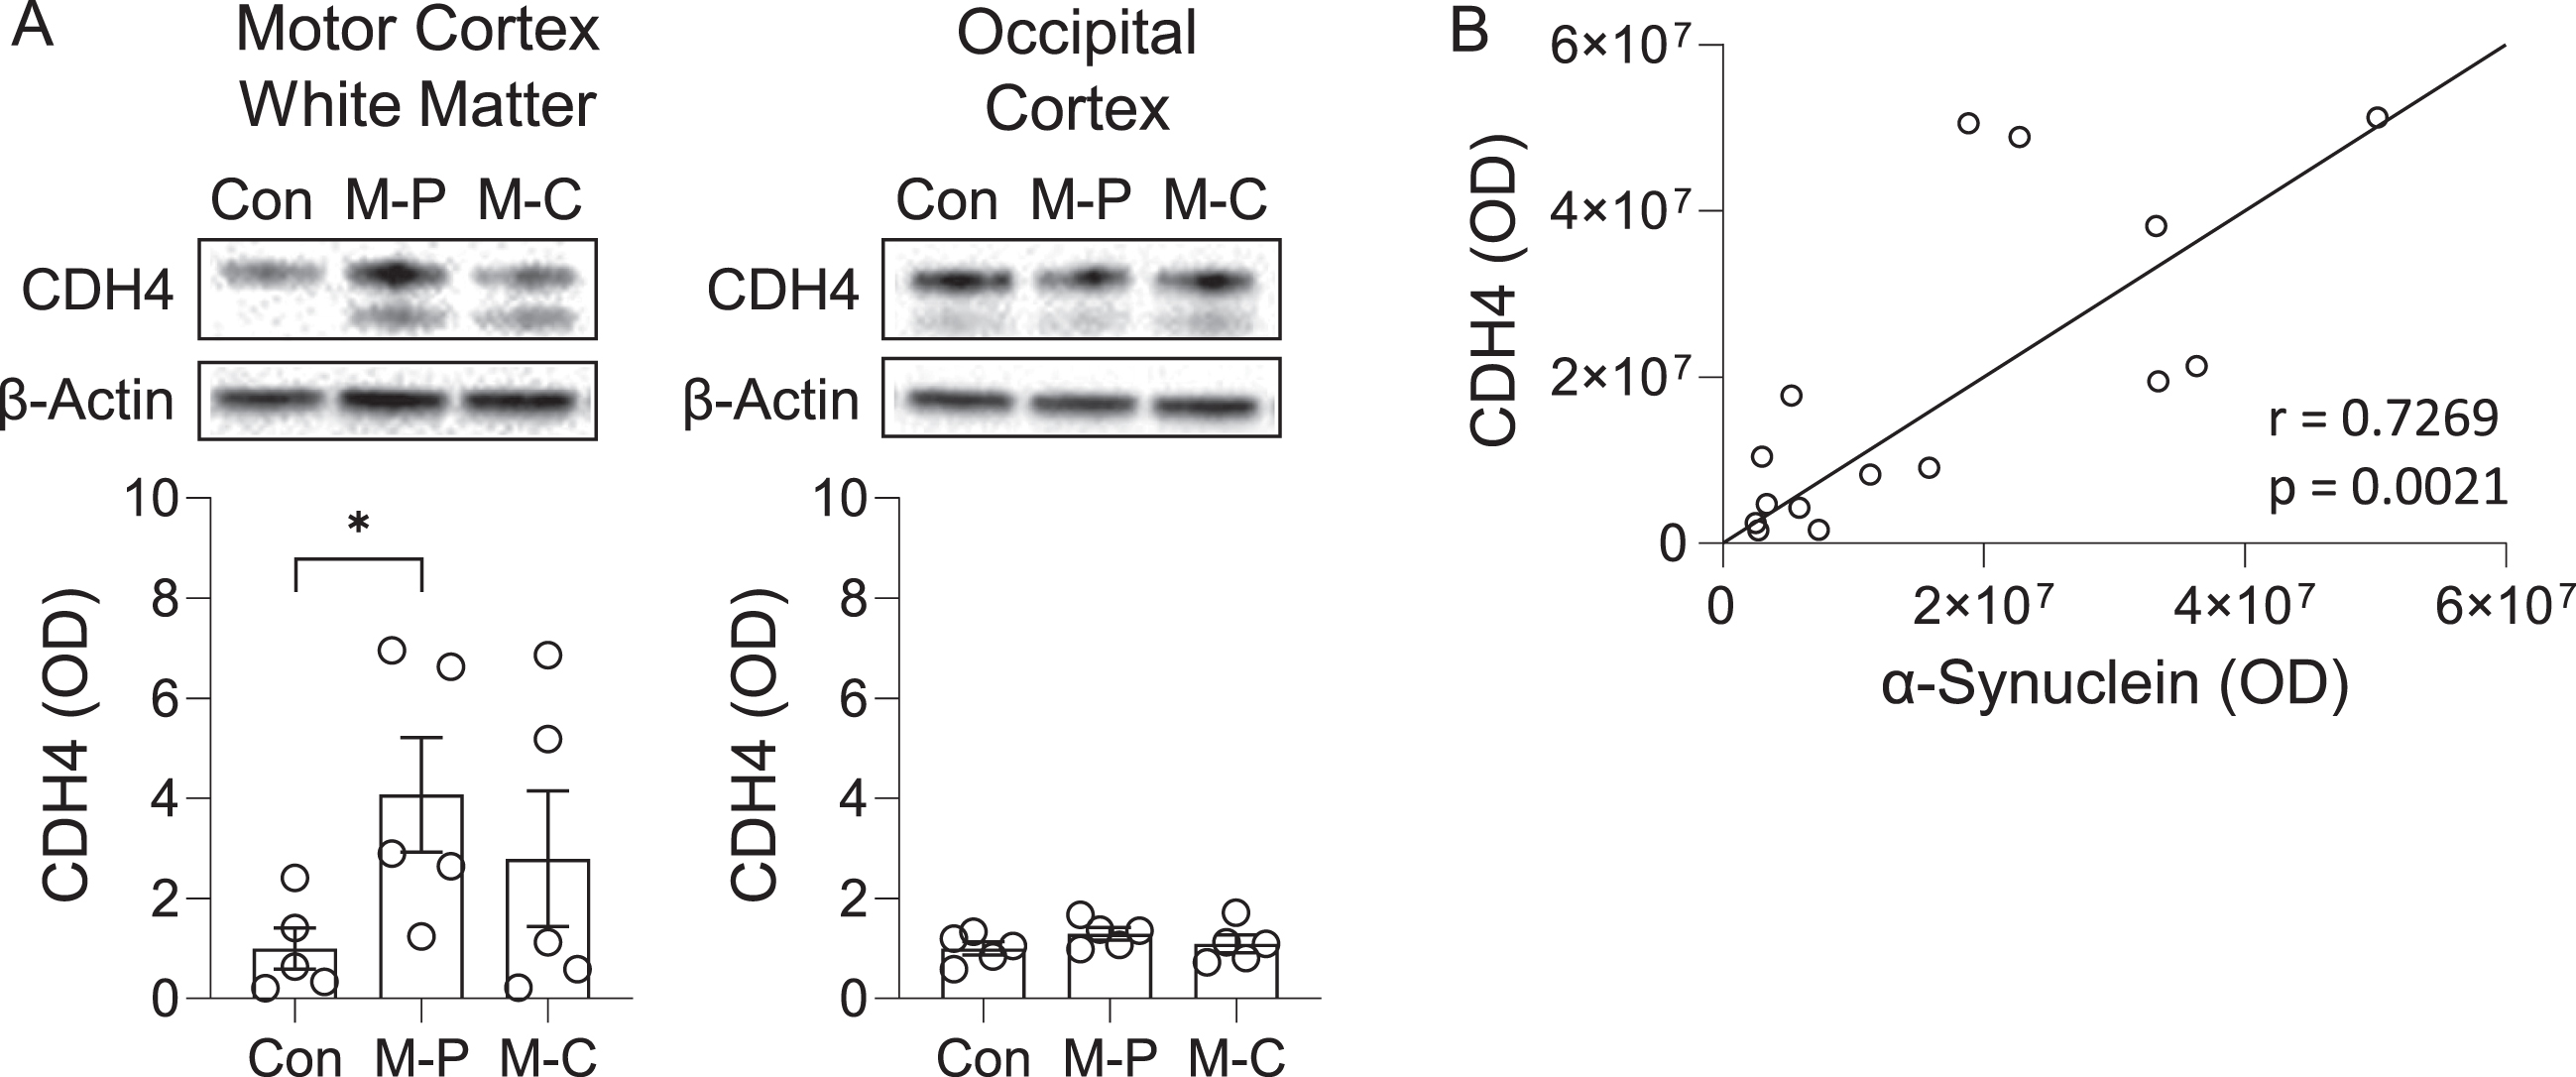
To evaluate the pathological relevance of CDH4 in MSA brain, we assessed whether there was an association between CDH4 and α-synuclein levels in the motor cortex white matter and found that the two were strongly correlated to each other (Pearson’s correlation = 0.7269, p = 0.0021) (Fig. 2B). When put together, these results suggest that CDH4 expression is altered in disease-affected regions of MSA brain and could be related to α-synuclein pathology.
Effect of CDH4 on α-synuclein levels
To further understand the link between CDH4 and α-synuclein, we investigated the impact of CDH4 on α-synuclein levels. In the first study, we transfected MO3.13 oligodendrocyte cells with CDH4 cDNA or empty vector as a control and assessed α-synuclein expression at both mRNA and protein levels. We found no significant changes in α-synuclein expression at the mRNA level (Fig. 3A). However, at the protein level, the expression of α-synuclein monomer was slightly increased in the CDH4-transfected cells (Fig. 3B). We also detected a band corresponding to α-synuclein trimer, which was significantly decreased in the CDH4-transfected cells (Fig. 3B).
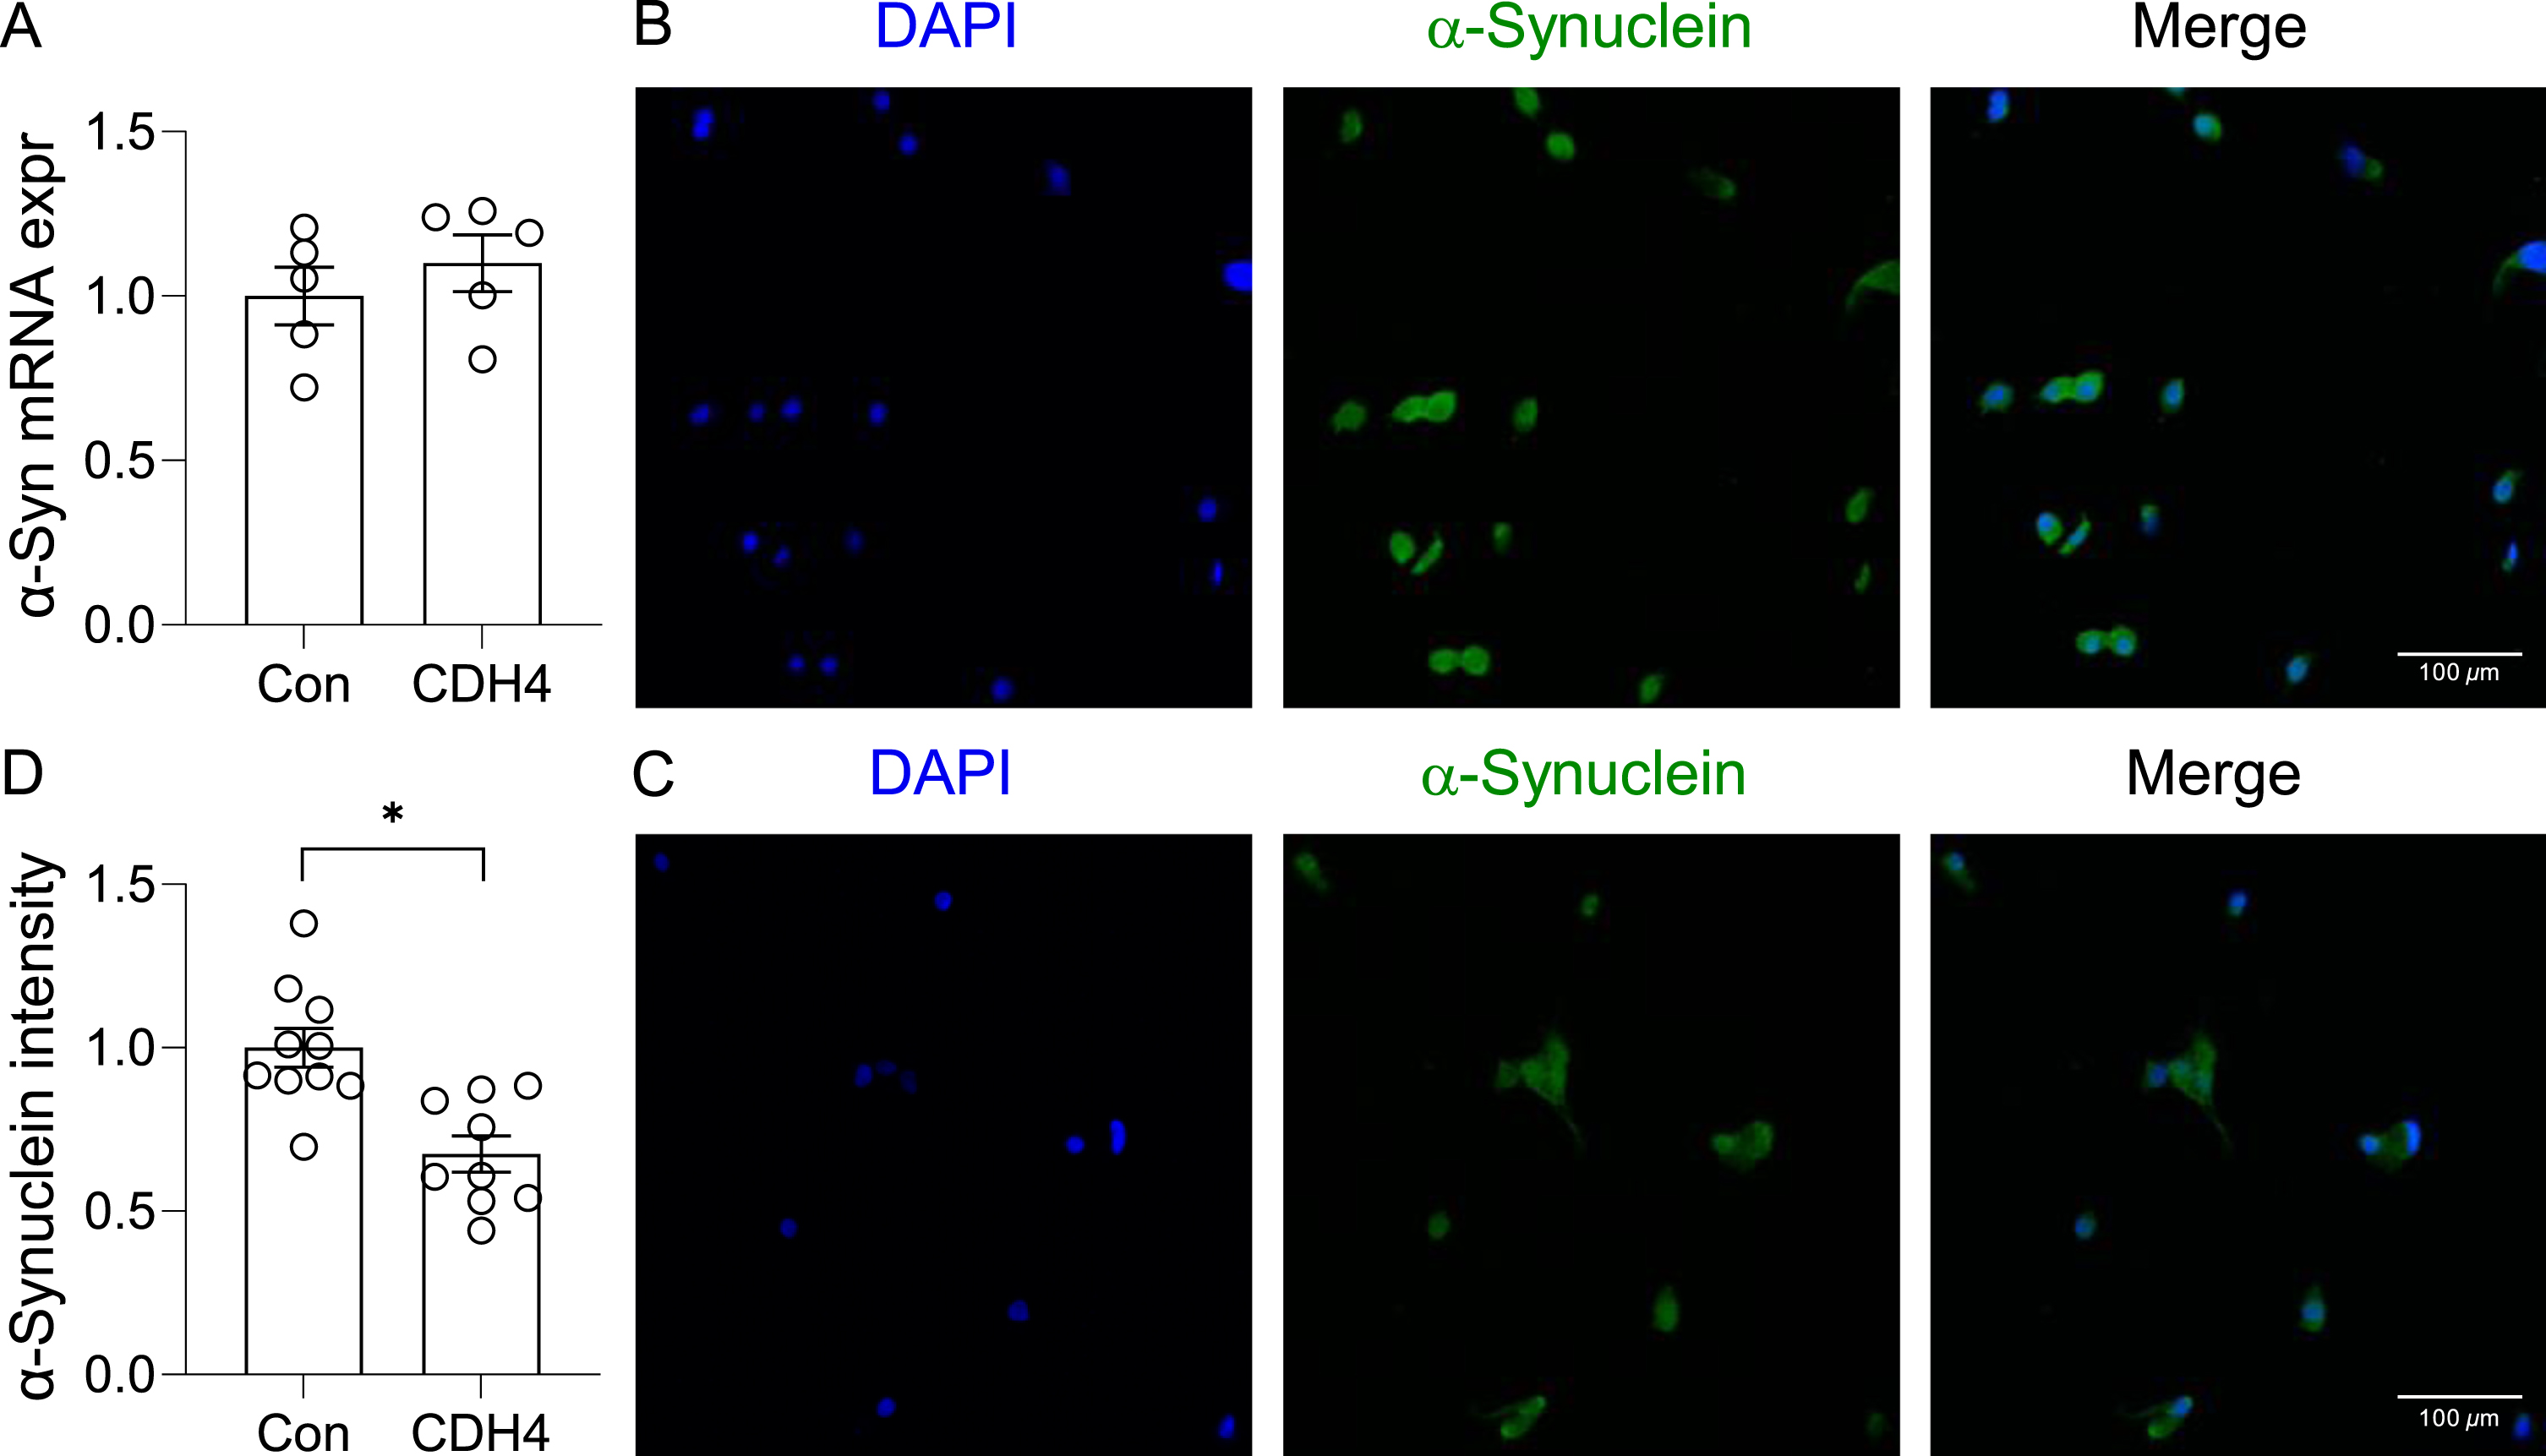
In the second study, we transfected the OLN-AS7 MSA cell model (rat oligodendrocyte cells that express the human α-synuclein) with CDH4 cDNA or empty vector (control) and assessed α-synuclein expression and aggregation. Once again, there was no significant changes in α-synuclein expression at the mRNA level (Fig. 4A). However, the immunofluorescent signal intensity corresponding to α-synuclein aggregates was significantly decreased in the CDH4-transfected cells compared to controls (Fig. 4B,C,D). The number of α-synuclein aggregate puncta in the CDH4-transfected cells was also decreased by 2.11-fold (p = 0.0019). These results suggest that increases in CDH4 expression causes decreases in α-synuclein oligomers/aggregates in oligodendrocytes.
Fig. 3
Effect of CDH4 on α-synuclein levels. MO3.13 oligodendrocyte cells were transfected with CDH4 cDNA or empty-vector control (Con) and α-synuclein expression measured by qPCR (A) and western blotting (B). Optical density of α-synuclein monomeric (M) and trimeric (T) bands were measured and normalized to GAPDH. Data represent mean and SE as error bars; *p < 0.05.
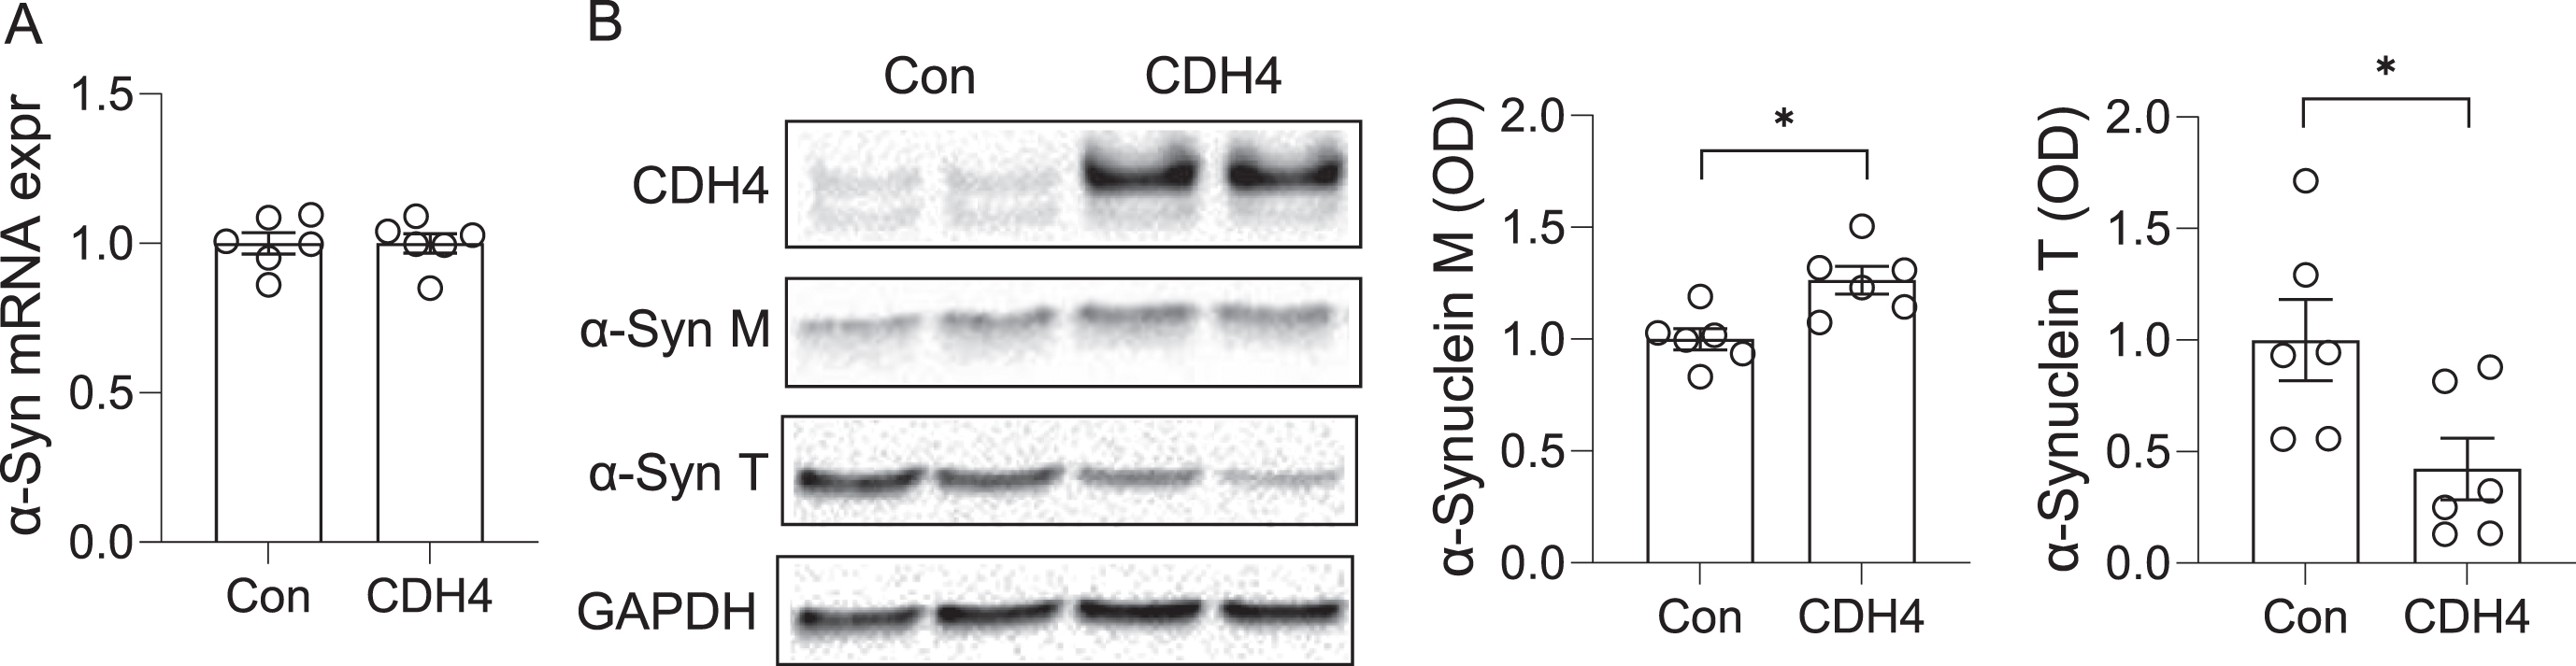
Fig. 4
Effect of CDH4 on α-synuclein aggregation. A) The OLN-AS7 oligodendrocyte MSA cell model was transfected with CDH4 cDNA or empty-vector control (Con) and α-synuclein expression measured by qPCR. B) Control cells and (C) CDH4-transfected cells were immunofluorescent-stained and examined under a confocal microscope. D) A comparion of α-synuclein signal intensity of the two groups. Data represent mean and SE as error bars; *p < 0.05.
DISCUSSION
MSA is an oligodendrocyte synucleinopathy of uncertain etiology. Like other neurodegenerative diseases, MSA pathogenesis is understood to be dictated by a number of simultaneous neuropathogenic mechanisms. A GWAS study has revealed that the CDH4 gene is associated with MSA [8]. We therefore investigated the possible role of CDH4 in MSA. We found that CDH4 expression was significantly elevated in the disease-affected motor cortex white matter in MSA compared to controls, whereas unaltered in the disease-unaffected superior occipital cortex, and that CDH4 expression was correlated with α-synuclein levels in the motor cortex white matter. We also found that increases in CDH4 expression in oligodendrocyte cell models caused decreases in α-synuclein oligomers and aggregates. These results suggest that CDH4 may influence the cellular levels and/or oligomerization of α-synuclein. In terms of difference between the two MSA subtypes, there were no clear differences in the CDH4 expression, although our cohort sizes were small. Nevertheless, there appears to be regional variabilities between the two subtypes.
CDH4 is a cell adhesion molecule (CAM) that is localized to cell surfaces and mediates intercellular adhesion. Other CAMs include immunoglobulin-like adhesion molecules, integrins and selectins [20] and these regulate neuronal migration and synaptogenesis, and affect glial-axonal networks [20]. Classical cadherins are ubiquitously expressed throughout the brain [21] and while they have not been thoroughly examined in the context of neurodegeneration, there is emerging evidence implicating type 1 classical cadherins in MSA [8], Parkinson’s disease [18, 22], Alzheimer’s disease [16, 17], Huntington’s disease [13, 23], and aging [11, 12]. Much research has been focused on CDH2, a close homolog of CDH4. CDH2 accumulates at axons in response to increased neuronal activity, promoting myelin formation via cAMP [24]. Blocking this cadherin results in diminished contact between the axon and oligodendrocyte precursor cells [25]. Whilst CDH4 has not been demonstrated to act in this capacity, it has been shown to co-express with CDH2 at synapses [26], and the two work in concert in the migration of radial neocortical neurons [27]. As such, the upregulation of CDH4 expression in MSA brain observed in our study could be related to combating or redressing neurodegeneration.
Like α-synuclein, cadherins are expressed at the synapse, promoting contact and plasticity [26, 28]. When the level of CDH2 was reduced, via catenin ablation, the synaptic plasticity and motor function were impaired [29]. The co-localisation of α-synuclein and cadherins and their mutual role suggest that they could be interacting with each other, although there is no experimental evidence to support this. Nonetheless, we showed that there is a strong correlation between CDH4 expression and α-synuclein levels in the motor cortex white matter, and that CDH4 expression affects the cellular level of α-synuclein in vitro. Current literature examining the broader dynamics between cell adhesion and α-synuclein suggest a putative bidirectional relationship, consistent with our findings. In one study, increased expression of α-synuclein in rat neurons resulted in diminished cell adhesion and neurite outgrowth [30]. In another study, reduction in cell adhesion, by trypsinization, promoted α-synuclein aggregation [31, 32].
Another aspect of cadherin function that needs to be considered is the involvement of catenins. Catenins form a complex with cadherins that anchor to the actin cytoskeleton [33]. In addition to their structural role, catenins participate in cell signalling pathways, involving Rho-GTPases, that modulate α-synuclein levels. For example, in one study, increases in catenin levels inhibited RhoA activity and reduced α-synuclein levels in dopaminergic cells [34, 35]. Moreover, motor coordination, spatial learning and synaptic plasticity were shown to be reduced in catenin knockout mice [29]. In another example, catenins were shown to suppress autophagy by repressing p62 expression [36]; this is of interest given the role of p62 in modulating α-synuclein levels. It has been shown that in α-synuclein transgenic mice that lack p62, the number and intensity of phosphorylated inclusions were elevated [37]. Indeed, inhibition of catenin signaling in both primary cortical neurons and rat models of PD rescued axonal degeneration [38].
Although we have shone new light on the understanding of the role of CDH4 in MSA, there were limitations to our study. One limitation was the small cohort size of the two MSA subtypes. Future work with larger sample sizes needs to be carried out to tease out any differences between the two subtypes. In summary, we demonstrated, for the first time, that CDH4 expression is altered in MSA brain and is linked to the cellular levels of α-synuclein. These results provide evidence that support the genetic association of CDH4 with MSA. Further research is required to understand how CDH4 could be altering α-synuclein oligomerization/aggregation, especially in respect to catenin pathways, which may lead to identifying novel disease-modifying targets for MSA.
ACKNOWLEDGMENTS
We thank Ying He, Katherine Phan and Ye Zhao for technical assistance, Hiu Chuen Lok and Jen-Hsiang Hsiao for expert advice, and Prof Poul Jensen (University of Aarhus) for the OLN-AS7 cell line. Tissues were received from the New South Wales Brain Tissue Resource Centre at the University of Sydney and the Sydney Brain Bank at Neuroscience Research Australia, which are supported by The University of New South Wales, Neuroscience Research Australia and Schizophrenia Research Institute. We also acknowledge the facilities and the scientific and technical assistance of Microscopy Australia at the Australian Centre for Microscopy & Microanalysis at the University of Sydney.
FUNDING
This work was supported by funding from Defeat MSA Alliance (USA) (Grant #: 2021-43) to WSK. It was also supported by funding from Defeat MSA/Vaincre L’Atrophie Multisystématisée (Canada) and Defeat MSA Australia (Grant #: 2021-45) to YF. FII was supported by the University of Sydney Research Training Program scholarship.
Research reported in this publication was supported by the National Institute on Alcohol Abuse and Alcoholism of the National Institutes of Health under Award Number R28AA012725. The content is solely the responsibility of the authors and does not necessarily represent the official views of the National Institutes of Health.
CONFLICT OF INTEREST
The authors have no conflict of interest to report.
DATA AVAILABILITY
The data supporting the findings of this study are available within the article and/or its supplementary material.
REFERENCES
[1] | Fanciulli A , Stankovic I , Krismer F , Seppi K , Levin J , Wenning GK ((2019) ) Multiple system atrophy, Int Rev Neurobiol 149: , 137–192. |
[2] | Papp MI , Kahn JE , Lantos PL ((1989) ) Glial cytoplasmic inclusions in the CNS of patients with multiple system atrophy (striatonigral degeneration, olivopontocerebellar atrophy and Shy-Drager syndrome). J Neurol Sci 94: , 79–100. |
[3] | Nakazato Y , Yamazaki H , Hirato J , Ishida Y , Yamaguchi H ((1990) ) Oligodendroglial microtubular tangles in olivopontocerebellar atrophy. J Neuropathol Exp Neurol 49: , 521–530. |
[4] | Ouberai MM , Wang J , Swann MJ , Galvagnion C , Guilliams T , Dobson CM , Welland ME ((2013) ) α-synuclein senses lipid packing defects and induces lateral expansion of lipids leading to membrane remodeling. J Biol Chem 288: , 20883–20895. |
[5] | Song YJ , Lundvig DM , Huang Y , Gai WP , Blumbergs PC , Hojrup P , Otzen D , Halliday GM , Jensen PH ((2007) ) P25alpha relocalizes in oligodendroglia from myelin to cytoplasmic inclusions in multiple system atrophy. Am J Pathol 171: , 1291–1303. |
[6] | Lindersson E , Lundvig D , Petersen C , Madsen P , Nyengaard JR , Hojrup P , Moos T , Otzen D , Gai WP , Blumbergs PC , Jensen PH ((2005) ) P25alpha stimulates alpha-synuclein aggregation and is co-localized with aggregated alpha-synuclein in alpha-synucleinopathies. J Biol Chem 280: , 5703–5715. |
[7] | Kaji S , Maki T , Kinoshita H , Uemura N , Ayaki T , Kawamoto Y , Furuta T , Urushitani M , Hasegawa M , Kinoshita Y , Ono Y , Mao X , Quach TH , Iwai K , Dawson VL , Dawson TM , Takahashi R ((2018) ) Pathological endogenous alpha-synuclein accumulation in oligodendrocyte precursor cells potentially induces inclusions in multiple system atrophy. Stem Cell Reports 10: , 356–365. |
[8] | Sailer A , Scholz SW , Nalls MA , Schulte C , Federoff M , Price TR , Lees A , Ross OA , Dickson DW , Mok K , Mencacci NE , Schottlaender L , Chelban V , Ling H , O’Sullivan SS , Wood NW , Traynor BJ , Ferrucci L , Federoff HJ , Mhyre TR , Morris HR , Deuschl G , Quinn N , Widner H , Albanese A , Infante J , Bhatia KP , Poewe W , Oertel W , Höglinger GU , Wüllner U , Goldwurm S , Pellecchia MT , Ferreira J , Tolosa E , Bloem BR , Rascol O , Meissner WG , Hardy JA , Revesz T , Holton JL , Gasser T , Wenning GK , Singleton AB , Houlden H European Multiple System Atrophy Study Group and the UK Multiple System Atrophy Study Group ((2016) ) A genome-wide association study in multiple system atrophy. Neurology 87: , 1591–1598. |
[9] | Kucharczak J , Charrasse S , Comunale F , Zappulla J , Robert B , Teulon-Navarro I , Pelegrin A , Gauthier-Rouviere C ((2008) ) R-Cadherin expression inhibits myogenesis and induces myoblast transformation via Rac1 GTPase. Cancer Res 68: , 6559–6568. |
[10] | Fukata M , Kaibuchi K ((2001) ) Rho-family GTPases in cadherin-mediated cell — cell adhesion. Nat Rev Mol Cell Biol 2: , 887–897. |
[11] | Yashin AI , Wu D , Arbeev KG , Ukraintseva SV ((2012) ) Polygenic effects of common single-nucleotide polymorphisms on life span: When association meets causality. Rejuvenation Res 15: , 381–394. |
[12] | Seshadri S , Destefano AL , Au R , Massaro JM , Beiser AS , Kelly-Hayes M , Kase CS , D’Agostino RB Sr. , Decarli C , Atwood LD , Wolf PA ((2007) ) Genetic correlates of brain aging on MRI and cognitive test measures: A genome-wide association and linkage analysis in The Framingham Study, BMC Med Genet 8 Suppl 1: , S15. |
[13] | Vignone D , Gonzalez Paz O , Fini I , Cellucci A , Auciello G , Battista G , Gloaguen I , Fortuni S , Cariulo C , Khetarpal V , Dominguez C , Muñoz-Sanjuán I , Di Marco A ((2022) ) Modelling the humanblood-brain barrier in Huntington disease, Int J Mol Sci 23: , 7813. |
[14] | Yeh P-K , Liang C-S , Tsai C-L , Lin Y-K , Lin G-Y , Tsai C-K , Tsai M-C , Liu Y , Tai Y-M , Hung K-S , Yang F-C ((2022) ) Genetic variants associated with subjective cognitive decline in patients with migraine. Front Aging Neurosc 14: , 860604. |
[15] | Johnson E , Theisen CS , Johnson KR , Wheelock MJ ((2004) ) R-Cadherin influences cell motility via Rho family GTPases. J Biol Chem 279: , 31041–31049. |
[16] | Andreyeva A , Nieweg K , Horstmann K , Klapper S , Muller-Schiffmann A , Korth C , Gottmann K ((2012) ) C-terminal fragment of N-Cadherin accelerates synapse destabilization by amyloid-beta. Brain 135: , 2140–2154. |
[17] | Ando K , Uemura K , Kuzuya A , Maesako M , Asada-Utsugi M , Kubota M , Aoyagi N , Yoshioka K , Okawa K , Inoue H , Kawamata J , Shimohama S , Arai T , Takahashi R , Kinoshita A ((2011) ) N-Cadherin regulates P38 MAPK signaling via association with JNK-associated leucine zipper protein: Implications for neurodegeneration in Alzheimer disease. J Biol Chem 286: , 7619–7628. |
[18] | Rotunno MS , Lane M , Zhang W , Wolf P , Oliva P , Viel C , Wills A-M , Alcalay RN , Scherzer CR , Shihabuddin LS , Zhang K , Sardi SP ((2020) ) Cerebrospinal fluid proteomics implicates the Granin family in Parkinson’s disease. Sci Rep 10: , 2479. |
[19] | Bhatia S , Kim WS , Shepherd CE , Halliday GM ((2019) ) Apolipoprotein D upregulation in Alzheimer’s disease but not frontotemporal dementia. J Mol Neurosci 67: , 125–132. |
[20] | Togashi H , Sakisaka T , Takai Y ((2009) ) Cell adhesion molecules in the central nervous system. Cell Adh Migr 3: , 29–35. |
[21] | Basu R , Taylor MR , Williams ME ((2015) ) The classic cadherins in synaptic specificity. Cell Adh Migr 9: , 193–201. |
[22] | Cataldi S , Codini M , Hunot S , Legeron FP , Ferri I , Siccu P , Sidoni A , Ambesi-Impiombato FS , Beccari T , Curcio F , Albi E ((2016) ) E-Cadherin in 1-Methyl-4-Phenyl-1,2,3,6-Tetrahydropyridine-induced Parkinson disease. Mediators Inflamm 2016: , 3937057. |
[23] | László ZI , Lele Z ((2022) ) Flying under the radar: CDH2(N-Cadherin), an important hub molecule in neurodevelopmental andneurodegenerative diseases. Front Neurosci 16: , 972059. |
[24] | Chen M , Xu Y , Huang R , Huang Y , Ge S , Hu B ((2017) ) N-Cadherin is involved in neuronal activity-dependent regulation of myelinating capacity of zebrafish individual oligodendrocytes. }, Mol Neurobiol 54: , 6917–6930. |
[25] | Schnadelbach O , Ozen I , Blaschuk OW , Meyer RL , Fawcett JW ((2001) ) N-Cadherin is involved in axon-oligodendrocyte contact and myelination. Mol Cell Neurosci 17: , 1084–1093. |
[26] | Shan WS , Tanaka H , Phillips GR , Arndt K , Yoshida M , Colman DR , Shapiro L ((2000) ) Functional cis-heterodimers of N- and R-cadherins. J Cell Biol 148: , 579–590. |
[27] | Martinez-Garay I , Gil-Sanz C , Franco SJ , Espinosa A , Molnár Z , Mueller U ((2016) ) Cadherin 2/4 signaling via PTP1B and catenins iscrucial for nucleokinesis during radial neuronal migration in theneocortex. Development 143: , 2121–2134. |
[28] | Martinez-Valbuena I , Visanji NP , Kim A , Lau HHC , So RWL , Alshimemeri S , Gao A , Seidman MA , Luquin MR , Watts JC , Lang AE , Kovacs GG ((2022) ) Alpha-synuclein seeding shows a wide heterogeneity in multiple system atrophy. Transl Neurodegener 11: , 7. |
[29] | Israely I , Costa RM , Xie CW , Silva AJ , Kosik KS , Liu X ((2004) ) Deletion of the neuron-specific protein delta-catenin leads to severe cognitive and synaptic dysfunction. Curr Biol 14: , 1657–1663. |
[30] | Takenouchi T , Hashimoto M , Hsu LJ , Mackowski B , Rockenstein E , Mallory M , Masliah E ((2001) ) Reduced neuritic outgrowth and cell adhesion in neuronal cells transfected with human alpha-synuclein. Mol Cell Neurosci 17: , 141–150. |
[31] | Wersinger C , Vernier P , Sidhu A ((2004) ) Trypsin disrupts the trafficking of the human dopamine transporter by α-synuclein and its A30P mutant. Biochemistry 43: , 1242–1253. |
[32] | Sidhu A , Wersinger C , Vernier P ((2004) ) α-synuclein regulation of the dopaminergic transporter: A possible role in the pathogenesis of Parkinson’s disease. FEBS Lett 565: , 1–5. |
[33] | Tsukita S , Tsukita S , Nagafuchi A , Yonemura S ((1992) ) Molecular linkage between cadherins and actin filaments in cell— cell adherens junctions. Curr Opin Cell Biol 4: , 834–839. |
[34] | Anastasiadis PZ , Moon SY , Thoreson MA , Mariner DJ , Crawford HC , Zheng Y , Reynolds AB ((2000) ) Inhibition of RhoA by p120 catenin. Nat Cell Biol 2: , 637–644. |
[35] | Zhou Z , Kim J , Insolera R , Peng X , Fink DJ , Mata M ((2011) ) Rho GTPase regulation of α-synuclein and VMAT2: Implications for pathogenesis of Parkinson’s disease. Mol Cell Neurosci 48: , 29–37. |
[36] | Petherick KJ , Williams AC , Lane JD , Ordóñez-Morán P , Huelsken J , Collard TJ , Smartt HJ , Batson J , Malik K , Paraskeva C , Greenhough A ((2013) ) Autolysosomal β-catenin degradationregulates Wnt-autophagy-p62 crosstalk. EMBO J 32: , 1903–1916. |
[37] | Tanji K , Odagiri S , Miki Y , Maruyama A , Nikaido Y , Mimura J , Mori F , Warabi E , Yanagawa T , Ueno S , Itoh K , Wakabayashi K ((2015) ) P62 deficiency enhances α-synuclein pathology in mice. Brain Pathol 25: , 552–564. |
[38] | Huang Y-L , Zhang J-N , Hou T-Z , Gu L , Yang H-M , Zhang H ((2022) ) Inhibition of Wnt/β-catenin signaling attenuates axonal degeneration in models of Parkinson’s disease. Neurochem Int 159: , 105389. |

