
Time-of-Day and Day-of-Week Effects on TV and OTT Media Choices: Evidence from South Korea


1
Communication Design, College of Design, Hanyang University, Ansan 15588, Republic of Korea
2
School of Convergence, College of Computing and Informatics, Sungkyunkwan University, Seoul 03063, Republic of Korea
*
Author to whom correspondence should be addressed.
J. Theor. Appl. Electron. Commer. Res. 2024, 19(1), 1-19; https://doi.org/10.3390/jtaer19010001
Submission received: 24 October 2023
/
Revised: 19 December 2023
/
Accepted: 20 December 2023
/
Published: 25 December 2023
Abstract
:The objective of this manuscript is to investigate the determinants influencing the selection of over-the-top (OTT) platforms as opposed to traditional television mediums—cable, Internet protocol television (IPTV), and satellite broadcasting—for the consumption of content such as television shows and films. Employing data extracted from the 2020 Media Panel comprising 423,851 observations garnered from personal media diaries, this study scrutinizes the impacts of individual attributes, environmental conditions, and temporal factors on platform choice. The findings reveal a temporal influence characterized by a “Friday effect” and a heightened preference for OTT platforms during early afternoon (12:00–16:00) and late-night hours (00:00–04:00). Notably, the likelihood of selecting OTT platforms is significantly augmented during the late-night period in comparison to other time frames. In relation to individual characteristics, variables such as male gender, younger age, higher educational attainment, and elevated income levels were positively correlated with a predilection for OTT platforms. Additionally, environmental variables such as possession of an unlimited data plan and ownership of a tablet personal computer also emerged as significant predictors for OTT preference. Furthermore, the presence of a beam projector during late-night hours and residing in a household with multiple occupants during afternoon hours also served as contributing factors for OTT utilization. In conclusion, the study offers critical insights for stakeholders in both traditional television and burgeoning OTT markets, providing data-driven recommendations for the strategic allocation of resources in consideration of day-of-week and time-of-day variables.
1. Introduction
Over-the-top (OTT) services, defined as platforms that disseminate television and cinematic content via the Internet, have gained traction as influential vectors for media consumption [1]. Initially, the concept of OTT was primarily confined to information technology circles; however, its ubiquity expanded considerably following the advent of Netflix. While digital content streaming technologies have been extant since the 1990s, the exponential growth of the Internet has catalyzed profound transformations in traditional media landscapes, thereby altering consumer behavior [2]. The late 2000s witnessed an acceleration in OTT adoption, fueled by advancements in mobile technology and smart devices. Despite this proliferation, content offered via streaming platforms during the early 2010s primarily served to complement traditional broadcasting by facilitating “catch-up” viewing. This paradigm experienced a shift as original content, produced by market leaders such as Netflix and YouTube, gained widespread popularity.
In the realm of traditional television, three primary methods for accessing pay-per-view programming exist: subscriptions to local cable companies, satellite broadcasting, or Internet protocol television (IPTV). Conversely, OTT platforms offer the convenience of accessing a diverse array of content through wired or wireless Internet connections, either through a subscription model or ad-supported formats. Unlike traditional television, which necessitates adherence to predetermined broadcasting schedules and limits viewers to specific devices, OTT platforms afford users the flexibility to consume content on demand across multiple devices [3].
Within the media industry, an array of stakeholders—ranging from traditional broadcasters and telecommunications entities to portal services—are diversifying their portfolios to include OTT services. A pivotal research question emerges from this scenario: do traditional pay TV and OTT platforms operate in a competitive or complementary relationship? This question bears considerable regulatory implications, especially in markets such as Korea where the entry of global OTT services has disrupted traditional broadcasting ecosystems and instigated debates on service substitutability.
Existing scholarship offers divergent viewpoints on this relationship. While some studies postulate a complementary dynamic between traditional pay TV and OTT platforms [4,5,6,7], others explore metrics such as revenue, industry concentration, subscriber numbers, and overall time spent to examine the substitutability between these media forms. Notably, extant literature lacks comprehensive analyses that incorporate lifestyle-based media consumption patterns into the discussion.
Hence, this study aims to advance the discourse on media substitutability and complementarity by explicating the nuances that differentiate these platforms. It seeks to delineate how consumer choices fluctuate based on temporal factors such as time of day and day of the week, as well as environmental considerations. The objective is to scrutinize the impact of these variables on OTT platform selection and offer actionable insights that can guide media companies in optimizing their OTT strategies.
2. Literature Review
Traditional pay television (pay TV) and over-the-top (OTT) services are hypothesized to operate in a complementary fashion, as they offer divergent types of video content catering to distinct consumer requirements. For instance, pay TV tends to excel in offering diverse content options, whereas OTT platforms specialize in delivering high-quality material [8].
Existing literature has often reported the infrequency or complete absence of pay TV subscription cancellations in favor of OTT services. Udoakpan and Tengeh [7] posited that a majority of the South African demographic surveyed retained their pay TV subscriptions even after adopting OTT platforms such as Showmax, particularly when these services were bundled with other offerings like DStv for premium subscribers. This empirical evidence indicates a more complementary than substitutional relationship between OTT and pay TV services. Kim et al. [9] employed niche theory to elucidate the competitive dynamics in the Korean video platform market, examining key metrics like consumer satisfaction and time spent on media to address the limitations of prior research. Their findings revealed a market landscape markedly different from that of the United States, characterized by minimal competitive friction between pay TV and OTT services.
Additionally, Park and Kwon [5] scrutinized the influence of OTT service revenue on the market concentration of pay TV and the volume of its subscriptions. Their results failed to establish a statistically significant impact of OTT revenue on either the market concentration or subscriber count for pay TV. However, the proliferation of broadband Internet was observed to exert a positive influence on mergers and acquisitions in the pay TV sector, while concurrently driving a decline in cord-cutting behaviors. Importantly, although their study did not identify a direct substitutional relationship between OTT and pay TV services, it did validate the concept of indirect substitutability via Internet subscriptions.
Contrary to conventional methodologies that examine substitutability through price elasticity, determining substitutability based on price and demand remains infeasible within this context. The primary obstacle lies in the inherent nature of media consumption, which is distinct from product ownership and varies across diverse business models, such as subscriptions, advertising, and mixed models. As such, extant research typically explores substitution relationships through alternative lenses, including revenue streams, industry concentration, subscriber counts, and household Internet traffic.
Malone et al. [10] presented empirical evidence underlining a substitution relationship, citing a 22% surge in Internet usage corresponding with OTT adoption in households that discontinued pay TV subscriptions. This is supported by a correlated increase in OTT subscriptions among households that reduced their pay TV commitments. Jung and Melguizo [4] corroborated these findings, albeit partially, documenting evidence of ‘gross substitution’ between these audiovisual platforms during the period from 2015 to 2020. These phenomena—often referred to as cord-cutting or cord-saving—have been accelerated by the proliferation of high-speed Internet and competitively priced OTT offerings.
da Silva and de Andrade Lima [11] conducted a comprehensive analysis of Netflix’s entry into the Brazilian market and its ensuing impact on the local cable TV industry. Their study revealed that a single standard deviation increase in Netflix’s popularity correlated with a 3.62% decrease in cable TV subscriber density and a significant 19.69% reduction in the number of smaller cable TV operators. Similarly, Chen [3] examined niche market overlap and concluded that OTT platforms and pay TV share a considerable degree of similarity in aspects like entertainment value and ease of use. However, OTT platforms were found to supersede pay TV across multiple user experience metrics, including frequency of use, program preferences, and demographic appeal.
Subsequent research pivoted towards a focus on ‘displacement’, or the potential for new media to cannibalize time spent on existing media platforms. Studies operating under the principle of relative constancy or the zero-sum theory, such as Fudurić et al. [12], employed user time allocation as a metric to gauge substitutability. Kim [13] identified a substantial correlation, noting a 12.4% reduction in traditional home TV viewership for every 1% increase in time spent on mobile OTT services.
However, it is essential to note that existing studies relying solely on variables like revenue, market concentration, or consumer time allocation yield inconclusive results. Moreover, utilizing time spent as an independent variable may be misleading, as media consumption habits can vary based on factors such as time of day, day of the week, and location. Therefore, the current study aims to reframe media competition as a series of choices made by consumers, influenced not just by personal characteristics like age, education, and gender, but also by temporal and environmental factors.
In scrutinizing the complex interplay between pay TV and OTT services, our study adopts a more nuanced approach. Instead of relying solely on overall time allocation or market concentration metrics, we consider a choice model that accounts for specific moments when consumers decide between OTT and pay TV. This model accounts for various times of the day and different days of the week, thereby moving beyond the limitations inherent in summing total media usage time.
To further refine our understanding, we also include various socio-demographic variables such as age, education level, and gender, along with other environmental factors like household composition and device ownership. This approach allows us to explore not only the inherent substitutability between these two types of media, but also the potential for complementarity in different usage contexts. For instance, if the temporal patterns of pay TV and OTT usage differ significantly, then fluctuations in total time spent on each medium may not necessarily indicate competitive displacement but rather suggest that these platforms complement each other by catering to different viewing needs at different times.
In essence, our study challenges the traditional notion of media competition as a “zero-sum game”, as postulated by Dimmick [14], where attention to one form of media necessarily cannibalizes another. Instead, we posit that the dynamics of substitutability and complementarity are more intricate, and are shaped by a myriad of factors including the timing, setting, and individual consumer characteristics. By adopting this multi-faceted approach, we aim to provide a more comprehensive understanding of how pay TV and OTT services interact in the modern media landscape, thereby contributing to a more informed discussion among stakeholders in the industry.
3. Method
3.1. Variables for Assessing Current Preferences in Hourly TV and OTT Consumption
The dataset utilized in this research is sourced from the Media Panel 2020 survey, which was conducted by the Korea Information and Communications Policy Institute (KISDI), and encompasses 10,079 respondents. The survey employs a media diary that documents respondent media usage within 24-h spans over a three-day period. These diaries capture details at 15-min intervals regarding the type of media consumed (behavior), the location of consumption (place), and the medium through which it was accessed (connection). This methodology affords us the opportunity to distinguish whether respondents are opting for traditional television mediums—such as terrestrial, cable TV, IPTV, satellite broadcasting, and DMB—or OTT platforms for their content consumption. In total, this results in 2,902,752 observational data points, recorded in 15-min increments, from a sample of 10,079 respondents.
OTT services, as delineated by the Korea Media Panel Survey, comprise platforms that deliver a variety of media content—including dramas and movies—over the Internet. These services are operated by a diverse array of providers, ranging from traditional telecommunications and broadcasting companies to independent platform operators. To quantify the time spent by media consumers on both traditional TV and OTT platforms, we leveraged both media behavior variables and linkage variables extracted from the Media Diary.
Media behavior variables bifurcate into ‘primary activity’ and ‘secondary activity’. Primary activity is operationalized as time spent watching TV shows (either live or VOD) and films via traditional television mediums, as outlined in Table 1. Conversely, OTT viewing time is defined as time allocated to watching TV shows (exclusively in VOD format), movies, videos, and personal broadcasts through OTT connections. In order to capture daily variations in OTT consumption, special days were omitted from the three-day diary data. However, both weekdays and weekends were included in the analysis to examine the potential influence of the day-of-the-week.
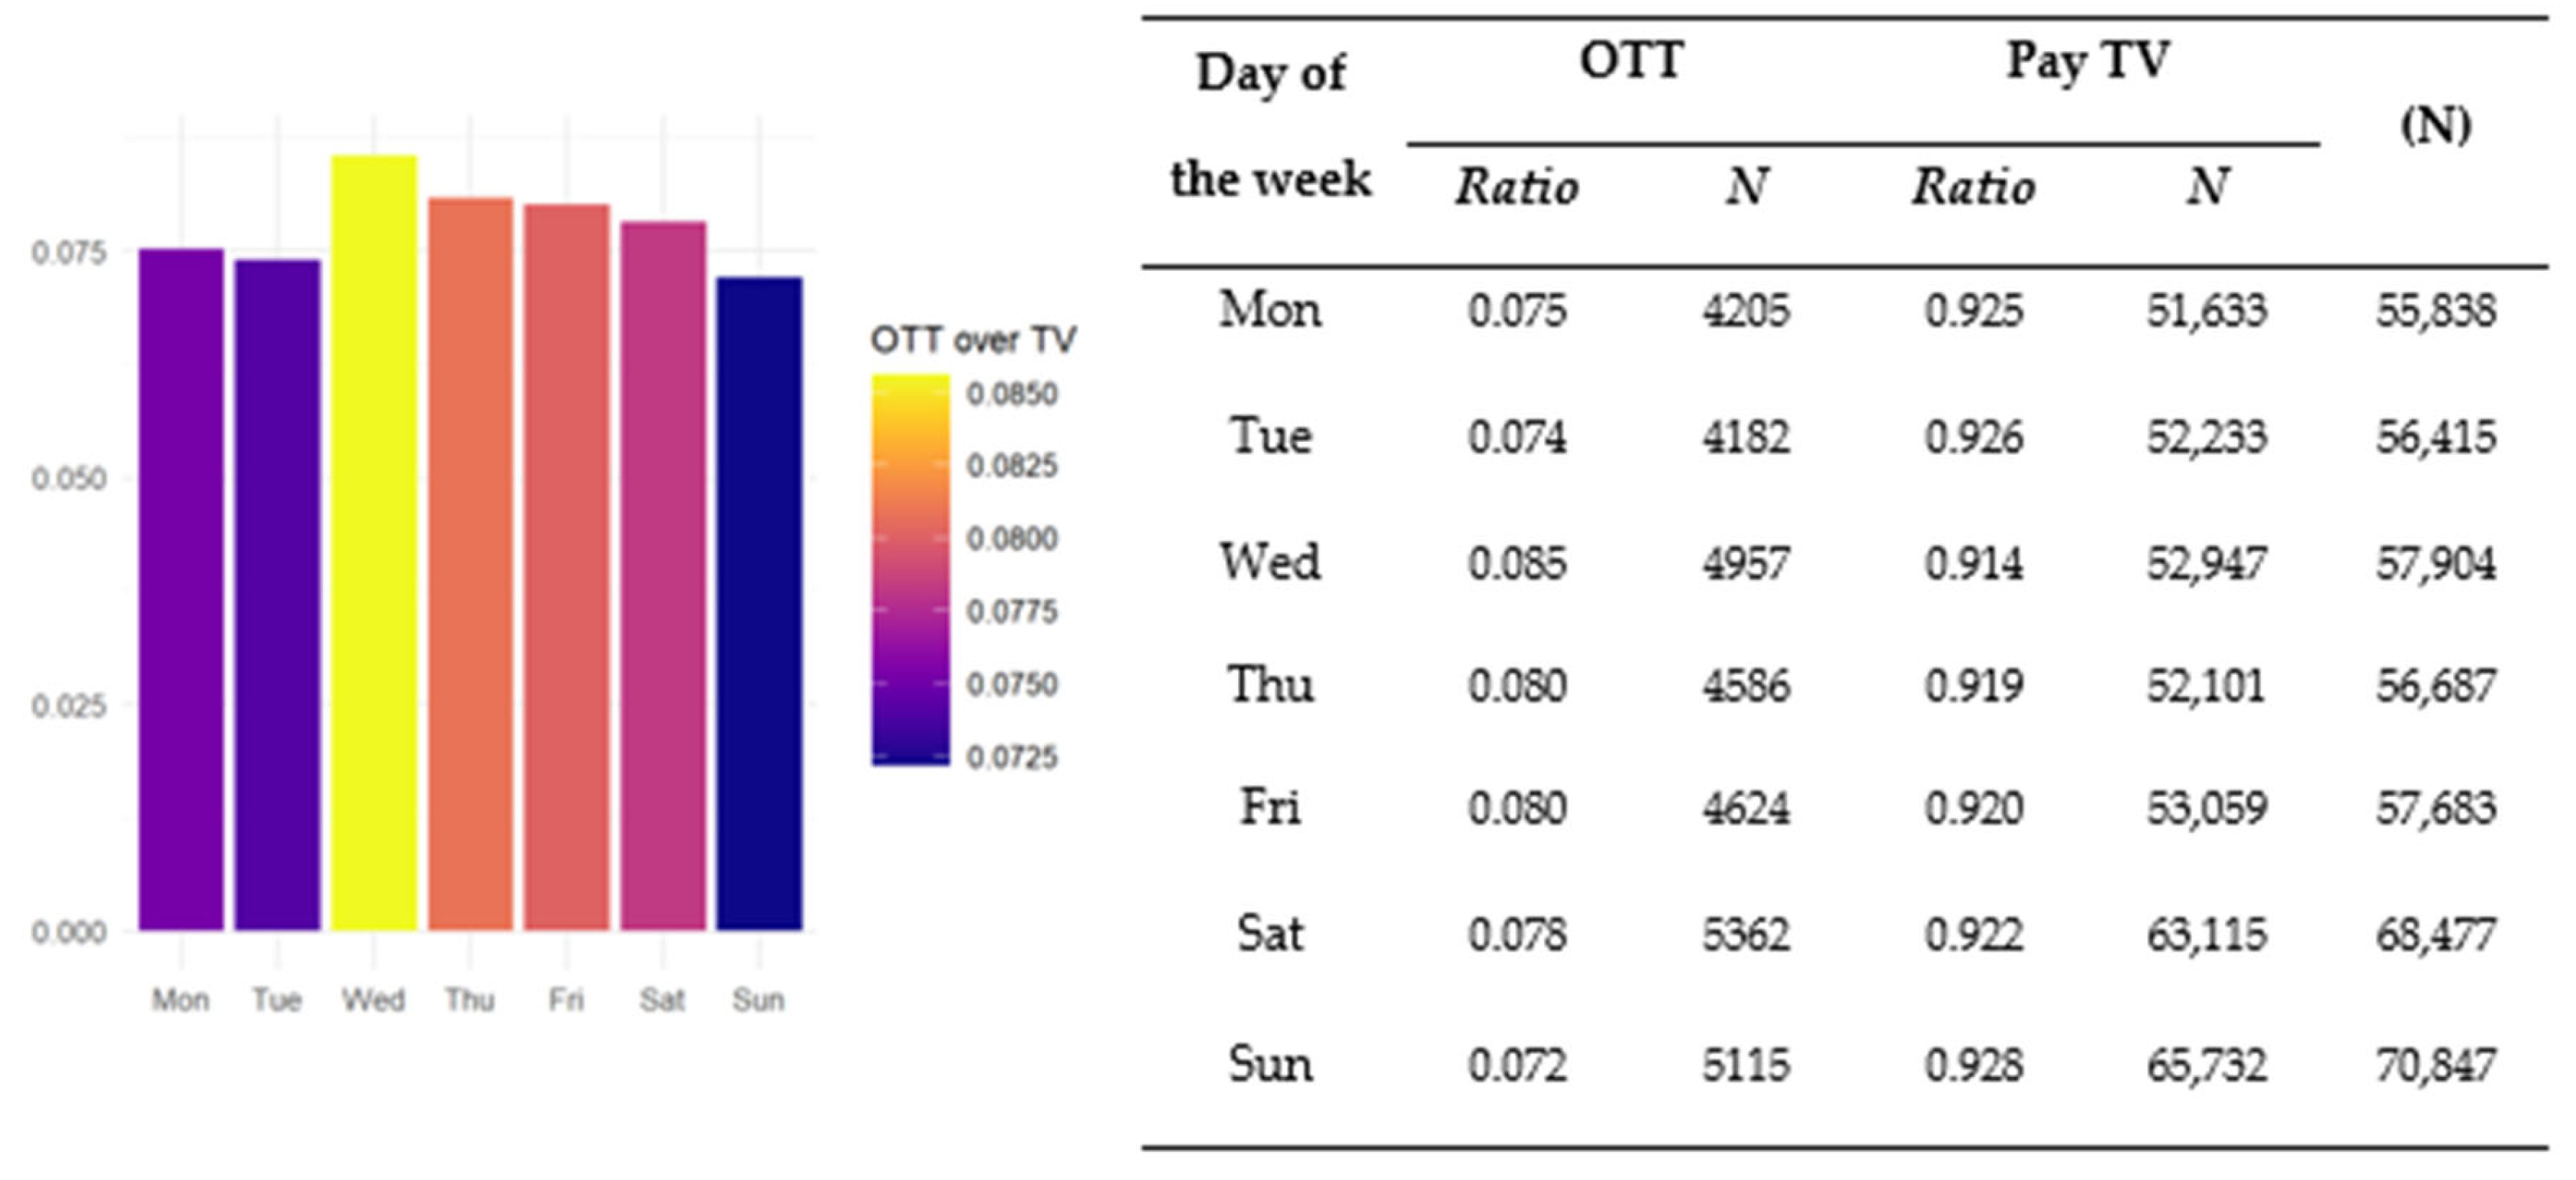
In the 2020 Media Panel dataset, the final set of observations totaled 2,902,752, which was narrowed down to 423,851 after removing special days and activities unrelated to pay TV or OTT content consumption. Figure 1 details the distribution of observations selecting pay TV and OTT options by day of the week. While the number of observations was fairly uniform across different days, a slight uptick was observed on Saturdays and Sundays—commonly regarded as peak viewing times. Remarkably, pay TV was the overwhelmingly popular choice for viewers across all days, capturing over 90% of the audience, whereas OTT services only attracted 7–9% of viewers. The highest percentage for OTT usage occurred on Wednesdays, although the difference between days was not statistically significant.
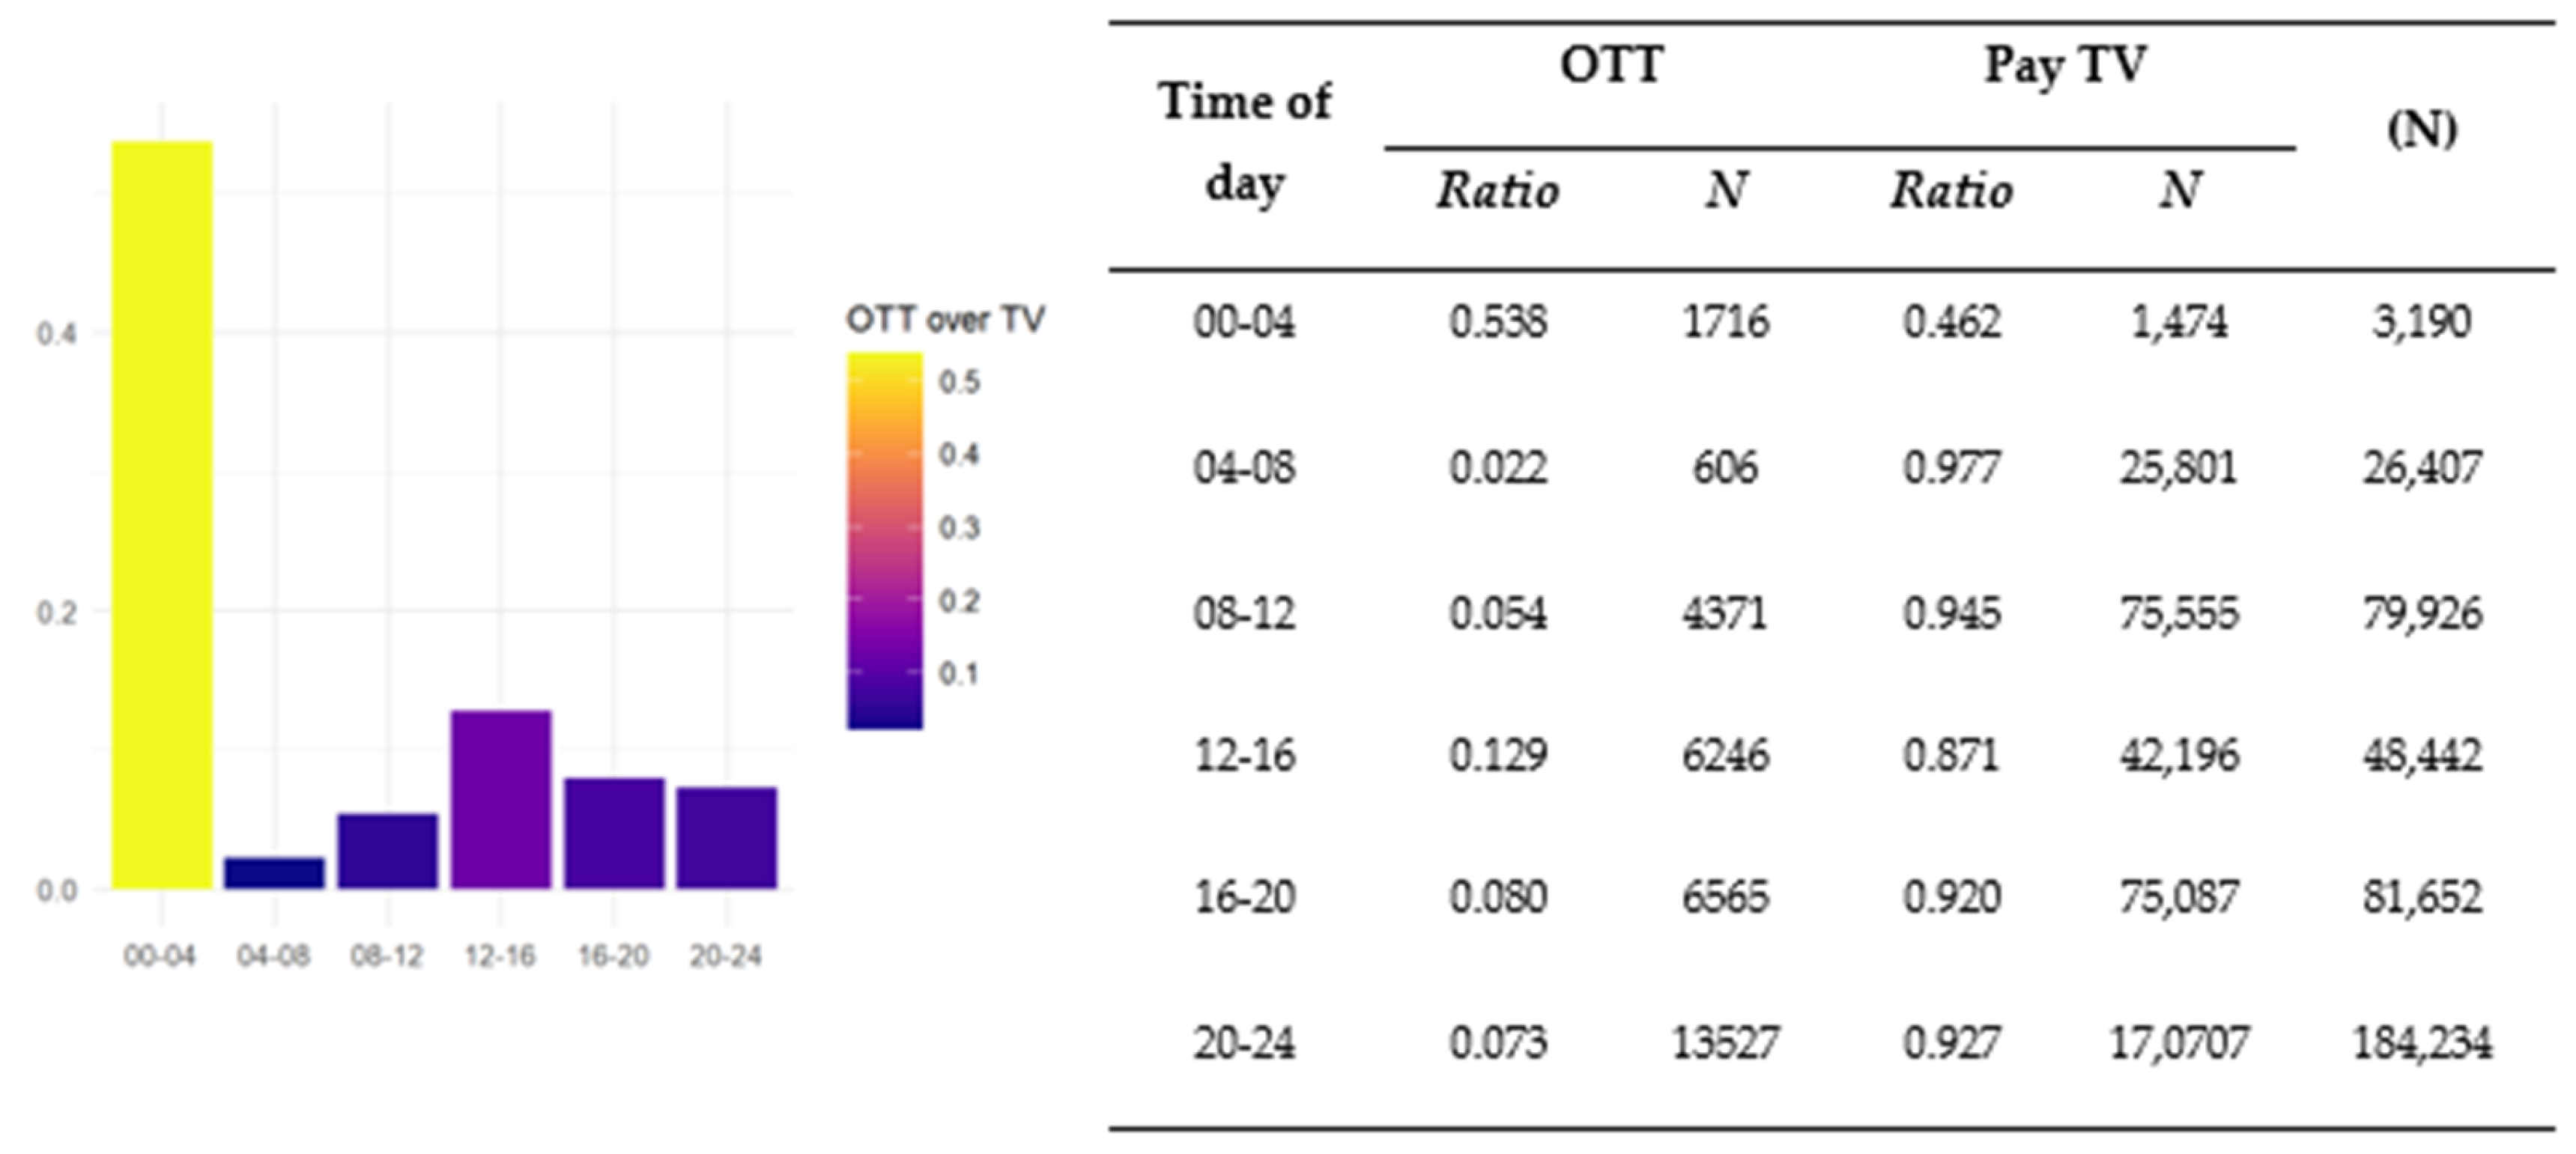
Figure 2 illustrates the distribution of observations based on the time of day. The 20:00–24:00 time slot saw the highest level of activity, with 184,234 observations, aligning with typical prime-time viewing hours. Conversely, the 00:00–04:00 slot had the fewest observations (N = 3190), which is understandable given that most people are asleep during these hours. Despite the dominance of traditional pay TV—accounting for 80–90% of all observations—the early morning time slot of 00:00–04:00 showed a reversal in trends, with 53.8% choosing OTT over pay TV.
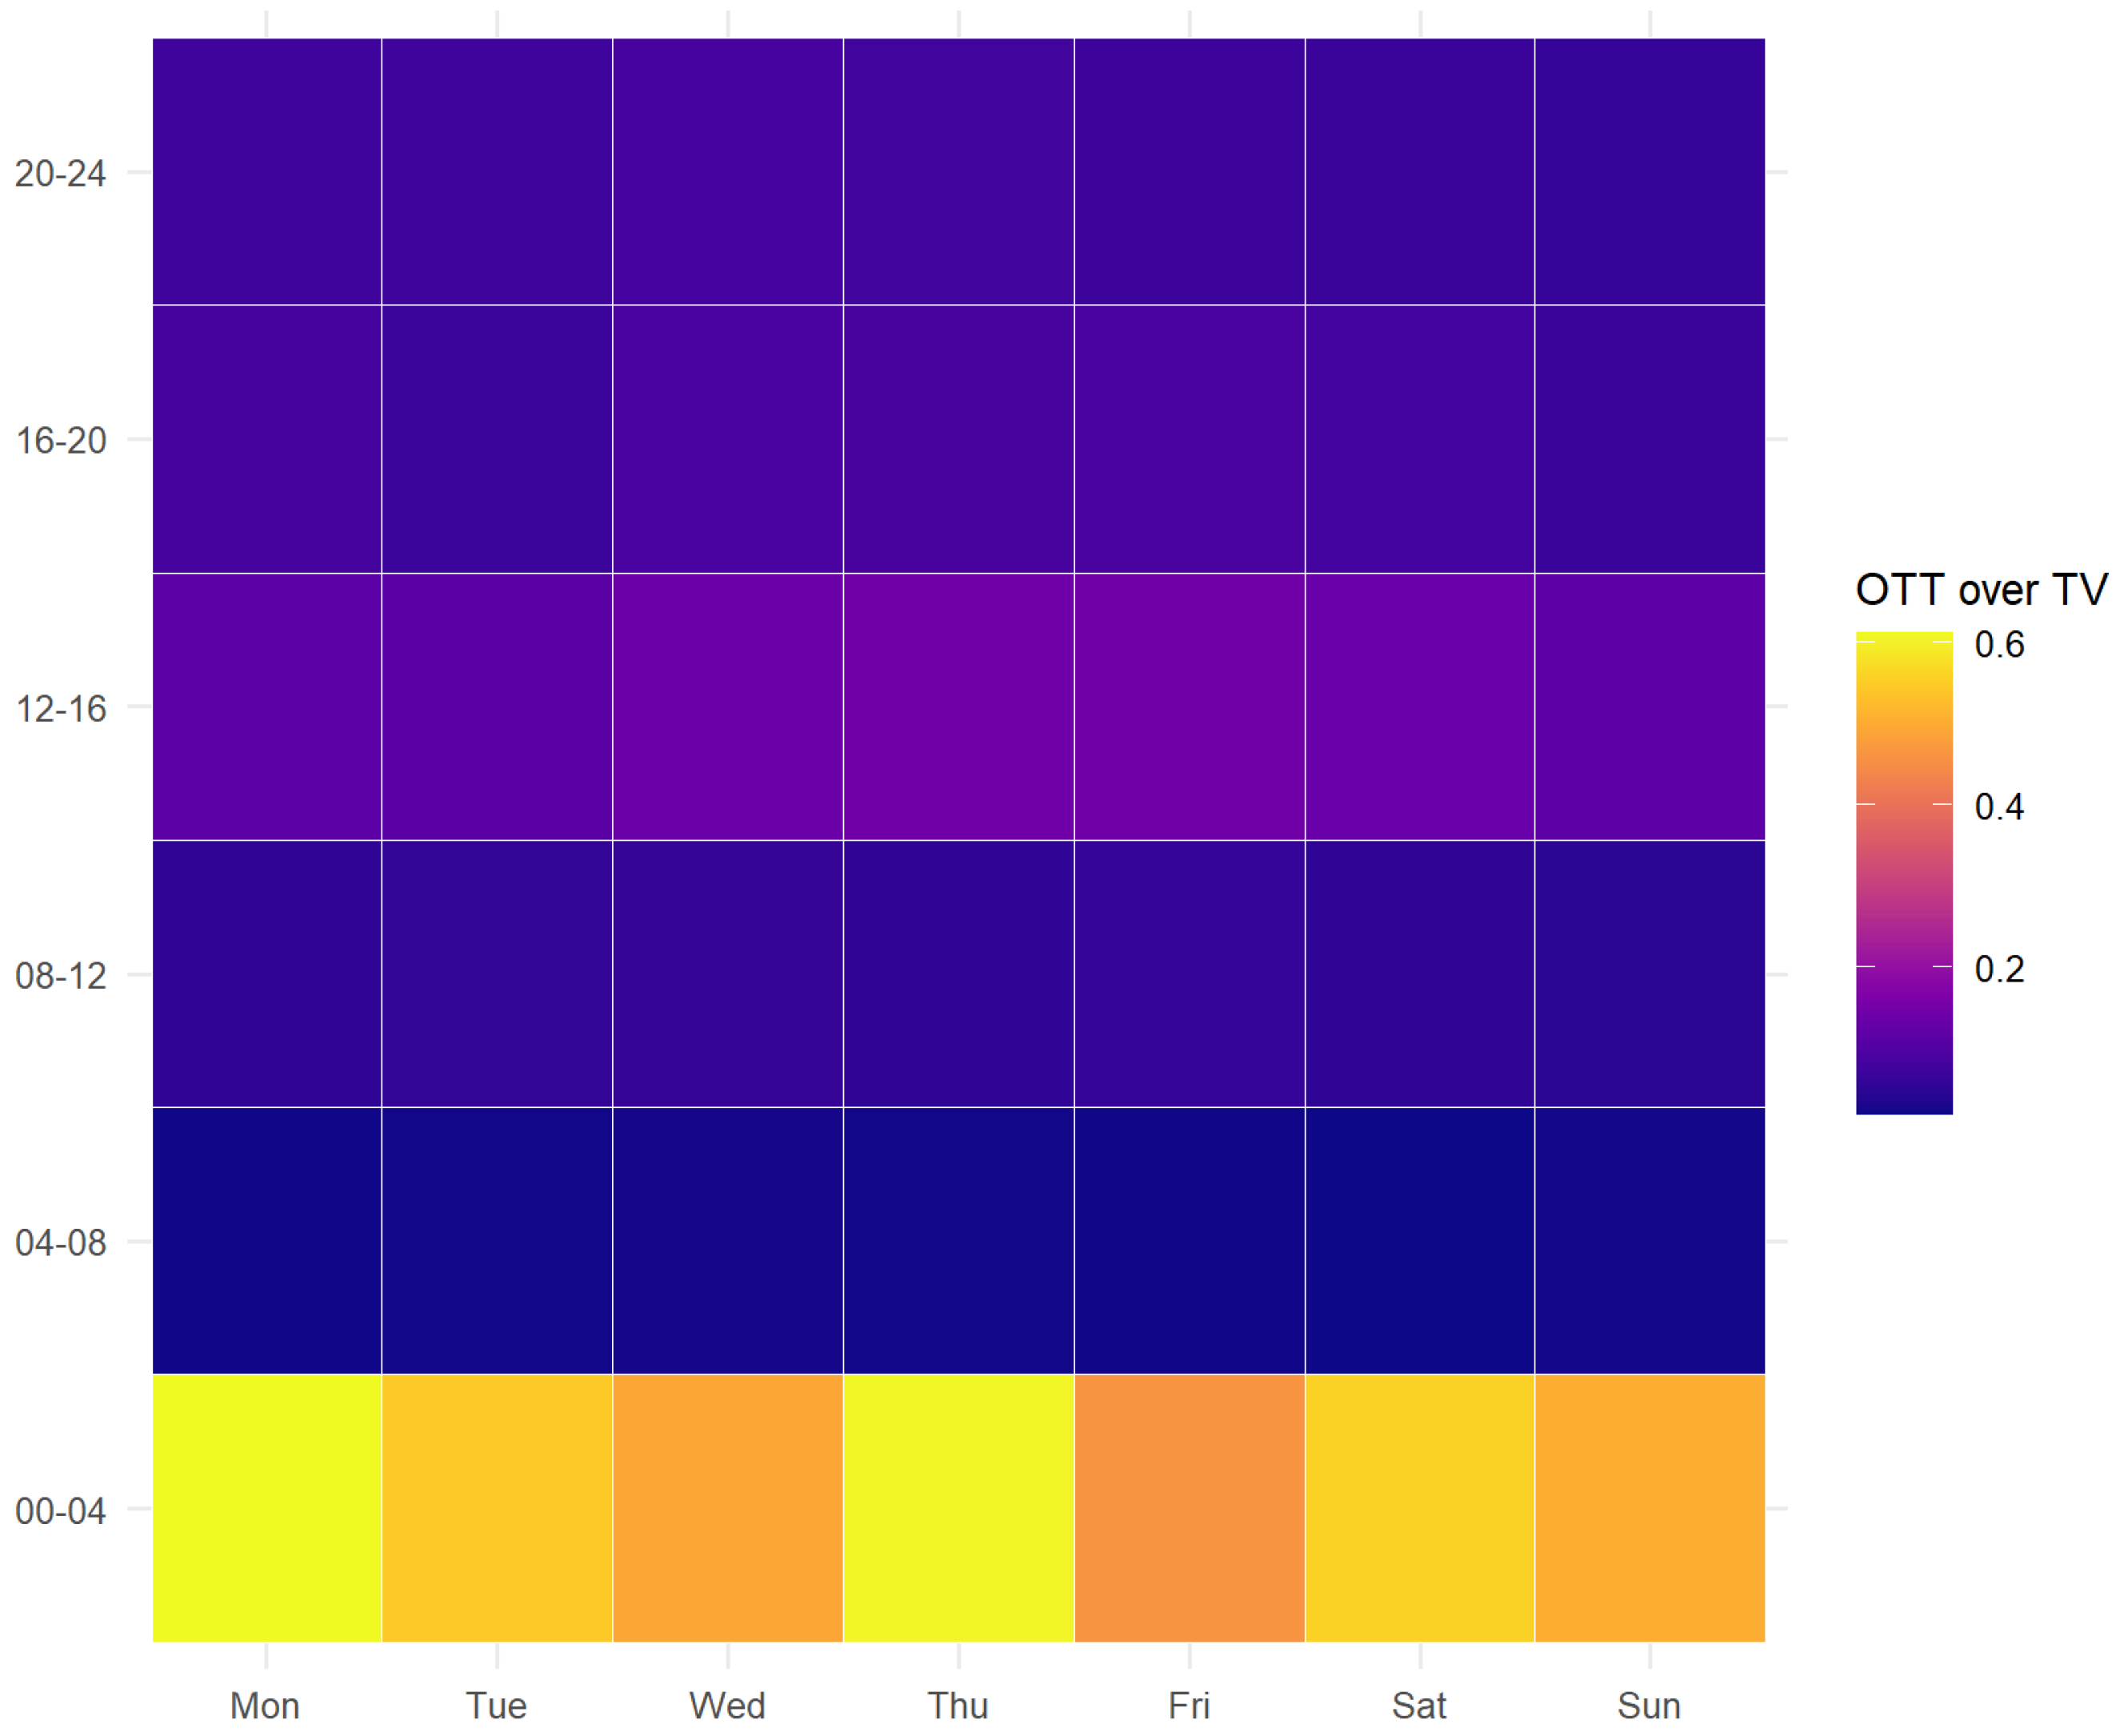
Figure 3 provides a visual comparison of pay TV vs. OTT choices by both time of day and day of the week. The influence of time of day was more prominent than that of day-of the week in determining OTT usage. The preference for OTT was notably higher during the 12:00–16:00 and 00:00–04:00 time slots. Intriguingly, a common “Thursday effect” was observed in both time slots. The statistical relevance of this observation requires further analysis through modeling techniques. While it was anticipated that a day-of-the-week effect might surface due to binge-watching behaviors on Fridays and Saturdays, the data actually revealed a higher likelihood of OTT selection during late-night hours on Mondays and Thursdays.
3.2. Media User’s Choice Model When Watching Content: Traditional TV Connection vs. OTT
A discrete choice model was utilized to analyze the current preference data collected through discrete choice for pay TV and OTT viewing. The discrete choice model is based on the utility maximization assumption that respondents choose the alternative that brings them the highest utility. According to this random utility model, the indirect utility () that a respondent of n (n = 1, …, N) receives from an alternative of j (j = 1, 2) within an alternative set of t (t = 1:OTT, 2:TV) is divided into a researcher-observable deterministic utility () and an unobservable stochastic utility () [15].
Deterministic utility is defined as a function of observable personal attributes (, k = 1, …, K) and environmental attributes (), expressed as a linear combination of the coefficients of the attributes (). Since the alternatives in this study are limited to pay TV and OTT, we utilized the logit model, which is the simplest form of the discrete choice model. The logit model assumes that the error terms of the stochastic utility are independent and follow the same i.i.d. type I extreme value distribution. Under these assumptions, the probability that a respondent chooses OTT over a traditional pay TV broadcast connection and an OTT connection can be derived as Equation (2):
In this case, Pr(Yn = OTT) indicates that a respondent of n chose an OTT connection rather than a pay TV connection to watch content at that time. denotes the joint probability density function for the stochastic utility, and I() denotes an index function that equals 1 if true. In this study, the empirical model of consumer utility for choosing an OTT service can be represented by the following Equation (3):
represents the personal characteristics of media users who chose OTT over pay TV connections, including age, gender, and education. Day.Eff and Time.Eff are dummy variables for the day of the week and time of day when the OTT choice was made. RE controls for unobserved individual characteristics with individual random effects to account for multiple choices by the same individual at different times of the day. Additional variables in the extended model include environmental effects on household composition and device effects on media device ownership. We did not include an alternative constant for the no-choice alternative because we excluded observations of media users making choices other than watching content, such as sleeping or working, from the sample.
4. Results
4.1. Day-of-the-Week Effect
Table 2 presents the results of a probit model examining the day-of-the-week effect as one of the environmental factors influencing the choice of OTT services. The final sample size for the analysis is 423,851 (N = 423,851), presented in the seventh column labeled “Total”. The coefficients are expressed as odds ratios (OR) for easier interpretation. ORs greater than 1 and statistically significant are colored red, while ORs less than 1 and statistically significant are colored blue.
We observed a significant “Friday effect” in the model that considers all times (“Total”). Compared to Mondays, consumers were 16.7% more likely to opt for OTT over pay TV on Fridays (OR = 1.167, p < 0.001). Conversely, on Sundays, they were 17.7% less likely to do so (OR = 0.823, p < 0.001).
In a time-of-day stratified analysis, we noted several day-of-the-week effects, particularly in the early afternoon (12:00–16:00) and late-night (00:00–04:00) time slots. For example, during the early afternoon, the odds of choosing OTT were higher on Tuesday (OR = 1.885, p < 0.001), Wednesday (OR = 2.083, p < 0.001), and Thursday (OR = 1.914, p < 0.001) compared to Monday. During these time frames, pay TV was the preferred medium on Saturdays and Sundays. Additionally, OTT was more popular during the late-night hours on Tuesday, Wednesday, and Sunday, with ORs exceeding 2 on each of these days.
4.2. Time-of-Day Effect
Table 3 elaborates on the results of the probit model, focusing on the time-of-day effect among the environmental factors that influence the choice of OTT. Similar to Table 1, the final sample size (N = 423,851) is displayed in the seventh column (“Total”). The largest and second largest ORs for each model are highlighted in red. The majority of these ORs are statistically significant and greater than the baseline, especially as the time slot of 04:00–08:00 has the least content viewership.
Upon analyzing the data, we discovered a late-night (00:00–04:00) and early afternoon (12:00–16:00) effect across all models, both overall and those stratified by day-of-the-week. Specifically, the OR coefficients for late-night viewership were substantially high, suggesting a consistent preference for late-night OTT viewing across all days, with heightened preferences on Thursdays (OR = 418.0, p < 0.001), Tuesdays (OR = 127.5, p < 0.001), and Fridays (OR = 69.64, p < 0.001).
4.3. Personal Effect
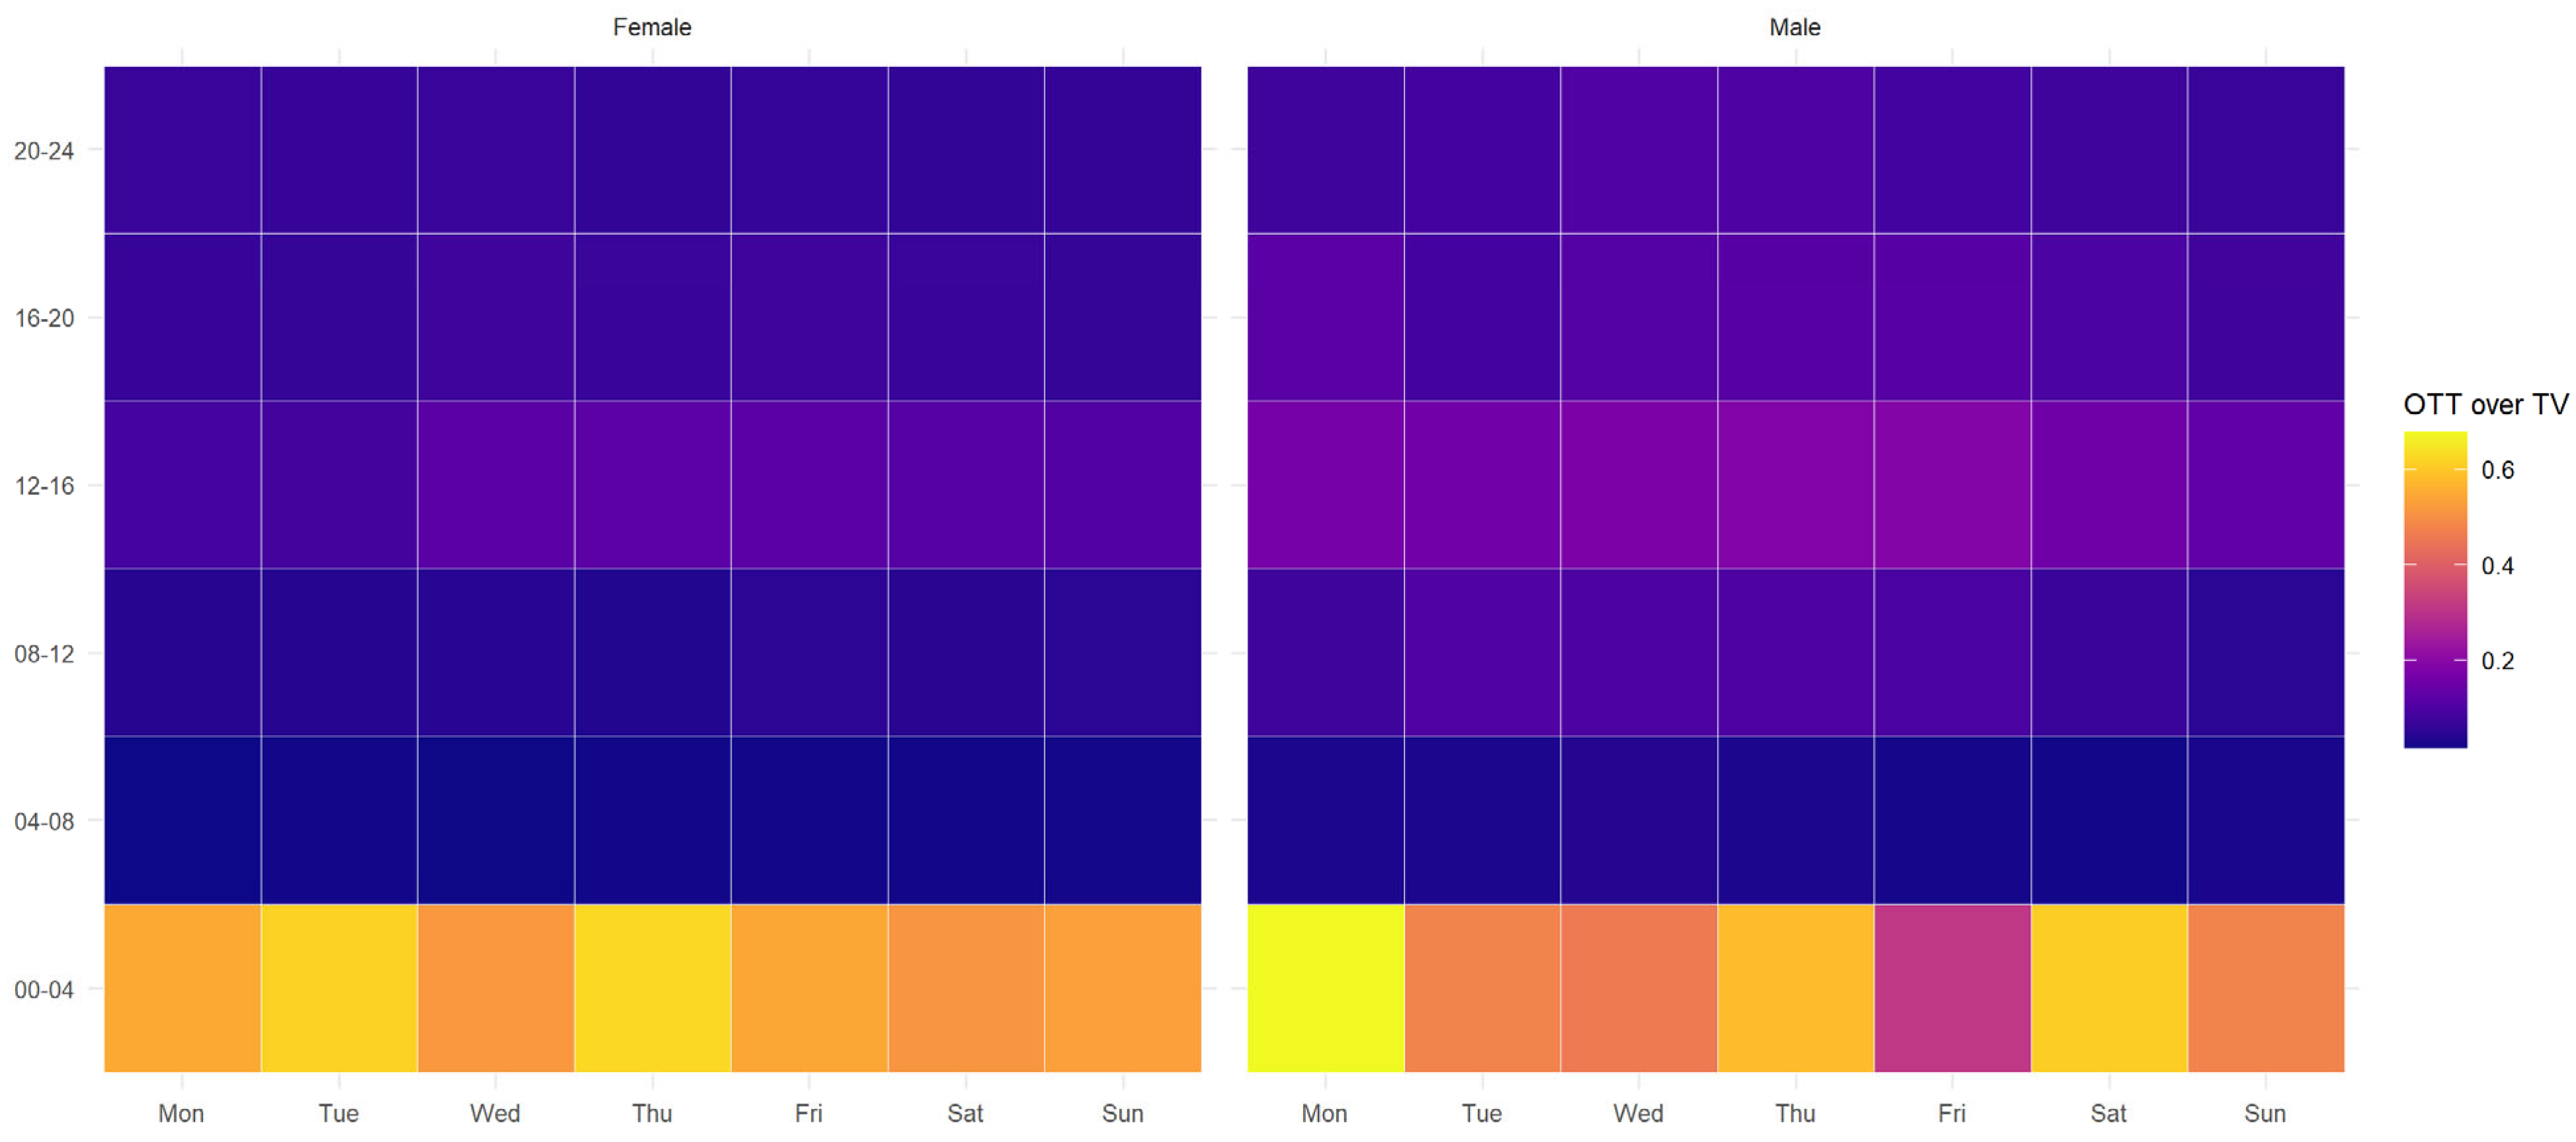
To understand the influence of individual factors like gender, age, education, and income on the choice between OTT and pay TV, we initially conducted a visualization analysis. Figure 4 illustrates how the proportion of people opting for OTT over pay TV fluctuates based on gender, time of day, and day of the week.
Interestingly, while the strength of preference for OTT during late-night hours showed no gender difference, variations emerged for specific days within that time frame. Women were most inclined to choose OTT over pay TV during late-night hours on Tuesdays and Thursdays. Men, however, displayed a preference for Mondays, Saturdays, and Thursdays, in that order. Moreover, men were slightly more inclined than women to opt for OTT during afternoon hours. Figure 5 below offers a graphical representation of how these choices vary by age across different time slots and days.
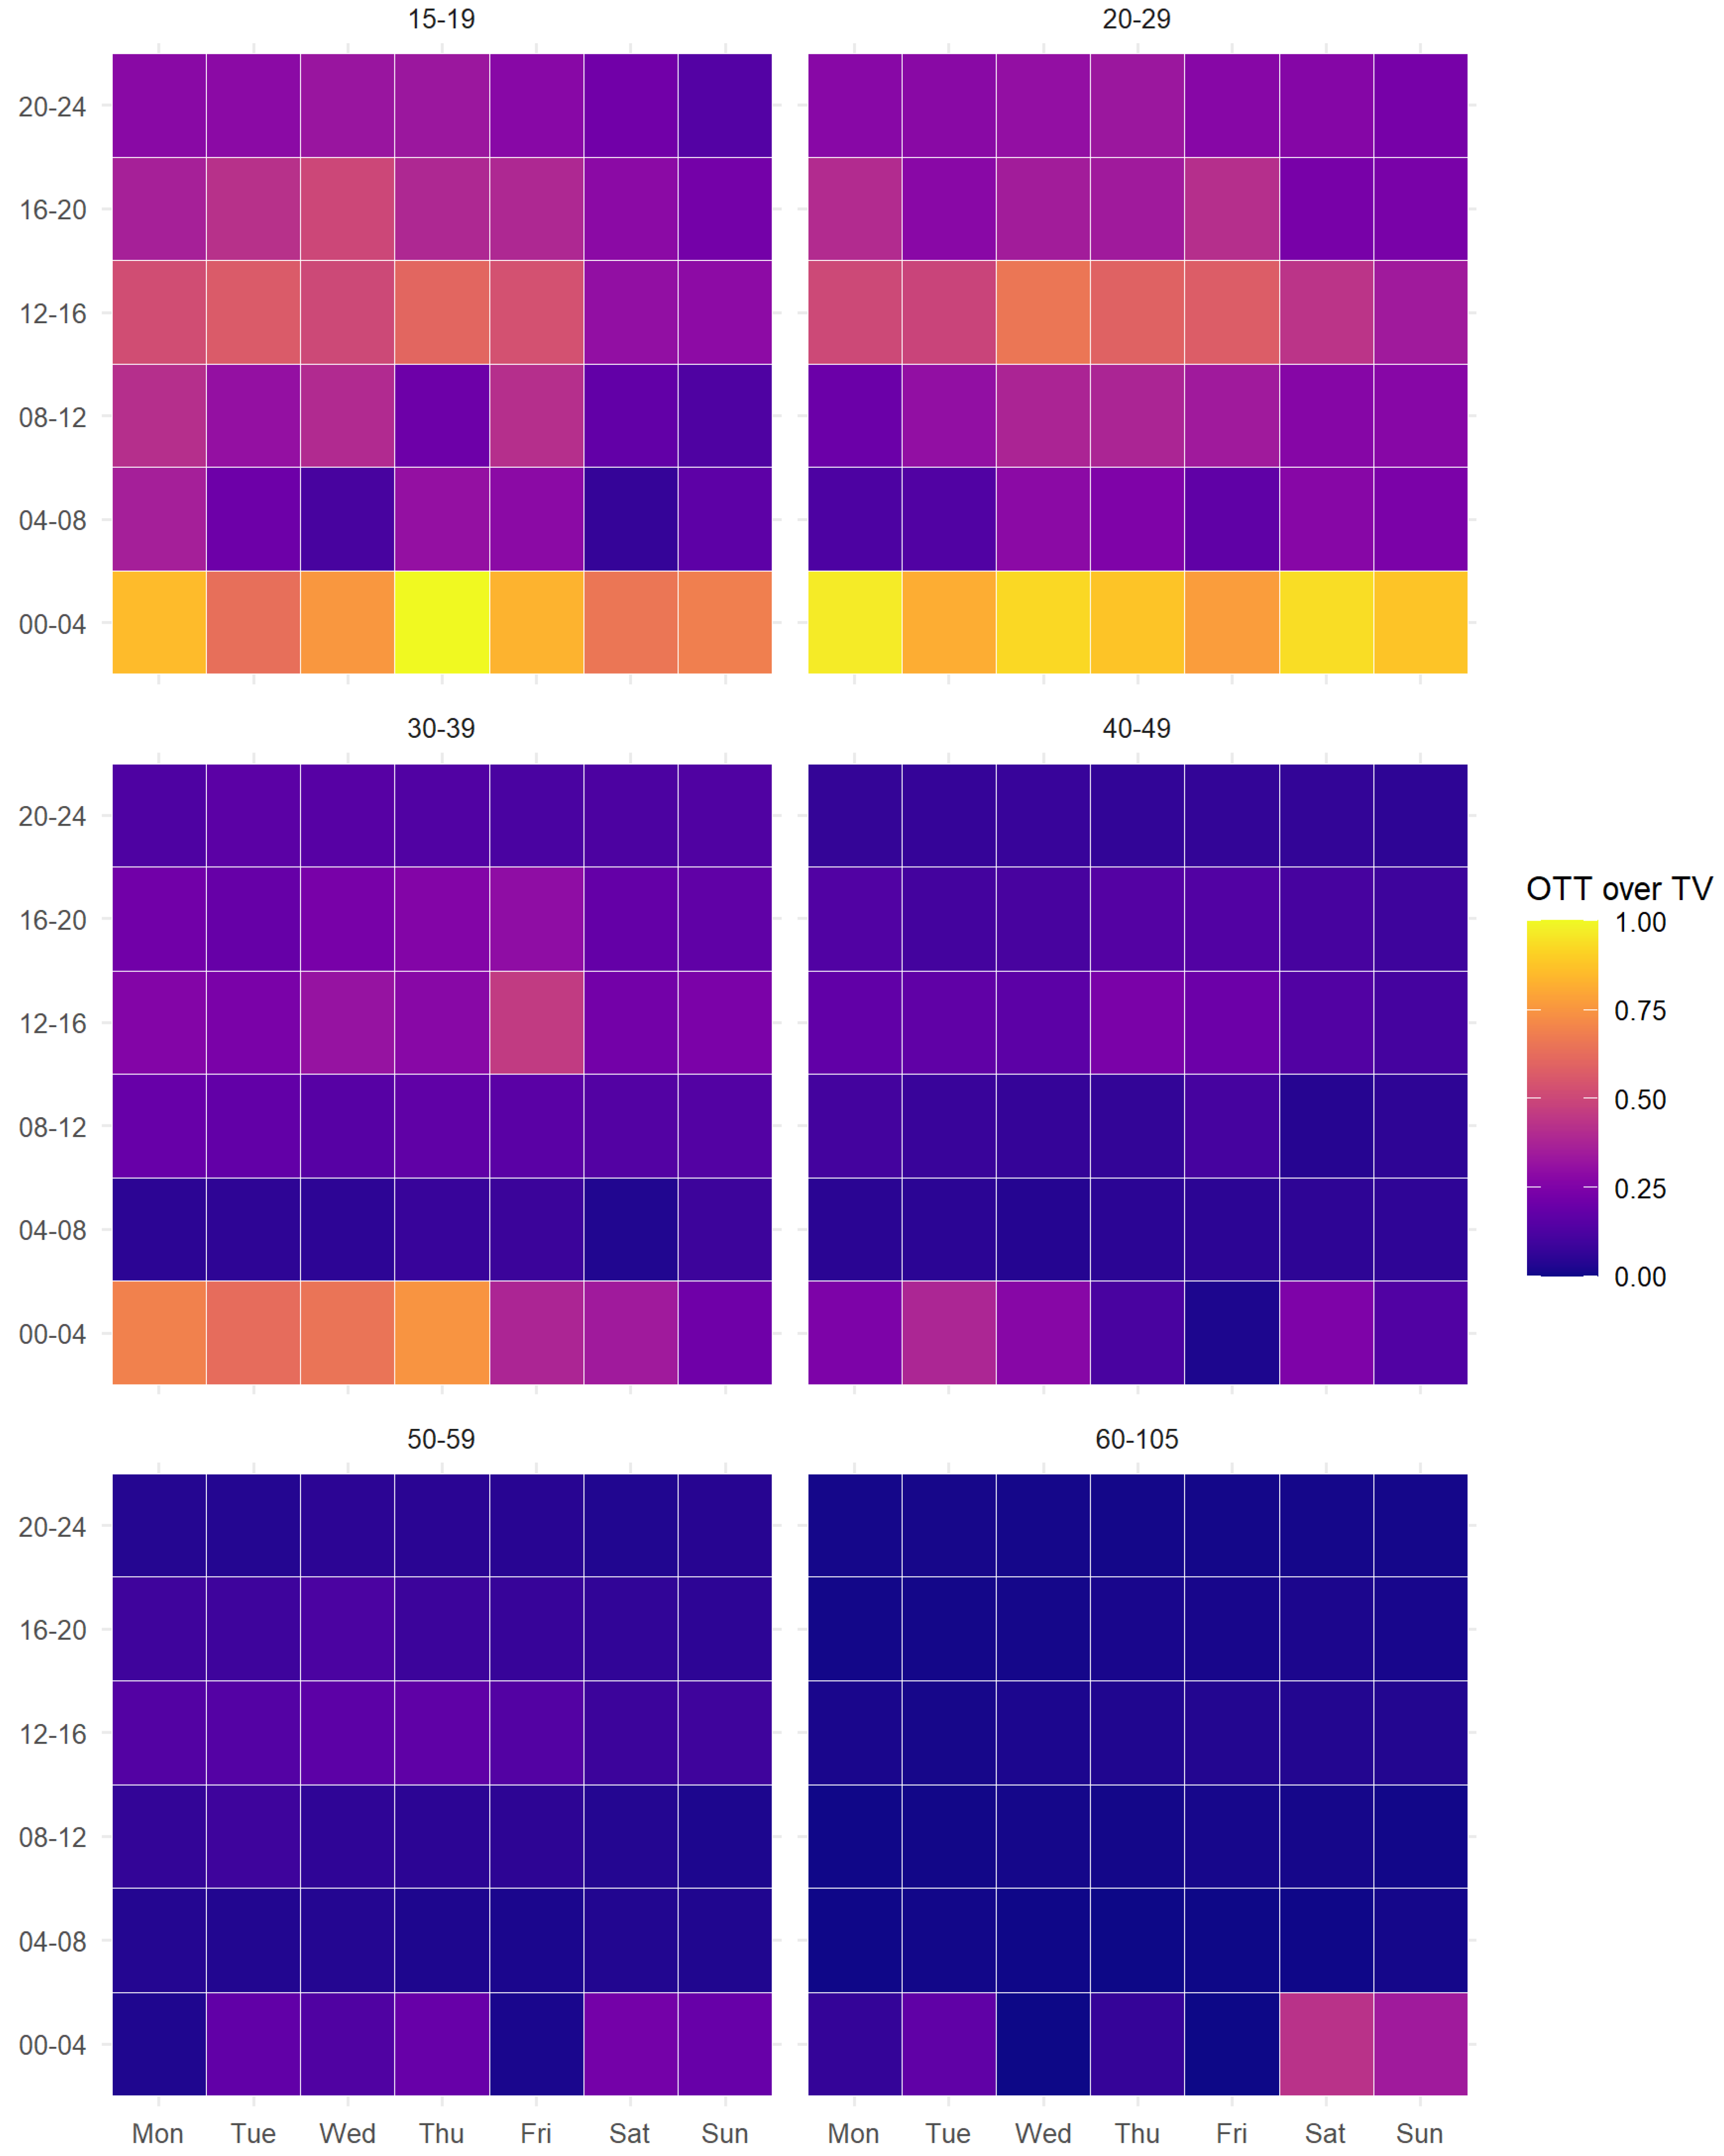
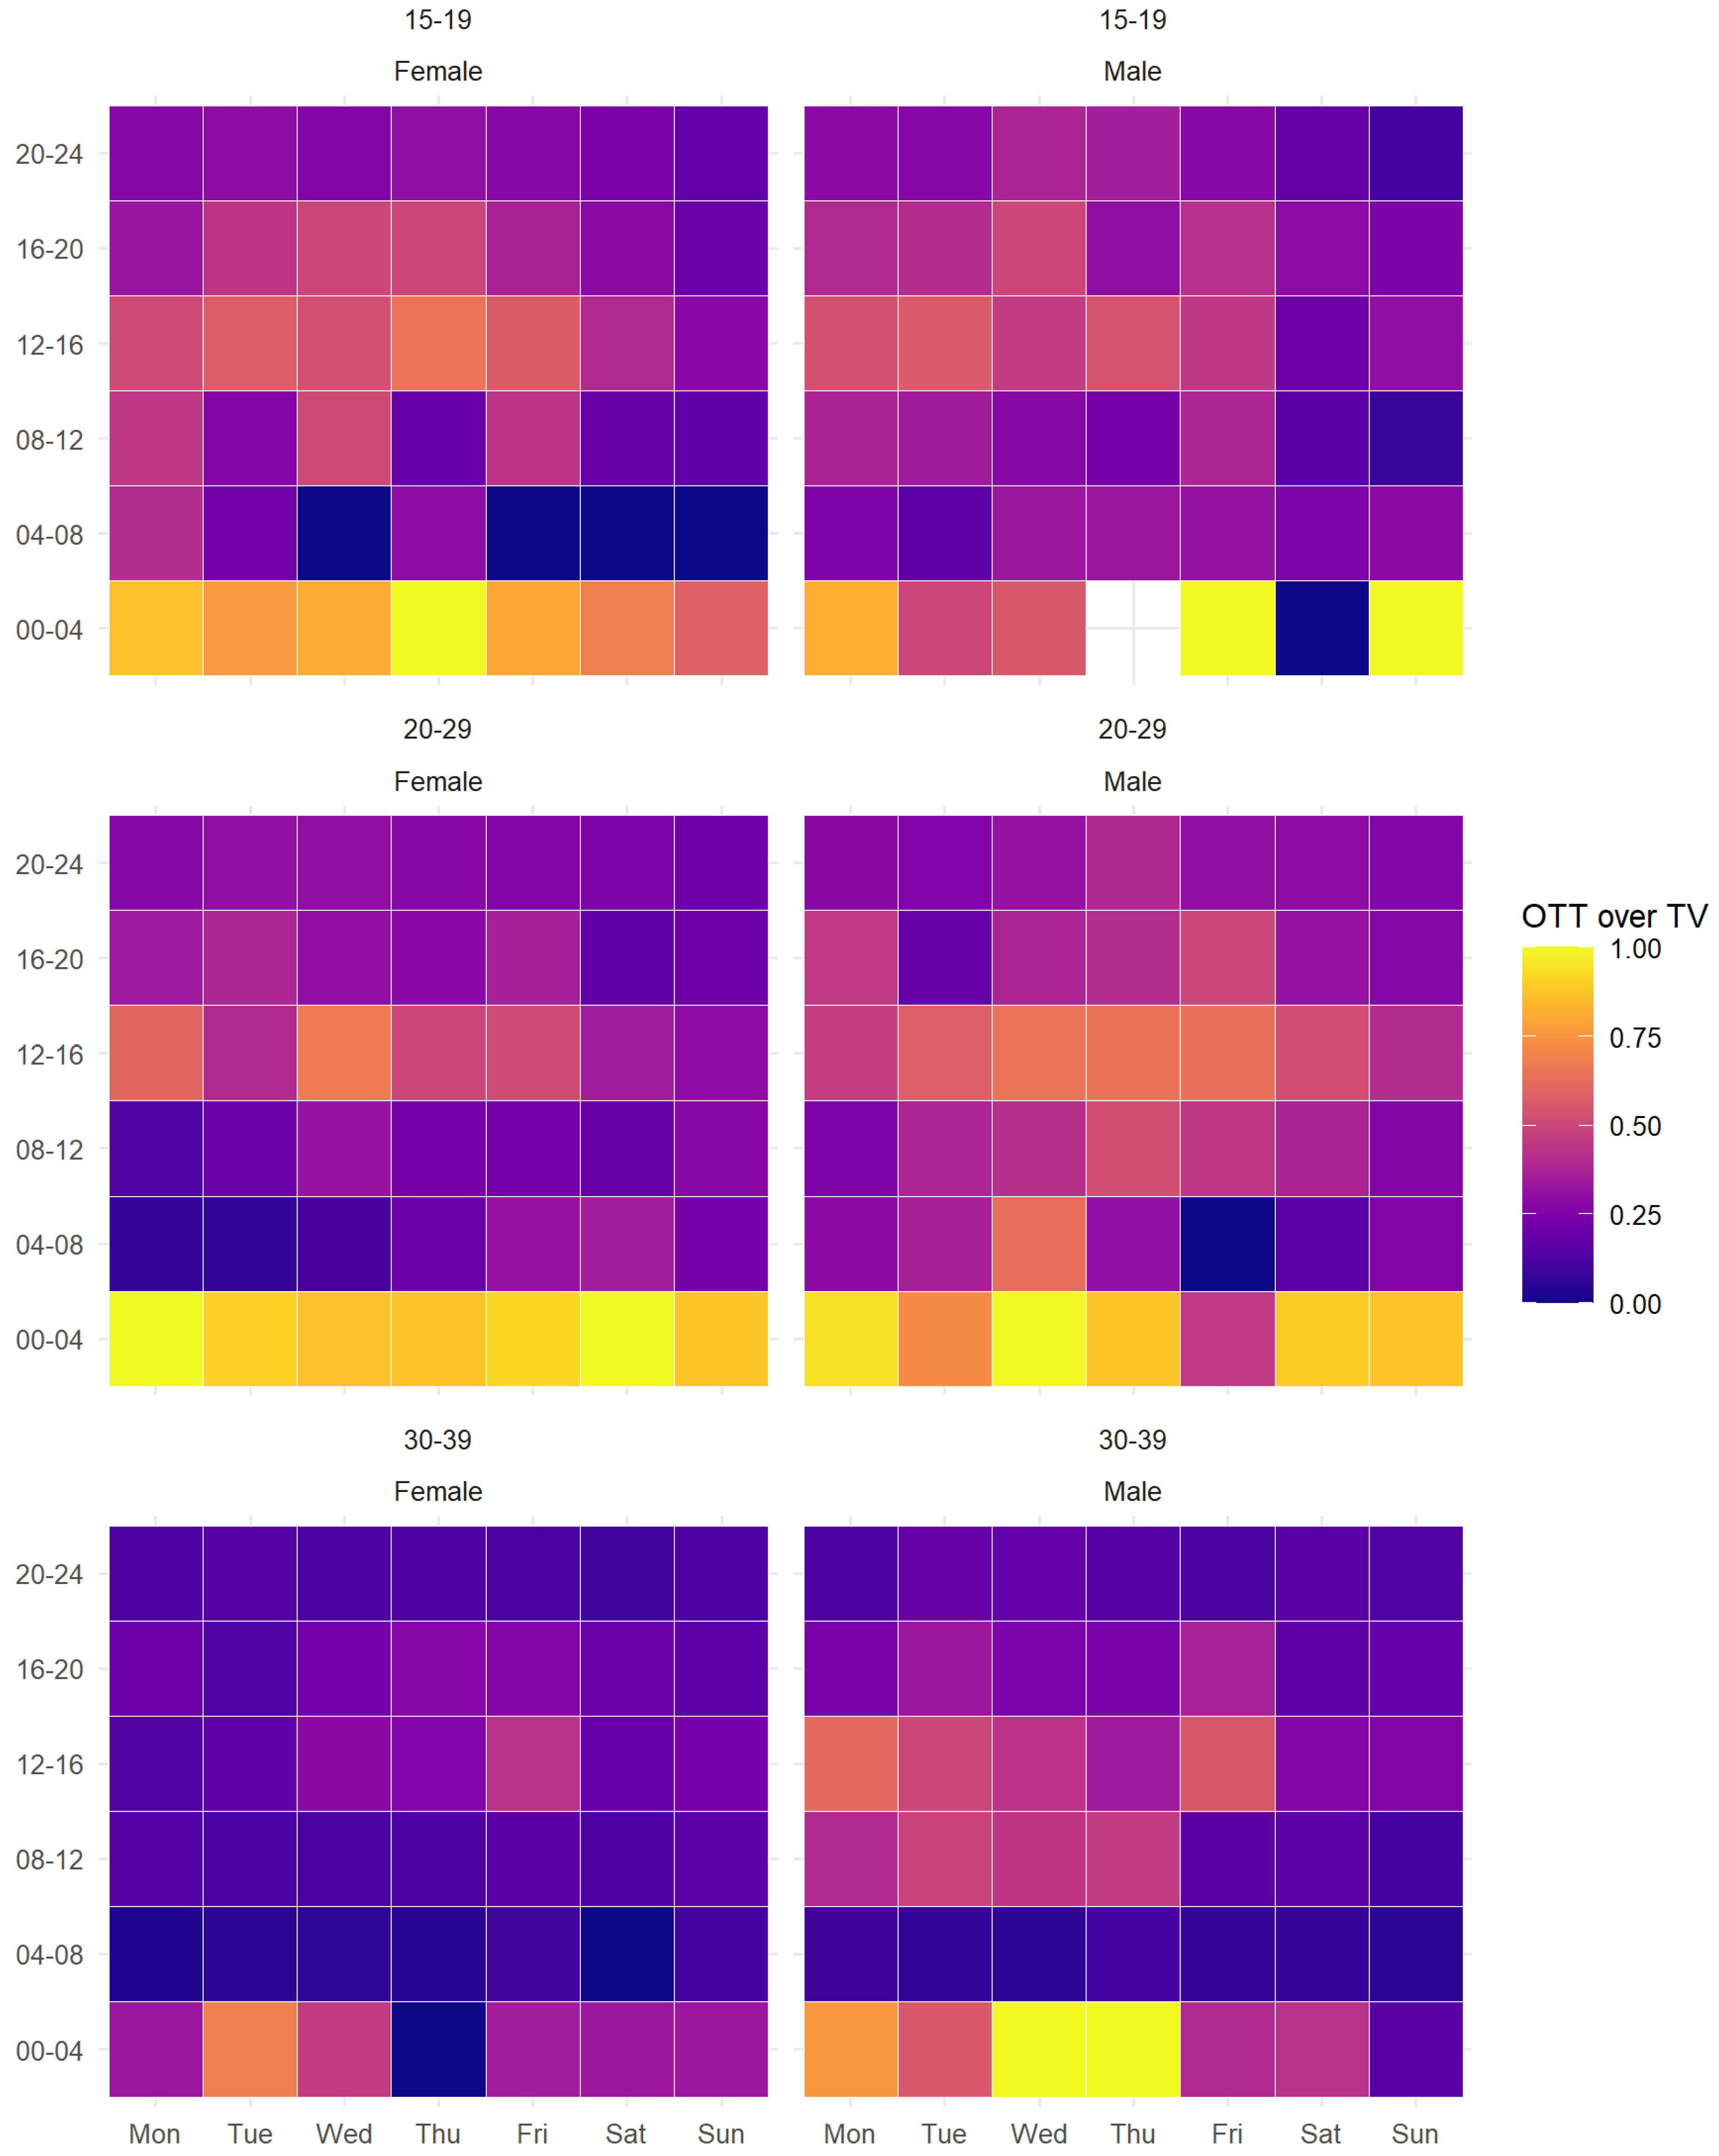
Among teenagers and individuals in their 20s, there is a general trend of higher OTT preference across all hours and days. People in their 30s, however, showed a stronger inclination for OTT mainly during late-night and afternoon hours. In contrast, individuals aged 40 and above predominantly favored pay TV, except during late-night hours on Tuesdays. Notably, in the prime-time evening slot (20:00–24:00), when TV typically features its most compelling content, younger age groups still preferred OTT, especially during afternoons (12:00–16:00) when pay TV mostly airs reruns. To examine any gender-based differences among younger viewers, we further explored the OTT preferences of individuals aged between their teens and 30s in Figure 6.
The analysis revealed discernable gender differences within each age group. Among teenagers, women showed a particular preference for OTT on late-night Wednesdays, while men favored late-night Fridays. In the 20s age bracket, women had a stronger general preference for OTT during late-night hours on all days, but especially on Mondays and Saturdays. For men in their 20s, a notable “Wednesday late-night effect” was observed, with a consistent afternoon preference regardless of the day. Among those in their 30s, men had a strong preference for OTT on Wednesday and Thursday nights, whereas women generally favored pay TV, with a slightly higher inclination towards OTT only on late-night Tuesdays.
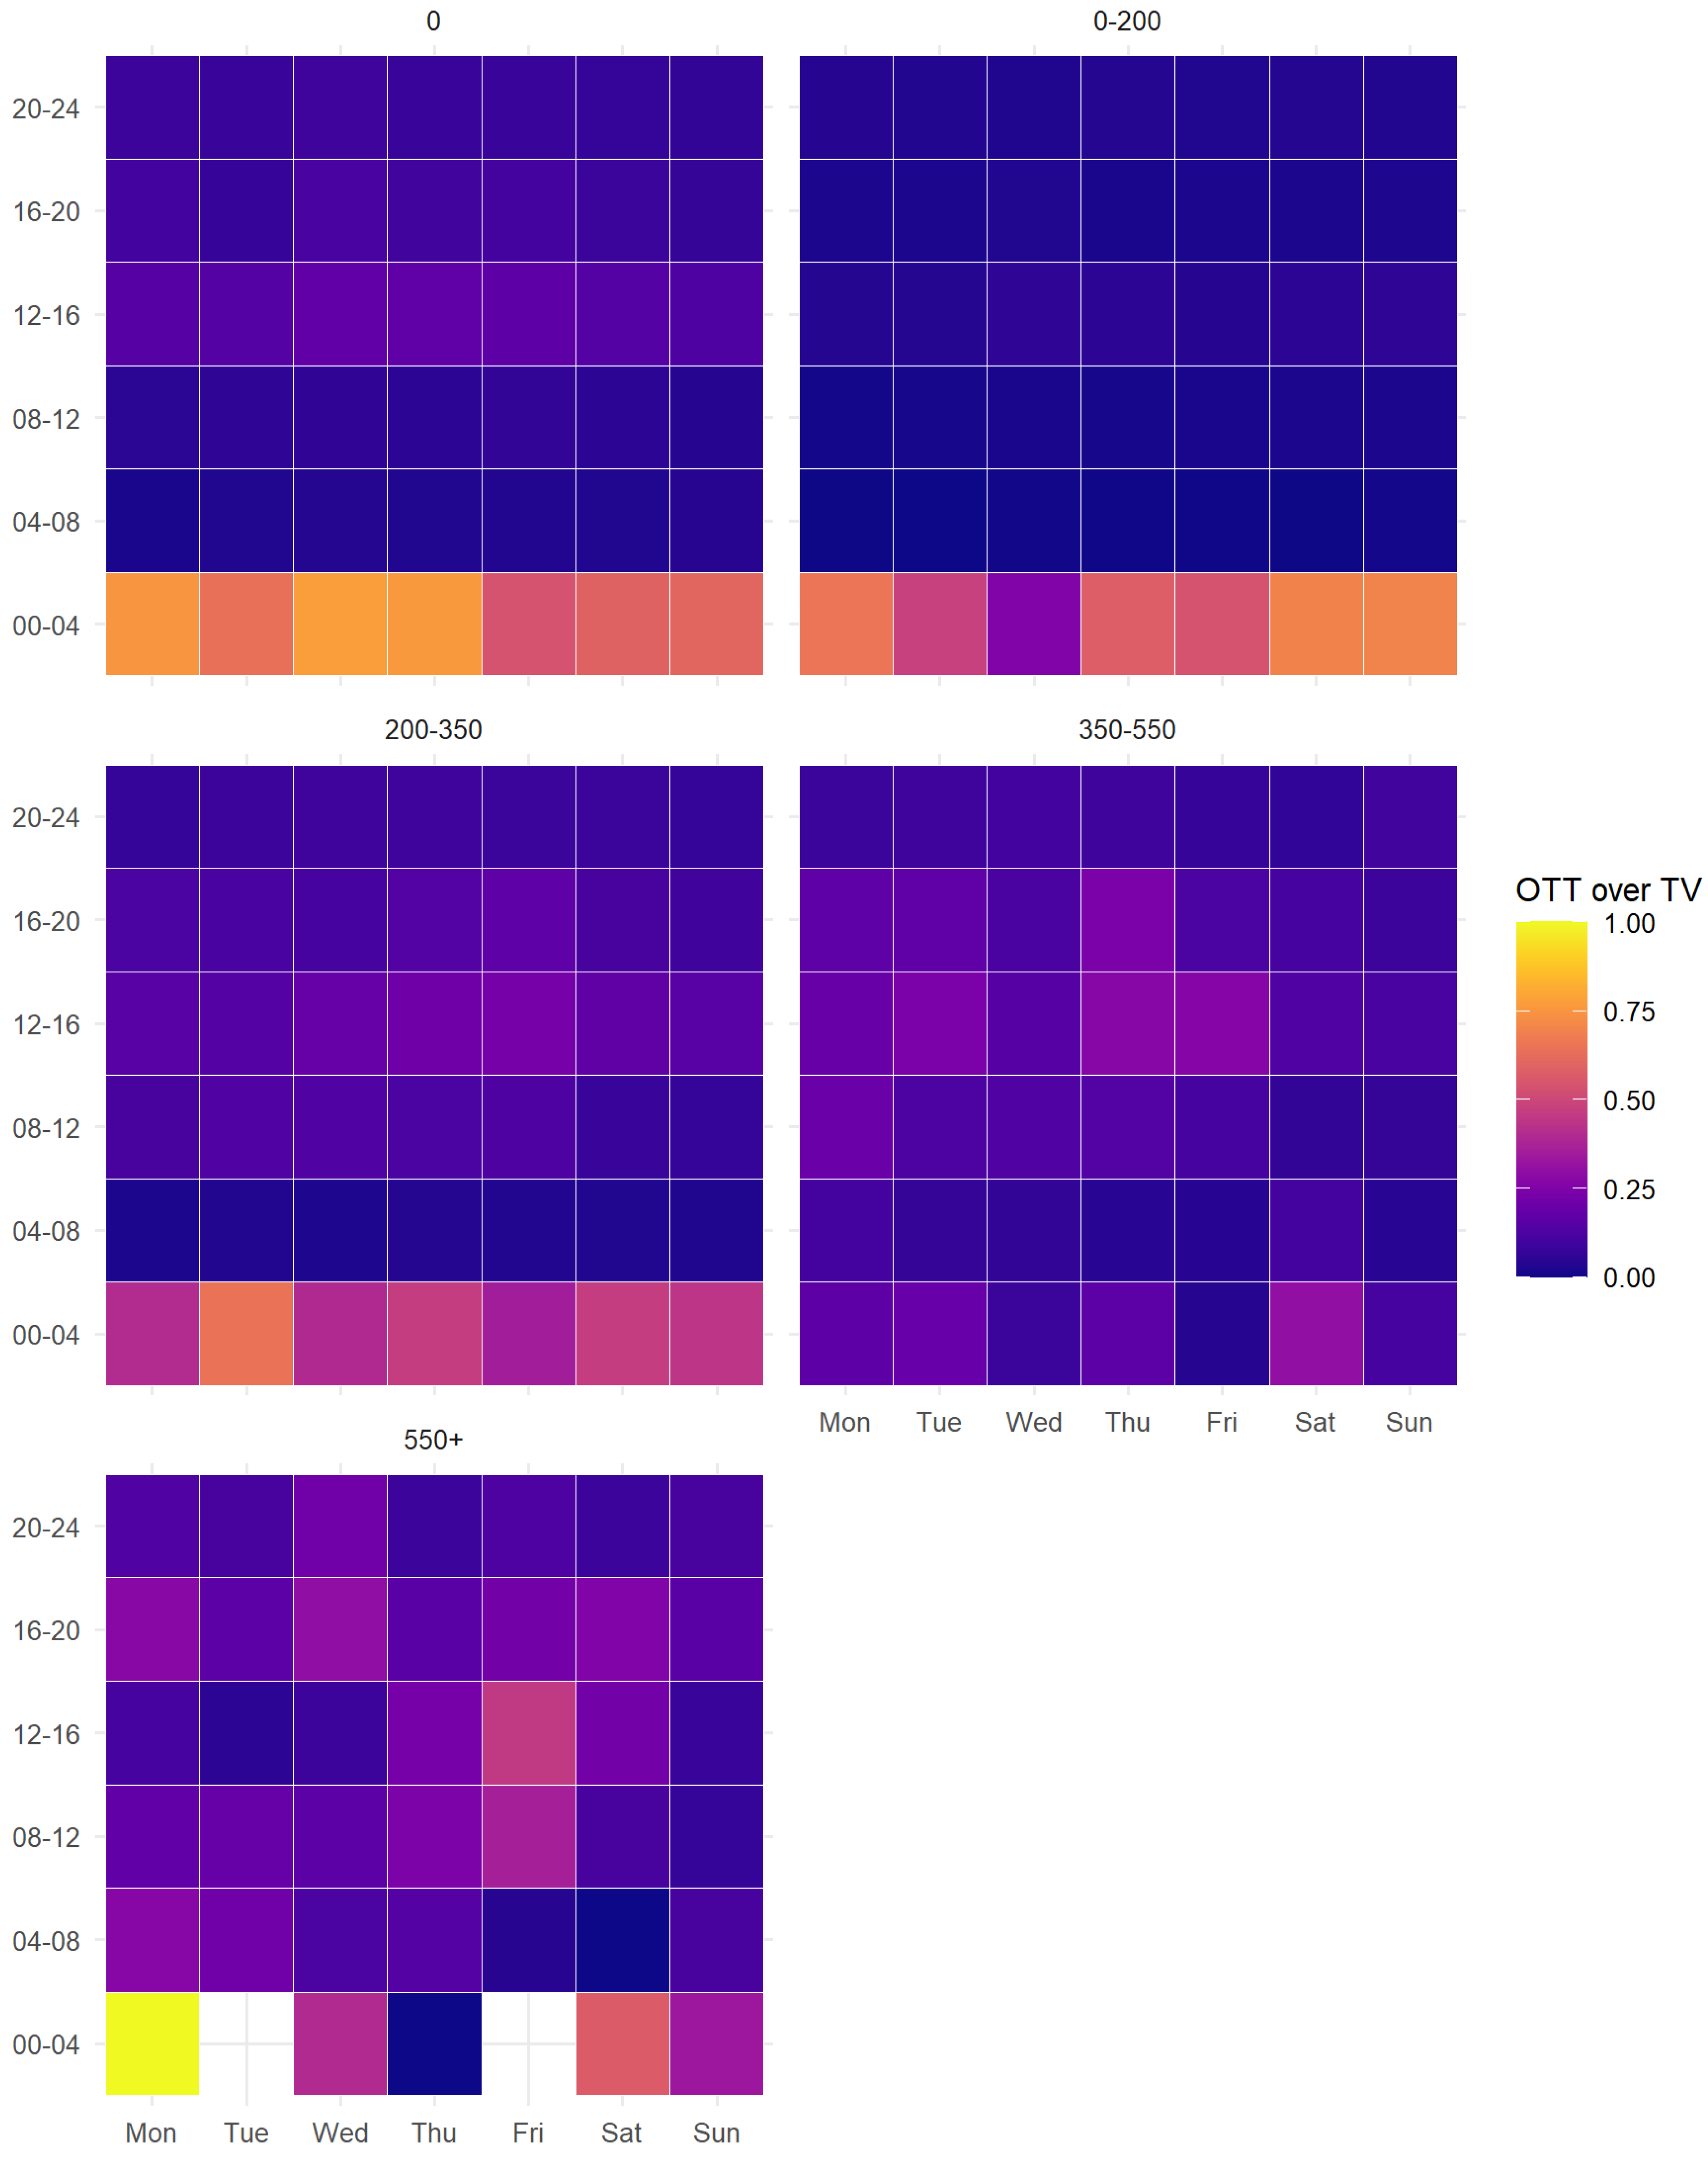
Figure 7 presents the results of an additional visualization analysis focusing on income-based preferences for OTT versus pay TV by time of day and day of the week. The group with no income exhibited a strong preference for OTT during late-night hours and some preference during the afternoon. Individuals earning less than KRW 2 million per month also favored late-night OTT, primarily on weekends. The KRW 2–3.5 million income bracket showed similar late-night OTT preferences but to a lesser degree. Those earning between KRW 3.5–5 million leaned more towards pay TV, while the group with incomes exceeding KRW 5 million demonstrated no discernible pattern in their viewing choices.
Table 4 presents the results of a logit model analysis examining the random effects of personal characteristics that influence the choice of OTT over TV. The ‘Male’ variable is coded as 1 for males and 0 otherwise. Age groups are dummy-coded into six brackets: 15–19, 20–29, 30–39, 40–49, 50–59, and 60+. Education is categorized into three levels: middle school graduates, high school graduates, and college graduates or higher. Income is segmented into four bins: no income, KRW 2–3.5 million, KRW 3.5–5 million, and above KRW 5 million.
In the analysis of the full sample presented in the first column, men were 33% more likely than women to choose OTT over pay TV (OR = 1.331, p < 0.001). Across age groups, all were significantly more inclined to opt for OTT compared to the reference group of 60+, arranged in the following order: 20s, 30s, 40s, 50s, and finally, teens. In terms of education, high school and college graduates were over 10 times more likely to favor OTT over the baseline group of middle school graduates. Regarding income, the KRW 2–3.5 million income bracket was 90% more likely to choose OTT compared to the no-income group (OR = 1.906, p < 0.001), followed by the KRW 3.5–5 million group at 77% more likely (OR = 1.771, p < 0.001), and the group earning more than KRW 5 million, who were over four times more likely (OR = 4.419, p < 0.001).
In summary, younger age (excluding teens), higher education, and higher income were factors that increased the likelihood of choosing OTT over pay TV. Additionally, as corroborated by the visualization analysis, the late-night (00:00–04:00) and afternoon (12:00–16:00) time slots were more likely to feature OTT viewership. On a weekly basis, Fridays were 17% more likely to show a preference for OTT compared to Mondays (OR = 1.170, p < 0.001).
Subgroup Analysis: Late Night, Afternoon, and Friday Samples
We conducted further analyses on specific subsets: late-night, afternoon, and Friday samples, which are presented in the second through fourth columns of Table 4. Contrary to the overall sample, the late-night subset revealed a strong preference for OTT among teenagers and those in the KRW 2–3.5 million income bracket. The afternoon and Friday samples showed largely similar trends: men were more likely to opt for OTT than women, and a notable preference was observed in the KRW 2–3.5 million income bracket. A day-of-the-week effect was apparent on Tuesdays, Wednesdays, and Thursdays in the afternoon sample. Likewise, a time-of-day effect for late-night and afternoon slots was evident in the Friday sample.
4.4. Environmental and Media Device Effects
Environmental factors and media device ownership are as pivotal as day-of-the-week effects, time-of-day effects, and individual characteristics in influencing choices between pay TV and OTT platforms. For instance, household composition—whether single-person, two-generational (parents and children), or three-generational (grandparents, parents, and children)—can substantially impact pay TV and OTT preferences at specific times and days, much like individual traits do. Moreover, the type of residential area also plays a role; urban areas typically offer a wider array of cable, satellite, and IPTV options than rural regions, thereby affecting the competitive landscape between OTT and pay TV.
The type of media devices owned and the presence of an unlimited data plan can also influence OTT preferences. For example, individuals without a TV but with a tablet and an unlimited data plan are likely to prefer OTT over pay TV. Table 5 elaborates on a regression analysis that incorporates these environmental factors alongside the variables from Table 4. In the full sample, household composition did not show statistical significance. Among the media device factors, those with unlimited data plans were 52% more likely to opt for OTT over pay TV (OR = 1.528, p < 0.001). Additionally, owning a tablet increased the odds of choosing OTT over pay TV more than five-fold (OR = 5.821, p < 0.001), while having a desktop at home made it 1.8 times more likely (OR = 1.820, p < 0.001).
Interestingly, the impact of environmental and media device factors varies by time of day. During late-night hours, those with unlimited plans were more than 16 times more likely to prefer OTT. Ownership of a beam projector also significantly increased the likelihood of OTT selection during these hours. In contrast, the afternoon revealed that both household composition and type of neighborhood significantly influenced OTT choices. Multi-generational households and city residents were more inclined to choose OTT over pay TV. Furthermore, tablet and desktop ownership were significant factors in afternoon OTT preferences. Finally, in the Friday sample, both unlimited data plans and tablet ownership were notable predictors of OTT preference.
5. Discussion and Conclusions
In order to investigate whether pay TV broadcasting and OTT media are competitive or complementary, this study built a media choice model that examined the selection between pay TV and OTT connections in the context of watching TV programs, movies, and personal broadcasts by time of day. To do so, we extracted only instances of watching a TV show or movie from the individual’s 2020 Media Panel data and collected 15-min observations. We ended up with a total sample of 423,851 individuals. Our exploratory analysis revealed the following: While the overall prevalence of choosing a pay TV connection for watching content is high (90%), the likelihood of choosing OTT during nighttime hours (00:00–04:00) is 6% higher than pay TV, standing at 54%. This late-night OTT viewing is likely driven by binge-watching, a phenomenon frequently observed among OTT users [16]. As a relatively new behavioral phenomenon whose concept is still evolving, binge-watching refers to watching multiple episodes of a television program in one sitting or in rapid succession [17]. In 2013, Netflix created a new way of consuming television programs that allowed viewers to choose from a vast and diverse selection of content and watch as many episodes of a TV series as they wanted, and binge-watching began to gain popularity with the development of various on-demand streaming platforms such as Netflix, Hulu, HBO GO, Amazon Prime, Disney+, Crunchyroll, and Apple TV [18,19]. It is known that binge-watching behavior on OTT occurs mostly during nighttime hours, including the evening [20,21,22]. When visualizing the percentage of OTT choices by day of the week and time of day, the time-of-day effect is more pronounced than the day-of-the-week effect. In terms of time of day, early afternoon (12:00–16:00) and late night (00:00–04:00) show a higher preference for OTT than other time periods.
Next, we summarize our key findings from the media choice model. First, we identified a day-of-the-week effect. There is a Friday effect for OTT selection across the entire sample, with a lower probability of choosing OTT over pay TV on Sundays. In the time-of-day model, we found a day-of-week effect favoring OTT over pay TV on Tuesdays, Wednesdays, and Thursdays in the early afternoon (12:00–16:00) and on Tuesdays, Wednesdays, and Sundays in the late afternoon (00:00–04:00).
Secondly, a time-of-day effect appears in this study. In both the full-sample and day-of-week models, we find late-night and early-afternoon time-of-day effects. Specifically, the probability of choosing OTT during late night is much higher than during other times of the day. The day-of-the-week effect appears in the order of Thursday, Tuesday, and Friday.
Thirdly, this study discovered the effect of individual characteristics. Most of the patterns identified in the exploratory data analysis through visualization were also significant in the model. To summarize the model results, across the entire sample, men preferred OTT over pay TV more than women did. The age groups, in order of preference for OTT, were 20s, 30s, 40s, 50s, 10s, and 60s. The higher the education level, the more likely those in the income group of KRW 2–3.5 million per month were to choose OTT, and the higher the income, the more likely the choice of OTT over pay TV. Income is generally closely related, and income is also known to be a variable that is directly related to an individual’s ability to pay for media services [23]. Therefore, we can understand the phenomenon of high-income people’s preference for OTTs being in line with the argument that people with higher incomes prefer media types that allow them to choose content that suits their tastes [24]. In the late-night sample, we found a strong OTT preference among teens and those in the KRW 2–3.5 million income bracket, while in the afternoon, an OTT preference was found among men and those in the KRW 2–3.5 million income bracket. A day-of-the-week effect was observed for Tuesday, Wednesday, and Thursday in the afternoon sample, and a time-of-day effect was observed for late night and afternoon in the Friday sample.
Finally, environmental characteristics have an effect. In the full sample, those with unlimited plans and those owning a tablet or desktop were more likely to choose OTT. During late-night hours, those with unlimited plans who own a beam projector were more likely to choose OTT. During the afternoon, environmental factors such as household composition and residential neighborhood significantly impacted OTT choice, with more people living together being more likely to choose OTT. Owning a tablet or desktop also influenced the choice of OTT over pay TV. Finally, in the Friday sample, having an unlimited plan and owning a tablet were significant predictors of OTT choice.
The existence of specific days and times of the day when OTT is favored over pay TV suggests that looking at the substitution relationship between pay TV and OTT in terms of total hours watched may miss certain nuances. While this study does not account for location, if OTT preference is generally higher on certain days, times, and locations where consumers would not typically utilize pay TV, the two mediums could be viewed as complementary. As the results show, the time-of-day effect on OTT preference during late-night may not indicate substitution, as it is not a time of day when pay TV broadcasting is heavily resourced. This could signify a larger media market pie, as consumers may have shifted to OTT viewing from other activities, like sleeping or socializing with friends. On the other hand, a phenomenon like the Friday effect, which favors OTT, could indicate a substitution relationship, since pay TV broadcasters devote more resources to Fridays. For this reason, existing studies that analyze substitution relationships by merely looking at revenue, market share, or total time allocation between the two mediums have yielded inconsistent results. Cord-cutting and cord-shaving of traditional TV media, phenomena encouraging consumers to migrate to vMVPDs for cheaper OTT services, are not yet evident in this study. However, given the strong preference for OTT among teens and those aged up to 30 years, along with the fact that single-person households, unlimited plans, and devices like tablets and PCs drive the choice of OTT over pay TV, it is likely that cord-cutting and cord-shaving will be observed in the near future. If this trend persists, companies in the traditional TV media ecosystem should focus on developing content that leverages capabilities not present in OTT platforms. They should also deploy their resources to capitalize on the time-of-day and day-of-week effects identified in this study. Additionally, companies entering the OTT space should think strategically about the types of content that will engage viewers during late-night hours and on Fridays, rather than focusing solely on days that are not favored, as pay TV and OTT are not in a winner-takes-all situation, but rather in a competitive landscape.
In general, people have differentiated media consumption habits influenced by their lifestyles and societal trends [25,26]. However, most existing studies have tried to understand the substitution or complementarity between pay TV and OTT from a macro perspective, considering changes in revenues, subscribers, and total time spent. These approaches are bound to produce inconsistent results. This study distinguishes itself by adopting a micro-level approach to analyze the dynamics of media consumption patterns, a departure from the traditional macro-level perspective that focuses on revenue, subscribers, and total time spent. By examining factors such as time of day, day of the week, and various demographic variables, this research provides a more nuanced understanding of media choice between pay TV and OTT platforms. This nuanced understanding could serve as a valuable resource for stakeholders in both the TV and OTT industries, aiding them in planning and executing more effective content and advertising strategies. Specifically, the age-related consumption patterns revealed by this study offer predictive insights that can guide future content development for both pay TV and OTT services.
Furthermore, this study illuminates the differential effects of environmental factors, such as household composition and unlimited data plans, on media choices. It thereby allows for a more targeted approach for both service providers and advertisers. Lastly, by focusing on the South Korean market, this study extends the discourse on media consumption to non-Western contexts, paving the way for cross-cultural comparisons in future research.
While the study has many strengths, it is not without limitations. Media usage behaviors are strongly associated with demographic characteristics such as age, gender, education, income, and occupation [27]. While this study found a number of effects based on various demographic characteristics, it does not provide an adequate explanation for why gender, age, and education are associated with differential use of the two media in the overall sample. Also, the focus on the Korean market, although valuable for its uniqueness, may limit the generalizability of the findings to other cultural or national contexts. Another limitation could be the absence of data related to content preferences, such as genre or show type, which could offer additional layers of understanding to media choice behavior. The study also does not account for location-based preferences—whether people are more likely to watch OTT or pay TV at home, at work, or in other settings, which could be valuable information for both pay TV and OTT service providers. In fact, we found that across the overall sample, the afternoon sample, and the Friday sample, those who own a tablet are more likely to use OTT. Tablet PCs are the quintessential everywhere device.
For future research, it would be beneficial to replicate this study in different markets to compare and contrast the findings. Additionally, a longitudinal study could provide insights into how media consumption habits are evolving over time, especially given the rapid technological changes and shifts in user behavior. There is also scope to extend the methodology of this study to investigate the complementary or substitutive relationships between other types of mediums, such as radio, print, and online news platforms.
In conclusion, this study provides a comprehensive and nuanced understanding of media consumption habits between pay TV and OTT platforms, focusing on time-of-day and day-of-week preferences as well as various demographic factors. Its findings offer a roadmap for both industry stakeholders and academic researchers, highlighting the areas that need further exploration to fully understand the dynamics of modern media consumption.
Author Contributions
C.L. analyzed the data and composed the initial draft of the manuscript. Y.-W.C. refined and completed the manuscript. All authors have read and agreed to the published version of the manuscript.
Funding
This work was supported by the Ministry of Education of the Republic of Korea and the National Research Foundation of Korea (NRF-2022S1A5A8051070).
Institutional Review Board Statement
Not applicable.
Informed Consent Statement
Not applicable.
Data Availability Statement
The media panel data utilized in this research is accessible through the following link: https://stat.kisdi.re.kr/.
Conflicts of Interest
The authors declare no conflict of interest.
References
- Federal Communications Commission. Annual Assessment of the Status of Competition in the Market for the Delivery of Video Programming; MB Docket No. 12-203. FCC 13–99; Federal Communications Commission: Washington, DC, USA, 2013. [Google Scholar]
- Bondad-Brown, B.A.; Rice, R.E.; Rearce, K.E. Influences on TV viewing and online user-shared video use: Demographics, generations, contextual age, media use, motivations, and audience activity. J. Broadcast. Electron. Media 2012, 56, 471–493. [Google Scholar] [CrossRef]
- Chen YN, K. Competitions between OTT TV platforms and traditional television in Taiwan: A Niche analysis. Telecommun. Policy 2019, 43, 101793. [Google Scholar] [CrossRef]
- Jung, J.; Melguizo, Á. Is your netflix a substitute for your telefunken? Evidence on the dynamics of traditional pay TV and OTT in Latin America. Telecommun. Policy 2023, 47, 102397. [Google Scholar] [CrossRef]
- Park, S.; Kwon, Y. Research on the Relationship between the Growth of OTT Service Market and the Change in the Structure of the Pay-TV Market. In Proceedings of the 30th European Conference of the International Telecommunications Society (ITS): “Towards a Connected and Automated Society”, Helsinki, Finland, 16–19 June 2019; International Telecommunications Society (ITS): Calgary, AB, Canada, 2019. [Google Scholar]
- Tefertiller, A. Media substitution in cable cord-cutting: The adoption of web-streaming television. J. Broadcast Electron. Media 2018, 62, 390–407. [Google Scholar] [CrossRef]
- Udoakpan, N.; Tengeh, R.K. The impact of over-the-top television services on pay-television subscription services in South Africa. J. Open Innov. Technol. Mark. Complex. 2020, 6, 139. [Google Scholar] [CrossRef]
- Kim, H.; Chan-Olmsted, S.M.; Hwang, K.H.; Chang, B.H. Examining the Use, Perception, and Motivation of Cord-Cutting: A Consumer Segment Approach. J. Mass Commun. Q. 2021, 98, 126–147. [Google Scholar] [CrossRef]
- Kim, J.; Kim, S.; Nam, C. Competitive dynamics in the Korean video platform market: Traditional pay TV platforms vs. OTT platforms. Telemat. Inform. 2016, 33, 711–721. [Google Scholar] [CrossRef]
- Malone, J.B.; Nevo, A.; Nolan, Z.; Williams, J.W. Is OTT Video a Substitute for TV? Policy Insights from Cord-Cutting. Rev. Econ. Stat. 2021, 105, 1615–1623. [Google Scholar] [CrossRef]
- da Silva, J.M.S.; de Andrade Lima, R.C. Is Netflix a threat to the cable TV industry? Evidence from Brazil. Telecommun. Policy 2022, 46, 102274. [Google Scholar] [CrossRef]
- Fudurić, M.; Malthouse, E.C.; Lee, M.H. Understanding the Drivers of Cable TV Cord Shaving with Big Data. J. Media Bus. Stud. 2020, 17, 172–189. [Google Scholar] [CrossRef]
- Kim, J. A Study on the Displacement of Mobile OTT Video Services on Home TV. J. Korea Contents Assoc. 2018, 18, 434–445. [Google Scholar]
- Dimmick, J. The theory of the niche and spending on mass media: The case of the “video revolution”. J. Media Econ. 1997, 10, 33–43. [Google Scholar] [CrossRef]
- Train, K.E. Discrete Choice Methods with Simulation; Cambridge University Press: Cambridge, UK, 2009. [Google Scholar]
- Umesh, S.; Bose, S. Binge-watching: A matter of concern? Indian J. Psychol. Med. 2019, 41, 182. [Google Scholar] [CrossRef] [PubMed]
- Panda, S.; Pandey, S.C. Binge watching and college students: Motivations and outcomes. Young Consum. 2017, 18, 425–438. [Google Scholar] [CrossRef]
- Starosta, J.A.; Izydorczyk, B. Understanding the phenomenon of binge-watching—A systematic review. Int. J. Environ. Res. Public Health 2020, 17, 4469. [Google Scholar] [CrossRef] [PubMed]
- Winland, C. An exploration of binge-watching and its effects on college academic. Pediatrics 2015, 75, 807–812. [Google Scholar]
- Castro; Rigby, J.; Cabral, D.; Nisi, V. The Binge-Watcher’s Journey: Investigating Motivations, Contexts, and Affective States surrounding Netflix Viewing. Convergence 2021, 27, 3–20. [Google Scholar] [CrossRef]
- Singh, R.; Singh, M.U. Binge Watching during COVID-19. Int. J. Indian Psychol. 2021, 9, 413–420. [Google Scholar]
- Tana, J.; Eirola, E.; Nylund, M. When is prime-time in streaming media platforms and video-on-demands services? New media consumption patterns and real-time economy. Eur. J. Commun. 2020, 35, 108–125. [Google Scholar] [CrossRef]
- Mosco, V. The Pay-Per-Society: Computers and Communication in the Information Age; Ablex: Norwood, NJ, USA, 1989. [Google Scholar]
- Bergström, A.; Strömbäck, J.; Arkhede, S. Towards rising inequalities in newspaper and television news consumption? A longitudinal analysis. Eur. J. Commun. 2019, 34, 175–189. [Google Scholar] [CrossRef]
- Crawford, J.E. Cutting the cord-A marketing case: An examination of changing TV viewership. Atl. Mark. J. 2016, 5, 136–150. [Google Scholar]
- Medina, M.; Herrero-Subías, M.; Guerrero-Perez, E. Audience behaviour and multiplatform strategies: The path towards connected TV in Spain. Austral Comun. 2015, 4, 153–172. [Google Scholar] [CrossRef]
- Kwak, K.T.; Oh, C.J.; Lee, S.W. Who uses paid over-the-top services and why? Cross-national comparisons of consumer demographics and values. Telecommun. Policy 2021, 45, 102168. [Google Scholar] [CrossRef]
Figure 1.
Ratios of pay TV to OTT choices by day of week (N obs: 423,851).

Figure 2.
Ratios of pay TV to OTT choices by time of day (N obs: 423,851).

Figure 3.
Cross–densities of pay TV vs. OTT selections by time of day and day of week (N.obs: 423,851).
Figure 3.
Cross–densities of pay TV vs. OTT selections by time of day and day of week (N.obs: 423,851).

Figure 4.
Gender differences in pay TV versus OTT selection rates by time of day and day of week (N.obs: 423,851).
Figure 4.
Gender differences in pay TV versus OTT selection rates by time of day and day of week (N.obs: 423,851).

Figure 5.
Age group differences in pay TV versus OTT selection rates by time of day and day of week (N.obs: 423,851).
Figure 5.
Age group differences in pay TV versus OTT selection rates by time of day and day of week (N.obs: 423,851).

Figure 6.
Percentages of TV versus OTT choices by time of day and day of week, with gender differences among 10–30-year-olds.
Figure 6.
Percentages of TV versus OTT choices by time of day and day of week, with gender differences among 10–30-year-olds.

Figure 7.
Differences between income groups in pay TV versus OTT selection rates by time of day and day of week.
Figure 7.
Differences between income groups in pay TV versus OTT selection rates by time of day and day of week.


Table 1.
Media diary variables to identify hourly choices between pay TV and OTT.
| Item | Sub-Item |
|---|---|
| Main activity | Watch terrestrial TV programs live (including reruns) |
| Watch terrestrial TV broadcast programs (VOD) | |
| Watch non-terrestrial TV programs live (including reruns) | |
| Watch non-terrestrial TV broadcast programs (VOD) | |
| Watch TV data broadcast programs | |
| Watch movies/videos (from movie studios, productions, etc.) | |
| Watch TV shows on comprehensive programming channel live (including reruns) | |
| Watch the program on comprehensive programming channel | |
| Main connection | Via a cable TV broadcast service (including a set-top box connection) |
| Via IPTV broadcast service (including set-top box connection) | |
| Via satellite broadcasting service (including set-top box connection) | |
| Via terrestrial DMB service | |
| Via satellite DMB service | |
| Via direct reception of terrestrial broadcasting (terrestrial antenna/digital converter) | |
| Connect with OTT |
Table 2.
Day-of-the-week effects on viewing content via OTT platforms vs. pay TV connections.
| Day of Week | Time Zone-Specific Models | ||||||
|---|---|---|---|---|---|---|---|
| 08–12 | 12–16 | 16–20 | 20–24 | 00–04 | 04–08 | Total | |
| Tue | 1.103 | 1.885 *** | 0.638 *** | 1.079 | 2.285 *** | 0.711 | 1.032 |
| (0.173) | (0.317) | (0.0932) | (0.0716) | (0.875) | (0.408) | (0.0387) | |
| Wed | 0.658 *** | 2.083 *** | 1.123 | 1.062 | 2.490 *** | 0.258 *** | 1.052 |
| (0.111) | (0.387) | (0.167) | (0.0757) | (1.001) | (0.171) | (0.0422) | |
| Thu | 0.591 *** | 1.914 *** | 0.771 | 1.048 | 1.782 | 0.0456 *** | 1.075 |
| (0.106) | (0.381) | (0.122) | (0.0814) | (0.762) | (0.0364) | (0.0468) | |
| Fri | 0.843 | 1.151 | 1.318 | 1.124 | 1.078 | 0.0377 *** | 1.167 *** |
| (0.143) | (0.214) | (0.201) | (0.0874) | (0.471) | (0.0307) | (0.0499) | |
| Sat | 0.214 *** | 0.496 *** | 0.501 *** | 1.453 *** | 0.444 | 0.428 | 0.970 |
| (0.0348) | (0.0804) | (0.0663) | (0.107) | (0.222) | (0.368) | (0.0380) | |
| Sun | 0.171 *** | 0.282 *** | 0.279 *** | 1.059 | 2.433 *** | 1.807 | 0.823 *** |
| (0.0270) | (0.0454) | (0.0363) | (0.0723) | (0.998) | (1.471) | (0.0300) | |
| Random Effect | Yes | Yes | Yes | Yes | Yes | Yes | Yes |
| N. Obs. | 79,926 | 48,442 | 81,652 | 184,234 | 26,407 | 3190 | 423,851 |
| N. Persons | 5826 | 4653 | 6580 | 8950 | 3292 | 429 | 9297 |
Note: Stars represent: *** p < 0.001.
Table 3.
Time effects on viewing content via OTT platforms versus pay TV connections.
| Time | Day of the Week Models | |||||||
|---|---|---|---|---|---|---|---|---|
| Monday | Tuesday | Wednesday | Thursday | Friday | Saturday | Sunday | Total | |
| 00–04 | 55.23 *** | 127.5 *** | 66.01 *** | 418.0 *** | 69.64 *** | 33.58 *** | 18.71 *** | 20.35 *** |
| (17.98) | (43.22) | (21.08) | (209.2) | (29.61) | (10.31) | (4.913) | (1.994) | |
| 08–12 | 3.971 *** | 5.182 *** | 6.592 *** | 3.574 *** | 7.624 *** | 2.057 *** | 0.903 | 2.438 *** |
| (0.793) | (0.951) | (1.270) | (0.684) | (1.648) | (0.446) | (0.167) | (0.152) | |
| 12–16 | 19.56 *** | 24.59 *** | 40.20 *** | 29.01 *** | 40.14 *** | 8.467 *** | 3.378 *** | 8.322 *** |
| (4.054) | (4.783) | (8.083) | (5.694) | (8.900) | (1.838) | (0.628) | (0.525) | |
| 16–20 | 7.818 *** | 5.816 *** | 13.50 *** | 7.017 *** | 12.69 *** | 4.979 *** | 1.540 *** | 4.024 *** |
| (1.556) | (1.058) | (2.570) | (1.293) | (2.721) | (1.068) | (0.282) | (0.247) | |
| 20–24 | 1.562 *** | 2.014 *** | 3.146 *** | 1.722 *** | 2.165 *** | 2.250 *** | 0.974 | 1.540 *** |
| (0.296) | (0.342) | (0.563) | (0.302) | (0.443) | (0.477) | (0.176) | (0.0913) | |
| Random Effect | Yes | Yes | Yes | Yes | Yes | Yes | Yes | Yes |
| N. Obs. | 79,926 | 48,442 | 81,652 | 184,234 | 26,407 | 3190 | 423,851 | |
| N. Persons | 5826 | 4653 | 6580 | 8950 | 3292 | 429 | 9297 | |
Note: Stars represent: *** p < 0.001.
Table 4.
Results of random-effect logit model of personal characteristics related to OTT selection.
| VARS | Total Sample | Sub-Sample Regression | ||
|---|---|---|---|---|
| Late Night (00:00–04:00) | Afternoon (12:00–16:00) | Friday | ||
| Personal characteristics | ||||
| Male | 1.331 *** | 1.639 | 1.704 *** | 1.653 *** |
| (0.139) | (1.065) | (0.427) | (0.405) | |
| Age: 15–19 | 1488 *** | 7.836 × 10⁷ *** | 15,041 *** | 29,031 *** |
| (354.1) | (1.452 × 10⁸) | (7932) | (20,636) | |
| 20–29 | 595.8 *** | 5.253 × 10⁷ *** | 1.352 × 10⁶ *** | 3379 *** |
| (117.0) | (8.762 × 10⁷) | (530,724) | (1699) | |
| 30–39 | 63.85 *** | 78.01 *** | 247.8 *** | 105.2 *** |
| (12.60) | (135.6) | (121.5) | (49.74) | |
| 40–49 | 14.84 *** | 0.417 | 24.00 *** | 17.35 *** |
| (2.434) | (0.663) | (9.650) | (7.000) | |
| 50–59 | 6.430 *** | 0.388 | 13.46 *** | 6.660 *** |
| (1.004) | (0.603) | (4.995) | (2.644) | |
| Edu: College+ | 21.83 *** | 1.316 | 44.96 *** | 158.0 *** |
| (5.417) | (2.233) | (20.36) | (89.01) | |
| High | 13.81 *** | 0.648 | 12.91 *** | 111.3 *** |
| (3.268) | (1.054) | (5.373) | (58.54) | |
| Income: 0–2 million | 0.946 | 1.559 | 0.826 | 0.736 |
| (0.168) | (1.314) | (0.300) | (0.293) | |
| 2–3.5 million | 1.906 *** | 13.86 *** | 5.461 *** | 3.028 *** |
| (0.235) | (11.22) | (1.548) | (0.855) | |
| 3.5–5.5 million | 1.771 *** | 0.220 | 2.846 *** | 2.396 *** |
| (0.325) | (0.248) | (1.399) | (1.007) | |
| 5.5 million+ | 4.419 *** | 3.826 | 2.429 | 10.46 *** |
| (1.516) | (9.274) | (2.348) | (8.536) | |
| Time-of-day effect | ||||
| 00–04 | 20.65 *** | 58.57 *** | ||
| (2.009) | (23.48) | |||
| 08–12 | 2.609 *** | 8.186 *** | ||
| (0.163) | (1.742) | |||
| 12–16 | 8.944 *** | 44.30 *** | ||
| (0.568) | (9.721) | |||
| 16–20 | 4.261 *** | 13.33 *** | ||
| (0.263) | (2.811) | |||
| 20–24 | 1.521 *** | 2.118 *** | ||
| (0.0903) | (0.424) | |||
| Day-of-the-week effect | ||||
| Tue | 1.043 | 0.679 | 2.053 *** | |
| (0.0404) | (0.369) | (0.352) | ||
| Wed | 1.081 | 0.241 *** | 2.436 *** | |
| (0.0448) | (0.153) | (0.465) | ||
| Thu | 1.089 | 0.0337 *** | 2.198 *** | |
| (0.0490) | (0.0261) | (0.457) | ||
| Fri | 1.170 *** | 0.0310 *** | 1.185 | |
| (0.0518) | (0.0254) | (0.230) | ||
| Sat | 0.779 *** | 0.450 | 0.420 *** | |
| (0.0319) | (0.338) | (0.0704) | ||
| Sun | 0.622 *** | 1.818 | 0.238 *** | |
| (0.0239) | (1.250) | (0.0395) | ||
| Random Effect | Yes | Yes | Yes | Yes |
| Observations | 423,851 | 3190 | 48,442 | 57,683 |
| Number of pid | 9297 | 429 | 4653 | 3781 |
Note: Stars represent: *** p < 0.001.
Table 5.
Results of random effect logit model with environmental characteristics.
| VARS | Total Sample | Sub-Sample Regression | ||
|---|---|---|---|---|
| Late Night (00:00–04:00) | Afternoon (12:00–16:00) | Friday | ||
| Environmental factor | ||||
| Household: 2 generations | 0.917 | 0.00174 | 44.32 *** | 0.299 *** |
| (0.268) | (0.00638) | (24.45) | (0.184) | |
| 3 generations | 1.577 | 0.00700 | 59.61 *** | 1.315 |
| (0.441) | (0.0250) | (29.03) | (0.773) | |
| Residential area | 0.969 | 3.442 | 3.366 *** | 1.491 |
| (0.200) | (6.011) | (2.069) | (0.705) | |
| Media device | ||||
| Unlimited plans | 1.528 *** | 16.35 *** | 1.223 | 2.118 *** |
| (0.155) | (13.08) | (0.310) | (0.478) | |
| Tablet PC | 5.821 *** | 0.524 | 18.77 *** | 13.06 *** |
| (1.307) | (0.694) | (9.280) | (7.234) | |
| Smart TV | 1.049 | 0.315 | 0.800 | 0.993 |
| (0.107) | (0.289) | (0.200) | (0.231) | |
| Desktop | 1.820 *** | 4.459 | 2.526 *** | 1.650 |
| (0.204) | (3.733) | (0.692) | (0.425) | |
| Projector | 1.828 | 7.231 × 10⁷ *** | 0.0931 *** | 3.320 |
| (0.887) | (1.878 × 10⁸) | (0.0947) | (4.480) | |
| Time-of-day effect | ||||
| 00–04 | 20.44 *** | 55.55 *** | ||
| (1.987) | (22.00) | |||
| 08–12 | 2.586 *** | 8.174 *** | ||
| (0.162) | (1.737) | |||
| 12–16 | 8.857 *** | 44.08 *** | ||
| (0.563) | (9.657) | |||
| 16–20 | 4.213 *** | 13.29 *** | ||
| (0.260) | (2.796) | |||
| 20–24 | 1.523 *** | 2.126 *** | ||
| (0.0904) | (0.425) | |||
| Day-of-the-week effect | ||||
| Tue | 1.042 | 0.717 | 2.086 *** | |
| (0.0405) | (0.407) | (0.361) | ||
| Wed | 1.077 | 0.252 *** | 2.487 *** | |
| (0.0447) | (0.167) | (0.478) | ||
| Thu | 1.091 | 0.0392 *** | 2.268 *** | |
| (0.0492) | (0.0328) | (0.474) | ||
| Fri | 1.178 *** | 0.0359 *** | 1.203 | |
| (0.0524) | (0.0330) | (0.235) | ||
| Sat | 0.784 *** | 0.581 | 0.415 *** | |
| (0.0323) | (0.479) | (0.0699) | ||
| Sun | 0.625 *** | 2.112 | 0.234 *** | |
| (0.0241) | (1.610) | (0.0390) | ||
| Control of personal characteristics | Yes | Yes | Yes | Yes |
| Random Effect | Yes | Yes | Yes | Yes |
| Observations | 415,411 | 3190 | 47,616 | 56,618 |
| Number of pid | 9149 | 429 | 4581 | 3722 |
Note: Stars represent: *** p < 0.001.
Disclaimer/Publisher’s Note: The statements, opinions and data contained in all publications are solely those of the individual author(s) and contributor(s) and not of MDPI and/or the editor(s). MDPI and/or the editor(s) disclaim responsibility for any injury to people or property resulting from any ideas, methods, instructions or products referred to in the content. |
© 2023 by the authors. Licensee MDPI, Basel, Switzerland. This article is an open access article distributed under the terms and conditions of the Creative Commons Attribution (CC BY) license (https://creativecommons.org/licenses/by/4.0/).
Share and Cite
MDPI and ACS Style
Choi, Y.-W.; Lee, C. Time-of-Day and Day-of-Week Effects on TV and OTT Media Choices: Evidence from South Korea. J. Theor. Appl. Electron. Commer. Res. 2024, 19, 1-19. https://doi.org/10.3390/jtaer19010001
AMA Style
Choi Y-W, Lee C. Time-of-Day and Day-of-Week Effects on TV and OTT Media Choices: Evidence from South Korea. Journal of Theoretical and Applied Electronic Commerce Research. 2024; 19(1):1-19. https://doi.org/10.3390/jtaer19010001
Chicago/Turabian StyleChoi, Yun-Woo, and Changjun Lee. 2024. "Time-of-Day and Day-of-Week Effects on TV and OTT Media Choices: Evidence from South Korea" Journal of Theoretical and Applied Electronic Commerce Research 19, no. 1: 1-19. https://doi.org/10.3390/jtaer19010001