
Abstract
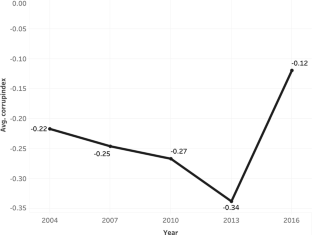
Corruption plays a central role in underdevelopment in the Philippines, yet there is no reliable, non-aggregate, and periodic measurement for corruption in the country. This study demonstrates the use of statistical techniques to synthesize information from public procurement contracts into one indicator to measure corruption risk for each province in the Philippines from 2004 to 2018. The results show corruption risk decreased from the 2004 term to 2013, and increased to an all-time high in 2016. Regression analysis also shows that two measures of political power concentration among clans—a Hirschman–Herfindahl Index applied to the political sphere (Political HHI), and the Size of the Largest Dynasty per Province—is significantly and positively linked to the corruption risk indicator at least at the 5% significance level. This result coheres with emerging literature on political dynasties, suggesting that these debilitate checks and balances and increase the risk of impunity and malgovernance at the local level, particularly in the Philippines. This study highlights the importance of studying corruption vis-à-vis the evolving issue of political dynasties amassing power, and provides further evidence that reforms are required in this area to promote development in democracies.
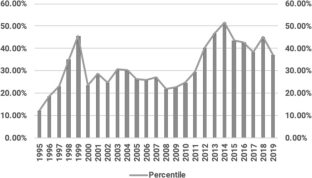
Source: Transparency International (https://www.transparency.org/en/cpi)
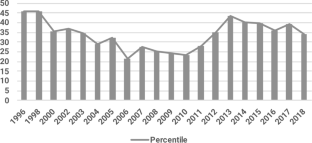
Source: World Bank (https://databank.worldbank.org/databases/control-of-corruption)
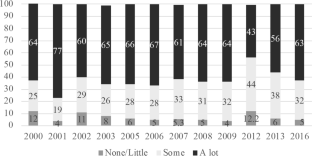
Source: Social Weather Stations (https://www.sws.org.ph/swsmain/artcldisppage/?artcsyscode=ART-20161005151549)

Source: Authors’ own calculations (color figure online)
Notes
See Republic Act 9184. Further information available at: https://www.officialgazette.gov.ph/2016/08/29/implementing-rules-and-regulations-of-republic-act-no-9184/.
Using a survey of randomly selected municipalities, Azfar and Gurgur (2008) found that corruption has a negative effect on health outcomes in the Philippines. Specifically, they constructed a corruption index from survey variables and found it has a significant negative effect on health services like immunization in children, patient waiting times, accessibility of health clinics, among others. In addition, Magtulis and Poquiz (2017) examined the relationship of government size (as measured by government expenditure over GDP) and the CPI over time using vector autoregression, and found a significant positive relationship between government spending and corruption perception.
Mendoza et al. (2015) note that bribery can serve as grease or sand in the wheels of commerce, affecting firm performance (at the micro‐level) and, ultimately, economic growth (at the macro‐level). Analyzing a dataset of over 2000 micro, small and medium scale enterprises in over 30 cities in the Philippines, they find evidence that corruption greases the wheels of commerce for Philippine SMEs, particularly in cities with poor business environments.
Elbahnasawy and Revier (2012), for example, empirically analyzed the potential correlates of Transparency International’s CPI and World Bank’s Worldwide Governance Indicators for 159 countries from 1998 to 2005, and found evidence that perceptions of a strong rule of law predicts a reduced level of corruption. Furthermore, income level of countries was also a significant predictor—poorer countries were associated with more corruption.
Fat dynasty share is the proportion of all elected officials in a province who have relatives simultaneously holding positions within a given election term.
Political HHI contribution of 1 family with 50% market share is (\({50}^{2}=2500\)), while the political HHI contribution of 10 families with 10% market share each is (\({10}^{2}+ {10}^{2}+\dots + {10}^{2}=1000\)).
The data is limited by the fact more contracts are present in regions closer to Manila due to those areas being more economically developed and having better access to technology and information technology needed to ensure the complete and timely upload of contracts to PhilGEPS.
This covers the following positions within a province: Governor, Vice-governor, Congressperson, Provincial Board Member, Mayor, Vice-Mayor, and Councilor.
Similar to other recent studies that link development indicators like poverty to concentration of political power in the Philippines (eg. Mendoza et al 2016), we only claim correlation and not causality through the empirical models. Through the OLS and fixed effects panel regression, we estimate the strength and direction of the relationship between the corruption risk indicator and the measures of political dynasties, but do not imply that political dynasties cause increased or decreased corruption risk. The variables used in the study cannot explain nor control for temporal order, hence causation cannot be claimed.
All provinces in the Philippines hold elections every three years on the exact same day, and three-year electoral terms for all elected positions used in this study are aligned for each province. The 5 three-year terms used in this study are those which began in the following years: 2004, 2007, 2010, 2013, and 2016.
References
Acemoglu D, Bautista MA, Querubín P, Robinson JA (2007) Economic and political inequality in development: the case of Cundinamarca, Colombia. w13208. National Bureau of Economic Research https://doi.org/10.3386/w132208
Alesina A, Devleeschauwer A, Easterly W, Kurlat S, Wacziarg R (2003) Fractionalization. J Econ Growth 8(2):155–194. https://doi.org/10.1023/A:1024471506938
Asako Y, Iida T, Matsubayashi T, Ueda M (2015) Dynastic politicians: theory and evidence from Japan. Jpn J Political Sci 16(1):5–32. https://doi.org/10.1017/S146810991400036X
Asian Development Bank (2016) Anticorruption policy: enhancing the role of the Asian development bank in relation to tax integrity (Policy Paper). Asian Development Bank.
Auriol E, Straub S, Flochel T (2016) Public procurement and rent-seeking: the case of paraguay. World Dev 77:395–407. https://doi.org/10.1016/j.worlddev.2015.09.001
Azfar O, Gurgur T (2008) Does corruption affect health outcomes in the Philippines? Econ Gov 9(3):197–244. https://doi.org/10.1007/s10101-006-0031-y
Burgess R, Jedwab R, Miguel E, Morjaria A, Miquel GP (2015) The value of democracy: evidence from road building in Kenya. Am Econ Rev 105(6):1817–1851. https://doi.org/10.1257/aer.20131031
Burguet R, Perry MK (2009) Preferred suppliers in auction markets. Rand J Econ 40(2):283–295. https://doi.org/10.1111/j.1756-2171.2009.00065.x
Canare T (2016) The relationship between IRA and local government expenditures: evidence from a cross-section of Philippine Cities. Philipp Political Sci J 37(3):167–189. https://doi.org/10.1080/01154451.2016.1236476
Capuno JJ (2013) Fiscal transfers and gerrymandering under decentralization in the Philippines. UP School of Economics Discussion Paper. 201304. University of the Philippines School of Economics.
Coviello D, Gagliarducci S (2010) Building political collusion: evidence from procurement auctions. 4939. Institute of Labor Economics (IZA).
Cruz C, Labonne J, Querubín P (2017) Politician family networks and electoral outcomes: evidence from the Philippines. Am Econ Rev 107(10):3006–3037
Danguilan-Vitug M (1998) Highway robbery. In: Coronel S (ed) Pork and other perks: corruption and governance in the Philippines. pp 186–215
Davis D (2022) Dynasties and corruption: how dynasties threaten accountability for corruption [Doctoral thesis, The University of Virginia]” https://libraetd.lib.virginia.edu/public_view/vq27zp39n
de Dios ES, Ferrer RD (2001) Corruption in the Philippines: framework and context. Public Policy 5(1):44
Department of Finance (2020) Statistics | DOF—bureau of local government finance. http://blgf.gov.ph/lgu-fiscal-data/.
Drazanova L (2019) Historical index of ethnic fractionalization dataset (HIEF). Harvard Dataverse V2. https://doi.org/10.7910/DVN/4JQRCL
Elbahnasawy NG, Revier CF (2012) The determinants of corruption: cross-country-panel-data analysis. Dev Econ 50(4):311–33. https://doi.org/10.1111/j.1746-1049.2012.00177.x
Fazekas M, Kocsis G (2020) Uncovering high-level corruption: cross-national objective corruption risk indicators using public procurement data. Br J Political Sci 50(1):155–164. https://doi.org/10.1017/S0007123417000461
Fazekas M, Tóth IJ, King LP (2016) An objective corruption risk index using public procurement data. Eur J Crim Policy Res 22(3):369–397. https://doi.org/10.1007/s10610-016-9308-z
George S, Ponattu D (2018) Like father like son? How dynasties affect economic development. Working Paper. Harvard University. Cambridge, M. A. https://scholar.harvard.edu/files/siddharthgeorge/files/sid_dynasties_draft_27aug2018.pdf;
Geys B, Smith DM (2017) Political dynasties in democracies: causes, consequences and remaining puzzles. Econ J 127(605):F446–F454. https://doi.org/10.1111/ecoj.12442
Hayes A (2020) Why the Herfindahl-Hirschman Index (HHI) Matters. Investopedia. https://www.investopedia.com/terms/h/hhi.asp.
Hicken A, Atkinson J, Ravanilla N (2017) Pork and typhoons: the influence of political connections on disaster response in the Philippines. In Mendoza RU, Beja Jr EL, Teehankee JC, La Vina AGM, Villamejor-Mendoza MF (eds) Building Inclusive Democracies in ASEAN. pp 74–101. https://doi.org/10.1142/10889
Holgado-Tello FP, Chacón-Moscoso S, Barbero-García I, Vila-Abad E (2010) Polychoric versus pearson correlations in exploratory and confirmatory factor analysis of ordinal variables. Qual Quant 44(1):153–166. https://doi.org/10.1007/s11135-008-9190-y
Jones DS (2010) Reforming public procurement in the Philippines: progress and constraints. Seoul, South Korea. http://www.ippa.org/IPPC4/Proceedings/01ComparativeProcurement/Paper1-14.pdf.
Jones DS (2013) Procurement reform in the Philippines: the impact of elite capture and informal bureaucracy. Int J Public Sect Manag 26(5):375–400. https://doi.org/10.1108/IJPSM-05-2013-0068
Kenny C (2009) Measuring corruption in infrastructure: evidence from transition and developing countries. J Dev Stud 45(3):314–332. https://doi.org/10.1080/00220380803365066
Labonne J, Parsa S, Querubín P (2019) Political dynasties, term limits and female political empowerment: evidence from the Philippines. NBER Working Paper 26431. http://www.nber.org/papers/w26431
Lehne J, Shapiro J, Vanden Eynde V (2018) Building connections: political corruption and road construction in India. J Dev Econ 131:62–78. https://doi.org/10.1016/j.jdeveco.2017.10.009
Magtulis PP, Poquiz JL (2017) Big government, big corruption? examining the relationship between government size and public corruption in the Philippines. Int J Public Adm 40(11):954–967. https://doi.org/10.1080/01900692.2016.1229676
Map Developers 2020 Google Maps Distance Calculator | Map Developers https://www.mapdevelopers.com/distance_finder.php.
McCoy AW (2009) An anarchy of families: state and family in the Philippines. University of Wisconsin Press
Mendoza RU, Beja EL Jr, Venida VS, Yap DB (2016) Political dynasties and poverty: measurement and evidence of linkages in the Philippines. Oxf Dev Stud 44(2):189–201. https://doi.org/10.1080/13600818.2016.1169264
Mendoza RU, Jaminola L, Yap J (2019) From Fat to Obese: Political Dynasties after the 2019 Midterm Elections. Working paper https://papers.ssrn.com/sol3/papers.cfm?abstract_id=3449201
Mendoza RU, Cruz JP (2020) Governing the ‘golden age of infrastructure’: assessing transparency innovations in Philippine infrastructure development. Asian Politics Policy 12(2):175–204. https://doi.org/10.1111/aspp.12527
Mendoza RU, Lim RA, Lopez AO (2015) Grease or sand in the wheels of commerce? firm level evidence on corruption and SMES. J Int Dev 27(4):415–439. https://doi.org/10.1002/jid.3077
Nawaz F, Birdi A (2008) Overview of corruption and anti-corruption in the Philippines. Transparency International
Olken BA (2007) Monitoring corruption: evidence from a field experiment in Indonesia. J Polit Econ 115(2):200–249. https://doi.org/10.1086/517935
Parreno E (1998) Pork. In: Coronel S (ed) Pork and other perks: corruption and governance in the Philippines. pp 32–55
Philippine Government Procurement System (2020) Award notice abstract. Philippine Government Procurement System https://www.philgeps.gov.ph/GEPSNONPILOT/HelpPages/buyercoord/anproceed/help_AwardNoticeAbstractUI.htm
Philippine Statistics Authority (2020a) 2010 Census of population and housing reports | Philippine Statistics Authority http://www.psa.gov.ph/statistics/census/population-and-housing/2010-CPH?page=3
Philippine Statistics Authority (2020b) Poverty Press Releases https://psa.gov.ph/poverty-press-releases
Quah JST (2004) Democratization and political corruption in the Philippines and South Korea: a comparative analysis. Crime Law Soc Chang 42(1):61–81. https://doi.org/10.1023/B:CRIS.0000041038.66924.8b
Quah JST (2010) Curbing corruption in the Philippines: Is this an impossible dream? Philipp J Public Adm 54(1–2):1–43
Quah JST (2016) The role of the public bureaucracy in policy implementation in five ASEAN countries. Cambridge University Press
Querubin P (2011) Political reform and elite persistence: term limits and political dynasties in the Philippines. APSA Annual Meeting Paper 2012
Quimpo NG (2007) THE PHILIPPINES: political parties and corruption. Southeast Asian Affairs, pp 277–94
Ravanilla N (2017) Motives in pork distribution: Partisan Bias or Patronage? Working Paper https://www.nicoravanilla.com/uploads/2/4/1/1/24114923/ravanillamotives_in_pork_distribution.pdf
Republic of the Philippines (2003) Government Procurement Reform Act
Republic of the Philippines (2016) The 2016 Revised implementing rules and regulations of republic Act No. 9184, otherwise known as the government procurement reform Act
Republic of the Philippines (2020) The 2016 revised implementing rules and regulations of republic Act No. 9184, otherwise known as the government procurement reform Act. Official Gazette of the Republic of the Philippines. https://www.officialgazette.gov.ph/2016/08/29/implementing-rules-and-regulations-of-republic-act-no-9184/
Rossi M (2014) Family business: causes and consequences of political dynasties. Working Paper 114 Universidad de San Andres, Departamento de Economia.
Social Weather Stations (2020) Social weather stations. The 13th SWS survey of enterprises on corruption: marked improvement in the fight against corruption in the last six years, But 2016 survey shows some backsliding. Social Weather Stations https://www.sws.org.ph/swsmain/artcldisppage/?artcsyscode=ART-20161005151549
Starkweather J (2014) Factor analysis with binary items: a quick review with examples. https://it.unt.edu/sites/default/files/binaryfa_l_jds_sep2014_0.pdf
The World Bank (2020) Combating corruption. World Bank https://www.worldbank.org/en/topic/governance/brief/anti-corruption
Transparency International (2020) 2019—CPI. transparency.Org https://www.transparency.org/en/cpi/2019
Transparency International (n.d) What is corruption? https://www.transparency.org/en/what-is-corruption
Uchimura H, Suzuki Y (2009) Measuring fiscal decentralization in the Philippines. IDE Discussion Paper 209. Chiba, Japan, Japan External Trade Organization (JETRO) Institute of Developing Economies
United States Department of State (2021) UGANDA 2021 HUMAN RIGHTS REPORT. https://www.state.gov/reports/2021-country-reports-on-human-rights-practices/uganda/
World Bank (2020a) Combating corruption. https://www.worldbank.org/en/topic/governance/brief/anti-corruption
World Bank (2020b) Worldwide Governance Indicators, DataBank. World Bank. https://databank.worldbank.org/source/worldwide-governance-indicators#
Acknowledgements
The authors would like to thank the Ateneo de Manila University for supporting our project. We also thank Daniel Gingerich and the University of Virginia Quantitative Collaborative for providing valuable feedback to an earlier draft of the study. We would also like to thank the reviewers for their valuable feedback to the current draft. The views expressed herein are those of the authors and do not necessarily reflect the views of Ateneo de Manila University.
Author information
Authors and Affiliations
Contributions
DBD: Conceptualization, Writing—Original Draft, Writing—Review and Editing, Methodology, Software, Formal Analysis, Data Curation. RUM: Conceptualization, Writing—Original Draft, Writing—Review and Editing, Supervision. JKY: Methodology, Software, Formal Analysis, Data Curation, Writing—Original Draft, Writing—Review and Editing, Visualization.
Corresponding author
Ethics declarations
Conflict of interest
The authors declare no competing financial or personal interests.
Additional information
Publisher's Note
Springer Nature remains neutral with regard to jurisdictional claims in published maps and institutional affiliations.
Appendix
Appendix
See Figs.
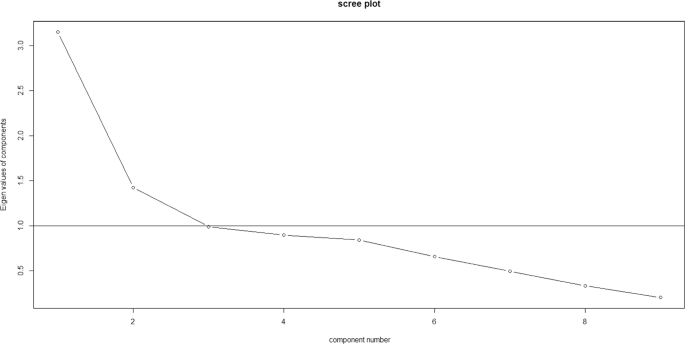
Source: Authors’ own calculations
Scree Plot of the IRT Model.
6,

Source: Authors’ own calculations
IRT Curve for Procurement Mode.
7 and Table
6,
7,
8,
9.
Rights and permissions
Springer Nature or its licensor (e.g. a society or other partner) holds exclusive rights to this article under a publishing agreement with the author(s) or other rightsholder(s); author self-archiving of the accepted manuscript version of this article is solely governed by the terms of such publishing agreement and applicable law.
About this article

Cite this article
Davis, D.B., Mendoza, R.U. & Yap, J.K. Corruption risk and political dynasties: exploring the links using public procurement data in the Philippines. Econ Gov 25, 81–109 (2024). https://doi.org/10.1007/s10101-023-00306-4
Received:
Accepted:
Published:
Issue Date:
DOI: https://doi.org/10.1007/s10101-023-00306-4