1. Introduction
Comprehending consumer behavior is crucial for the prosperity of any enterprise and the success of any business [
1,
2]. Companies need to know what drives their consumers’ purchasing decisions, what factors influence their loyalty, and how they can improve their product or service offerings to better meet their customers’ needs. Consumer behavior analysis is an important aspect, particularly for retailers.
However, the retail sector is a complex and ever-evolving market that heavily relies on customer behavior [
1]. Studying consumer behavior is a complex and challenging task that requires a deep understanding of the factors that influence customer decision-making. Customers are influenced by a variety of factors, including cultural, social, economic, and personal factors, and their behavior is often difficult to predict. Analyzing and understanding consumer behavior allows retailers to stay ahead of their competition, respond better to market changes, and remain competitive in the ever-changing retail sector [
2]. Moreover, customer behavior is constantly evolving, making it difficult to predict future trends. To effectively analyze consumer behavior, businesses need to leverage the power of big data analysis and use sophisticated analytical techniques to identify trends and patterns in customer behavior [
3].
Over the last decade, numerous machine learning-based methods have emerged for predicting consumer behavior. The typical process for predicting consumer behavior in the retail sector involves various approaches. Some researchers directly observe and monitor customers’ physical behavior [
3,
4,
5], while others utilize specific data features to make predictions and analyze large-scale datasets to forecast consumer behavior [
6,
7,
8,
9]. Then, after approaching the consumer, a technical approach is implemented to predict consumer behavior, such as classification [
3,
5,
8,
10,
11], association rule learning [
9,
12,
13,
14,
15,
16,
17], clustering [
15,
18], and other techniques like neural networks [
4,
6,
7].
In this paper, we intend to propose a comprehensive framework that incorporates layers of supervised and unsupervised techniques for studying consumer behavior in the retail sector. One of the paper’s contributions is to study consumer behavior in Saudi Arabia (SA), which has not been well-documented or extensively studied. We could not find much research that specifically studied consumer behavior in the retail sector using machine learning techniques and real data. While some studies [
19,
20,
21] have explored consumer behavior in SA, they have mainly relied on customer-oriented questionnaires/surveys without analyzing real data or consumer buying transactions. Other research discussed in the literature studied consumer behavior, but not specifically in SA.
This paper makes several contributions, including (1) building a framework to analyze consumer behavior in the retail sector; (2) analyzing business needs and identifying demands and performance indicators; (3) applying the proposed framework to real and up-to-date data from one of the biggest supermarket chains in Saudi Arabia as a case study; (4) clustering consumer data and building three consumer clusters, with an analysis of each cluster’s characteristics; and (5) applying association rule learning to each cluster and analyzing the results.
So, in this paper, we propose a comprehensive machine learning-enabled framework for analyzing trends in consumer behavior, gaining insight into the data, and enabling data-driven decision-making. Towards building the framework, we analyzed the business needs and identified demands and performance indicatorsas a case studywith the business owner of one of the biggest supermarket chains in Saudi Arabia. According to Forbes magazine, they are ranked third among the strongest retailers in the Arab world [
22]. The supermarket chain was established in 1956, and its sales volume reached 4.5 billion riyals in 2022 [
23]. They have a large customer base, with over 40 million shoppers in 2013 and over 3 million consumers in their loyalty card system. The retailer we worked with has a loyalty card concept, which greatly helped our research in segmenting and analyzing consumers’ behavior. This gives other retailers the potential to analyze their data using the proposed framework with greater confidence.
The proposed framework is expected to make a significant contribution to the retail sector in Saudi Arabia by providing retailers with actionable insights into consumer behavior. It has been proven that when an organization is able to understand the buying habits of consumers, it becomes easier for them to improve their business performance indicators [
19,
24]. Our research aimed to address this point, and the results and recommendations will improve
marketing performance indicators such as customer satisfaction and customer loyalty. Applying the framework will also improve
financial performance indicators, such as increasing the sales rate of creatine products. Moreover, the performance of
operations will also improve, such as the efficiency of handling and inventory management, among others. These three market indicators represent the application layer shown in the proposed framework. Ultimately, the proposed framework is expected to significantly improve the efficiency, sustainability, and profitability of retail operations.
The paper is organized as follows:
Section 2 provides a literature review and the current state of the consumer behavior domain, establishing the context underlying the analysis of the retail sector, including clustering techniques, association rule learning, and association rule post-processing.
Section 3 and
Section 4 present and discuss the framework development methodology and the proposed framework, respectively.
Section 5 presents some results of the case study and provides a discussion of the findings. Lastly,
Section 6 concludes the paper and provides some future work and research directions.
2. Literature Review
In the past decade, several methods for predicting consumer behavior have been developed based on machine learning techniques. The process of predicting consumer behavior in the retail sector typically begins with approaching the consumers themselves. Some researchers monitor the physical behavior of customers, while others use feature data to make predictions. A third approach involves analyzing big data to predict consumer behavior.
In 2012, ref. [
3] monitored the physical behavior of customers by applying machine learning to functional magnetic resonance imaging (fMRI) data and used unbiased pattern recognition algorithms to pretest and classify marketing communications in order to predict consumer acceptance of new brands, products, and campaigns. Ref. [
3] primarily relied on monitoring the physical customer through brain-imaging techniques. In 2017, ref. [
4] provided a framework for predicting customer churn based on the analysis of customer behavior. The framework consists of six stages, including collecting customer behavioral data, forming derived variables, selecting influential variables, developing prediction models using machine learning, comparing churn prediction models, and providing appropriate strategies based on the proposed model. Ref. [
4] recommended the artificial neural network method for predicting customer churn, as it was found to be the most accurate technique compared to other supervised machine learning techniques. Limitations of the study include the limited data period and the narrow scope of the research data, which was confined to only one grocery store.
In [
5], customer behavior was approached by monitoring physical customers while they were in the supermarket. The authors applied random forest, naive Bayes, and decision tables to predict customer behavior and analyze their preferences. These algorithms were used to understand the buying preferences (likings and dislikings) of different customer sets as well as to analyze the data and have a kind of sentiment classification for each customer’s preferences. For instance, the data in [
5] were collected from a supermarket in the Madurai district to predict customer behavior while in the supermarket. The random forest tree analysis provided the most accurate interpretation compared to the other two algorithms. The authors highlighted the benefits of using the random forest tree classifier for accurate prediction and improved decision-making. However, the notable limitation of this study was the use of only 10 items in the supermarket.
On the other hand, many researchers have approached customer behavior by using big data from purchase transactions. Ref. [
6] compared machine learning techniques for predicting online consumer purchase behavior and found the eXtreme Gradient Boosting (XGBoost) model to be the most suitable for predicting the purchase conversion of online consumers. However, the XGBoost model is still insufficient for the entire retail sector since it can be computationally expensive to train, difficult to interpret, and tends to become over-specialized in the training data. Ref. [
7] used the recurrent deep neural network (rDNN) model for consumer behavior prediction based on big data analysis. The rDNN model had the best prediction effect on consumer behavior when compared to other machine learning models [
7]. However, it lacks interpretability as it is a “black box” model and is computationally intensive and slow to train.
Most retailers compete to understand consumer behavior analysis from big data to establish prominence in the market [
8,
9]. The model employed in [
8] used the J48 decision tree algorithm as a classifier to predict consumer behavior, forming the foundation for making business decisions. The argument presented by [
8] holds that such studies are crucial because they help businesses manage customer relationships and convert a target customer into a lifetime customer. Ref. [
9] applied the Apriori algorithm to online website data to analyze consumer behavior for online shoppers. Understanding the correlation between products, such as A → B, can decode consumer behavior [
9].
Ref. [
10] examined the relationship between consumer behavior parameters and willingness to buy using a time-evolving random forest data mining technique (classifier algorithm). The study showed that the random forest classifier predictions were more accurate than other machine learning algorithms compared in the study. However, random forest classifiers are difficult to interpret, as the individual decision trees used in the model are usually invisible. Ref. [
11] used decision trees, cluster analysis, and the Naive Bayes algorithm to analyze customer characteristics and attributes with historical purchase records. They demonstrated that the prediction effect of the decision tree is better than the clustering analysis and the Naive Bayes algorithm [
11]. However, decision trees are prone to overfitting and the creation of overly complex models, which can lead to inaccurate predictions when generalizing to new data.
Ref. [
25] proposes the adaptive hybridized intelligent computational model (AHICM) as an effective tool to analyze consumer behavior for business development using consumer data from different sources. Consumer data include perception, affect, cognition beliefs, market research, and business strategy to inform choices and preferences. The AHICM was applied to online advertising and consumer buying behavior [
25]. Principal component analysis (PCA), as explored by [
26], emphasizes the importance of maintaining the statistical soundness of a model’s measurement constructs before deducing conclusions. Business marketing researchers find factor analysis a crucial tool for analysis. Factor analysis is similar to structural equation modeling (SEM) but differs only in the methods, purposes, and software packages utilized by each.
In the opposite direction, these advanced technologies may impact buying behavior and intention to purchase. Ref. [
27] examines the impact of advanced technologies in luxury shopping environments on consumers’ perceived brand personality appeal and intention to purchase. Two experiments were conducted, manipulating the level of technological intelligence using voice assistants and smart mirrors. The results show that higher intelligence levels positively influence consumers’ willingness to buy, mediated by perceived brand personality appeal. The effect is also moderated by consumers’ status and consumption orientation. The study provides theoretical and managerial implications for integrating advanced technologies in luxury shopping environments.
Clustering helps retailers better understand their customers and identify trends in their behavior [
28]. Ref. [
29] compares the performance of k-means clustering and hierarchical clustering algorithms on different datasets. The authors found that k-means clustering is more efficient than hierarchical clustering, but it may not be suitable for datasets with complex structures. Clustering is not limited to consumer classification or segmentation; it can be applied to almost any branch of study, such as search engines, statistics, and even astronomy [
26]. Ref. [
30] provides a comprehensive review of the k-means clustering algorithm and its variations. The authors conclude that k-means clustering is a simple and effective algorithm for clustering large datasets, but it has limitations in handling noisy and overlapping data. The k-means algorithm is an unsupervised classification algorithm based on an iterative partitioning approach [
26]. The pre-determined value “k” indicates the number of resulting clusters as well as the number of “k” centroids the technique starts with. Ref. [
31] compares the performance of k-means clustering with other clustering algorithms, such as DBSCAN, hierarchical clustering, and fuzzy clustering, on high-dimensional datasets. The authors conclude that k-means clustering is the best algorithm for high-dimensional data due to its simplicity, efficiency, and ability to handle large datasets.
Table 1 presents a summary of important studies discussed in the literature.
Ref. [
13] focuses on changes in consumer purchasing patterns using the Association Rules technique and the CRISP-DM method as a guide. CRISP-DM is the Cross-Industry Standard Data Mining Process. The study demonstrates the importance of association rules in understanding consumer behavior and making informed decisions in the supermarket business [
13]. According to the study, consumer purchase patterns are diverse and change over three periods of the month. The authors prefer the FP-growth algorithm because it possesses higher computational speed, thus saving time and other resources [
13]. In the retail industry, coupled with clustering, association rule mining extracts useful information from large sets of data to assist businesses in making grand decisions [
16]. In this research, a grouped matrix representation is used to represent association rule results.
Based on the discussions on results obtained by [
12], using association rule learning with the Apriori algorithm, it is possible to decode consumer habits when making purchases with confidence levels between 43% and 80% and a 33–40% value of support. As such, these two are recommended for retailers to arrange products and remain aggressive in marketing. However, the Apriori algorithm is disadvantageous because it needs extra time to sweep the entire database in iterations to provide efficient results. Additionally, it may generate irrelevant rules or many rules that lead to contradictions in accurate prediction. Ref. [
32] applies the Apriori algorithm, FP-growth algorithm, and k-means clustering to decode patterns from big-size data. Although each consumer behaves distinctly, there are similarities in motives for shopping among people. Several other studies have employed the Apriori data mining technique to gain insight into transaction association rules in market basket analysis. Notably, the k-means clustering algorithm is the elbow approach to uncovering the ideal K to apply in customer segmentation [
14]. As a partitional algorithm, selecting the centroid value and the initial number of k-groups is crucial for generating a cluster database iteratively.
Ref. [
15] used recent web log data to gain insight into consumer preference patterns and assist in the managerial-level business decision-making process. This research used clustering and association rule learning techniques and aimed to find the access patterns of users on the web log server. The DBSCAN algorithm and the Apriori algorithm were used for clustering and association rule generation, respectively. This research outlines that clustering minimizes the size of datasets by introducing clusters for association rule learning. The authors further argue that applying association learning to small data clusters increases efficiency and takes less time than when applied to extensive, large data [
15].
In an electronic setting, bridging the gap between predicted consumer and product characteristics is crucial. When dealing with a website, refs. [
18,
33] applied clustering algorithms to review the relationship between predicted consumer and product characteristics. Ref. [
18] extracted the appropriate patterns for a customer using web clickstream data, which the organization uses to produce a customized experience for the customer.
Ref. [
17] used the RapidMiner tool to extract association rules from a given dataset. Results indicate that different cities across the Kingdom of Saudi Arabia have different items preferred by the majority [
17]. The researchers mainly focused on exploring frequent patterns in the given dataset. Establishing a correlation between consumer behavior and health issues was one of the suggested future works in this research, which proved to be a challenge [
17]. Finally, ref. [
34] features a survey backed by the applications of intelligent market basket analysis. Notably, market trends have dramatically shifted in the recent past as consumers struggle to compete for market share using business analysis techniques. One of the suggestions raised by [
34] is to maximize business profit by encouraging the use of different market basket analysis techniques, such as the association rule.
The post-processing of association rules is marked by challenges in finding interesting patterns from the data owing to the many rules generated [
35]. Traditionally, the user was required to understand what might be interesting before the commencement of post-processing processes. Ref. [
35] explores a general process of using association rules to extract users’ knowledge in the post-processing phase. The transudative post-processing approach selects some rules that the user considers to have the most impact on the network [
35]. The rules are subjected to the network’s transudative learning algorithms to propagate the classes not classified in the network. For this approach, the rules highlighted by the user are considered as important as the rules analyzed by the classifier. The approach helps reduce the number of rules and, in the process, creates ranks to guide the user on what they think is important.
Ref. [
36] also notes the difficulty of post-processing association rules and proposes the PAR-COM (Post-processing Association Rules with Clustering and Objective Measures) methodology. It is a hybrid method that combines clustering and objective measures to overcome the problem. This aims at reducing association rule exploration time. Refs. [
37,
38] also suggested using clustering on top of association rule learning as a means of realization. Refs. [
39,
40,
41,
42] use domain ontologies to increase the usefulness of association rules in data mining. This approach to ontologies is mainly based on pruning and filtering the rules, thus strengthening the integration of user input in post-processing. Ref. [
39] uses iterative and interactive frameworks to assist the user in the task of analysis. Using rule schemas and user belief representations coupled with ontologies improves the efficiency of rules. Furthermore, the study suggests the development of the rule schema formalism and integrating the approach into the discovery algorithm.
Refs. [
38,
43] suggest a meta-learning-based approach for the post-processing process of association rules. This intends to enable the generation of rules to help decode relationships. The number of meta-rules should be significantly smaller than the number of original rules to facilitate the interpretation of the original rules. Ref. [
43] used the Weka tool to run the experiment with large datasets from the UCI machine learning repository.
A number of articles explore the post-processing of association rules using different proper assessments of usefulness (a hybrid approach) [
36,
38,
40,
41,
44]. Ref. [
44] explores the essentials of algorithms, including identifying all large sets (minimum support) and discovering all derived associations (minimum confidence). The study rests on the semantics of the support–confidence framework and looks for association rules containing a specified set of items [
44]. The support–confidence-based association rule produced difficult-to-understand correlations. The main issue is that there needs to be more clarity on the best way to act upon the results produced by the algorithm. The generation of a multitude of rules overwhelms the interpreters. The post-processing phase in [
44] includes pruning, summarizing, grouping, and visualization. The article explores dealing with various forms of data redundancy, such as “subsumed rules,” where it means if we have r1 = A,B→C and r2 = A→C that means whenever r1 holds, then r2 also holds. Ref. [
45] suggests a measure called the minimum amount of improvement = conf(rl) − conf(r2). When this amount exceeds a certain user-defined threshold, it could be interesting to keep both rules.
3. Framework Development Methodology
The framework was developed in cooperation with one of the largest supermarket chains in the retail sector in Saudi Arabia. So, it is about retailing, and single-channel behavior is investigated in a physical channel only (no online channel). To achieve this goal, we went through four main phases, as shown in
Figure 1.
Phase 1: Our methodology begins with the requirements phase, during which we conducted several meetings with the business owner to understand the organization’s workflow and current situation. Next, we worked with the business owner to identify the current business needs related to understanding consumer behavior by investigating available slots/areas for applying different machine learning techniques. During this step, we discussed questions such as: Do you have a supply–demand methodology for your products? What types of products are difficult to sell, and would understanding associated products help? Would you like to divide your consumers into classes and study their behavior? To what extent would understanding consumer buying behavior or product buying likelihood be helpful?
The output of this phase was a list of requirements. These requirements can be summarized into three main points: (1) dividing consumers into three classes; (2) studying consumer behavior based on these classes; and (3) post-processing results in a way that can be understood by stakeholders such as marketing managers, executives, and IT department managers. To help the business owner identify customer groups, we suggest using unsupervised machine learning techniques such as clustering with k = 3. To help arrange shelves, we suggest studying item correlation patterns using association rule learning techniques for each class. In addition, the business owner needs to understand patterns of behavior, which requires post-processing of the results.
Phase 2: Business analysis phase, during which we analyzed the requirements and investigated how to apply them. In this stage, we specified the exact attributes required in the requested datasets, including the loyalty card program dataset, data hierarchy dataset, and the two transaction datasets. Additionally, we conducted several meetings and survey questionnaires with the business owner and the team (including top managers from each department and senior employees) to determine how the results and recommendations of the framework would be applied in a real-world setting (supermarket) and what possible changes could be implemented.
Table 2 summarizes the survey results, showing the changes that were selected by 60% of the survey respondents, along with the targeted sub-functions and the exact changes that were identified.
Phase 3: The framework construction phase, during which the development of our framework was constructed as a spiral model in cooperation with the business owner. We aligned with them in each cycle and reviewed their feedback repeatedly. The output of this phase is the proposed framework, which is presented in the following
Section 4.
Phase 4: The final phase is the evaluation phase, during which we execute the proposed framework and evaluate its results. However, this phase also includes the discussion of the evaluation strategy with the business owner and how we can measure the impact in terms of the three market performance indicators: operation, marketing, and finance. To achieve this, we conducted several meetings to discuss and negotiate. Additionally, in this phase, we used a short survey questionnaire to agree on a list of suitable KPIs for measuring the framework’s impact.
Table 3 shows a summary of the survey results.
4. Proposed Framework
In this paper, we propose a multi-layered framework for analyzing consumer behavior in the retail sector or any other sector. The proposed framework is a comprehensive and generalized approach to analyzing consumer behavior and improving various market performance indicators.
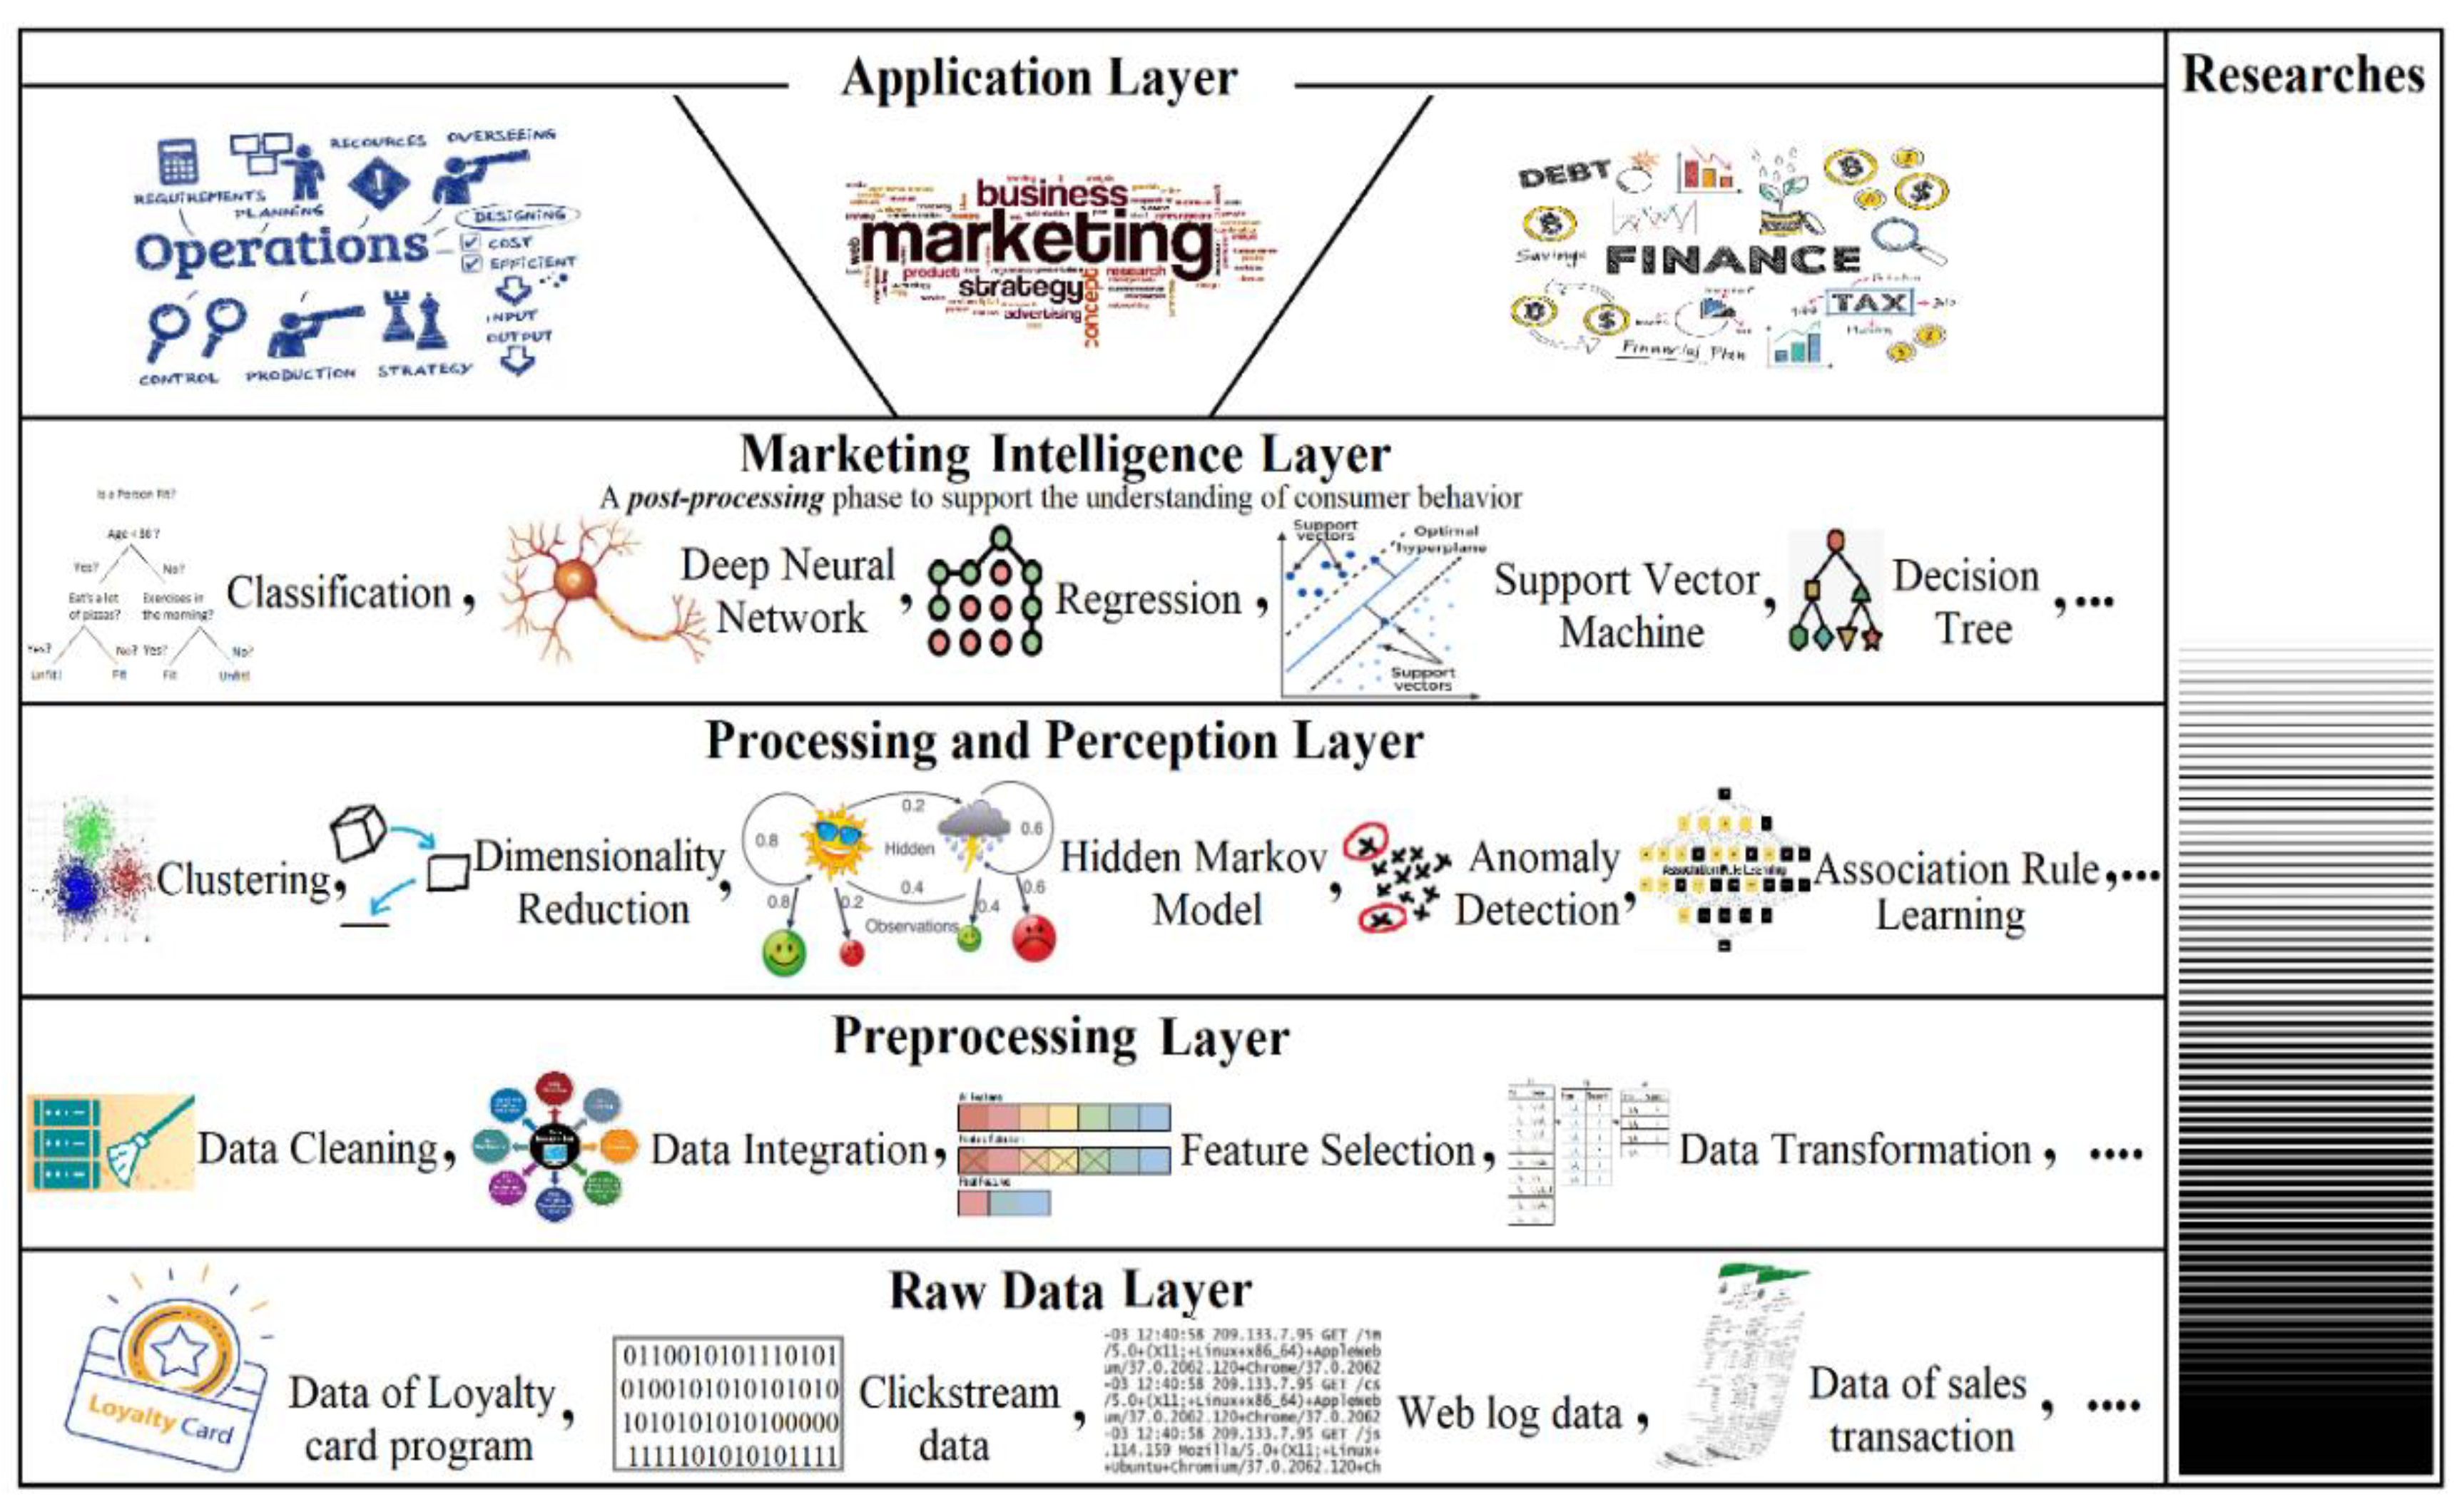
Figure 2 illustrates the proposed framework as a system layer.
The philosophy behind building a consumer behavior analysis framework as a system layer is to provide a standardized and consistent set of tools and methods for analyzing consumer behavior from different data sources. This can help organizations integrate their data sources more effectively and gain a more comprehensive view of their customers. To illustrate the comprehensive nature of our framework, it is worth noting that some researchers tend to stop at a certain layer; the figure’s right side indicates the approximate amount of research conducted against the presented system layers. Notably, several research studies discussed in the literature review section have been conducted on consumer behavior analysis in the retail sector up to layer 3. Moreover, a few of these studies combined more than one technique in layers 2, 3, and 4. By leveraging the power of machine learning, our framework aims to combine all these layers to enable retailers to identify and understand their customers’ behavior, uncover trends in purchase behavior, and reveal relationships between products and customers.
The first layer presents the raw data layer, which can be sourced from various data sources such as loyalty program data, clickstream data, web log data, and more. The second layer presents the preprocessing layer, where the data are cleaned, integrated, transformed, and more. This is followed by the third layer, which employs processing and perception techniques such as clustering, dimensionality reduction, association rule learning, and more. The fourth layer is a kind of prediction and post-processing layer that supports understanding consumer behavior and combines different techniques such as classification, regression, support vector machines, and more. Finally, the application layer presents the areas targeted to apply the results.
Data interpretation, or data mining, has revolutionized many business sectors by uncovering meaningful patterns and relationships through the utilization of large amounts of data [
46]. The preliminary steps involve gathering and preparing the data before engaging in actual processing and mining. Subsequently, the data are subjected to analysis in order to draw conclusions [
46]. In this paper, we apply the complete framework to a supermarket owner as a case study in Saudi Arabia’s retail sector to demonstrate that the proposed framework can be applied to any sector toward a better understanding of consumer buying behavior and enhance business performance from various aspects such as building effective marketing strategies, providing future predictions, and making informed decisions.
Below is an explanation of each layer in the framework based on the case study of the supermarket, which is a part of the retail industry.
4.1. Layer 1: Raw Data Layer
We obtained three datasets in CSV format as raw data from two dataset repositories: the consumer loyalty card repository and the historical transaction repository. The datasets are as follows:
Loyalty Card Program Dataset: This dataset contains information on 29,347 active consumers, including eight variables as follows: CUSTOMER_KEY (Integer variable), CITY (text variable), NATIONALITY (text variable), JOB_DESCRIPTION (text variable), AGE, GENDER (Binary variable), Avg_VISIT (float -non integer- variable), and Avg_SPENT (float -non integer- variable).
Three-Month Transaction Dataset: This dataset contains information on the transactions of each consumer in the loyalty card program during a three-month period (from 1 January 2022, to 31 March 2022).
Branch 28 Transaction Dataset: This dataset contains information on all transactions that occurred at Branch number 28 during the same three months.
4.2. Layer 2: Data Preprocessing Layer
In total, we obtained around one million data records. For data preprocessing, we used a PowerEdge Server 2900 with an Intel® X®(R) CPU and two main processors. In this layer, we performed two main functions for data preprocessing: data cleaning and data transformation.
In the data cleaning, we removed any missing or incorrect data records and ensured that all datasets were in the first normal form (1NF). In data normalization, 1NF is a property of a relation in a relational database where no attribute can be derived from another attribute as a value (or no repeating groups) [
47]. After the data cleaning, we applied the transaction reduction technique (TR) for algorithm relaxation. This technique was applied only to the two datasets of the store’s transactions, where we deleted any transaction that had less than two products, as these transactions would cause an overhead to the algorithms. This technique was discussed in [
48]. For data modeling, we used Transaction Encoder to map the dataset into a binary item list, or NumericToNominal dataset. NumericToNominal is a binary dataset having values of either 0 (not purchased) or 1 (purchased).
4.3. Layer 3: Processing and Perception Layer
This layer is the backbone of the framework, where the technical part is applied. In this layer, we implemented two machine learning techniques as follows:
Consumer clustering is a powerful tool for understanding consumer behavior characteristics [
29]. Clustering provides an initial direction of consumer behavior in each segment and helps guide the findings of the next step. Studies [
29,
30,
31] have shown that the k-means clustering algorithm is the best clustering algorithm for text datasets. Therefore, we used the k-means algorithm in this step with K = 3, as specified in the requirements.
The resulting three consumer classes provide an initial direction for consumer behavior. Then, for each class, the association rule learning technique is applied using the FP-growth algorithm. This enables retailers to make more informed decisions and better understand the needs of their consumers. The results of both clustering and association rule learning are discussed in the Results and Discussion Section.
These two techniques are key components of the proposed machine learning framework for predicting consumer behavior in the retail sector. Clustering helps identify customer segments and uncover relationships between customers [
11]. Association rule learning can be used to uncover relationships between products and customers [
49]. By using these techniques in combination, the framework can provide valuable insights into consumer behavior in the retail sector, which can be used to make more informed business decisions.
4.4. Layer 4: Marketing Intelligence Layer
The marketing intelligence layer is a post-processing stage on top of the processing and perception layer that supports the understanding of all results and produces more valuable findings. In the area of association rule learning, the usefulness of association rule learning is strongly limited by the huge number of generated rules. Ref. [
50] shows that the resulting association rules become almost impossible to use when their number exceeds 100. At the same time, some interesting rules are represented by those rare (low-support) rules. Unfortunately, the lower the support, the larger the volume of rules becomes. Thus, it is crucial to provide business owners and decision-makers with efficient and intelligent post-processing techniques to reduce the number of rules.
In the use case of this study, we found 214 rules with a minimum support value of 0.5 (threshold), 578 rules with a minimum support value of 0.3, and 1209 rules with a minimum support value of 0.2. What if we set the minimum support value to 0.05 or lower? However, 214 rules are still almost certainly too many to provide actionable insights!
The marketing intelligence layer can support the understanding of association rule results, help identify the most valuable rules, predict some classification of the resulted rules, and more. This layer, along with the exact technique used for association rule learning post-processing, will be part of the future work of this study. Currently,
Table 4 summarizes the different techniques discussed in the literature review section for association rule post-processing.
4.5. Layer 5: Application Layer
The last layer is the application layer, where the results and recommendations are applied to the supermarket by the business owner toward improving three market performance indicators: operation, marketing, and finance.
5. Results and Discussion
This section presents the result and discussion of the third layer in the proposed framework, which is the processing and perception layer. In our case study with the business, we applied an unsupervised data clustering technique using a k-means algorithm to find the consumer clusters (see
Section 5.1 below) and association rule learning using the FP-growth algorithm (see
Section 5.2 below).
The availability of results from this case study for other types of retailers would depend on the similarity of retail types. In this section, we present some results of the framework, but it is important to note that some results, such as the post-processing results, will be part of future work.
5.1. Consumer Clustering Results
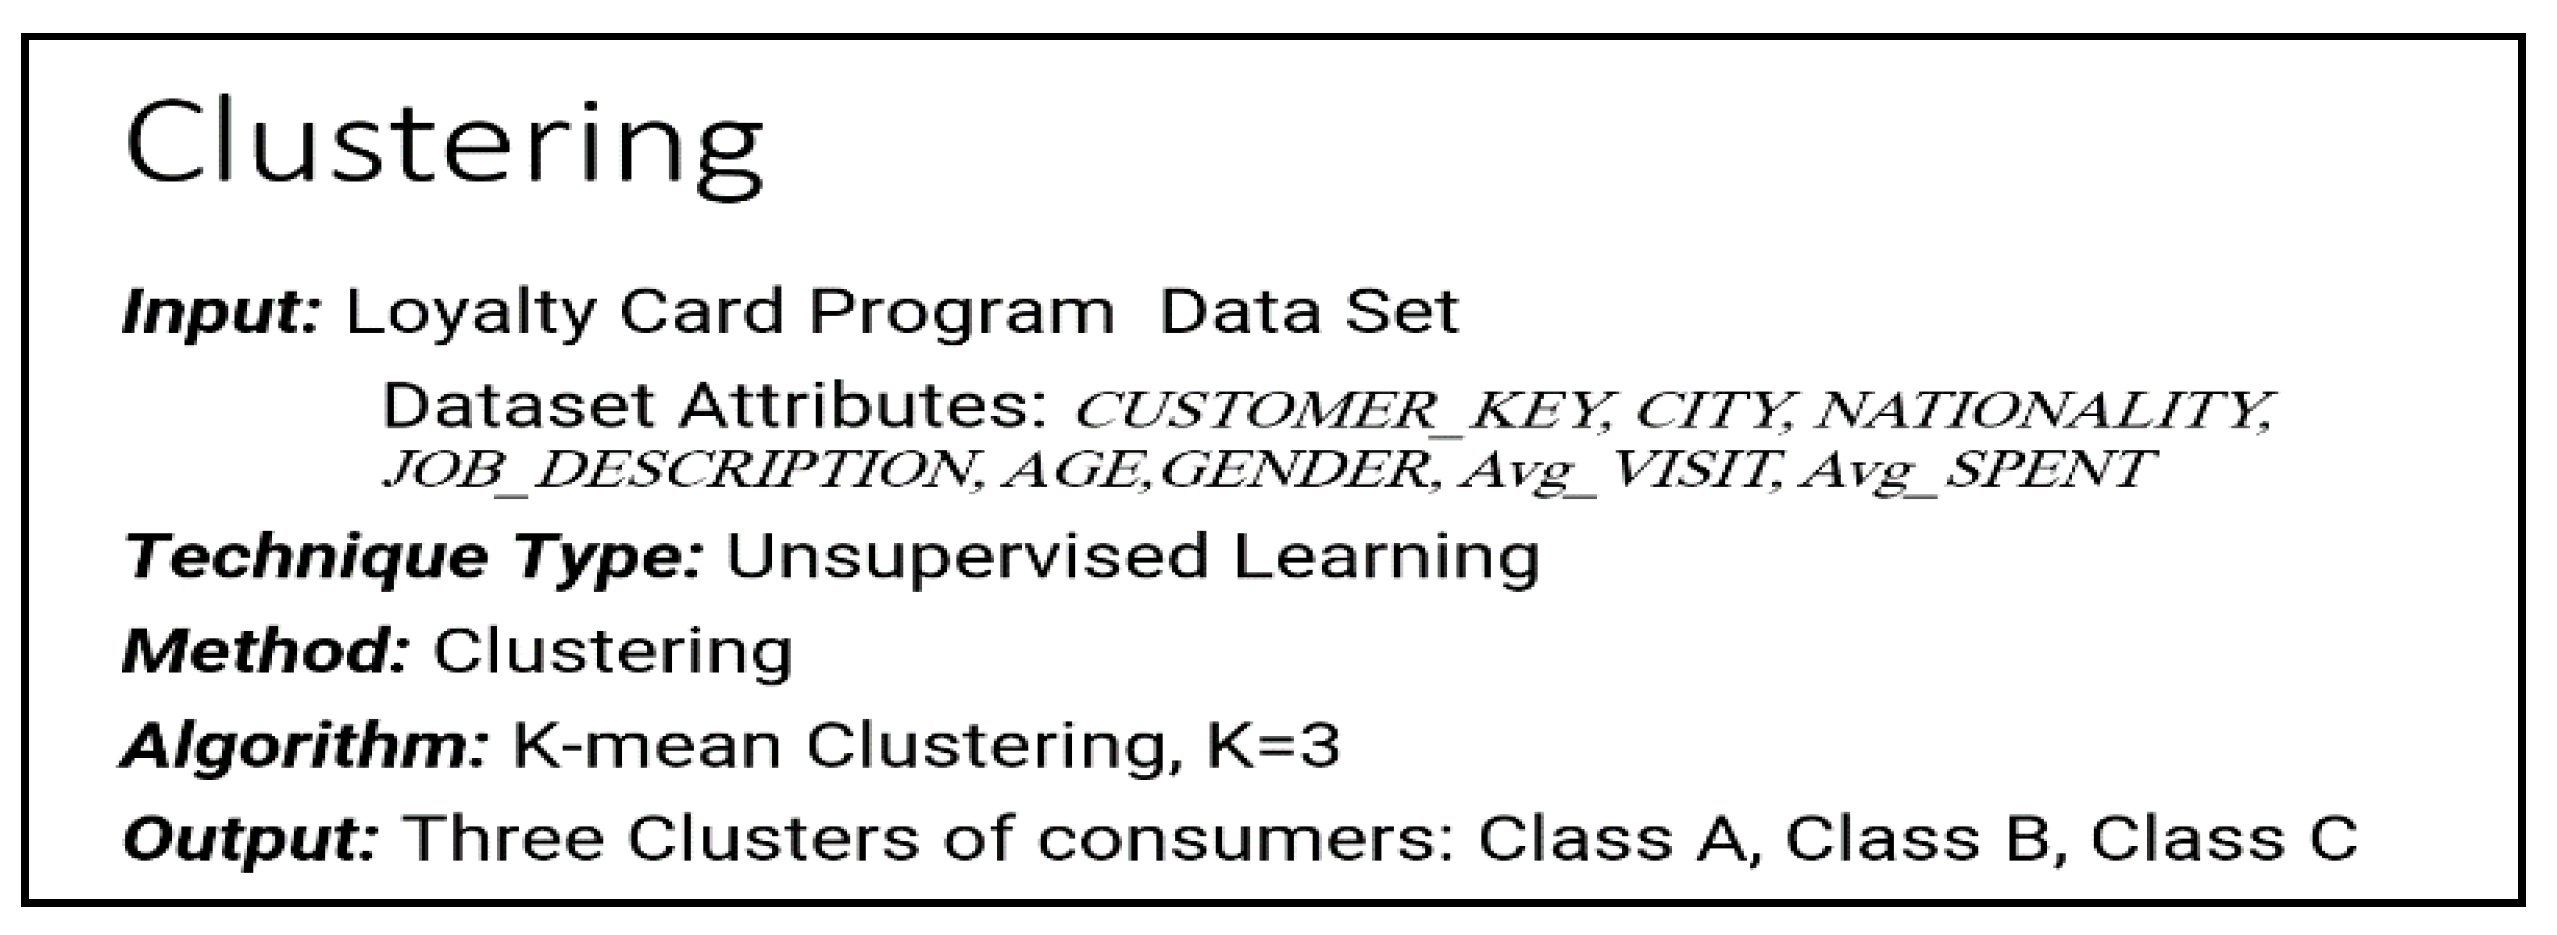
In order to classify the loyalty program’s consumers into three classes, namely Class A, Class B, and Class C (as specified in the requirements), we employed the k-means clustering algorithm with k = 3 on the dataset of 29,347 active consumers’ information from the Loyalty Card Program repository.
Figure 3 shows a summary of the clustering results:
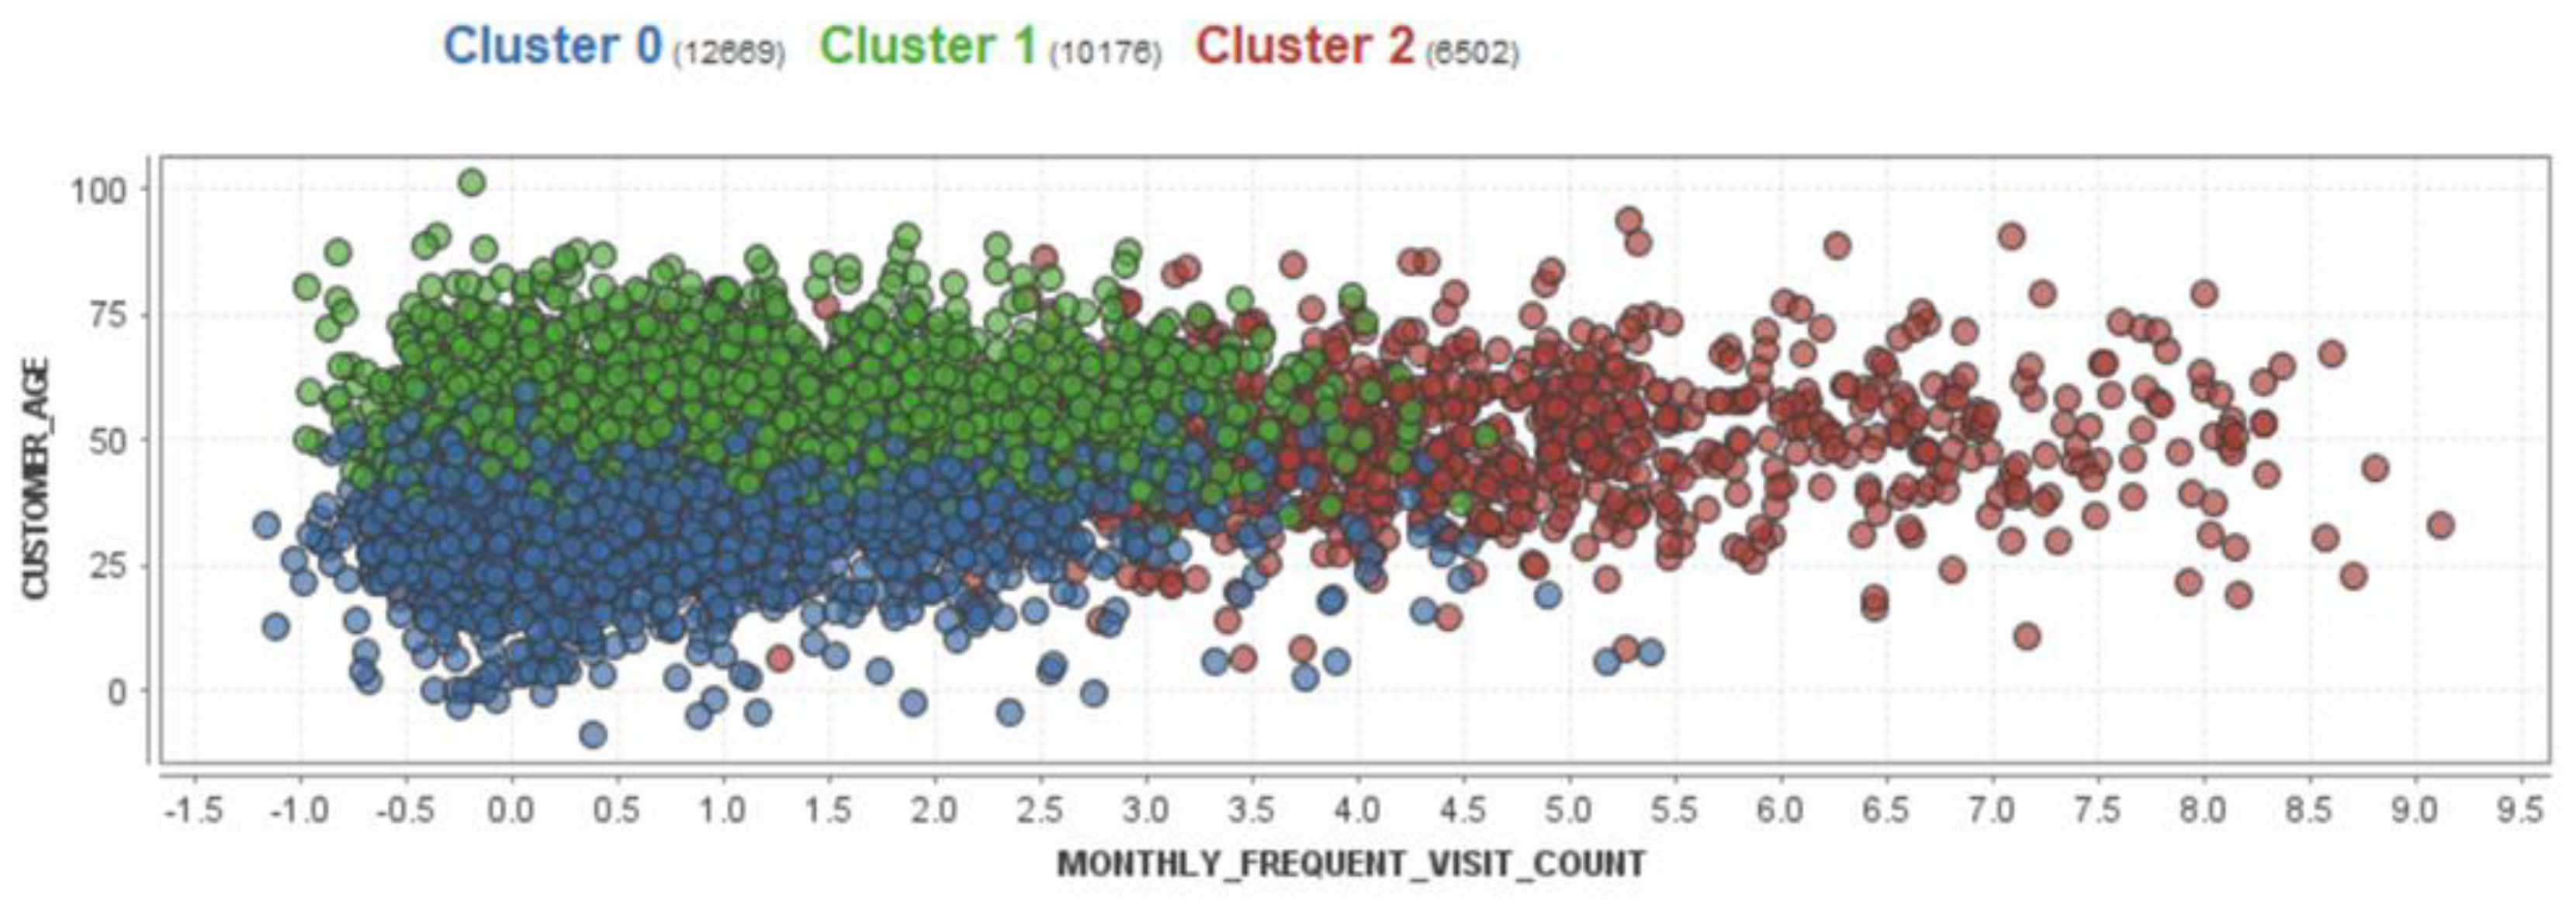
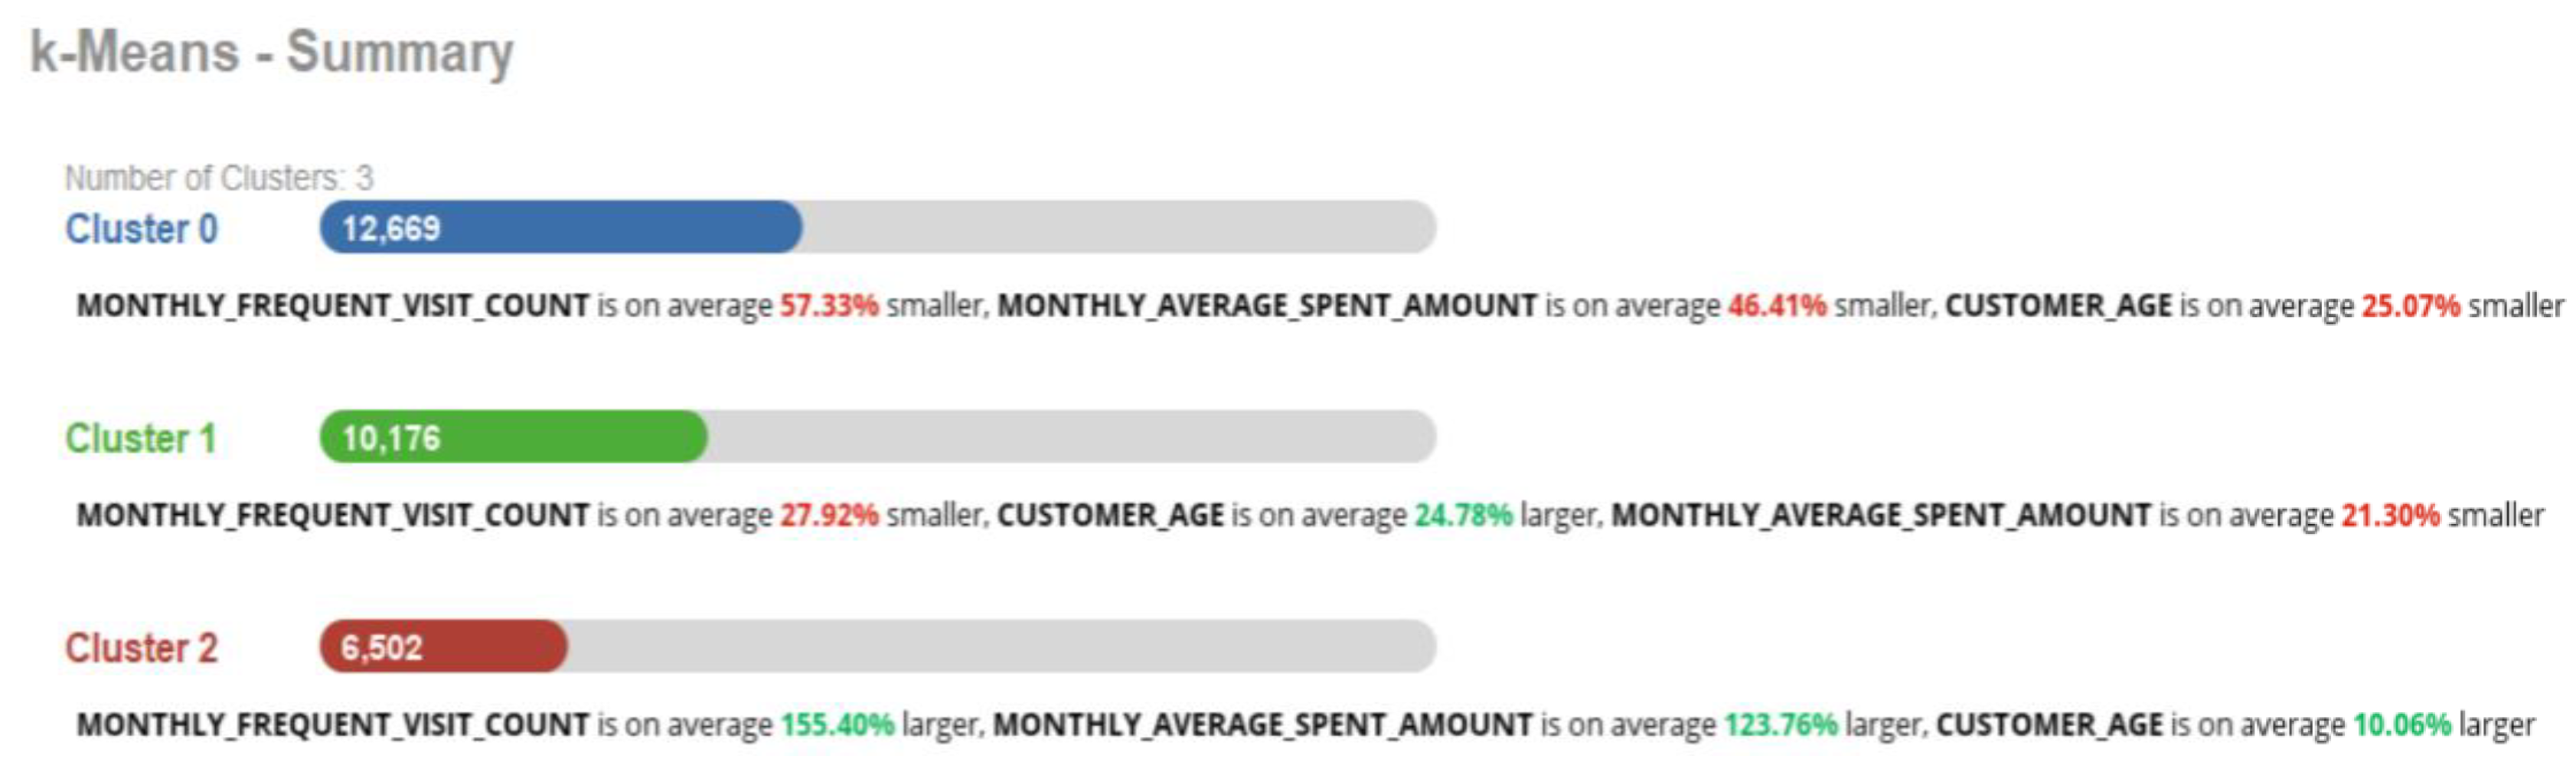
Figure 4 displays a scatter graph of the clusters, where the three clusters are represented as points with different colors, and each data record is assigned to its corresponding cluster. On the other hand,
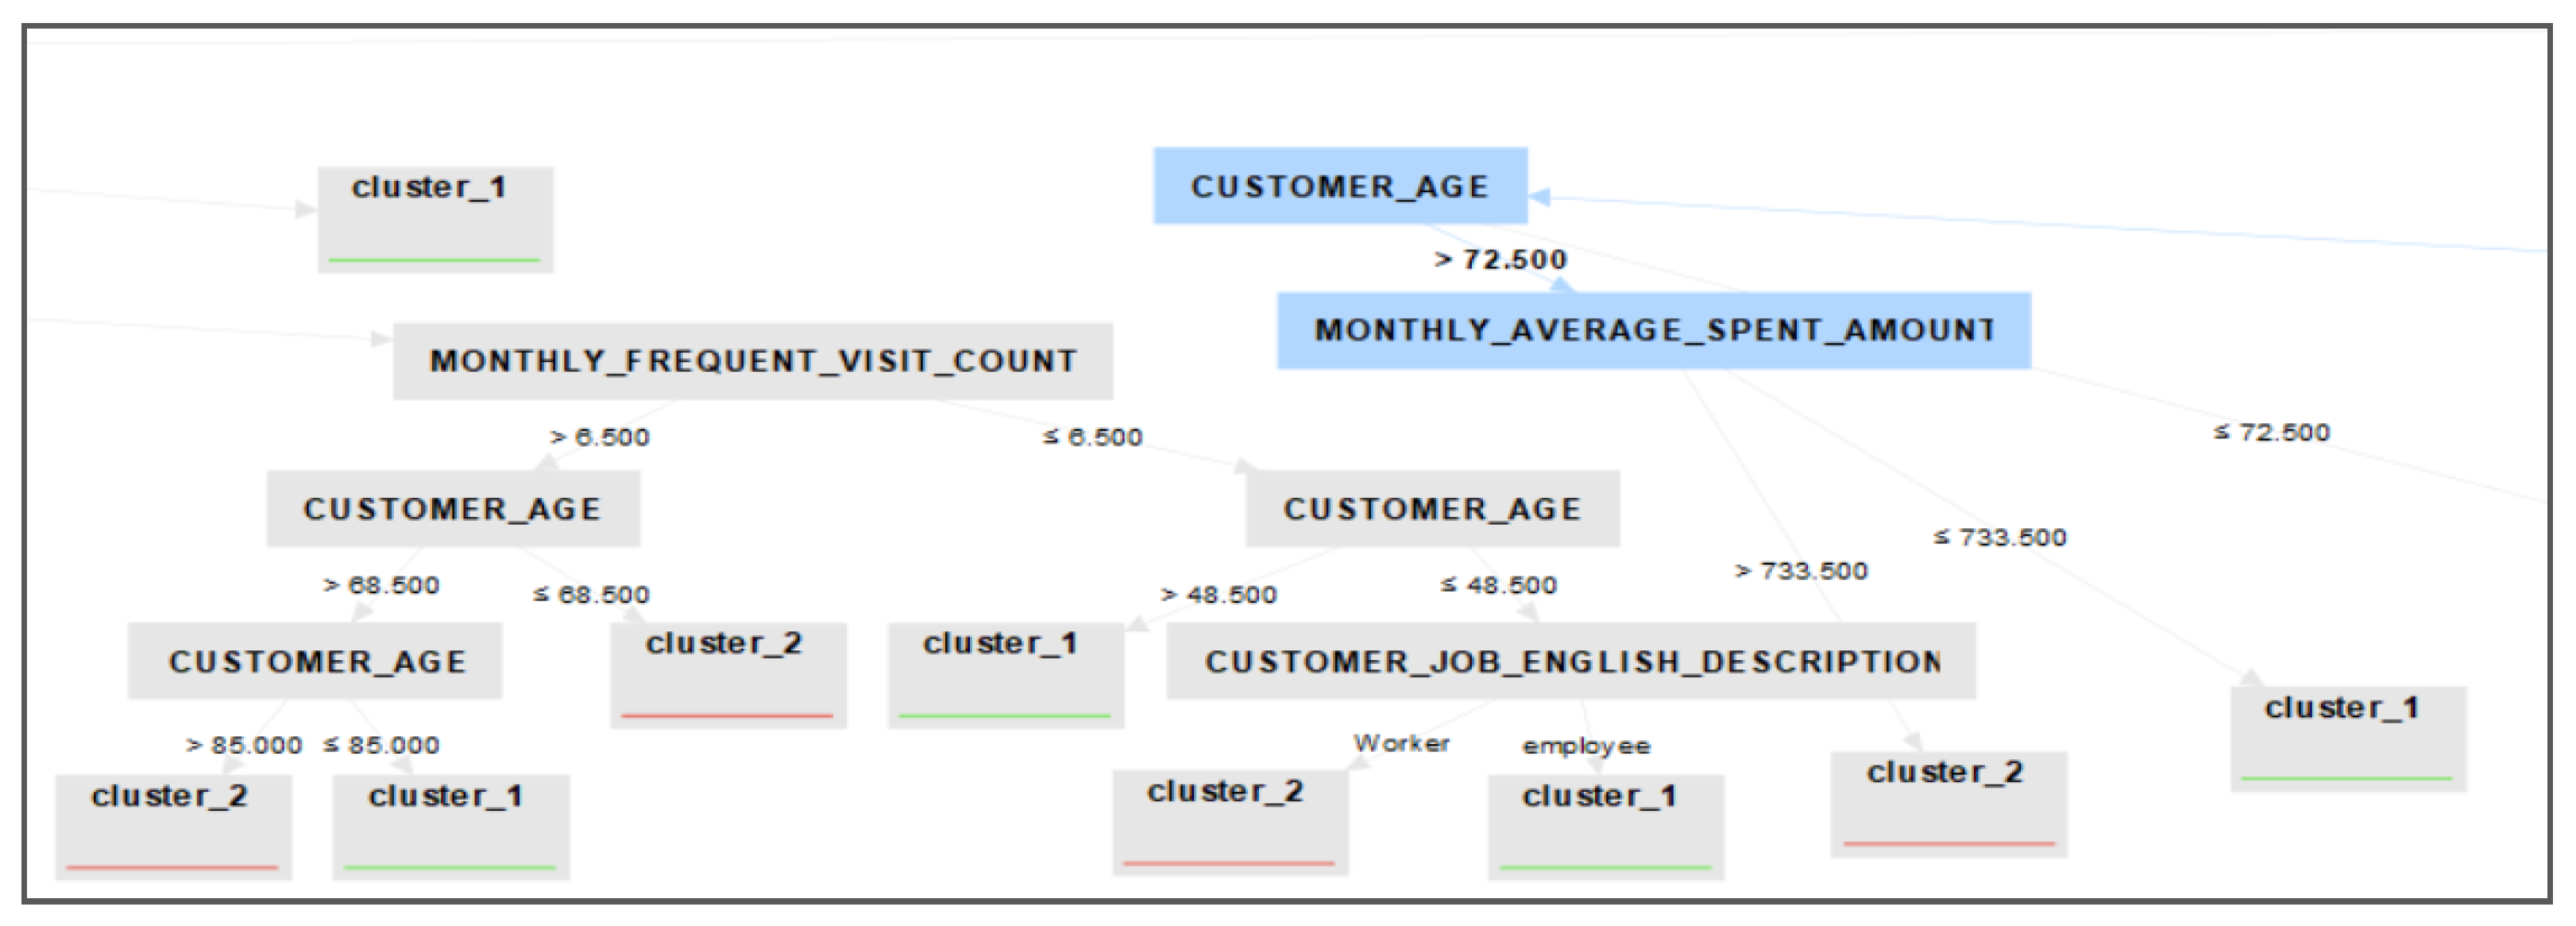
Figure 5 provides a summary of the clusters and more detailed information for each of them, including the number of data records and the percentage of each attribute related to each class. In Cluster 0, the MONTHLY FREQUENT VISIT_COUNT is, on average, 57.33% smaller than other clusters, while in Cluster 2, the MONTHLY FREQUENT VISIT_COUNT is, on average, 155.4%, and that is clear because the average monthly visit in this cluster is 4.75 visits per month, while in Cluster 0, the consumers visit less than once a month on average, with an average of 0.398 visits per month. According to the clustering results and the centroid table, the two most correlated attributes are MONTHLY FREQUENT VISIT_COUNT and MONTHLY AVERAGE SPENT_AMOUNT.
Furthermore,
Figure 6 displays the clustering tree, which clearly shows how each data record is assigned to its corresponding cluster based on all attributes.
Class 2 represents Class A, Class 1 represents Class B, and Class 0 represents Class C. Based on all the clustering results, we can summarize the findings as follows:
Based on
Table 5 and
Figure 7, there are some valuable findings and conclusions about consumer behavior that can be drawn from the clustering results. These findings can be summarized as bullet points:
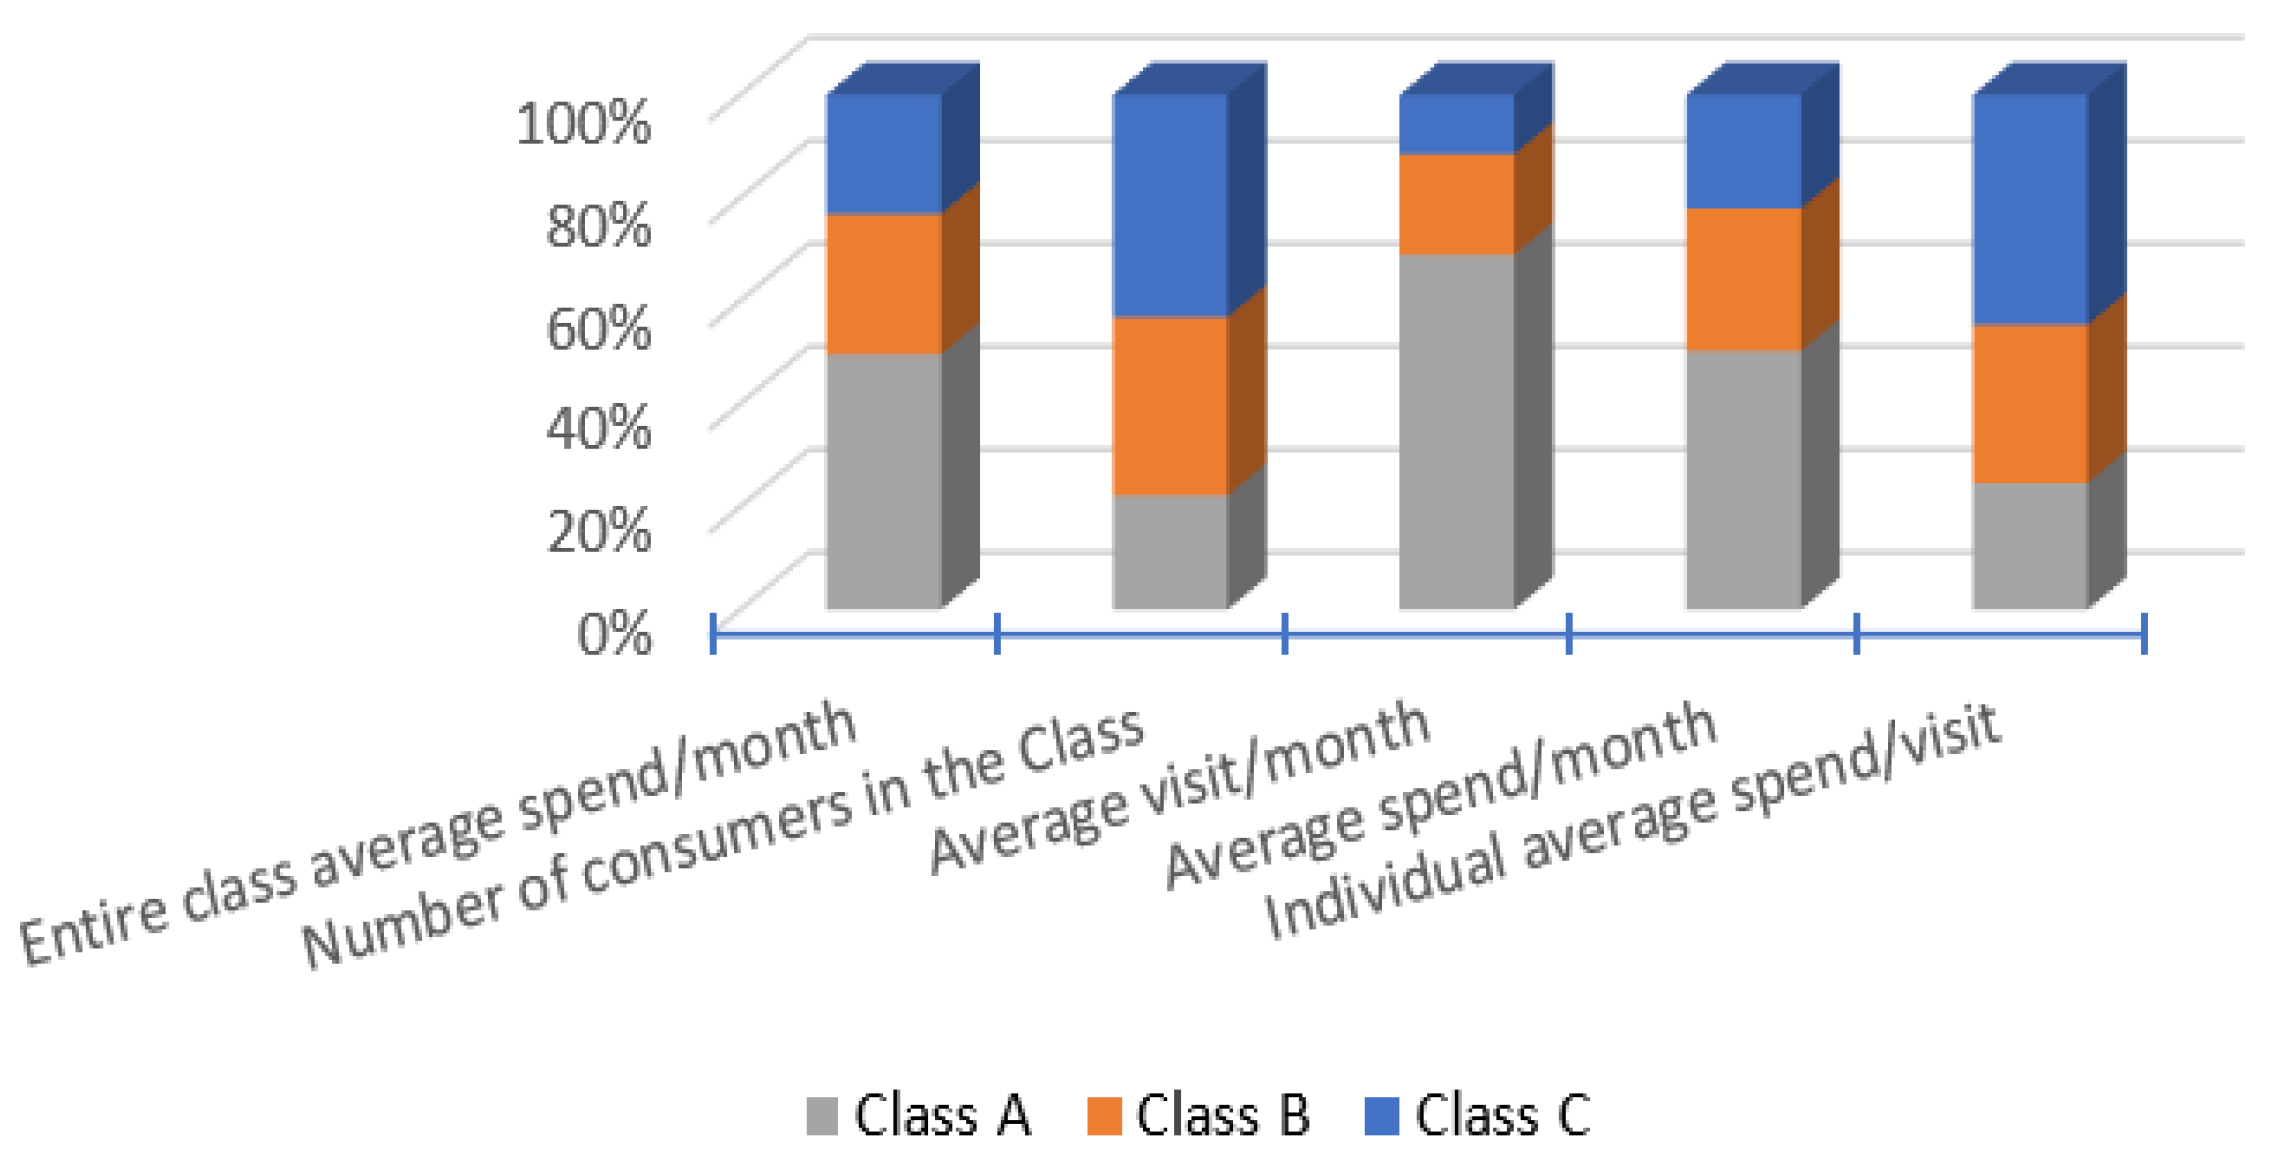
The average spend of all loyalty card program consumers is 448.0455 SR, and the average visit rate is 1.8705 per month. However, there is a significant divergence in the individual classes’ average spend per month. Class C spends an average of 2+ million, Class A spends 5+ million, and Class B spends 3+. Even though Class B and C share a similar average visit rate and average spending, Class A stands out. This indicates there might be a slight issue with Class A.
The average spend per individual per month in Class A is almost three times higher than in Class B, indicating a significant difference in purchasing power between these two classes.
The data indicate that consumers who visit more often tend to spend more, both on average per month and in total aggregate spending. However, Class C has the highest spending rate per visit, followed by Class B, then Class A. This trend makes sense since consumers who visit less frequently are more likely to spend more per visit. As shown in
Table 5 and
Figure 7, Class C spends 315.8 SR per visit, which is the highest amount compared to the other classes. The problem is that Class C has a low visit rate per month despite having the highest number of consumers, indicating that this class is likely the largest segment of the supermarket market. Therefore, if the retailer can find a way to encourage Class C to make more visits, this will increase sales dramatically. This could be achieved through a loyalty program or other incentives designed to increase consumer visits and encourage loyalty.
The difference in average spend per visit per individual between Class C and Class A is also significant, with Class C spending almost 50% more than Class A on average during each visit. This may indicate that Class C is more value-conscious and tends to purchase in larger quantities during each visit to maximize their spending power.
The aim is to move consumers from Class C to Class B and from Class B to Class A, but the question is how to achieve this. One possible solution is to use association rules to increase the number of visits for each class. In conclusion, although Class C does not visit frequently, when an individual consumer does make a visit, they tend to spend more than in Class A and Class B, resulting in higher sales. Therefore, the retailer should focus on increasing the visit rate for Class C by offering incentives or other loyalty programs to encourage them to visit more frequently. By doing so, the retailer can increase sales and potentially move some consumers from Class C to Class B or even Class A.
5.2. Association Rule Results Based on Consumer Classes
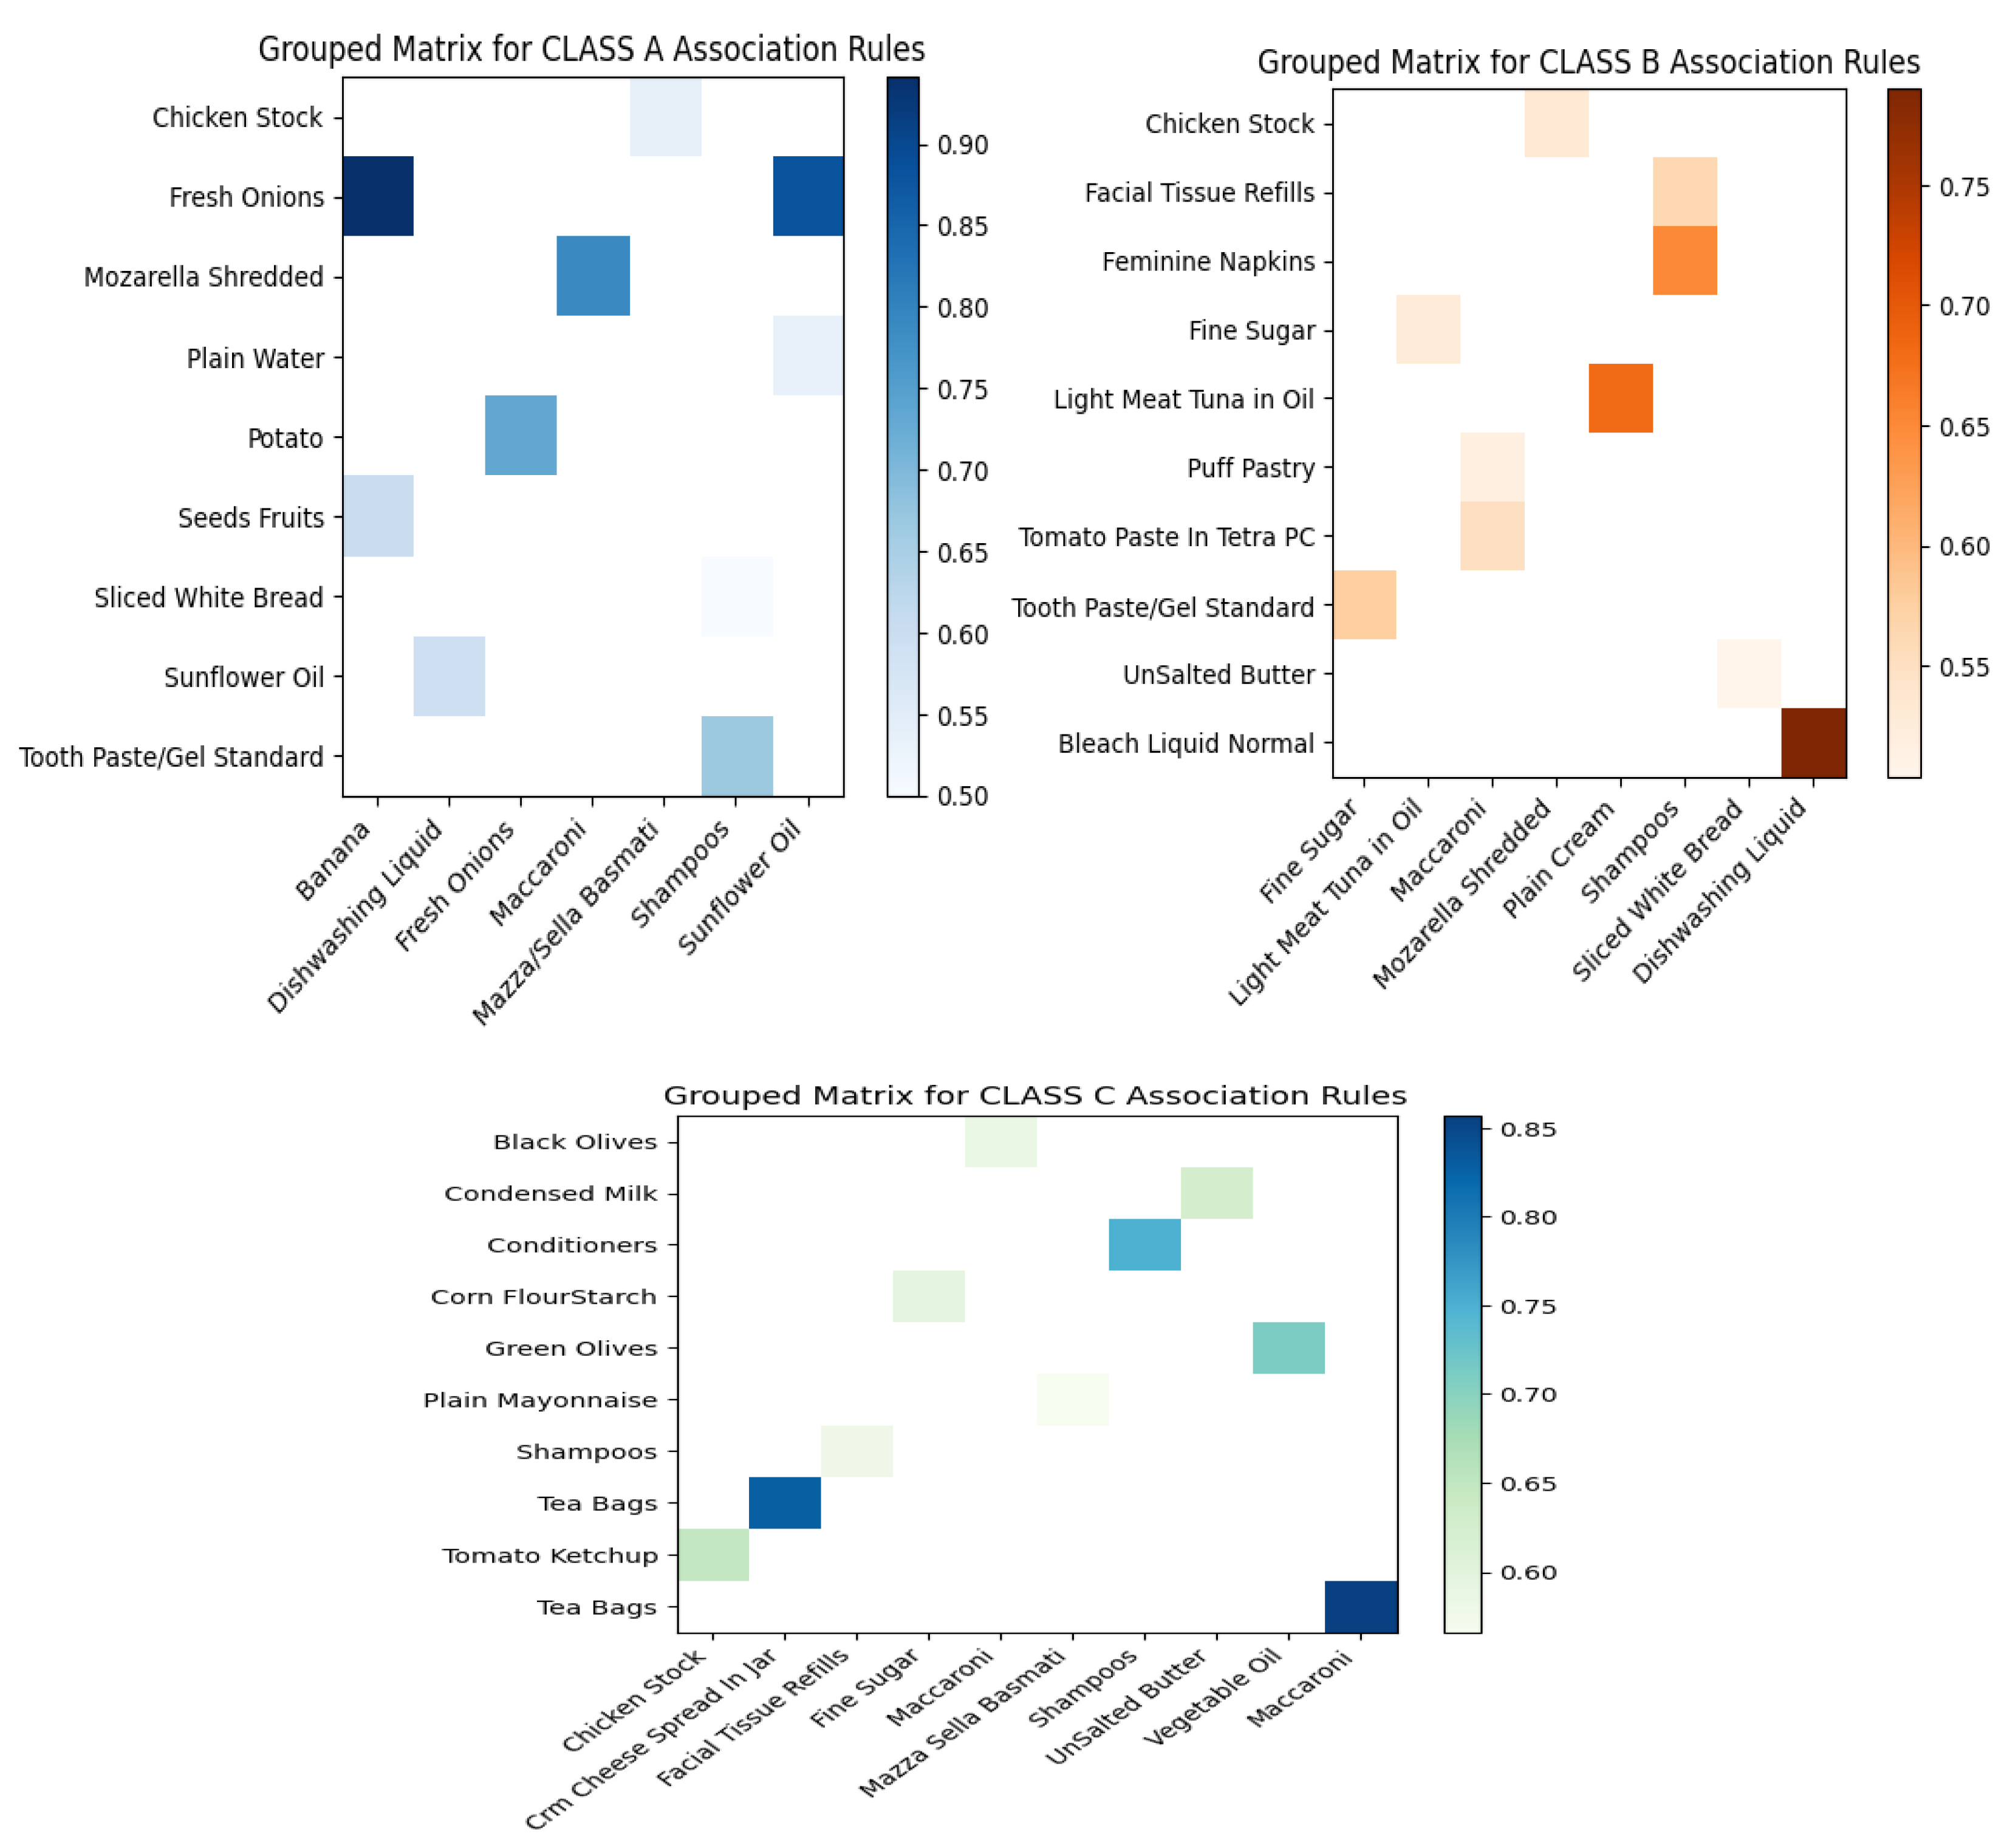
This subsection also presents a result of the third layer in the proposed framework, which is the processing and perception layer. We applied the association rule learning algorithm to each consumer class to perceive or find out the buying behavior of each consumer class. In this section, we utilized two Python libraries, pandas and matplotlib.pyplot, to present the association rule results for each consumer class in a heatmap visualization graph. We converted the list of association rule results into a Python dataframe with three dimensions: antecedent, consequent, and confidence level (guarantee). We then displayed some rules with different confidence levels for each consumer class: classes A, B, and C, as shown in
Figure 8. In those three classes’ results, we can notice the behavior differences in consumer buying behavior and purchasing habits. The complete image of the resulting association rules indicates that there are differences in the purchasing behavior of consumers in each class. When looking at the association rules and the products that appear in them, it appears that the purchasing behavior of consumers in each class differs. For example, Class A consumers tend to purchase more fresh food items, such as fresh potatoes, fresh onions, and fresh bananas, which may suggest healthier behavior. On the other hand, Class C consumers tend to purchase more unhealthy food items, such as fine sugar, condensed milk, mayonnaise, and cream caramel, which may suggest less healthy behavior.
In
Figure 8, the y-axis represents the right-hand side (RHS) of the association rule, while the x-axis represents the left-hand side (LHS) of the association rule. The intersection of the x-axis and y-axis represents the confidence level, with darker colors indicating higher confidence values and lighter colors indicating lower confidence values. The confidence range is shown on the right side of each figure.
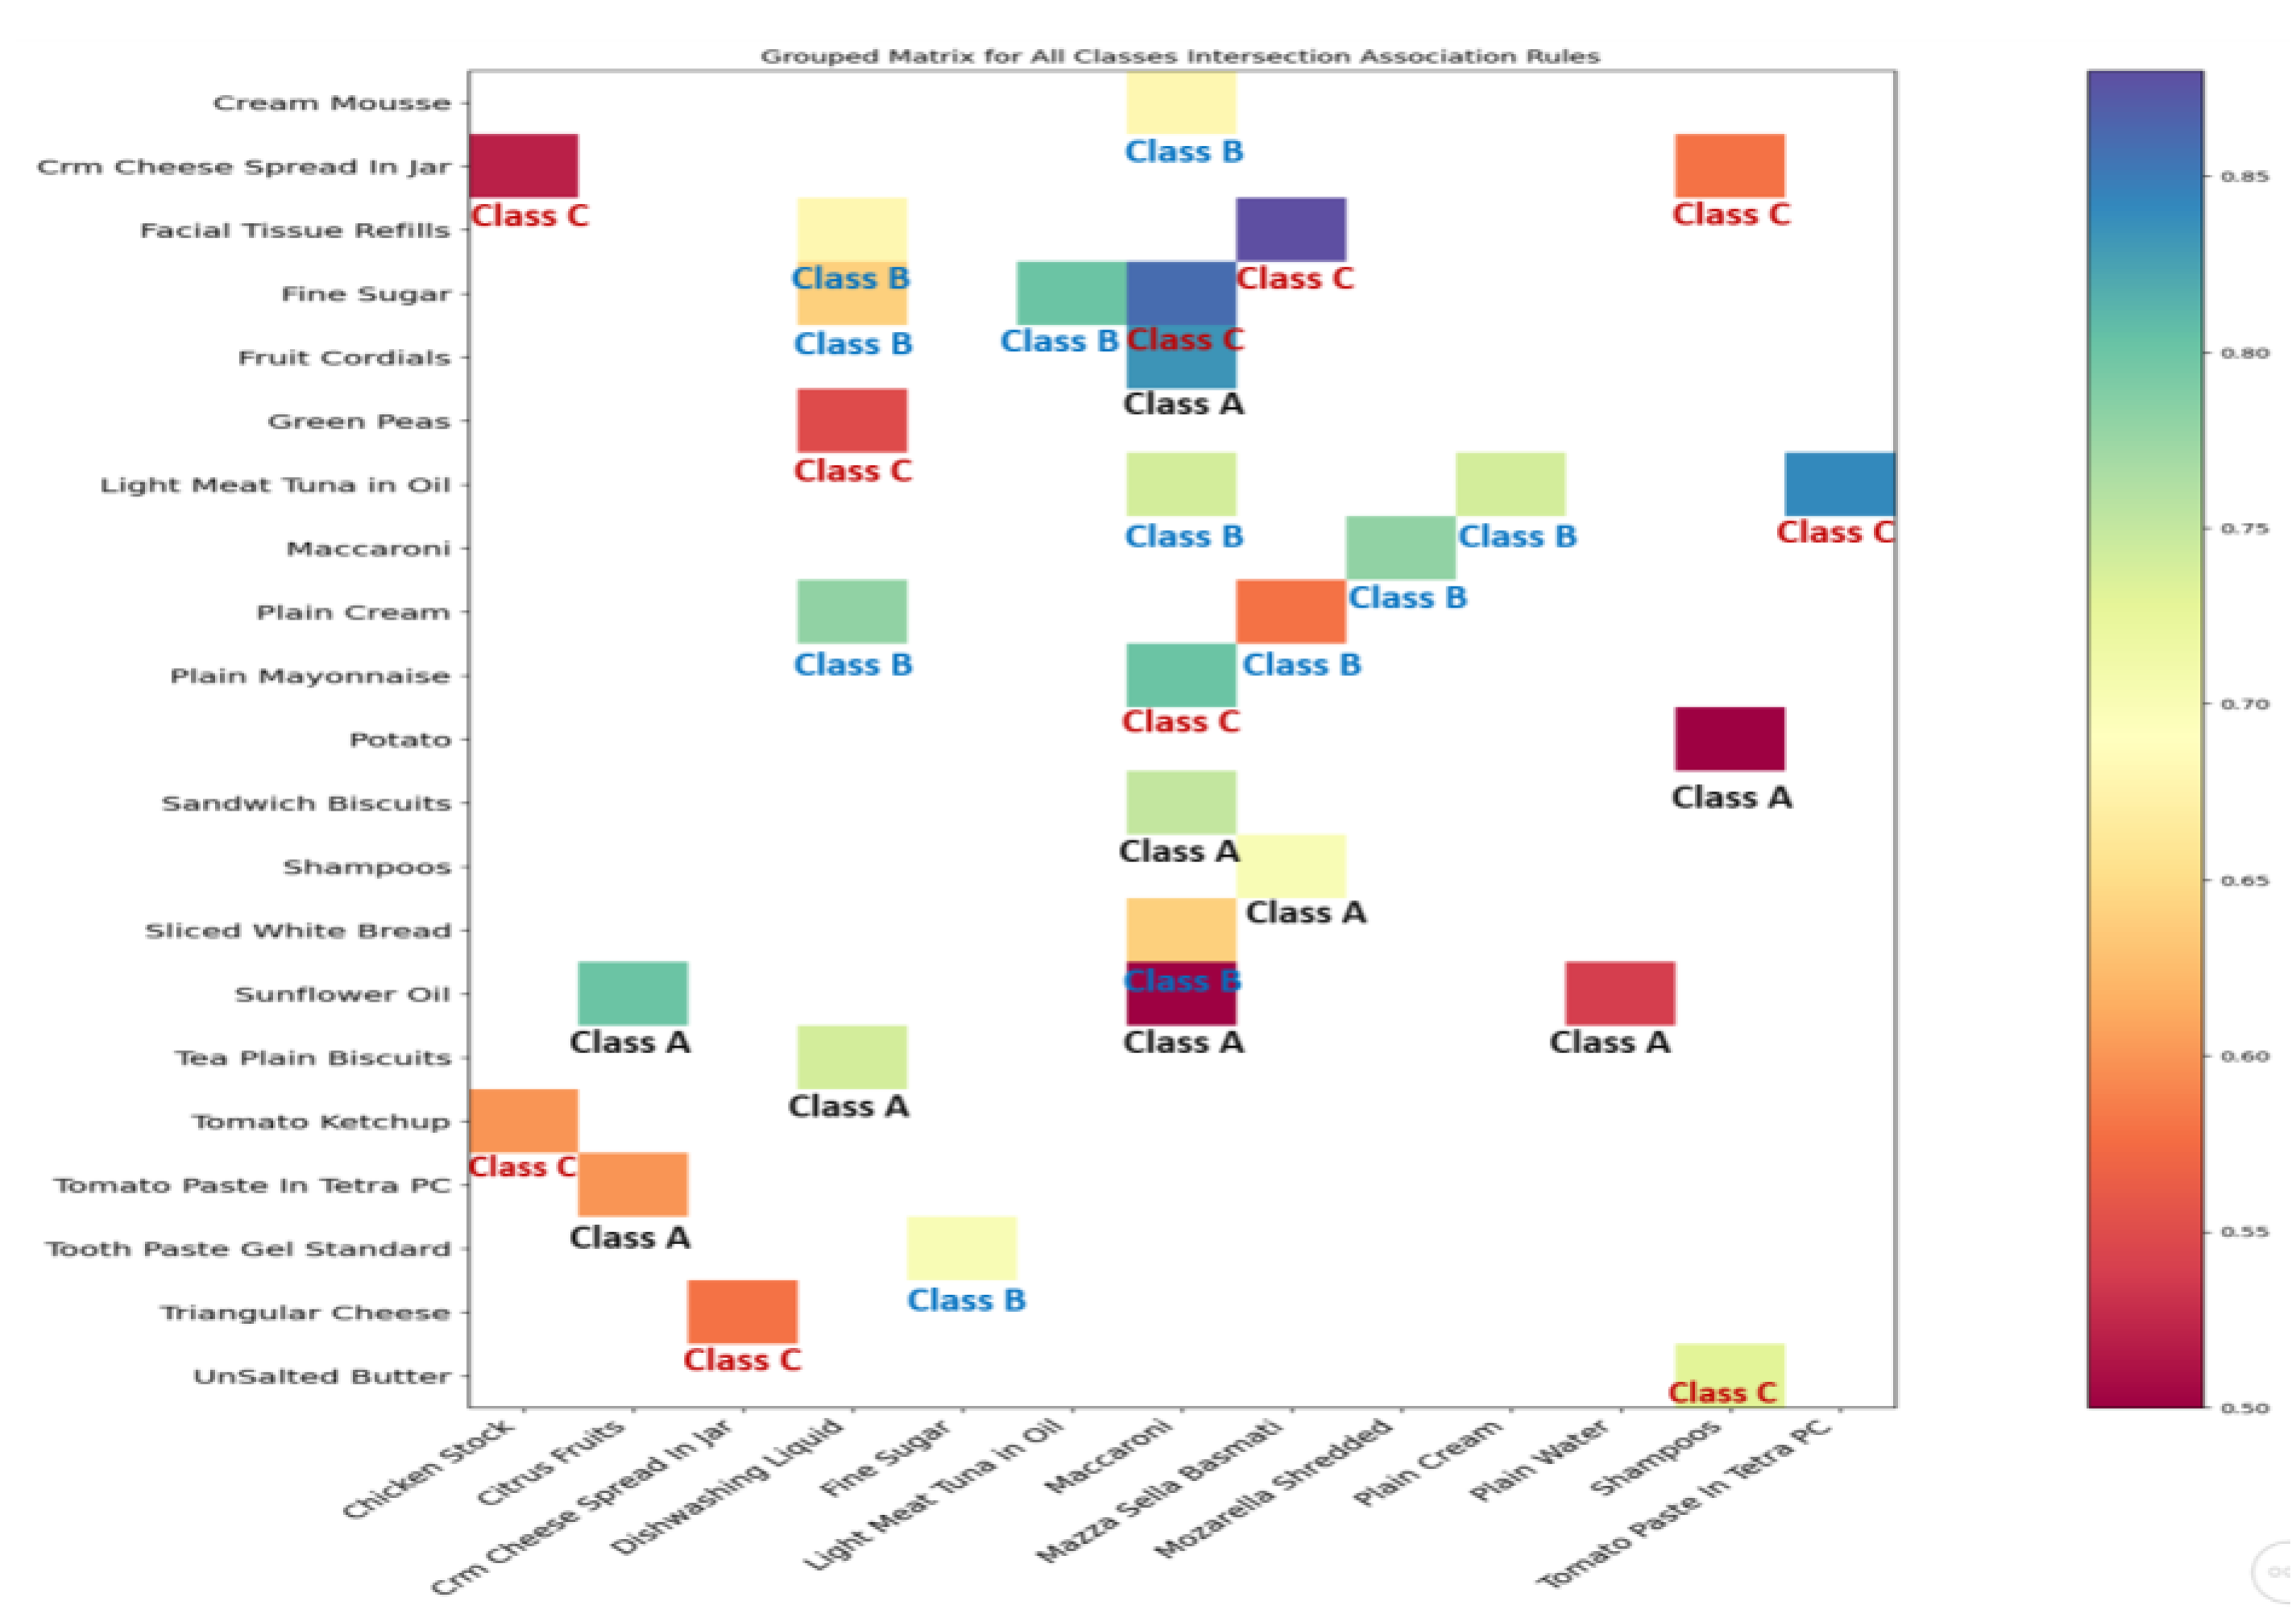
Figure 9 shows association rules that involve products from different sections of the supermarket. This figure was also developed using Python libraries.
In association rule learning (ARL), several metrics are used to evaluate association rules. While it is agreed that the confidence level (guarantee) is the most important metric, there are other metrics, such as support, lift, and gain. Here’s a brief explanation of each metric:
Support: The support of an association rule is the percentage of groups that contain all the items listed in that association rule. The percentage value is calculated among all the considered groups.
Confidence: The confidence of an association rule is a parameter that measures the conditional probability of the consequent given the antecedent. Confidence ranges from 0 to 1, and a high confidence value indicates that the rule is highly likely to be true.
Lift: The lift value of an association rule is the ratio of the confidence of the rule to the expected confidence of the rule. The expected confidence of a rule is defined as the product of the support values of the rule body and the rule head divided by the support of the rule body.
Gain: The gain value is more related to the clustering tree. It is defined as the difference between the amount of information needed to make a correct classification before the split and the amount of information needed after the split.
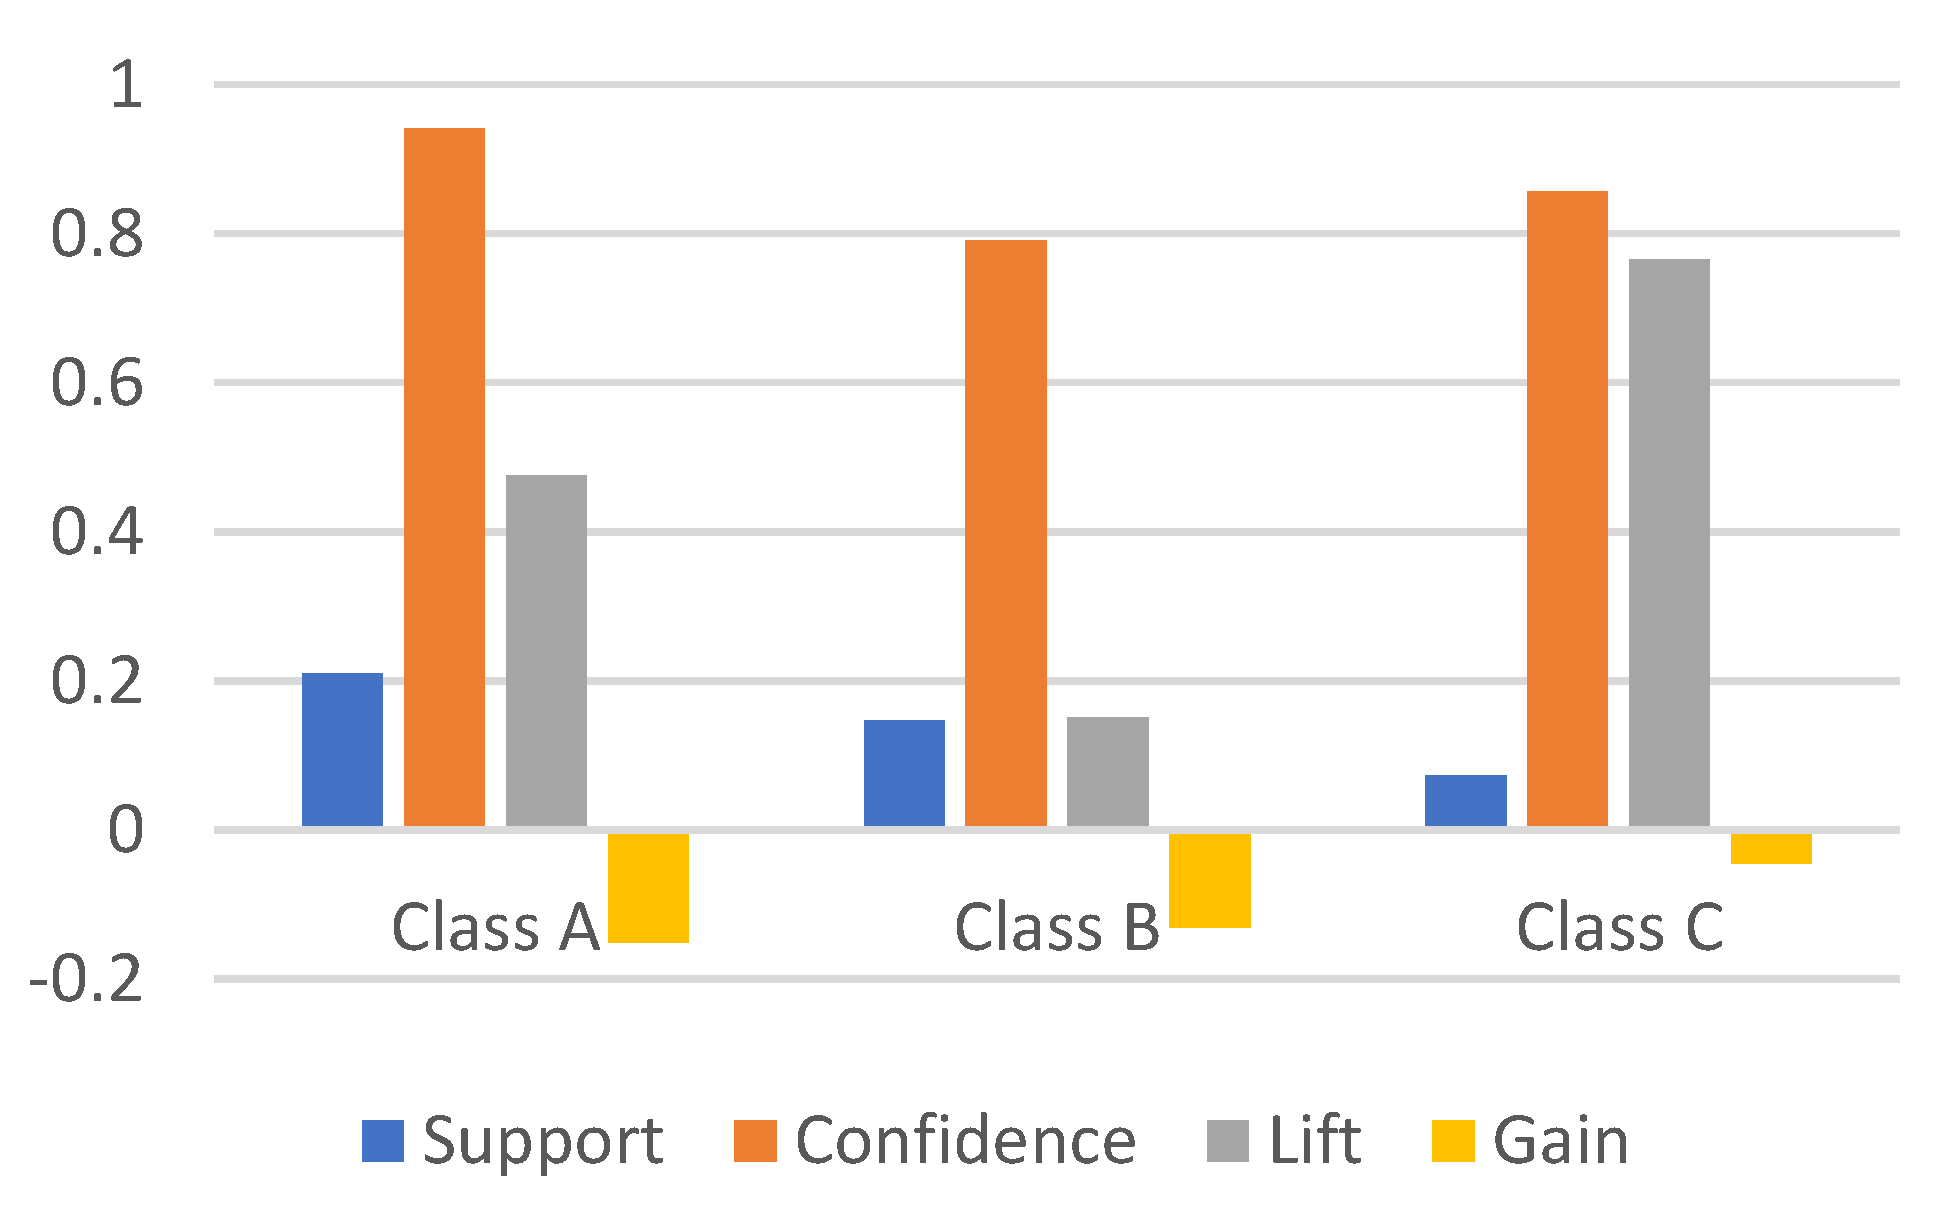
For our clustering model,
Table 6 and
Figure 10 summarized the highest value established for each class.
Based on the results, it appears that Class A has the highest support and confidence values. Class B has the lowest confidence value among the three classes, which may be because the antecedent or consequent of the association rule for Class B contains rare items that occur infrequently in the dataset. In such cases, the confidence value can be lower because there are fewer transactions containing both the antecedent and consequent items.
Class C has the highest gain and lift values. There are two possible reasons for Class C’s high gain value:
Rarity of the items: The items in the association rule for Class C may be rare, which would also explain why Class C has the lowest support value as well, indicating that the items occur infrequently in the dataset. When rare items are involved in a rule, the gain value tends to be high because the expected support is low.
Strong correlation: The items in the association rule for Class C may be strongly correlated, meaning that the presence of one item is likely to indicate the presence of the other item. In such cases, the gain value tends to be high because the observed support is much higher than the expected support.
Having the highest lift value in Class C means that the association rule for this class has a strong positive correlation. A lift value of 4.975 for Class C suggests that the presence of the antecedent in the rule strongly increases the likelihood of the consequent compared to what would be expected if the two items were independent.
6. Conclusions and Future Work
This paper proposes a machine learning-enabled framework for predicting consumer behavior in the retail sector. The framework is presented as five system layers:
The framework has been developed in cooperation with one of the biggest supermarket chains in the retail sector of Saudi Arabia. It is presented as a generalized model to gain insight into the generated big data and enable data-driven decision-making in other relevant domains. Therefore, it can be applied to any other company in the retail sector or even in any other relevant sector. The results of this framework are expected to improve business management in the targeted sector, ultimately contributing to an increase in economic development in Saudi Arabia.
In this paper, we present a case study where we applied the proposed framework to a supermarket in the retail sector of Saudi Arabia. We utilized unsupervised learning, specifically clustering using the k-means algorithm and association rule learning using the FP-growth algorithm, to gain insight into consumer behavior and enable data-driven decision-making.
The framework was applied using a large dataset provided by the supermarket owner, who is one of the largest supermarket chains in Saudi Arabia. The results of clustering and association rule learning have been presented and discussed in this paper.
Future work on the proposed framework could involve exploring additional unsupervised and supervised learning algorithms, such as classification, neural networks, and deep learning, to further optimize its performance. The framework could also be expanded to include additional data sources and predictive models in order to provide more comprehensive insights into consumer behavior. As a next step, supervised learning techniques could be applied to the resulting association rules in the marketing intelligence layer as a post-processing technique for each class, providing further insight into consumer behavior.


