


INTRODUCTION
The surge in the use of Bayesian chronological modeling, in combination with advances in radiocarbon measurement and an improved calibration curve (Reimer et al. Reference Reimer, Austin, Bard, Bayliss, Blackwell, Ramsey, Butzin, Cheng, Edwards, Friedrich, Grootes, Guilderson, Hajdas, Heaton, Hogg, Hughen, Kromer, Manning, Muscheler and Talamo2020) has enabled “generational precision” to be achieved for some archeological chronologies (Whittle and Bayliss Reference Whittle and Bayliss2007; Bronk Ramsey Reference Bronk Ramsey2009; Dee et al. Reference Dee, Wengrow, Shortland, Stevenson, Brock, Girdland Flink and Bronk Ramsey2013; Kuitems et al. Reference Kuitems, Panin, Scifo, Arzhantseva, Kononov, Doeve, Neocleous and Dee2020). Notwithstanding these advancements, calibration plateaux continue to pose challenges to precision by generating wide date ranges, irrespective of the uncertainties of the associated raw measurements (Taylor et al. Reference Taylor, Stuiver and Reimer1996). Short duration sites situated entirely within a calibration plateau and lacking the possibility of wiggle matching represent a specific challenge for high-precision dating. In these cases, the availability of reliable stratigraphic sequences of radiocarbon dates becomes even more crucial (Buck et al. Reference Buck, Kenworthy, Litton and Smith1991; Hamilton et al. Reference Hamilton, Haselgrove and Gosden2015).
This case study focuses on the Swifterbant Culture sites S3 and S4 in the province of Flevoland, the Netherlands (Figure 1). The Swifterbant Culture holds significant importance in the discourse on the Neolithization process in the plains of northwestern Europe, with archeological sites spanning across the Netherlands, the Scheldt valley in Belgium, and Lower Saxony in Germany. This situates them just north-west of the “loess belt,” an area settled by the first European farming communities, the Linearbandkeramik culture (hereafter “LBK”) that utilized the fertile topsoil of the wind-blown loess sediments stretching across a substantial portion of central and southeast Europe (Whittle Reference Whittle1996; Bakels Reference Bakels2009).
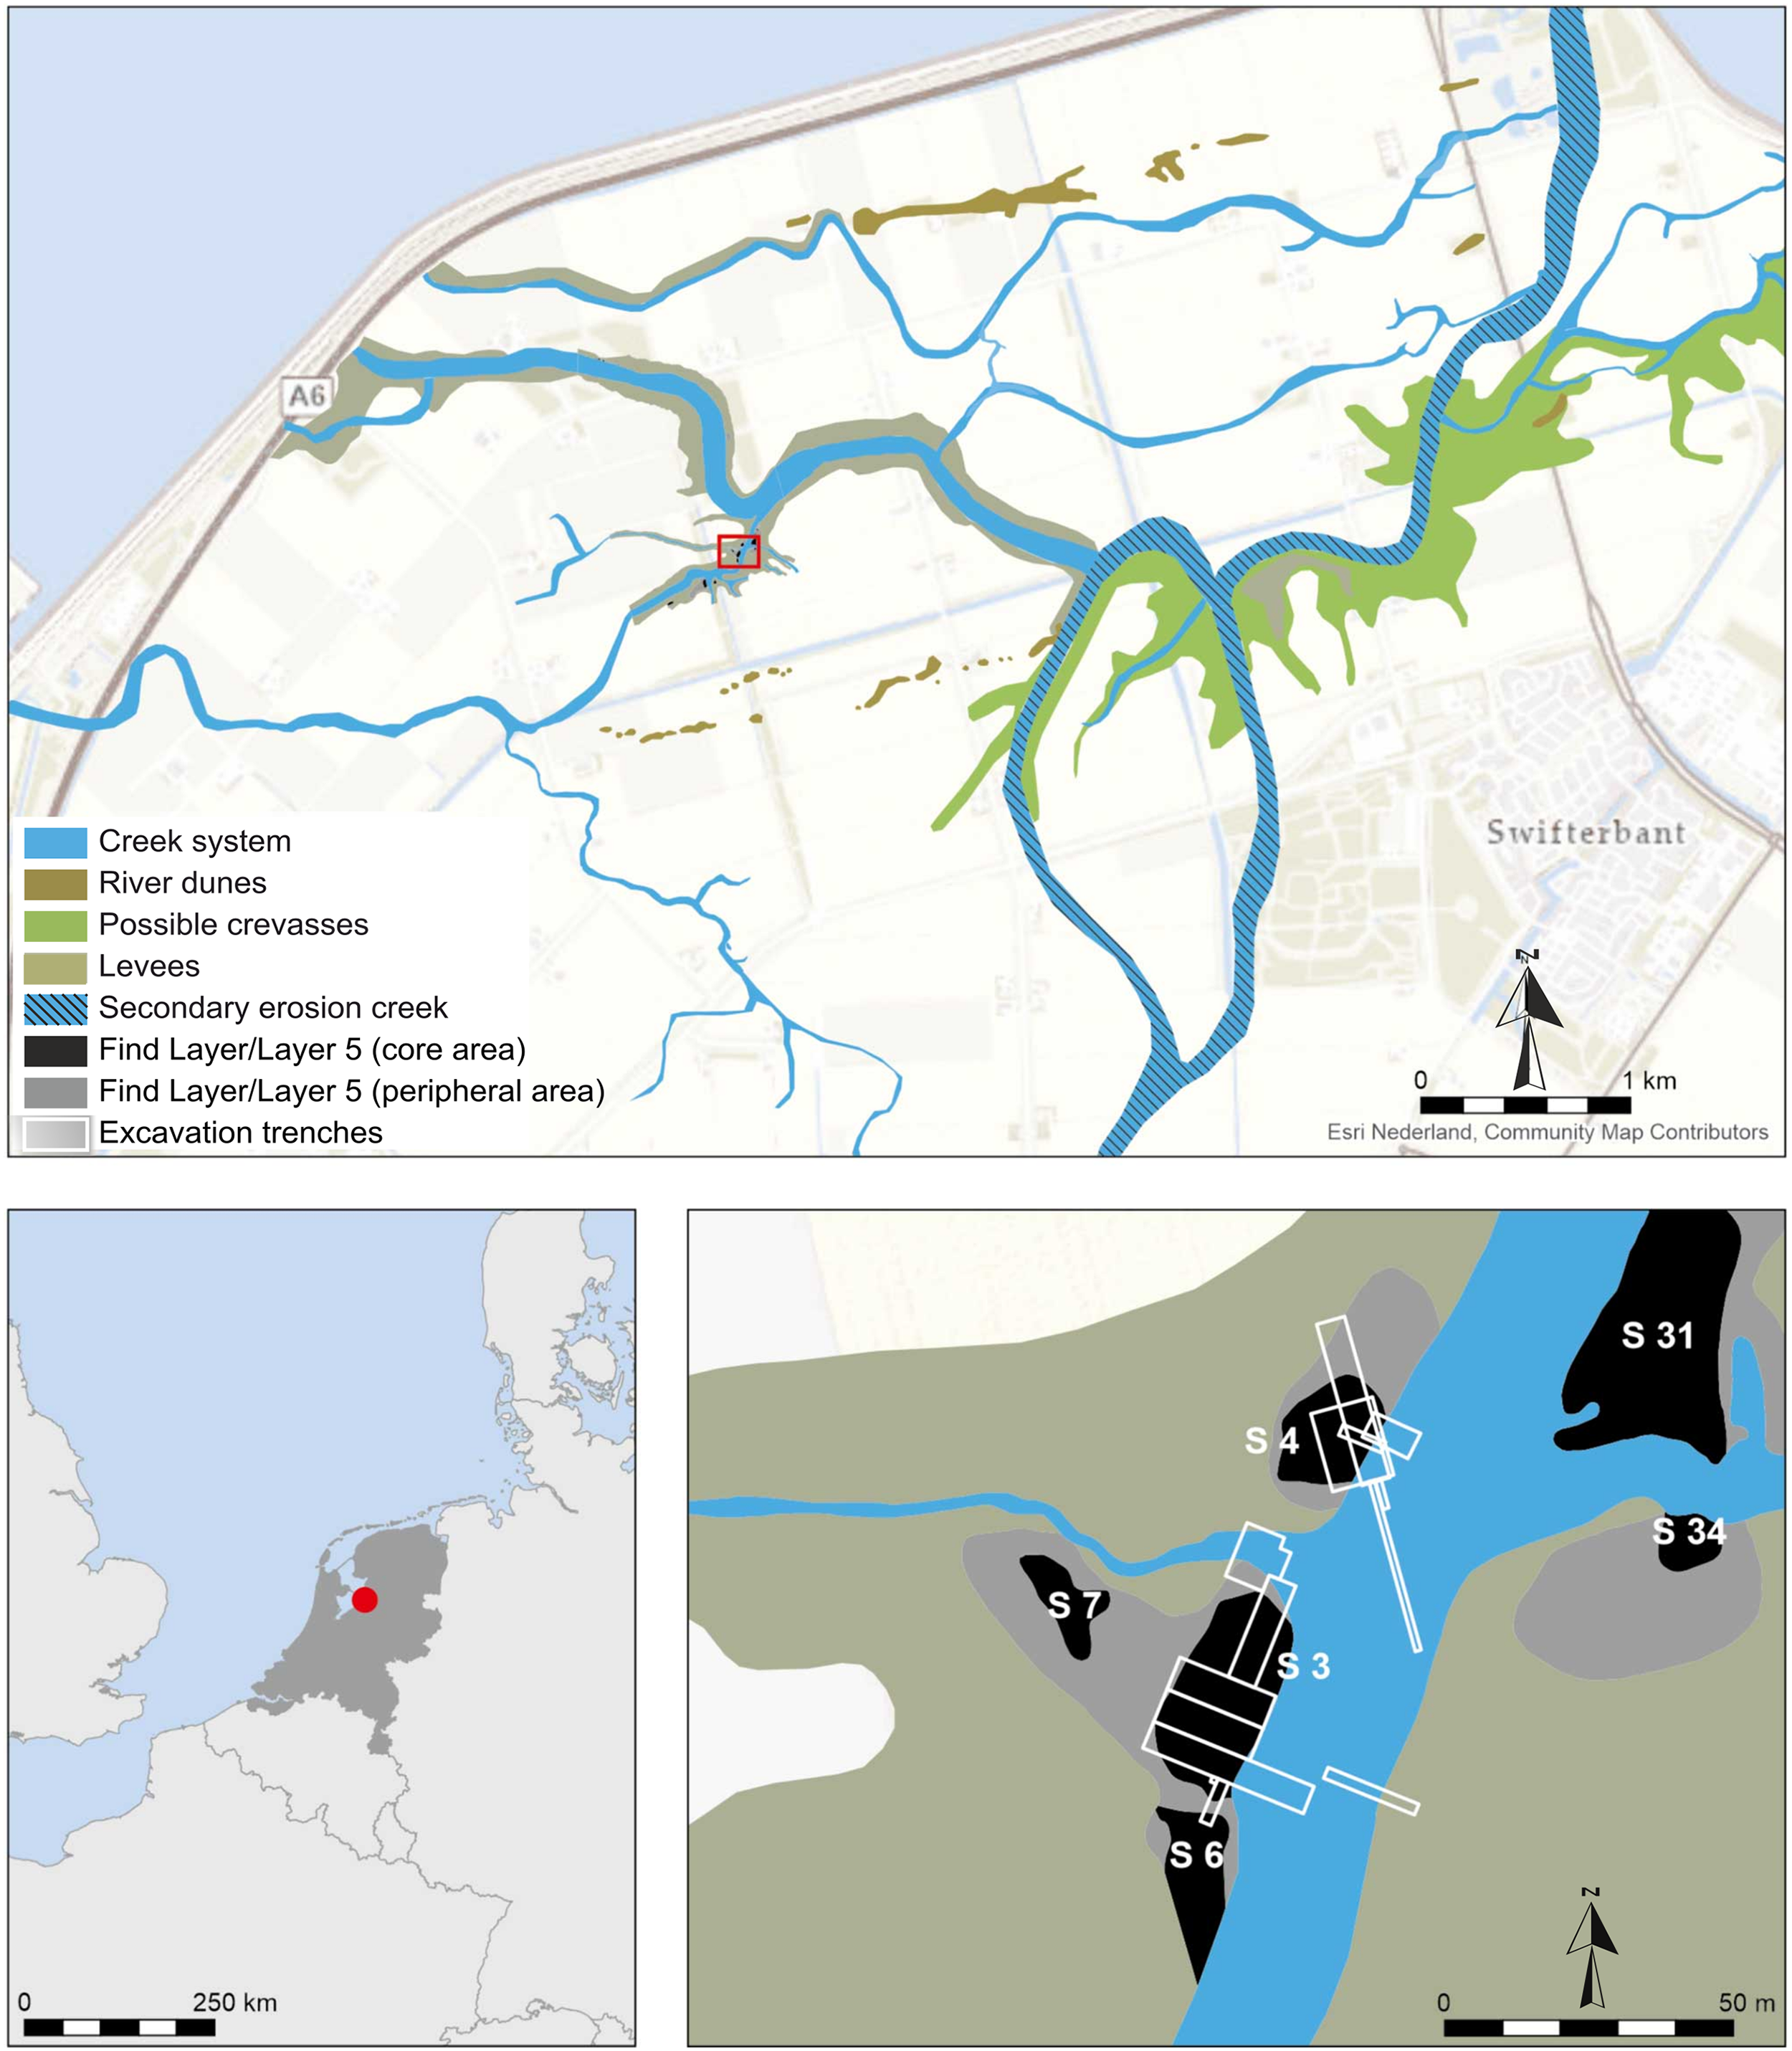
Figure 1 Maps showing the location of S3 and S4 sites (upper part) and the Netherlands in relation to Europe, with marked position of the sites (bottom left). Insert (bottom right): Detailed view on S3 and S4 with the outline of excavation trenches and the environment at the time (4300–4000 BCE).
Despite proximity and interaction with these farmers, the Swifterbant communities persisted as hunter-gatherers for centuries. They eventually introduced subsistence novelties, including pottery use, animal husbandry and crop cultivation, all the while heavily relying on hunting and gathering practices (Raemaekers et al. Reference Raemaekers, Demirci, Kamjan, Talebi, Schepers, Huisman, Peeters and Çakirlar2021).
The prevailing interpretation presupposes a gradual and prolonged transition to agriculture, potentially predating neighboring regions such as the British Isles and southern Scandinavia. This positions Swifterbant as a pivotal milestone in the transition to agriculture outside of the LBK zone in north-western Europe (Zvelebil and Rowley-Conwy Reference Zvelebil and Rowley-Conwy1986; Rowley-Conwy et al. Reference Rowley-Conwy, Gron, Bishop, Dunne, Evershed, Longford, Schulting, Treasure, Gron, Sorensen and Rowley-Conwy2020; Sørensen Reference Sørensen2020; Raemaekers et al. Reference Raemaekers, Demirci, Kamjan, Talebi, Schepers, Huisman, Peeters and Çakirlar2021).
However, the precise timing and duration of this process has been the subject of intense debate (Raemaekers et al. Reference Raemaekers, Demirci, Kamjan, Talebi, Schepers, Huisman, Peeters and Çakirlar2021), largely due to the limited availability of comprehensive multi-proxy and chronological research on keystone sites (Dreshaj et al. Reference Dreshaj, Dee, Peeters and Raemaekers2022). Notably, the Swifterbant sites of S3 and S4 hold exceptional significance as they provide the oldest conclusive evidence of cultivated fields and early animal management and are remarkably well preserved (Cappers and Raemaekers Reference Cappers and Raemaekers2008; Huisman et al. Reference Huisman, Jongmans and Raemaekers2009; Huisman and Raemaekers Reference Huisman and Raemaekers2014; Schepers and Woltinge Reference Schepers and Woltinge2020; Brusgaard et al. forthcoming).
However, the chronology of these sites falls entirely within the calibration plateau spanning the period 4300–4000 BCE. As a result, individual calibrated dates lack the resolution needed to avoid coarse interpretation of the activities associated with these important subsistence changes (Dreshaj et al. Reference Dreshaj, Dee, Peeters and Raemaekers2022).
Our ultimate objective was to overcome these limitations and to improve the chronological resolution of these processes. To accomplish this, we employed a multifaceted approach. Given the absence of clear-cut stratigraphy but little to no post-depositional disturbance (Huisman et al. Reference Huisman, Jongmans and Raemaekers2009), we chose to sample charred short-lived plant remains from the vertical columns of excavation spits for radiocarbon dating. This approach allowed us to define the chronological order of the sampled material, which offered crucial prior information for the Bayesian modeling. In combination with carefully vetted legacy data, robust models were constructed. Based on the modeling outcomes, we propose an improved timeframe for the commencement of agriculture in the Dutch wetlands.
Description of the Sites
The Swifterbant sites S3 and S4 are located in Oostelijk Flevoland, a polder in the Netherlands that was reclaimed from the floor of lake IJsselmeer in the 1950s. Like much of the country, during the Holocene this area was influenced by sea-level rise, causing the extension of peat and clay deposits in tidal gullies (Schepers and Woltinge Reference Schepers and Woltinge2020). Consequently, it transformed into a freshwater, low-energy environment characterized by minimal transportation of large sediment particles and the accumulation of fine-grained sediments, such as those found in lagoons, estuaries, and deltas (Ente Reference Ente1976; Dalrymple et al. Reference Dalrymple, Zaitlin and Boyd1992; Schepers and Woltinge Reference Schepers and Woltinge2020). Within this setting, small creeks and river branches formed, creating an environment where very fine sediments were continuously deposited along the banks (Huisman et al. Reference Huisman, Jongmans and Raemaekers2009; Huisman and Raemaekers Reference Huisman and Raemaekers2014; Schepers and Woltinge Reference Schepers and Woltinge2020). It was in this context that a series of dwellings and cultivated fields associated with prehistoric Swifterbant culture were discovered. Among these sites, S3 and S4 (Figure 1) have been particularly well-studied (van der Waals Reference van der Waals1977; Raemaekers and Roever Reference Raemaekers and Roever2020).
Excavations at S3 and S4 revealed evidence of intense anthropogenic presence. Finds varied from large amounts of carbonized plant and bone remains, pottery, flints, and features such as charcoal marks, posts and postholes, remains of surface hearths, as well as burials (van der Waals Reference van der Waals1977; Schepers and Woltinge Reference Schepers and Woltinge2020). In fact, due to striking similarities in stratigraphy and archaeological evidence as well as the proximity of both sites, excavators proposed that the sites likely started as one and were later divided by a gully (Schepers and Woltinge Reference Schepers and Woltinge2020).
At both sites, these archeological features and materials were associated exclusively with a prominent thick dark layer known as the “Find Layer” at S3 and “Layer 5” at S4. Both layers commence at a similar elevation of approximately 6.3–6.5 meters below sea level, exhibiting a gentle slope (van der Waals Reference van der Waals1977; Schepers and Woltinge Reference Schepers and Woltinge2020). At S3, this layer was approximately 100 cm thick, while at S4, it was about half this. Both layers were interpreted as a succession of organic material depositions, primarily burnt reed rushes (mats), recognizable as discontinuous ∼1.0–1.5 cm thick micro-laminations. As this presented challenges in archeological field recording, systematic excavation was conducted in 5 cm spits (van der Waals Reference van der Waals1977; Schepers and Woltinge Reference Schepers and Woltinge2020). At S4, the excavators estimated that there was a sequence of ∼35 layers, which might correspond to a similar number of years if deposition occurred annually. A comparable observation was made at the S3 site, which was expected to span ∼80–100 years. Recording by spits was applied only within the context of the Find Layer/Layer 5 because the remainder of the stratigraphical units seemed sterile (van der Waals Reference van der Waals1977; Geuverink Reference Geuverink2020; Schepers and Woltinge Reference Schepers and Woltinge2020).
A comprehensive understanding of the taphonomy, occupational timeline, and function of the Swifterbant S4 site was pursued through a micromorphological study. It revealed the exceptional preservation and micro-laminations of Layer 5 (Layer IV in Huisman et al. Reference Huisman, Jongmans and Raemaekers2009) (Figure 2), which had been largely undisturbed by post-depositional processes. Indeed, the absence of indicators for trampling led to the proposition that S4 served as a refuse area or midden, rather than a dwelling (Huisman et al. Reference Huisman, Jongmans and Raemaekers2009).

Figure 2 Overview of layers associated in S3 and S4. Left: photographs of profile sections of S4 and S3, with marked layers, adapted from Huisman and Raemaekers (Reference Huisman and Raemaekers2014: Fig. 4) and Schepers and Woltinge (Reference Schepers and Woltinge2020: Fig. 2.3). N.B. Division of layers is a combination of the two publication: Layer 3 and 4 both correspond to layer III, and Layer 5 and 6 correspond to Layer IV and V in Huisman et al. (Reference Huisman, Jongmans and Raemaekers2009), respectively. Right: Scheme of layers and thin sections with micromorphological features associated with Layer 5 and Layer 2 at S4. Layer 5: micro-laminations (A), organic matter (B, E, F) and coprolites (C, D). Layer 2: carbonized plant fragments in vertical position, indicating tillage (C, D). Adapted from Huisman et al. (Reference Huisman, Jongmans and Raemaekers2009: Fig. 5, p. 192, Fig. 6, p. 195, Fig. 7, p. 197). For more details on this study, refer to Huisman et al. (Reference Huisman, Jongmans and Raemaekers2009).
Furthermore, the analysis unveiled evidence of anthropogenic activities extending beyond Layer 5, into the layers above and below that were previously assumed sterile. These activities were primarily manifested as evidence of tillage practices associated with in situ farming, observed in the underlying Layer 2 as well as Layer 6, which overlies Layer 5 (Huisman et al. Reference Huisman, Jongmans and Raemaekers2009; Huisman and Raemaekers Reference Huisman and Raemaekers2014; Figure 2). An archeobotanical study further supported these findings, noting the increased prevalence of naked barley in older spits (5–9) and the significant influx of other plant species linked to daily settlement activities in younger spits (1–4) (Schepers and Bottema-MacGillavry Reference Schepers and Bottema-MacGillavry2020). This evidence strengthens the argument that S4 underwent several changes in its function: from a farming area (Layer 2) to a refuse site (Layer 5) and eventually reverted to its initial role (Layer 6) (Huisman et al. Reference Huisman, Jongmans and Raemaekers2009; Huisman and Raemaekers Reference Huisman and Raemaekers2014; Schepers and Woltinge Reference Schepers and Woltinge2020).
The absence of micromorphological research at S3 leaves us without specific details regarding post-depositional disturbance and the nature of anthropogenic activities at this site. However, excavators at S4, when reviewing the field documentation of S3, retroactively concluded the depositional pattern at S3 exhibits similarities to S4 (van der Waals Reference van der Waals1977; Schepers and Woltinge Reference Schepers and Woltinge2020:20–22).
Regarding subsistence practices, which play a crucial role in understanding the significance of these sites within the Neolithization debate, multiple lines of evidence support the presence of animal husbandry. Cattle comprise the majority of the faunal assemblage at both sites, followed by domesticated pigs and various wild animals such as red deer and beaver (Clason and Brinkhuizen Reference Clason and Brinkhuizen1978; Zeiler Reference Zeiler1997; Kranenburg and Prummel Reference Kranenburg, Prummel, Raemaekers and de Roever2020; Brusgaard et al. forthcoming). Recent zooarcheological and stable isotope studies on the faunal assemblage of S3 and S4 have shed further light on dietary management and potential transhumance practices related to cattle (Brusgaard et al. Forthcoming). These findings align with the archeobotanical identification of grassland plant communities, which is indicative of grazing activities (Schepers Reference Schepers2014). Taken together, the combination of these results provides compelling evidence of early animal management in the Dutch wetlands (Brusgaard et al. forthcoming).
Legacy Radiocarbon Dates
The legacy datasets from Swifterbant sites S3 and S4 include 23 radiocarbon dates obtained from various materials such as short-lived plant remains, ruminant collagen, wood, charcoal, and human collagen (refer to Supplementary Information (hereafter “SI”) Table 1) (van der Waals Reference van der Waals1977; Lanting and Plicht Reference Lanting2000; Devriendt Reference IIJALM2013; Schepers and Woltinge Reference Schepers and Woltinge2020). All of these dates fall within the calibration plateau (4300–4000 BCE) and yield wide ranges, except for three exceptional cases. Two older dates, measured on charred food remains on pottery and collagen from human bone, likely exhibit a reservoir effect (UtC-1046, GrA-6488, respectively), although this claim is difficult to substantiate in the absence of δ15N values. Additionally, one short-lived sample from the upper part of Layer 5 at S4 returns a significantly younger age. Considering its position and context within the site (SI: Table 1), it is possible that this sample represents an intrusive element from a later phase of site utilization, as observed in the exploitation history of the area (Huisman et al. Reference Huisman, Jongmans and Raemaekers2009; Peeters et al. Reference Peeters, Asscher, Kooistra, Kubiak-Martens and Zeiler2021).
Table 1 List of stratified legacy dates from S4 and S3.

An ever-present challenge lies in the lack of precise contextual allocation for most of the legacy dates within the Find Layer/Layer 5 itself. Only three dates from the Find Layer at S3 have documented superposition (hereafter “stratified legacy dates”) (Table 1). The remainder of dates have not reached a degree of reliability necessary for our study. In addition, two dates from S4 were sampled from the underlying Layer 2 (van der Waals Reference van der Waals1977; Huisman et al. Reference Huisman, Jongmans and Raemaekers2009; Schepers and Woltinge Reference Schepers and Woltinge2020), offering an additional constraint for chronological modeling. Despite these caveats, the exceptional preservation and minimal post-depositional disturbance observed in the refuse layer at both sites provide a unique opportunity for conducting high-resolution chronological research.
METHODS
New Radiocarbon Analyses
Our study aimed to utilize the exceptionally undisturbed nature of the context in order to overcome the lack of detailed stratigraphy and combat the calibration plateau. Hence, we selected samples from various depths along the spits of each vertical column, enabling us to establish clearly defined chronological sequences. Furthermore, to ensure the highest quality radiocarbon measurements, we prioritized short-lived, clearly anthropogenic materials that were abundant and had well-documented contextual information. Specifically, we collected 31 charred seeds (Hordeum vulgare or naked barley) from six vertical columns (three per site) within the Find Layer at S3 and Layer 5 at S4 (Figure 3). Our sampling was limited to these layers because material from other contexts contained insufficient supporting information.

Figure 3 Position of sampled columns of new radiocarbon dates (C1-3) and a column of legacy dates (C4) at S3 and S4. After Devriendt 2013. Fig. 2.7, adjusted.
Prior to the chemical pretreatment process, all samples underwent species-level identification and were photographed using a Leica m-125c microscope coupled with a Mc 190HD camera (Figure 4, SI: Fig 1_SI, Fig 2_SI, Fig 3_SI, Fig 4_SI).
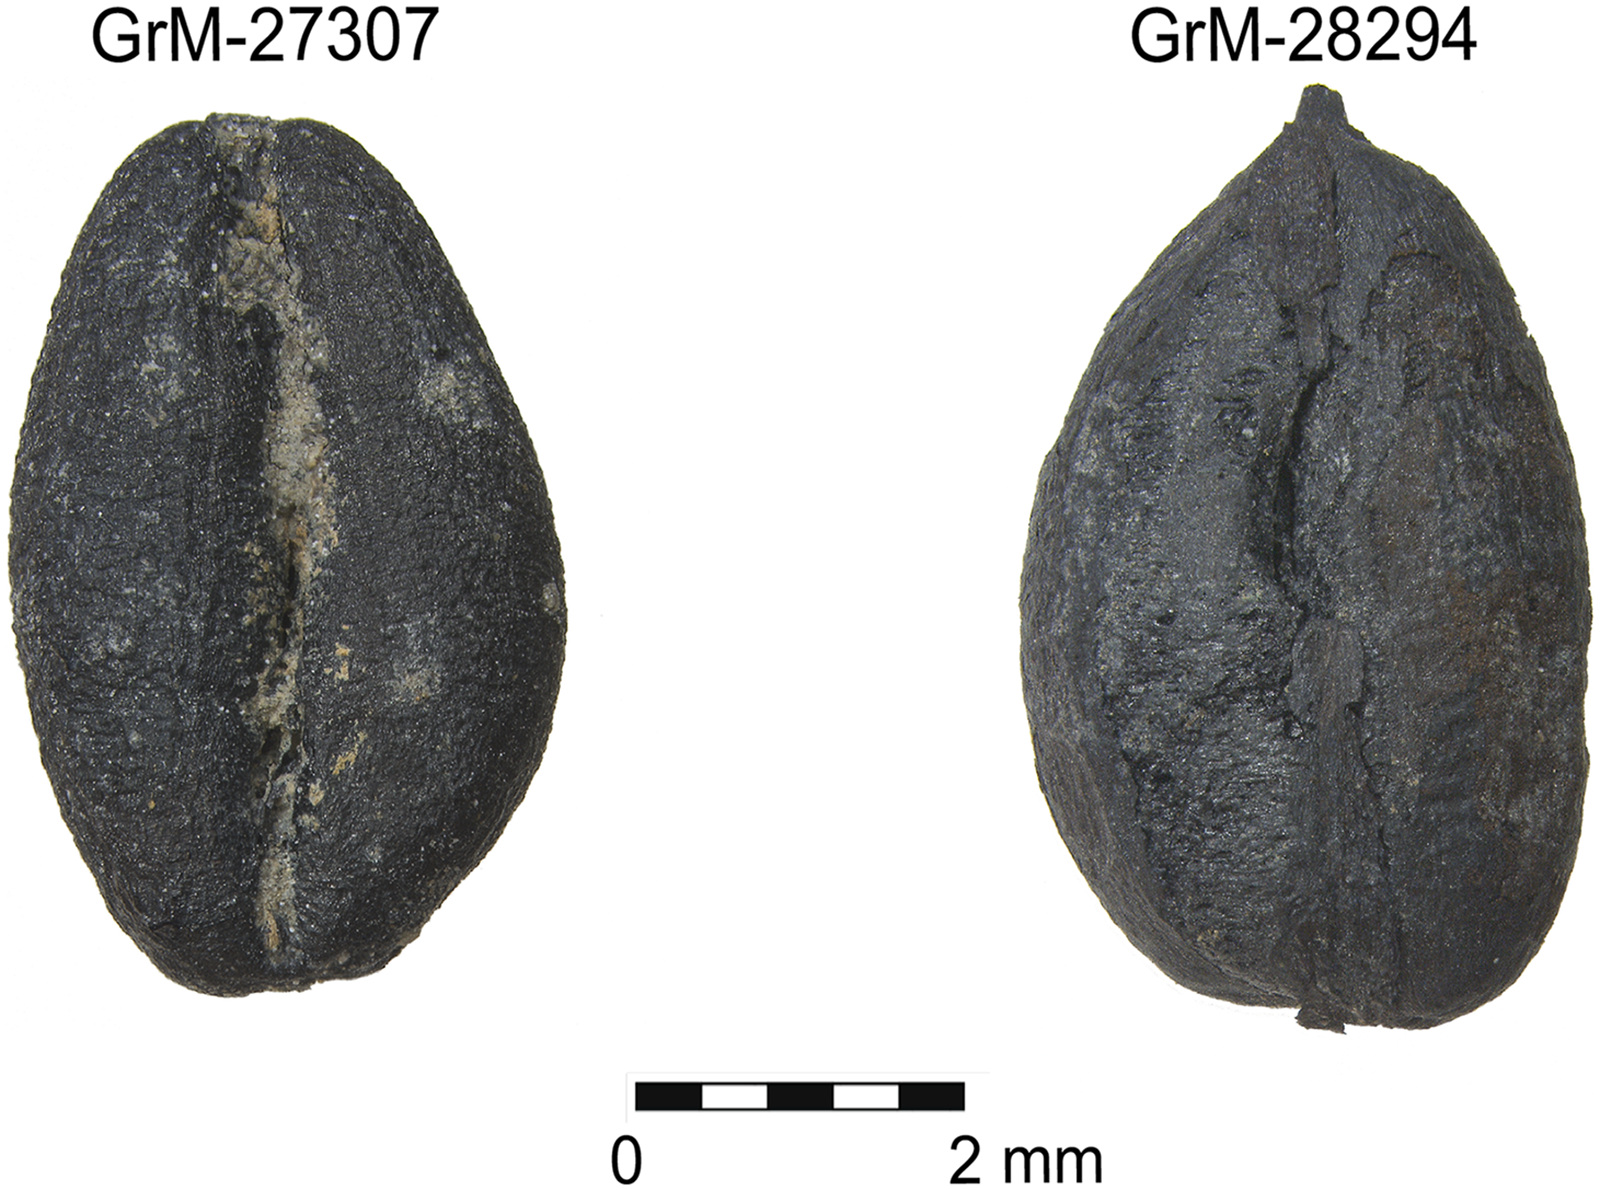
Figure 4 Photographs of charred Hordeum vulgare seeds (Leica m-125c coupled to Mc 190HD camera) sampled for radiocarbon dating: GrM-27307 from S3 and GrM-28294 from S4.
The routine chemical pretreatment for charred plant remains at the Centre for Isotope Research at the University of Groningen is outlined in Dee et al. (Reference Dee, Palstra, Aerts-Bijma, Bleeker, Bruijn, Ghebru, Jansen, Kuitems, Paul, Richie, Spriensma, Scifo, Zonneveld, Verstappen-Dumoulin, Wietzes-Land and Meijer2020). Briefly, all samples were decalcified in acid (HCl(aq), 4% w/vol, 80°C, 30 min). Next, all samples were rinsed with decarbonized and demineralized water (DW) three times, followed by a base (NaOH(aq) 1%, w/vol, 80°C, 30 min) and another triplicate rinse with demineralized water (3×). To avoid the incorporation of CO2(g) from the atmosphere, another step of acid (HCl(aq), 4% w/vol, 80°C, 30 min), followed by a final set of three rinses with DW was applied. All samples were air-dried. Aliquots 3–4 mg in size of the reduced carbon extracts were subsequently weighed into Sn(s) capsules and combusted in an Elemental Analyzer (EA, Elemental Vario Isotope Cube) coupled to an Isotope Ratio Mass Spectrometer (IRMS, IsoPrime 100) and an automated cryogenic system which traps the CO2(g) into sealable glass vessels. This allowed for the determination of δ13C. The CO2(g) was then graphitized over a Fe(s) catalyst in a stoichiometric excess of H2(g) employing an in-house built graphitization system. Finally, the graphite was pressed into Al(S) cathodes and transferred to the MICADAS mass spectrometer (Ionplus AG 200kV) for radioisotope analysis. For pretreatment quality assurance, each batch included a known-age sample, in this case charred seeds from Bronze Age Jericho (see Dee et al. Reference Dee, Palstra, Aerts-Bijma, Bleeker, Bruijn, Ghebru, Jansen, Kuitems, Paul, Richie, Spriensma, Scifo, Zonneveld, Verstappen-Dumoulin, Wietzes-Land and Meijer2020), and to corroborate the stable isotope analyses, IAEA caffeine (δ13C = –38.2‰) and oxalic acid (δ13C = –17.60‰) were concomitantly measured as standards.
Bayesian Models
We used the OxCal program in this study (Bronk Ramsey Reference Bronk Ramsey2009) and the IntCal20 calibration curve (Reimer et al. Reference Reimer, Austin, Bard, Bayliss, Blackwell, Ramsey, Butzin, Cheng, Edwards, Friedrich, Grootes, Guilderson, Hajdas, Heaton, Hogg, Hughen, Kromer, Manning, Muscheler and Talamo2020). OxCal functions are denoted with capital letters throughout.
Our modeling strategy follows our sampling rationale. Specifically, we were able to translate each column of radiocarbon dates into Sequences in OxCal. A simple bounded Phase encompassed all these Sequences per site (Figure 5). We applied the General Outlier model with an outlier probability of 0.05 and utilized the Charcoal Plus function for the legacy dates obtained from charcoal and wood samples (Dee and Bronk Ramsey Reference Dee and Ramsey2014) (see SI for codes). To analyze the duration of the contexts, we employed the Sum and Interval functions. The former sums posterior probability densities of all dates within the designated grouping, whereas the latter calculates intervals between events in a Sequence, specifically between the Boundaries of a Sequence. This gives an estimate of the probable number of years for the occurrence of an event (Bronk Ramsey Reference Bronk Ramsey2009).

Figure 5 Scheme of the modelling strategy of new radiocarbon dates, with added selected legacy dates from Layer 2 and Column 4 from Find Layer at S3 (Model 2). Date GrM-27305* is the only successful new radiocarbon date from Column 3.
Further, we explored the hypothesis that all 6 columns, 3 at each site, were simultaneously deposited since they were traversed in the same archeological layers, but in different areas of the sites. That is, we investigated the possibility that the evidence for occupation in each of the columns began and ended at the same time. To this end, we extracted the prior probabilities for the Start and End Boundaries of each Sequence, and Combined them to form even further refined estimates, albeit heavily dependent on this assumption of synchronicity.
We built two main models: Model 1, which only incorporated the new dates, and Model 2, which also included five legacy dates with known contextual superimposition.
Alternative models were prepared to investigate the reproducibility and robustness of the results. These included models without Outlier Analysis and models without stratigraphical assignment (grouping dates into a simple bounded Phase). Furthermore, legacy data that lacked any contextual definition were also combined with the stratified dates to examine their impact on the model outcomes. Additionally, simulations were prepared to assess how the incremental inclusion of additional dates would affect the resolution of the models (for codes, see SI). All models ran to completion.
RESULTS AND DISCUSSION
In total, 25 samples yielded sufficient carbon for radiocarbon analysis. All known-age samples, treated in concert with the archeological material, returned results within acceptable ranges, confirming the quality of analyzed batches. As expected, all samples produced probability distributions on the calibration plateau, and remarkably similar uncalibrated ages (Table 2).
Table 2 Radiocarbon measurements on charred plant remains (Hordeum vulgare seeds). Sample pretreatment and analysis were carried out at the Centre for Isotope Research, Groningen.

Model 1: New Radiocarbon Dates Only
The output of Model 1 (Figure 6) exhibited significantly narrowed down individual dates. However, at both S3 and S4 sites, the 95% probability ranges split into two distinct modes, which can be ascribed to minor fluctuations in the calibration plateau (Figure 7).

Figure 6 Model 1. (Left) The posterior probability densities of individual dates. Modeled dates are marked in black, unmodeled in light gray and Boundaries in blue. OxCal functions are denoted in “[ ]” for clarity. (Upper right) Estimated Boundaries of S4 and S3 sites, after Combining Prior data on Boundaries from each column. (Bottom right) Estimated Intervals for radiocarbon dated layers at S3 and S4. For codes, refer the SI.

Figure 7 Model 1. The posterior probability densities of selected dates on a calibration curve; more specifically—calibration plateau 4300–4000 BCE. The individual dates are color coded to reflect their contextual allocation.
Notably, at S4, the modeled probabilities strongly favored the older mode. Most of the output sits between 4250 and 4160 BCE, with only a fraction of probability between 4100 and 4060 BCE. Indeed, ∼80% range of modeled probabilities of each date within Sequences at S4 are between 4240 and 4160 BCE. The output of the Interval function suggests a very short-term, likely single generational occupation, and has a median value of 30 years.
The Start and End Boundaries of each Sequence at S4 were almost identical (Figure 6), and combining the posterior probabilities of all three columns constrained the output entirely to the older mode, even at 95% probability. As a result, taking all the aforementioned assumptions to be valid, we were able to get very precise Start and End Boundaries for Layer 5 at the S4 site (Figure 6). In summary, we propose that the most plausible time range for this context is 4240–4160 BCE.
For the S3 dataset, the 95% ranges of the posterior probability densities span most of the calibration plateau, but they coalesce between ∼4180 and 4030 BCE at 68% probability. The relative imprecision of these ranges may be attributed to either too few new or the greater time-depth of the site, which makes it more challenging to anchor individual dates within the calibration plateau.
However, our sensitivity tests, which involved incrementally adding simulated dates to investigate the impact of a larger radiocarbon dataset, showed no significant differences in the model’s outcome (see SI). Therefore, we conclude that additional radiocarbon dates within the Find Layer may not significantly contribute to the chronological resolution of this site.
The output of the Interval function at S3 suggests a longer occupation than S4, with a median of approximately 130 years (Figure 6). This supports the hypothesis that S3 has a greater time depth than S4, potentially indicating that it was a multigenerational site. The greater width of the Find Layer, the presence of younger pottery types, and a higher number of (micro)layers at S3 further reinforce this interpretation (van der Waals Reference van der Waals1977; Raemaekers Reference Raemaekers2015).
In contrast to S4, the Boundaries of each Sequence at S3 exhibit a continued bimodal distribution. However, all Sequences appear to be simultaneous (Figure 6).
In our sensitivity tests, where we omitted the contextual prior information, and simply grouped all the dates into a bounded Phase, the outputs of the Start and End Boundaries and the Interval results were comparable to Model 1 (see SI). Such repetitively consistent outputs act to confirm the reliability of our main models.
Model 2: New and Selected Legacy Radiocarbon Dates
In Model 2 (Figure 8, 9), the inclusion of legacy dates in the S3 site significantly increased the sample size by introducing an additional column (Sequence). However, this addition had minimal impact on the modeled dates compared to Model 1, except for a slight reduction in the Interval median to 100 years.
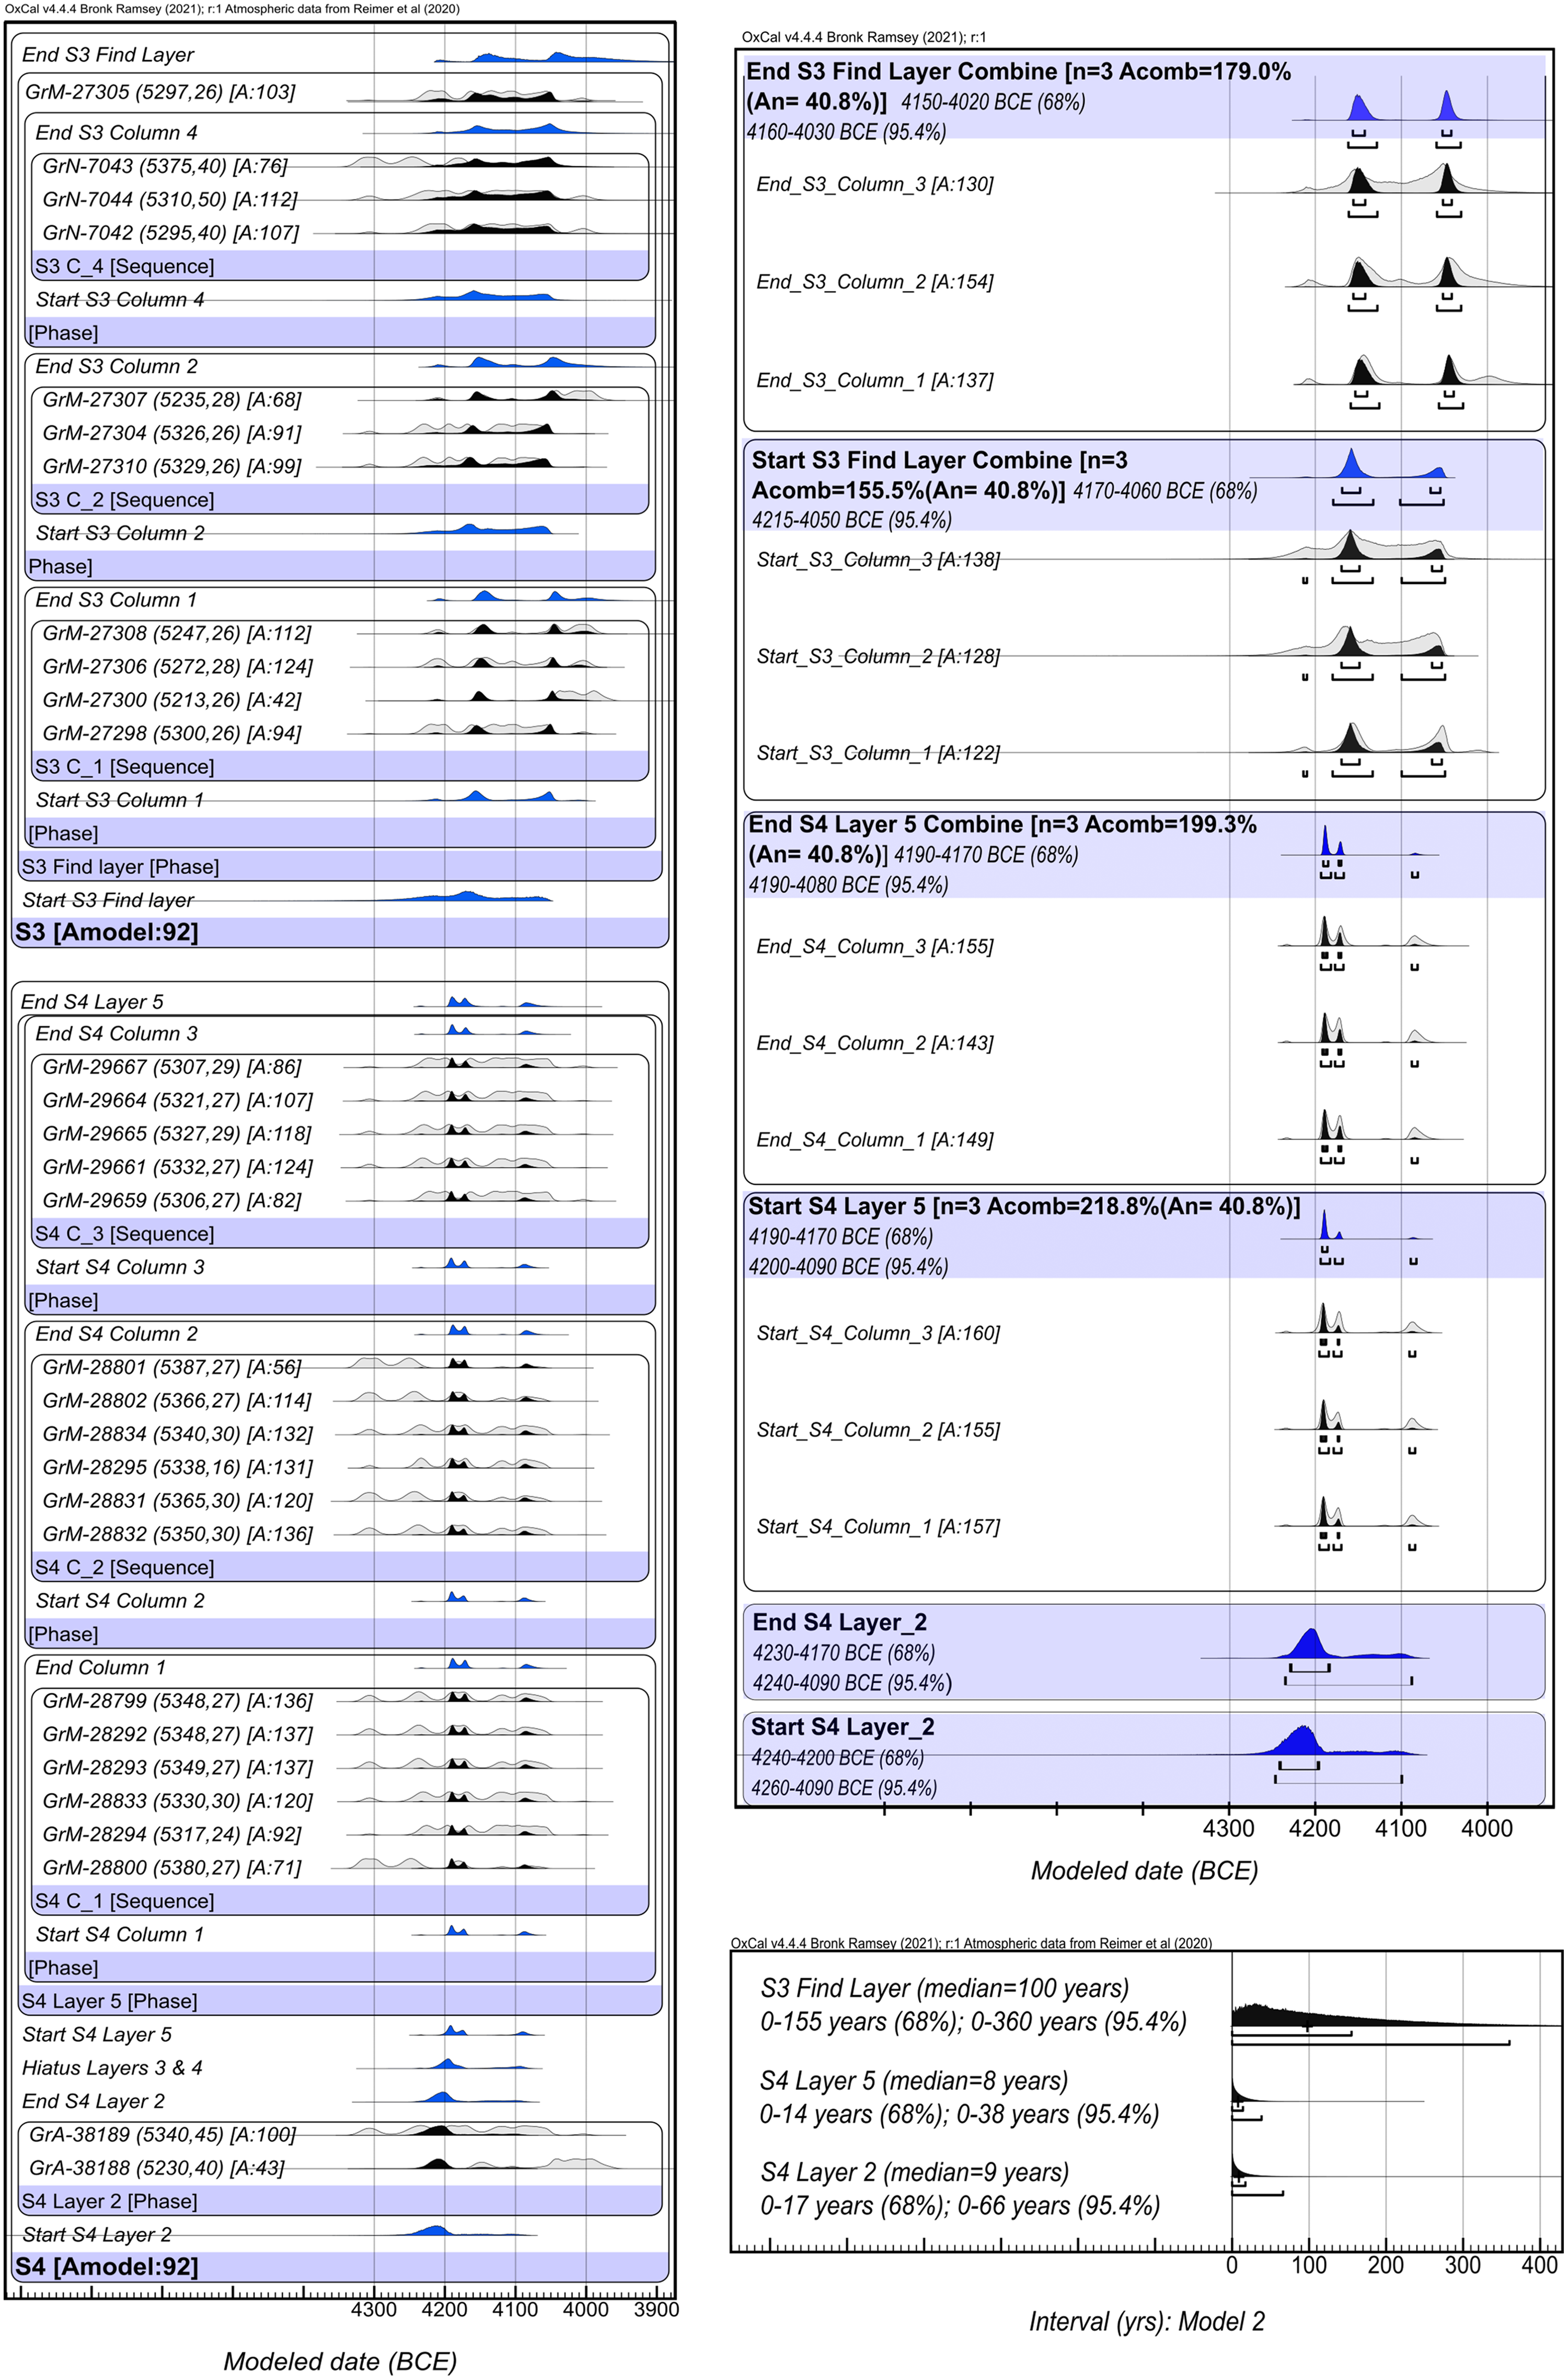
Figure 8 (Left) The probability densities from Model 2. Modeled dates are marked in black, unmodeled in light gray and Boundaries in blue. OxCal functions are denoted in “[ ]” for clarity. (Upper right) Modeled Start and End Boundaries of vertical columns from S3 and S4 sites, including Combined Boundaries. (Bottom right) Estimated Intervals for radiocarbon dated layers at S3 and S4. For codes, refer to the SI.
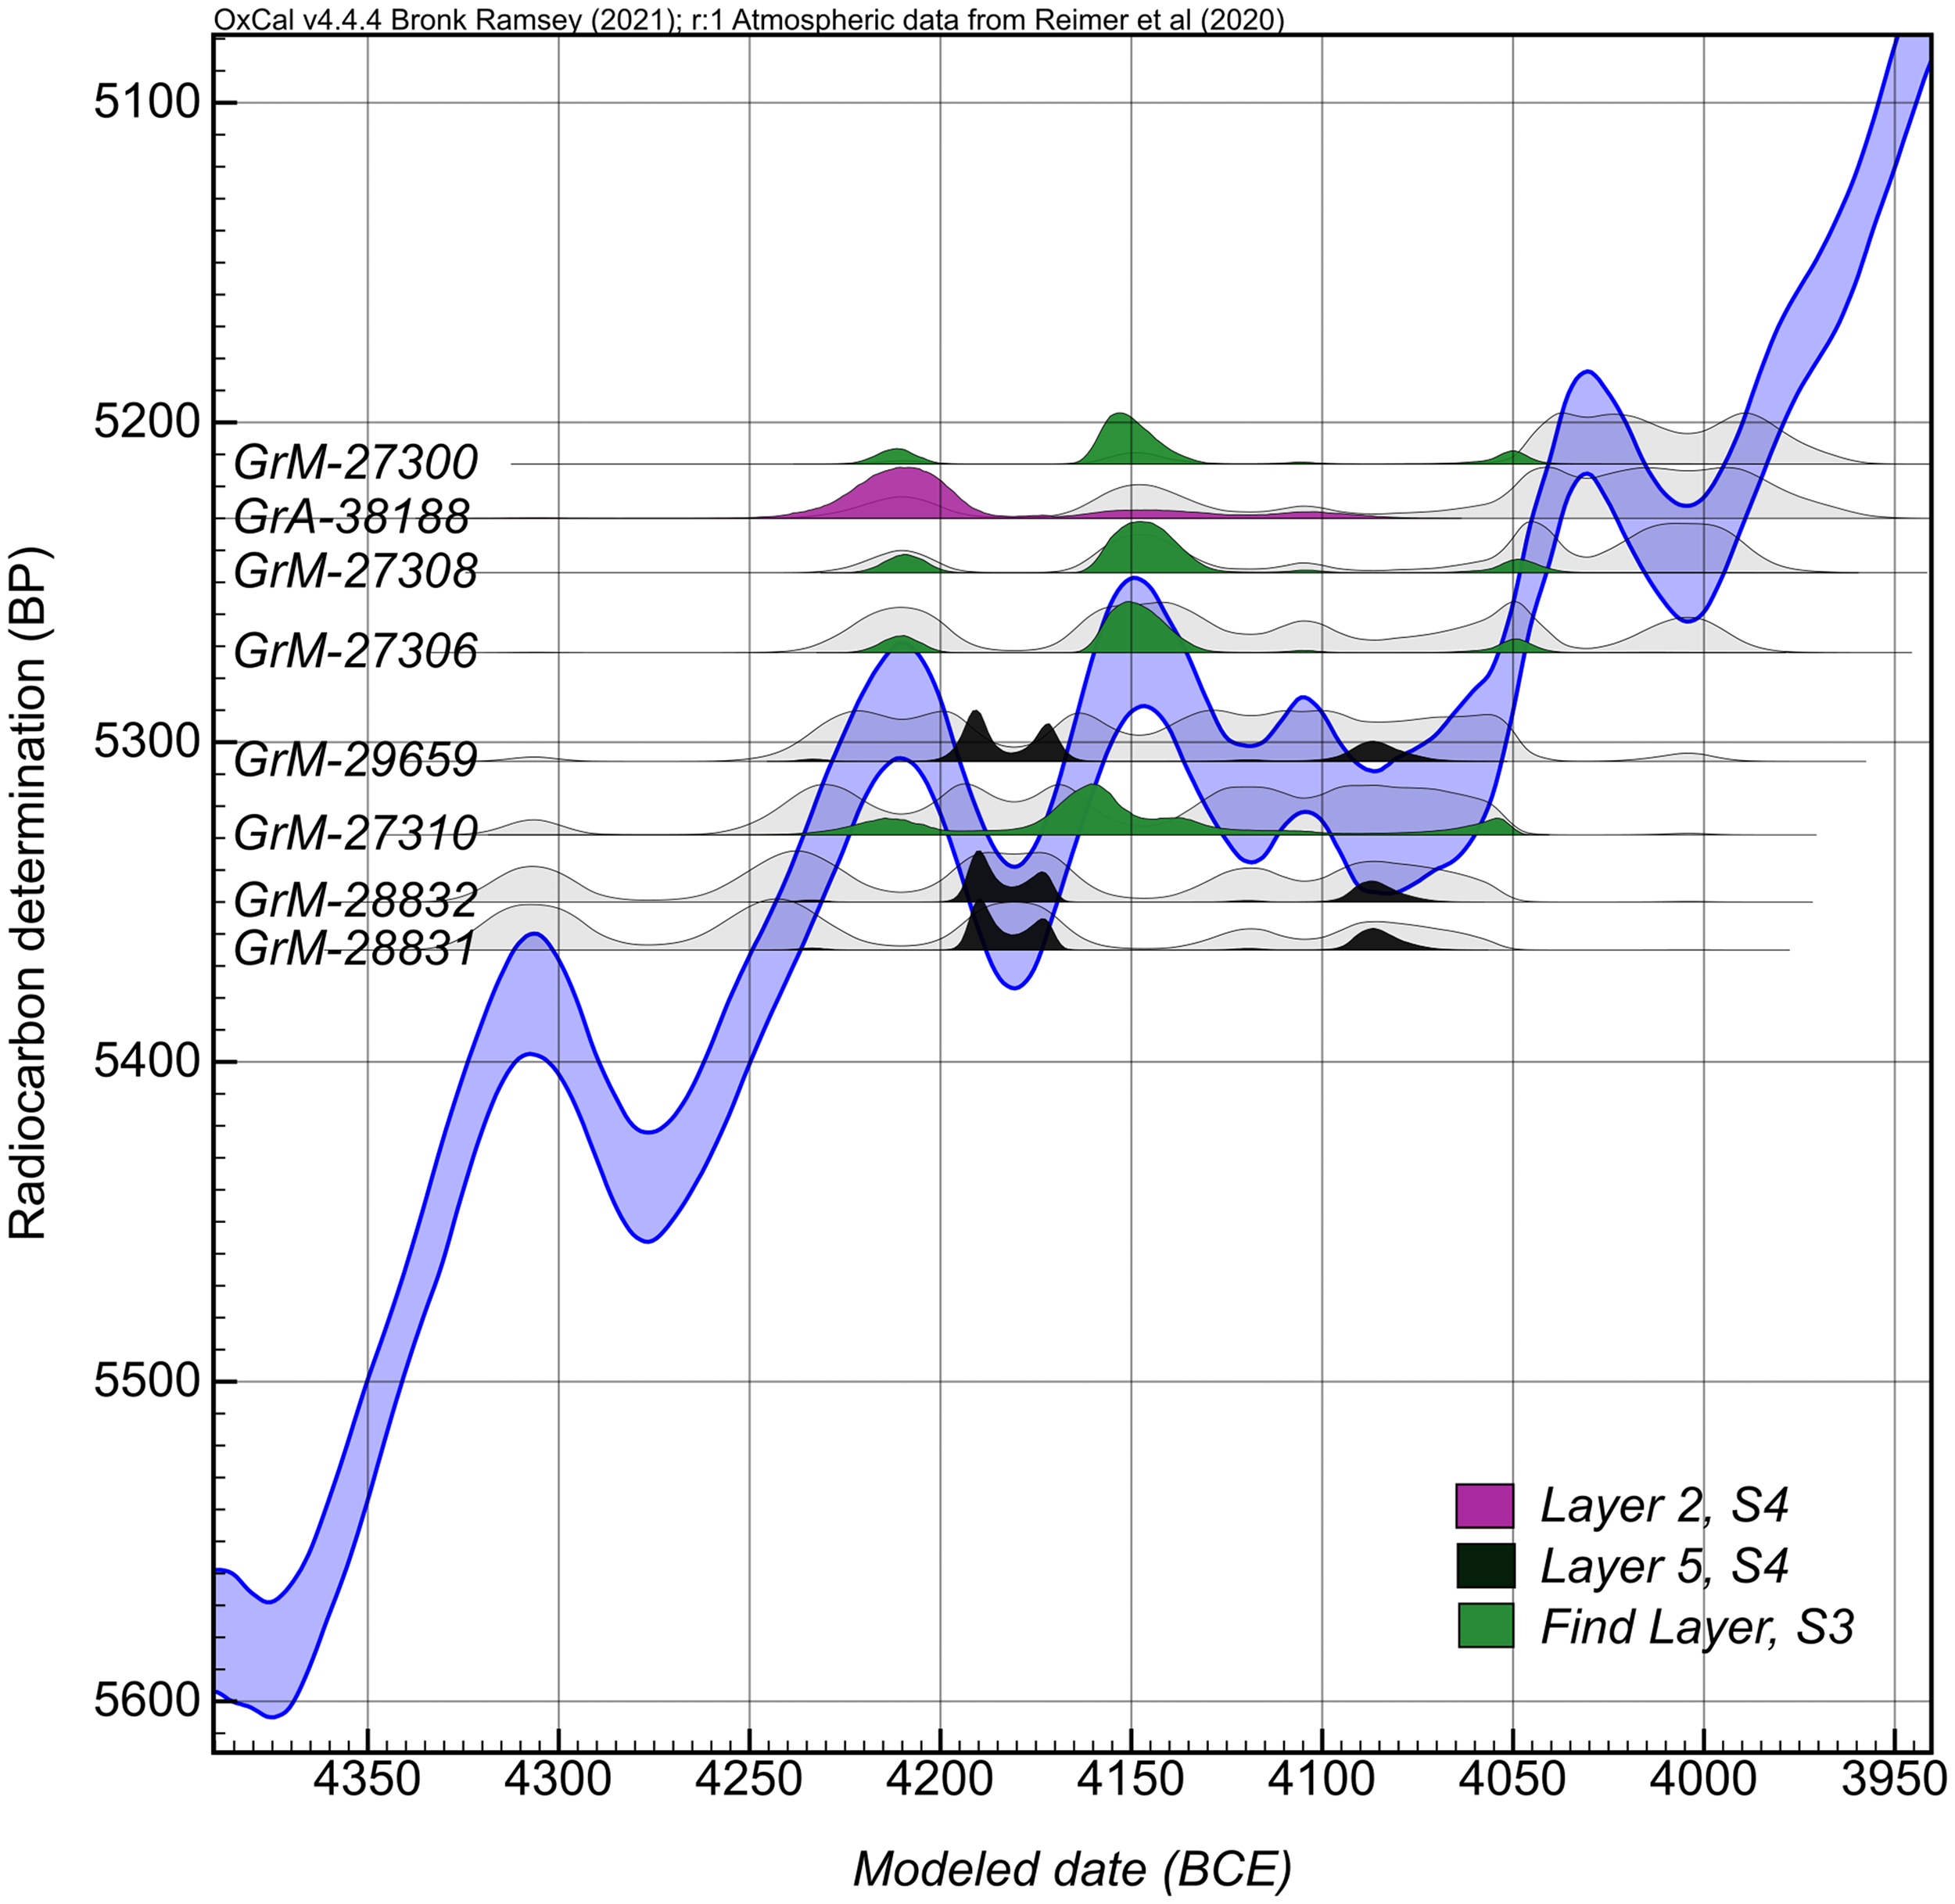
Figure 9 Model 2. The posterior probability densities of selected dates on a calibration curve; more specifically—calibration plateau 4300–4000 BCE. The individual dates are color coded to reflect their contextual allocation.
In comparison, the S4 dates in Model 2 exhibit a notable change in the output due to the inclusion of two dates from Layer 2 underlying the hiatus and Layer 5. This constraint narrows down the older mode of posterior probabilities of dates for this layer to a time range between ∼4200 and 4160 BCE. This range is in accordance with the Interval, which reflects a short-term, likely single-generational, anthropogenic presence (Figure 8). As a result of this constraint, any probability extending older than 4200 BCE was excluded, leading to a slightly stronger preference for the younger mode compared to Model 1. This is likely due to the absence of an additional constraint above Layer 5. However, the older mode still contains the majority of the remaining probability, which is in accordance with the results from Model 1.
In Model 2, we were able to calculate a more precise date range of Layer 2, associated with the oldest evidence of farming practices in the area (Huisman et al. Reference Huisman, Jongmans and Raemaekers2009; Huisman and Raemaekers Reference Huisman and Raemaekers2014). Modelled probabilities of both dates from this context fall between 4240 and 4190 BCE at 68% (1σ) range (Figure 8), with a minor portion of probability extending until 4100 BCE. The probability output for Start and End Boundaries follow the same pattern, with 68% (1σ) ranges 4240–4200 BCE and 4230–4170 BCE, respectively. The output of the Interval function for this layer indicates this event was of a punctuated nature, with median values of only ∼9 years. Similarly, the output of the Interval function for Layer 5 is significantly shorter than Model 1, returning a similar duration to Layer 2 (Figure 8).
Much like Model 1, the comparison of the Boundaries of each Sequence within these sites confirms their simultaneity (Figure 8). Additionally, when comparing the Boundaries of each Sequence using the Combine function, S3 shows no significant difference from Model 1. However, in the case of S4, the bimodal distribution for the Combined Start and End Boundary remains. Approximately 5% of the posterior probability lies between 4100 and 4080 BCE, while the majority (90%) of the distribution lies between 4200 and 4170 BCE. This distribution aligns with the pattern of a slight increase in preference towards the younger mode. Nonetheless, as the vast majority of the posterior probability remains within the range of 4200 and 4170 BCE, we propose that the chronology of S4 falls within these ranges.
Notably, the test models without any enforced Sequencing (simple bounded Phases for each layer) showed no significant difference in the outcomes observed (SI).
Inter-Site Chronological Comparison
The comparison of the Start and End Boundaries of the S3 and S4 sites (using the Combine function) indicates that the initiation and cessation of anthropogenic activity in Layer 5 and underlying Layer 2 at S4 were likely not simultaneous to the Find layer at S3 (Figure 8). Assuming our hypotheses are accurate, we propose the following sequence of events at S4: the agricultural field in Layer 2 was likely established first, followed by a relatively brief hiatus (Layer 3/4) in keeping with the archeological evidence, and subsequently succeeded by the refuse activity represented in Layer 5. The anthropogenic activities associated with both layers at S4 appear to have been short-term, possibly spanning a single generation or less.
Determining the extent of overlap between Layer 5 at S4 and Find Layer at S3 is challenging due to the presence of multimodal posterior distribution densities. There is an overlap in the modeled distribution densities of Sums (Figure 10), and the Boundaries at S3 cover a significant portion of the calibration plateau (Figure 8). The greater occupational time at S3 may contribute to the wider posterior densities observed.

Figure 10 Sums of probability distributions for layers at S4 and S3.
Adding the constraint of further radiocarbon dates below Layer 5, as was the case with the two dates available from Layer 2, in Model 2, demonstrated the potential of additional sampling from layers outside of the Find layer (e.g. tillage marks, see Huisman et al. Reference Huisman, Jongmans and Raemaekers2009; Huisman and Raemaekers Reference Huisman and Raemaekers2014). This can create a “sandwich effect” constraining the outputs and would have the potential to greatly enhance the chronological resolution of the S3 site. Future excavation or coring campaigns should consider implementing this strategy to further improve chronological precision.
Nevertheless, what is clear from our study is that anthropogenic presence at S4 commenced before S3 and had a significantly shorter duration which is in excellent accordance with the archeological evidence and observations made by the excavators, as discussed above (van der Waals Reference van der Waals1977; Schepers and Woltinge Reference Schepers and Woltinge2020).
Through our analysis, we not only achieved significant improvements in dating precision and the chronostratigraphies of these important sites but also determined the onset of the earliest known farming activity and animal management in this area (Figure 11). Based on our findings (Model 2), we propose that the emergence of cereal cultivation in the Dutch wetlands took place between 4240 and 4190 BCE (68.3% probability, or 4260–4100 BCE, 95%, Start Boundary Layer 2). This is followed by the emergence of animal management practices, as evidenced in Layer 5, S4, estimated to occur between 4200 and 4170 BCE (90.5% probability, Start Boundary Layer 5).

Figure 11 Estimated probability ranges for the onset of new subsistence practices in the Dutch wetlands. The former is the Start Boundary for Layer 2 (Phase) and the latter, Combined Start Boundary for Layer 5, based on radiocarbon measurements of spit 1 in all three vertical columns (Sequences), Model 2. Colored are 68% ranges where the bulk of probability lies.
CONCLUSION
Obtaining higher chronological resolution for short-duration sites located entirely on the calibration plateau, without the possibility of wiggle matching, presents several challenges. These challenges are further compounded by the absence of archeological layer stratification, ambiguous documentation of legacy data, and radiocarbon dates affected by inbuilt age.
In this paper, we presented a case study of the S3 and S4 Swifterbant sites, situated in the Dutch wetlands, which are considered pivotal for understanding the earliest stages of crop cultivation and animal management in the region. To overcome the lack of a well-defined sequence of archeological layers, we employed a novel approach. We radiocarbon dated unambiguously anthropogenic short-lived organic material from vertical sequences across the stratigraphic profiles and conducted Bayesian analysis. Through this method, we were able to refine the individual dates and investigate the temporal synchronicity between these two sites. The robustness of our models was confirmed through sensitivity tests.
Our analysis suggests the following timeframe of subsistence changes in the Dutch wetlands, with the majority of the probability falling within these ranges: the onset of cereal cultivation is estimated to take place between 4240 and 4190 BCE (68.3% probability), followed by the emergence of animal management practice between 4200 and 4170 BCE (90.5% probability).
The results of this study reveal an intriguing observation. The Swifterbant communities within the Dutch wetlands adopted crop cultivation and animal management practices within the span of a single generation, while still maintaining a nomadic and seasonal way of life. These results challenge the previously held belief of a gradual long introduction of agriculture in the area, suggesting instead a more punctuated process.
When we compare these results to evidence from neighboring regions outside the expansion of the Linearbandkeramik culture, such as the British Isles, Ireland, and South Scandinavia, agriculture seems to have been established in the Dutch wetlands at least two centuries earlier than in the neighboring regions. This raises interesting questions about the relationships between communities in these areas and the local dynamics surrounding the introduction of new subsistence practices, challenging the broad supra-regional narratives.
ACKNOWLEDGMENTS
The authors extend their gratitude to Arnoud Maurer and Dr. Rene Cappers for their valuable archeobotanical expertise and assistance with sample selection. Additionally, the insightful discussions with Dr. Hans Huisman and Dr. Mans Schepers were pivotal in shaping the conceptual framework of this paper.
This study is part of the project “The Emergence of Domesticated Animals in the Netherlands,” funded by the Dutch Research Council (NWO) (grant number 406.18.HW.026.) The funders had no role in study design, data collection and analysis, the decision to publish, or the preparation of the manuscript.
Supplementary Material
To view supplementary material for this article, please visit https://doi.org/10.1017/RDC.2023.126.


 Open access