
. Introduction
The greatest transformations of channels and floodplains occur during floods, which are most often generated by high rainfall. The rainfall floods are characteristic of the upper Vistula basin and are associated with long-term rainfalls or/and torrential rainfall (Starkel, 2001). The sudden melting of snow induces snowmelt floods, sometimes accompanied by ice jams (Grześ, 1991). The increase in channel flow can be so significant that when the bankfull discharge is exceeded, water flooding occurs in the flood-plain. Breaking the natural levees during floods causes the formation of crevasses, in the outlet of which the crevasse splays are deposited. Breaking the artificial flood embankments of the Vistula River, e.g. during the floods in 1997, 2001 and 2010, caused the formation the deep erosion holes and flood cones (splays) (Gębica and Sokołowski, 2001). Sediments deposited during extreme floods, the so-called slackwater flood deposits (Baker, 1987), serve as a particularly valuable source of geological archival material enabling reconstruction of ancient palaeofloods. These are usually fine grained flood sediments (sands, silts [muds] and clays), deposited during high water stages in the marginal part of the floodplain, where there is a significant reduction of floodwater flow velocity. These sediments can be deposited on the terraces in the alluvial valleys, and narrow and deep reaches of gorges and canyons, especially in places of occurrence of rock terraces, alcoves and caves cut in the rocky slope (side) of valleys (Baker et al., 1983; Benito et al., 2004). Palaeoflood slackwater deposits have been recognised in many regions in the world, characterised by a variety of physiographic and climatic conditions, for example in the USA (Baker, 1987), Australia (Pickup et al., 1983, Israel (Greenbaum et al., 2000), Namibia (Heine and Völkel, 2007) and India (Kale et al., 2000; Sridhar, 2007). To determine the age of fluvial sediments, as well as the chronology of flood phases (events), absolute dating using the radiocarbon method for the dating of organic samples (plant seeds, charcoal, woods, organic detritus) and/or luminescence methods for the dating of inorganic sediments (silts, sands) are necessary. In Europe, the dating of Late Glacial and Holocene slack water flood deposits was carried out in the Tagus River valley in central Spain (Benito et al., 2003).
The location of sediments in the Siedleszczany profile, 6 m above the floodplain, originally suggested that we are dealing with alluvial sediments of the Vistulian terrace (6–8 m above the level of the Vistula riverbed).
The aims of the present research were as follows: (1) to determine the origin of the sediments based on geomorphological and sedimentological analysis, and (2) to specify the absolute chronology of these alluvial sediments. The dating results of these sediments were intriguing, leading to an attempt to explain their origin and the hydrogeomorphological processes responsible for their formation.
. Study Area
The study area is situated in the Vistula River valley within the Sub-Carpathian Basins (western part of the Sandomierz Basin) (Fig. 1). The Vistula drainage basin covers an area of 194,000 km2, and the length of the river, from sources in the Silesian Beskides in the Carpathians to the estuary of Baltic Sea, is 1092 km. The average height of the drainage basin is 270 m a.s.l., and the highest point in the catchment reaches 2655 m a.s.l. in the Tatra Mts. (Starkel, 2001). In Sandomierz town, the catchment of the upper Vistula River exceeds 31,000 km2, and the length of the Vistula River is 400 km. The average annual discharge of the Vistula river in Sandomierz is 220 m3/s and the maximum discharge reaches 6700 m3/s (1997) (Drezińska, 2011).
Fig 1.
Location of the Siedleszczany site on the map of Poland – A; and on the map of the Vistula valley near Tarnobrzeg – B.
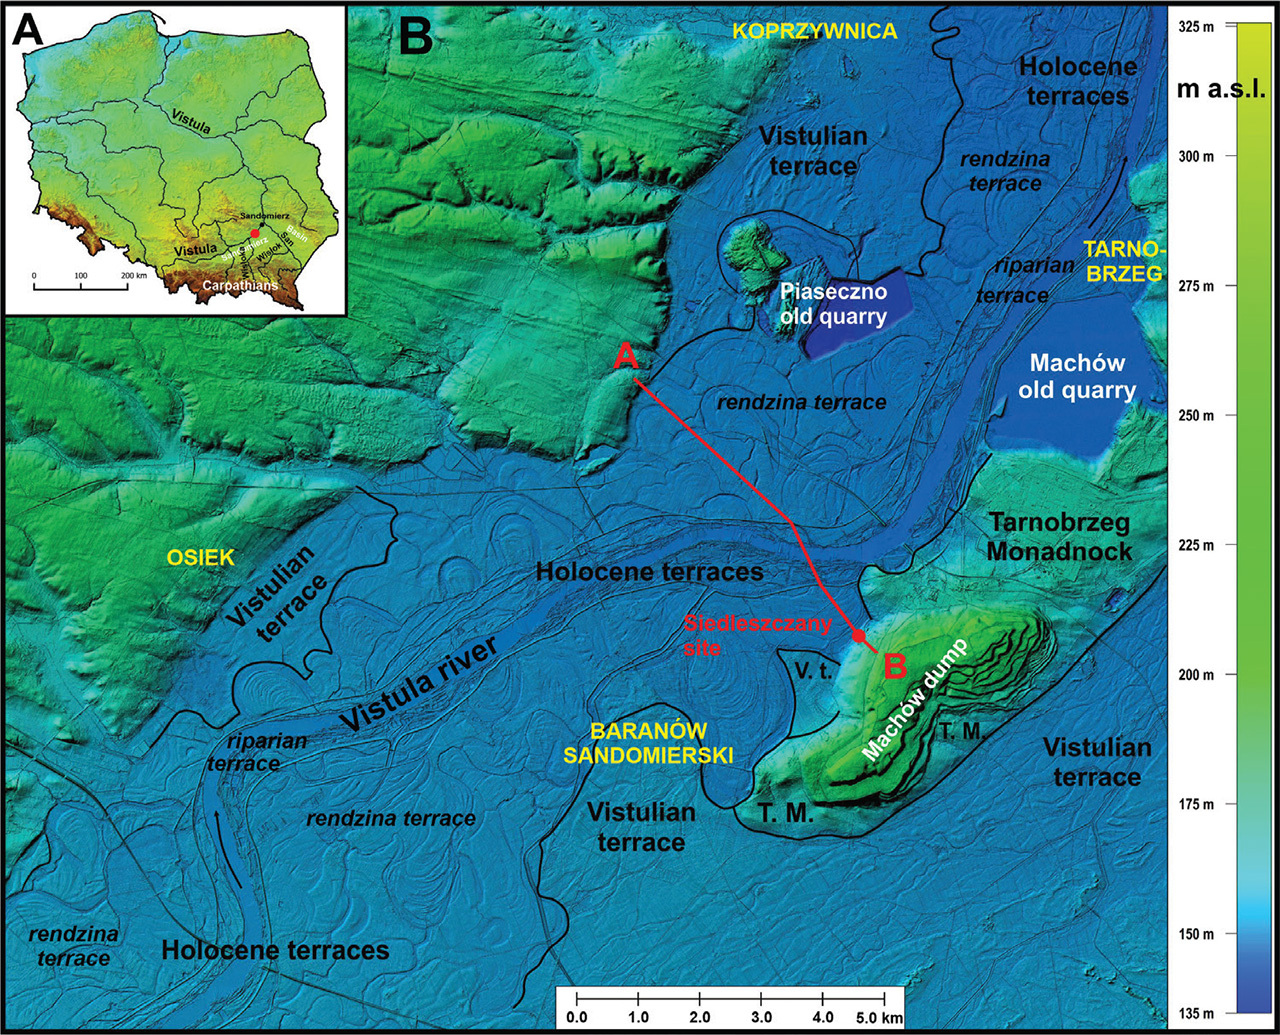
Within the Vistula valley, between the Wisłoka and San Rivers, there are two valley troughs separated by the Tarnobrzeg Monadnock. This monadnock rises 20 m above the valley floor and stretches for 20 km with a width of 1–3 km. It is built by Miocene clays, covered by remnants of preglacial fluvial deposits and glacial sediments from the San 1 (Elsterian) Glaciation (Laskowska-Wysoczańska, 1971; Mycielska-Dowgiałło, 1987; Marks, 2023). The Tarnobrzeg Monadnock is probably an erosional residual form formed as a result of the erosion of rivers and glacial waters. Initially, in the late Miocene, but after the disappearance of the Paratethys Sea, it was shaped by river erosion and denudation. Similar processes operated in the Pliocene and Lower Pleistocene. During the San 1 Glaciation (Marks, 2023) it was modelled by meltwater. In the Late Pleistocene and Holocene fluvial, denudational, aeolian and anthropogenic processes dominated. The valley troughs on both sides of the Tarnobrzeg Monadnock are cut in Miocene clays and reach in the lowest places to a depth of 20–24 m below the floodplain (Mycielska-Dowgiałło, 1987). Both valley troughs were active in the Eemian Interglacial (Laskowska-Wysoczańska, 1971), but to varying degrees used by the Wisłoka and Vistula Rivers. We know that the western trough developed during the Last Glaciation (Vistulian), because a fragment of wood in the channel alluvia of Vistula River in Piaseczno at a depth of 11 m was dated by the radiocarbon method at 40,700 ± 2000 BP (GrN 4868 68.3% conf. int.: 45,800– 42,400 cal BP, Mycielska-Dowgiałło, 1978, 1987). The western valley trough is currently used by the Vistula River, which has a riverbed width of 150–300 m, cut into the floodplain at 2–3 m (Fig. 1). The Machów dump stretches for a length of 4.8 km, the width of the heap is 2.6 km and its height is 50 m. The construction of Machów dump began around the mid-1960 s. The main part of the heap was built on the Tarnobrzeg Monadnock, and a small part of it was also found at the bottom of the Vistula valley (Fig. 1).
Characteristics of Terrace System and Palaeochannels of the Vistula River
In the Vistula valley between Osiek and Baranów Sandomierski and Tarnobrzeg town and Koprzywnica in the Holocene valley floor, two terraces can be distinguished (Figs. 1 and 2). The younger terrace, the so-called riparian terrace with a height of 1–3 m above the water level in the Vistula riverbed, is narrow with a width of 1–1.5 km. It has a character of braidplain formed in the last 200–300 years. The older terrace, the so-called rendzina terrace with a height of 3–5 m above the water level in the Vistula river-bed, has a width of 5–6 km. This terrace was formed due to meandering of the Vistula riverbed during the Holocene (Figs. 1 and 2). Above the Holocene terraces rises the surface of the Vistulian terrace, 5–10 m height above the water level in the riverbed. (Fig. 1). On its surface, traces of braided channels have been preserved. This terrace is in places overbuilt by aeolian sands. The original width of this terrace was considerable, and could be up to several kilometres. In the Holocene it was cut and covered in the lowest places by the overbank deposits.
Fig 2.
Morphological profile across the floor of the Vistula River valley and location of studied exposure at Siedleszczany. Location of cross-section line AB – see Fig. 1B.
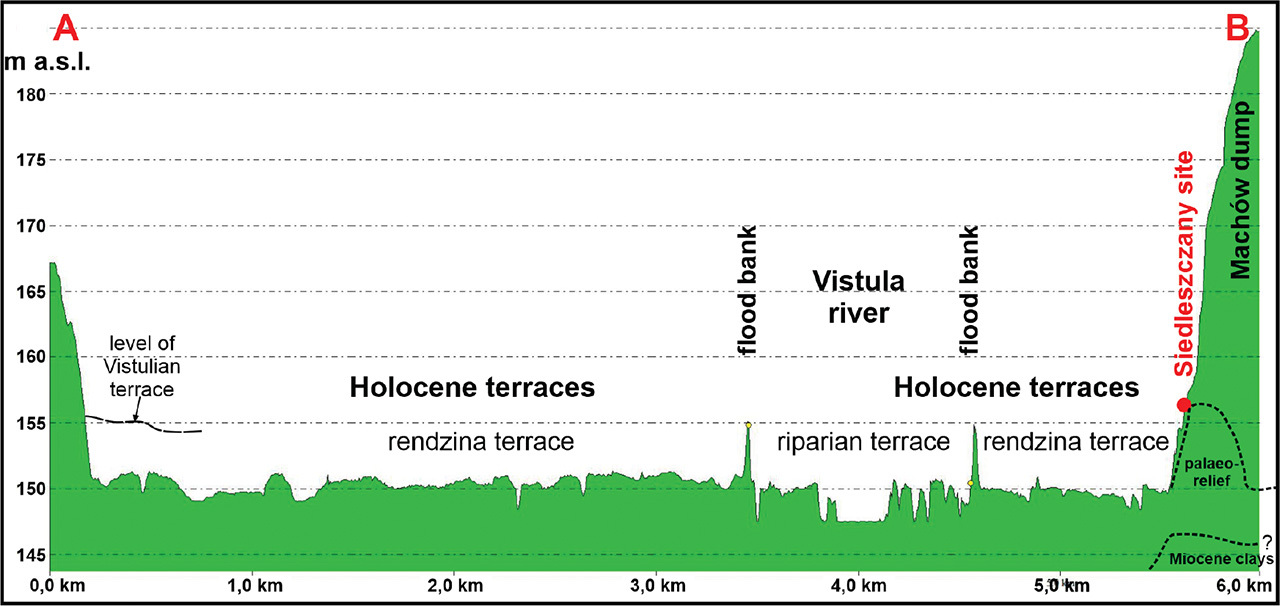
At Siedleszczany, situated in the Vistula valley south of Tarnobrzeg town, a sequence of alluvial sediments with a thickness of several metres has been identified near the western slope of the Tarnobrzeg Monadnock (50°30′18.1′′N, 21°35′34.1′′E). The top of these sediments is located about 8 m above the water level of the Vistula riverbed and about 6 m above the level of the Holocene rendzina terrace (Fig. 2). The location of the examined sandy sediments in the position of the Vistulian terrace could suggest that the sediments were formed during the last cold stage.
. Materials and Methods
Sedimentological Methods
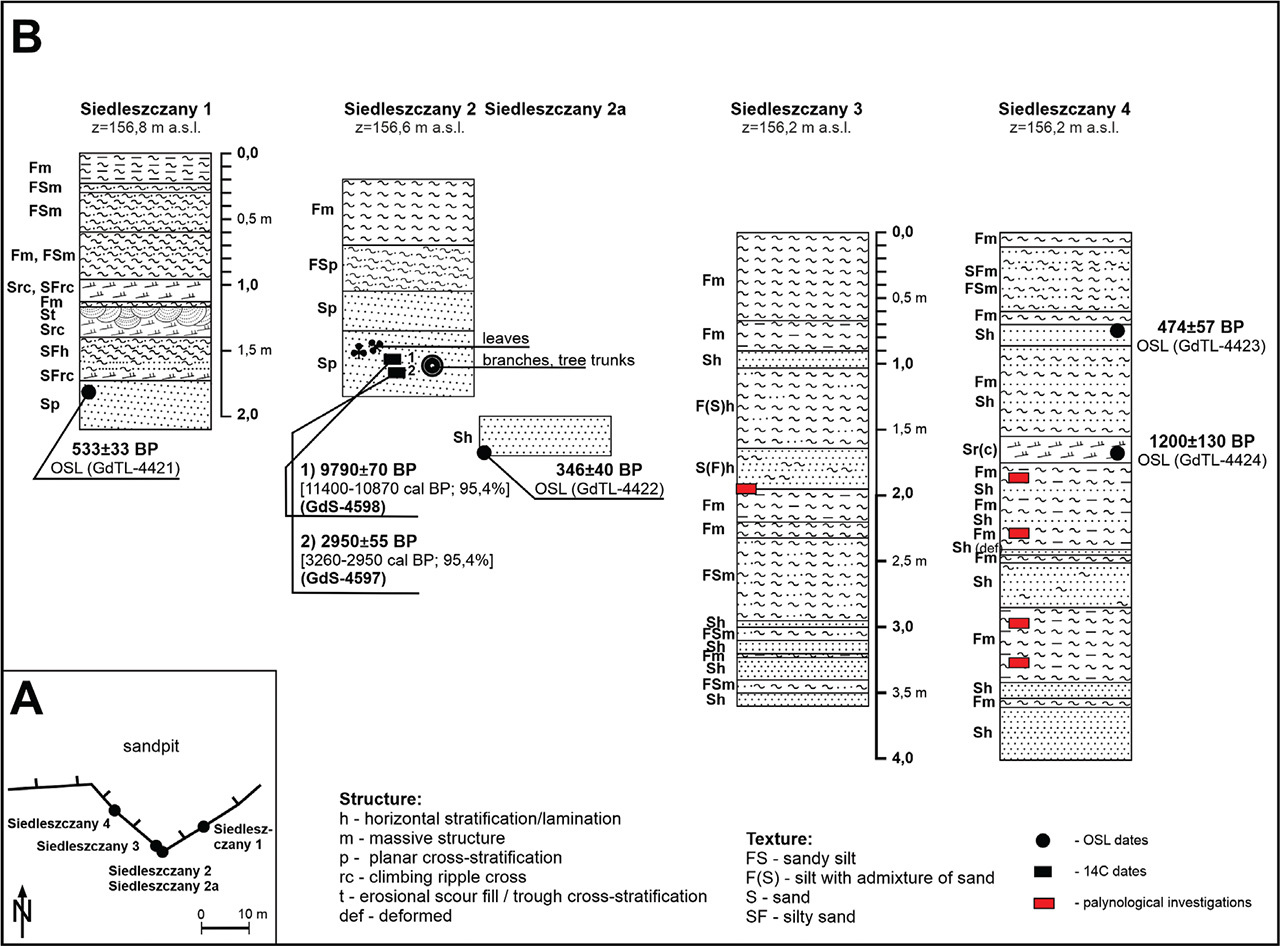
Four profiles (Siedleszczany 1–4) with a thickness of 1.5–4.0 m were described. The distance between the examined profiles was from 2 m to 20 m apart, while the differences in relative height between the profiles from 30 cm to 60 cm (Figs. 3A and B). The distances and heights of the profiles were measured using the tape measure and hand-held Global Positioning System (GPS) device. Due to the availability of exposures, the research covered only the highest (top) part of the sand pit excavation. From the profiles of Siedleszczany 1, Siedleszczany 2 and Siedleszczany 4, thirty five samples were taken for grain size analysis. Samples were taken with each lithologically distinguished layer in the profile, on average every 10–30 cm. A lithofacial letter code was used to describe the structural and textural features of sediments (Zieliński and Pisarska-Jamroży, 2012).
In the profiles of Siedleszczany 1, 2a and 4, from the depth of 0.75–1.80 m, four samples of sands were taken for OSL dating (Fig. 3B). Samples were taken from cleaned walls of exposure using plastic tubes 50 cm long, driven perpendicularly into the wall of outcrop. After pulling up pipes with sediments, the samples were protected from sunlight, packed and sent to the laboratory. In the profile Siedleszczany 2, two samples of organic detritus (organic macrofossils) with woods for 14C dating were taken from sands at a depth of 1.27–1.30 m and 1.32–1.37 m (Fig. 3B). Samples for palynological analysis were taken in the profile Siedleszczany 3, with one sample being extracted from the clayey mud layer at a depth of 1.95–2.02 m; and in the profile Siedleszczany 4, three samples were extracted from the mud layer at a depth between 1.75 m and 2.41 m (Fig. 3B).
OSL Dating
Four samples were analysed in the Gliwice Luminescence Laboratory (Moska et al., 2021) using the optically stimulated luminescence (OSL) method. For OSL measurements, grains of quartz (125–200 μm) were extracted from the sediment samples by routine treatment with 20% hydrochloric acid (HCl) and 20% hydrogen peroxide (H2O2) to remove carbonates and organic matter from the samples. The quartz grains were separated using density separation with the application of sodium polytungstate solutions, leaving grains of densities between 2.62 g/cm3 and 2.75 g/cm3. The grains were sieved, before etching with concentrated hydrofluoric acid (HF). Dose rates were calculated using an online dose rate calculator (Tudyka et al., 2023), which contains all the latest conversion factors. We assumed that the average water content was (10 ± 3)%. All necessary data for dose rate calculations are presented in Table 1.
Table 1.
Results of OSL dating of fluvial sands at Siedleszczany profiles: laboratory code, depth of the samples, and dose rates.
[i] Overdispersion with equivalent dose and OSL ages obtained using the MAM or CAM model (Galbraith et al., 1999).
All OSL measurements were performed using an automated Risø TL/OSL DA-20 reader fitted with a calibrated 90Sr/90Y beta source delivering about 6.0 Gy/min to grains at sample position; and a 6 mm Hoya U-340 filter was mounted during OSL measurements. Equivalent doses were determined using the single-aliquot regenerative-dose (SAR) protocol (Murray and Wintle, 2000). Final equivalent dose (De) values were calculated for all samples using the Central Age Model (CAM) or Minimum Age Model (MAM) (Galbraith et al., 1999) using R package ‘Luminescence’ (Kreutzer et al., 2020).
14C Dating
Radiocarbon dating using the classic LSC technique was performed in the Gliwice Radiocarbon Laboratory (Pazdur et al., 2003). Two fragments of wood from profile Siedleszczany 2 from the depths of 1.32–1.37 m and 1.27–1.30 m were dated (see Fig. 3B). After preliminary mechanical cleaning of the samples, they were subjected to standard Acid-Base-Acid (ABA) chemical pre-treatment, the purpose of which is to remove fulvic and humic acids and possible carbonates deposited on the dated organic material. Each sample was then charred in a pyrolysis process and then converted to benzene through sequential steps including lithium carbide synthesis, hydrolysis and acetylene trimerisation (Pazdur et al., 2003; Gill et al., 2022). In order to remove radon, which interferes with the measurement of beta activity, the samples were aged in a frozen state for more than 30 days. The activity of the 14C isotope was measured using the Quantulus 1220TM spectrometer (Pawlyta et al., 1997). To derive ages in absolute calendar years, the radiocarbon ages acquired underwent probabilistic calibration using the OxCal v. 4.4 program (Bronk Ramsey, 2009) and the most recent calibration curve (Reimer et al., 2020).
Palynological Analysis
Three samples from the profile Siedleszczany 4 and one sample from Siedleszczany 3 were studied using pollen analysis.
For pollen sample preparation we used a standard method including treating the sediment with 10% HCl to get rid of carbonates, and 10% KOH solution to remove humic acids. The mineral particles were separated using the dense-media separation method according to Nakagawa et al. (1998). Subsequently, acetolysis was applied (Erdtman, 1936).
. Results
Sedimentology
Two sequences of sediments were distinguished in the profiles (Figs. 3B and 4). The lower sequence (profiles 3 and 4) at a depth of 4–2 m consists of fine and medium sands, silts interbedded with sands and silts with a thickness of 0.5–1.0m. The upper sequence (profiles 1 and 2) includes fine and medium-grained sands planar cross stratified with plant detritus, turning into ripple laminated silty-sandy deposits, covered with sandy silts in the top.
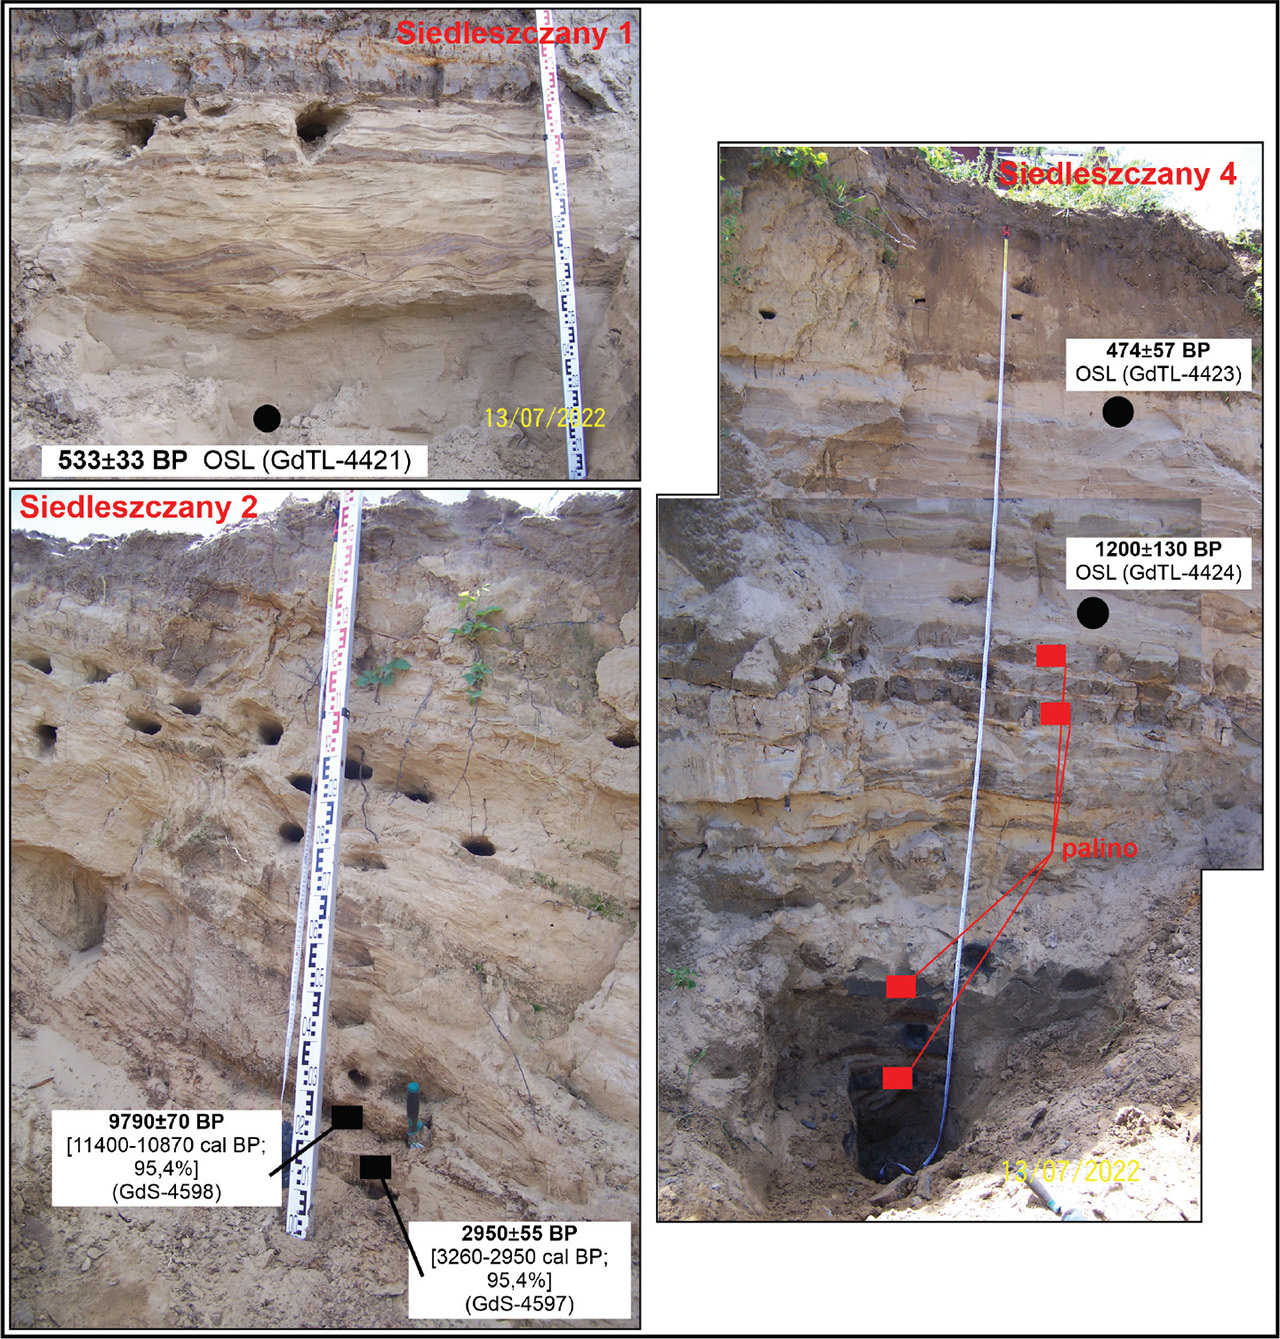
Fig 4.
Photos of Siedleszczany 1, Siedleszczany 2 and Siedleszczany 4 profiles with location of OSL and 14C dating samples and samples for palynological analysis.
When repeated instances of upward fining sequences is discovered in profiles, this may indicate, at the very least, the occurence of multiple palaeoflood events. Medium- and fine-grained sands, planar cross stratified and fine grained sands with ripplemarks, were probably formed during the culmination of flow. The fine grained silts and clays deposited in the top of sequences were formed during the fall of flood wave (Heine and Völkel, 2007). In profiles Siedleszczany 3 i 4 with a thickness of 3.6 m i 4.0 m, there is sequence of horizontally stratified sands and massive silts. There are six to seven such sedimentary sequences (units), which may correspond to six or seven flood events (Figs. 3B and 4). In the profile Siedleszczany 1 with a thickness of 2.1 m, only in the bottom part are there sandy-mud sequences, indicating several sedimentation (flood) episodes. The top part of this profile with a thickness of 1 m is obliterated by soil-forming processes. The accumulation of plant detritus and small woods in fine- and medium-grained sands (profile Siedleszczany 2) at a depth of 1.06–1.55 m (Figs. 3B and 4) is probably related to the floatation of organic material in places of water turbulence (eddies).
OSL Dating
All obtained age distributions are presented in Fig. 5 in terms of relative probability density functions (Berger, 2010). The overdispersion parameter was calculated for all samples. For three samples (GdTL-4422, GdTL-4423 and GdTL-4424) this parameter exceeds 20%, and dose distributions are not unimodal – that is why the MAM model was applied for final equivalent doses calculation. For sample GdTL-4421, the overdispersion parameter was 13% and the distribution appears to be unimodal; therefore, it can be assumed that the tested material represents the group of the well-bleached quartz (Moska, 2019) and the CAM model can be applied for final equivalent dose calculation.
Fig 5.
Distribution of the relative probability density function for the results of dating of all investigated luminescence samples.
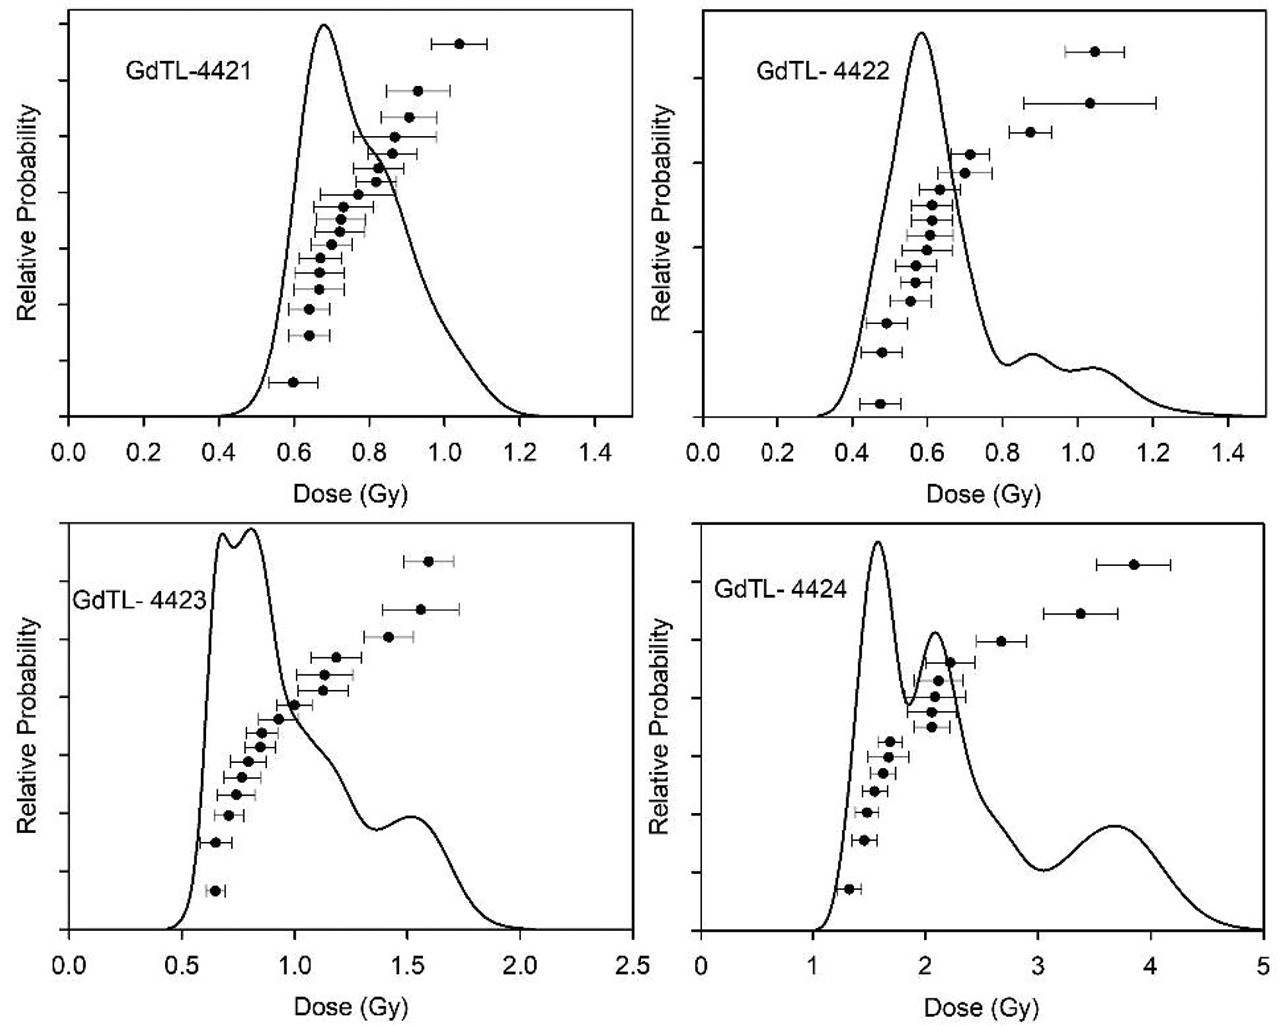
Resultantly, for profile Siedleszczany 4 at the depths of 1.7 m and 0.75 m, an investigation of the sands yielded the OSL ages of 1200 ± 130 BP (GdTL-4424) and 474 ± 57 BP (GdTL-4423) (Table 1, Figs. 3B and 4), respectively. In profile Siedleszczany 2a, the sample of sands at a depth of 2 m obtained the OSL age of 346 ± 40 BP (GdTL-4422) and in profile 1 at a depth 1.8 m 533 ± 33 BP (GdTL-4421) (Table 1, Figs. 3B and 4). OSL dating showed a very young age of the sediments in three analysed profiles. More detailed information is presented in Table 1.
The oldest dated sediments were accumulated in the profile Siedleszczany 4 around the 8th century AD (from “Latin Anno Domini”), while the youngest event of deposition took place in the 15th–16th centuries AD.
14C Dating
In profile Siedleszczany 2, plant detritus with pieces of wood were present in the sands at 1.06–1.55 m depth. Results of dating of two pieces of wood are presented in Table 2 and in graphical form in Fig. 6.
Table 2.
Results of radiocarbon dating at Siedleszczany 2 profile.
[i] Calibration was done using OxCal program v4.4.4 (Bronk Ramsey, 2009) and calibration curve IntCal20 (Reimer et al., 2020).
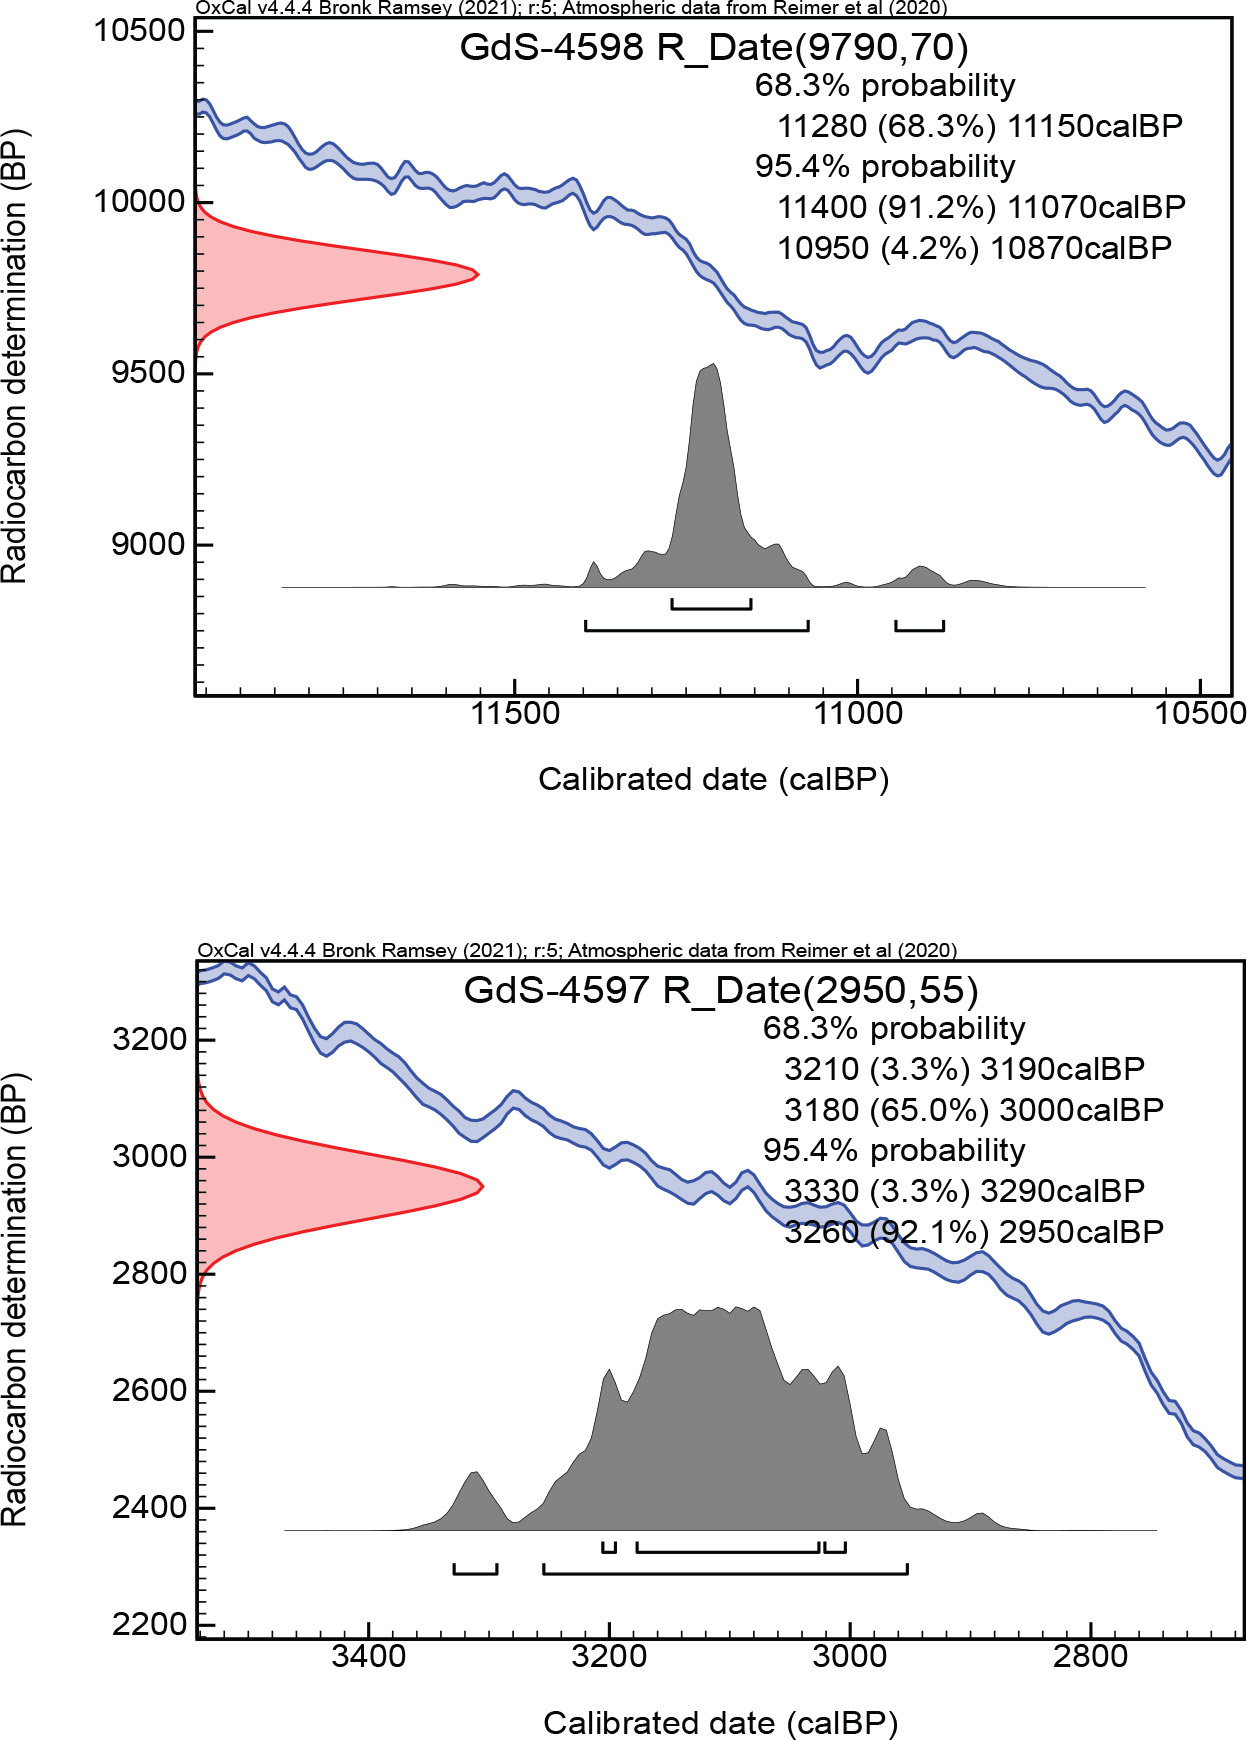
Dating of the wood sample from the depth of 1.27–1.30 m allowed determination of the age of deposits at 9790 ± 70 BP (11,400– 10,870 cal BP, GdS-4598, Table 2). In the same profile, a much younger age of 2950 ± 55 BP was observed corresponding to the sample of wood from the depth of 1.32–1.37 m (3330–2950 cal BP, GdS-4597, Table 2). Such results indicate that the radiocarbon dated material is derived from the erosion of older (different age) Holocene sediments and is redeposited.
Palynology
The results of the pollen analysis due to a very low sporomorph concentration are not suitable for quantitative analysis, and thus they were compiled in the form of tables (Tables 3 and 4) showing only the qualitative composition of pollen spectra and the absolute number of determined pollen grains or spores. Moreover, pre-Quaternary sporomorphs were present in all the studied samples. The possible source of the redeposited taxa most probably was tertiary sediments of Krakowiec clays or preglacial sands and Pleistocene deposits.
Table 3.
Pollen spectra from the profile Siedleszczany 4.
Table 4.
Pollen spectra from profile Siedleszczany 3.
The presence of certain tree taxa such as Fagus and Carpinus, as well as the pollen of cultivated plants such as Fagopyrum, and plants associated with human activities, for instance Plantago lanceolata, suggest a Late Holocene age for the sediments. Nevertheless, some pollen taxa associated with open landscapes and cooler climates are also present. In sample Siedleszczany 4 at the depth of 325–330 cm, Betula nana pollen was present; it was also observed in the pollen spectrum from the sample Siedleszczany 3 at the depth of 195–202 cm. There were also found taxa associated with open landscapes: Helianthemum and Linum. Principally, the pollen spectrum from Siedleszczany 3 is constituted of pollen taxa that originated from open landscapes, perhaps belonging to the Late Glacial age.
. Interpretation and Discussion
Thus, the analyses and dating performed did not confirm the hypothesis of a Vistulian age of the sediments. However, the pollen spectrum from profile Siedleszczany 4 from the depth of 3.30–3.35 m contains pollen of B. nana t. and Helianthemum (Table 3), and this may be an indication of Late Glacial origin, corresponding to at least part of the sediments. The occurrence of very young fluvial sediments situated on the western slope of the Tarnobrzeg Monadnock at a height of 6 m above the Vistula floodplain (rendzina terrace) (Fig. 2) is associated with sedimentation during the ice-jam flood (thus implying narrowing of the valley bottom). The ice jam blocked the flow of water in the (main) channel of the Vistula, causing the dammed flood waters to overflow onto the floodplain. The overflow of waters through the ice barrier was accompanied by intense deep erosion and accumulation. The damming of flood waters caused the water level to rise to a height at least 6 m above the rendzina terrace and the accumulation of sediments near the slope of the Tarnobrzeg Monadnock. The structure of the sediments at Siedleszczany (sequences of fine-upward grading, sands with cross-stratification on a small scale in the profiles Siedleszczany 1 and 2) (Figs. 3B and 4) resembles the crevasse splays described in the literature (Miall, 2006). A certain analogue for the interpretation presented here may be the sediments of flood cones (splays) formed in the Vistula valley as a result of the breaking of flood embankments (e.g. in 1997, 2001 and 2010) (Gębica and Sokołowski, 2001; Gębica et al., 2019). In the profiles Siedleszczany 3 and 4, horizontal stratified sands and massive silt structures dominate, which should be tied with sheet flows formed during intense floods. It is also not excluded that flood deposits dating to the Late Holocene are underlain by older alluvial sediments.
The study has yielded more information on large floods in this area – both ancient and historical floods. Dendrochronological studies of subfossil trunks of ‘black oaks’ performed by Krąpiec (1996) from the outcrop in Machów show that around 1020–1030 AD a large flood took place here. In 1813, central Europe was affected by flooding, and the affected areas included regions in the Duchy of Warsaw, as well as regions forming part of modern-day Hungary, Germany and the Czech Republic (Majewski, 2020). It was caused by heavy rains in the summer, and also downpours lasting from 26 to 29 August. In Baranów Sandomierski, in the porch of the parish church, there is a sign determining the water level from 27 August. Its elevation can be determined at approx. 153 m a.s.l.
On the walls of the castle in Baranów Sandomierski, built at the end of the 16th century, there are signs of the high water stage (large flood), when floodwater reached the elevation of approx. 155 m a.s.l. (Gębica, 2004). This flood took place on 10 July 1867 (Mleczek, 2016). In July 1934 there was extreme flooding in this area, which was induced by heavy rainfalls during 13–17 July (Lewakowski, 1935). It covered the entire width of the Holocene floor of the Vistula River, and in some places the floodwater flooded the lower parts of the Vistulian terrace.
These data indicate that extreme (large) floods in the Vistula River valley near Baranów Sandomierski – Tarnobrzeg could occur much more often. Therefore, systematic efforts should be undertaken in the Vistula valley on the research of other new sites with slackwater deposits in order to correlate palaeoflood events during historical and prehistorical times.
. Conclusions
The Siedleszczany site in the Vistula River valley is the first site of this type in Poland, where a sequence of slack-water flood deposits has been documented and dated using OSL and 14C methods. The presence of a 2–4-m sequence of fluvial sediments on the western side of the Tarnobrzeg Monadnock in the Vistula valley, situated at an elevation of 6–8 m above the Vistula riverbed, initially indicated that these deposits could be from the overflood (Vistulian) terrace. However, dating using the OSL method revealed a relatively young age for the sand deposits, ranging from the 8th century AD to the 15th–16th centuries AD. The age of organic material within the sediments, determined through radiocarbon dating, is significantly older compared to the age of the sands determined using the OSL method. This is because the dated material has been eroded from older Holocene deposits. Palynological analysis of the silt sediments further supported this finding, as it identified, besides the Holocene pollen grains, also those from the Late Glacial and other Quaternary periods, and even from pre-Quaternary ones. The presence of Fagus and Carpinus pollen, as well as pollen from cultivated plants associated with human activities, suggests a Late Holocene age for the sediments. Consequently, the hypothesis that these fluvial sediments originated from the Vistulian age was not confirmed. The dating and analysis results indicate that the sandy sediments on the western side of the Tarnobrzeg Monadnock in the Vistula valley may have been deposited during extreme floods. The presence of upward fining sequences observed in the profiles suggests the occurrence of multiple palaeoflood events.