
The Impacts of CAP Subsidies on the Financial Risk and Resilience of Hungarian Farms, 2014–2021


Department of Agricultural Economics and Agricultural Policy, Institute of Agricultural and Food Economics, Hungarian University of Agriculture and Life Sciences, 2100 Gödöllő, Hungary
*
Author to whom correspondence should be addressed.
Risks 2024, 12(2), 30; https://doi.org/10.3390/risks12020030
Submission received: 20 December 2023
/
Revised: 21 January 2024
/
Accepted: 23 January 2024
/
Published: 3 February 2024
Abstract
:The present paper empirically analyzes the efficiency of European Union (EU) subsidies for farms in the Southern Great Plain region of Hungary between 2014 and 2021. The aim of this analysis was to explore whether the subsidies increased the resilience of farms, enhancing their profitability, liquidity and solvency, and economic efficiency, measured by the usual financial indicators of farm performance. The analysis also evaluated the ability of farm businesses to create and retain jobs, i.e., to increase employment in the rural environment, focusing on differences between the subsidized and non-subsidized farms. The research analyzed all agricultural companies of the selected region. The methodology was a non-parametric statistical analysis (Kruskal–Wallis test, Dunnett’s T3 test) for identifying significant differences between subsidized and non-subsidized farms in the 8-year period. Results show that subsidies significantly improved the financial stability, resilience and efficiency of subsidized farms only in the micro size category, and the employment indicators deteriorated more in subsidized farms than in non-subsidized ones. Thus, the intended purpose of the subsidies was not entirely realized, and positive impacts were noticeable only in the micro enterprises. This might imply that subsidies contributed to the survival of non-viable enterprises instead of enhancing their competitiveness.
1. Introduction
Agricultural producers face strong competition in both domestic and global markets. Challenges include the changing business environment, and as a specialty of agriculture, the changes in the natural environment, too. These conditions have a crucial impact on costs and revenues, influencing farm prosperity and success, reflected by their financial situation. A weak financial position can easily lead to bankruptcy, which affects food supplies, food prices, and the employment situation. Therefore, assessing the resilience or vulnerability of agricultural enterprises is important not only for the farming community, but for consumers, farm labor, and eventually society as a whole (Vavrek et al. 2021; Polukhin and Panarina 2022; Wolf and Karszes 2023; Jedik and Stalgienė 2018).
The resilience or vulnerability of any enterprise depends on the risks to be assessed and managed. Risk means the exposure to harm or loss; it includes all potential outcomes that might damage the business. Managing risks requires identifying sources and types of risk, predicting their occurrence, evaluating their impacts, and finding ways to avoid or minimize those impacts (Wolf and Karszes 2023; Kahan 2008). Risks are usually categorized as production, market, human, institutional and financial risks. Production risk relates to changes in yield due to the uncertain occurrence of factors like weather, pests, and diseases. Market risk is related to uncertainty about prices and market access. Human risk refers to uncertainties arising from the relationship between human resources and the farm business. Institutional risk is created by regulations and legal liabilities. Financial risk is defined as uncertainty about interest rates, access to external finance, ability to meet cash flow needs, and the changing market value of collateral (Wolf and Karszes 2023; Kay et al. 2008; Kahan 2008).
Risk tolerance means that the firm can remain viable in the long run. Long-term farm financial viability requires sound investments in productive assets. When this involves external finance, i.e., loans, then financial risk is created by the volatility of interest rates, asset values, and cash flows; however, financial risk can be diminished by keeping financial reserves and savings and by the financial structure of the farm business. (Vavrek et al. 2021; Wolf and Karszes 2023). The ability to tolerate risks well is often referred to as resilience.
The concept of resilience was mentioned as early as 1973 in a paper by Holling, in the context of ecology (Holling 1973), as the capacity of ecosystems to respond to unexpected changes in the environment and return to their original condition quickly. Since then, the term has been widely used in various contexts, including business and financial situations. The concept of business resilience emerged around 2000, and the 2008–2009 financial crisis triggered increased interest in business resilience studies (Annarelli and Nonino 2016). There is no generally accepted precise definition of business resilience, but based on resilience studies in an economic context, it can be defined as the ability of business entities to adapt to shocks or disruptions (negative events), or to growth (positive events), and to seize the emerging opportunities in a challenging business environment (Fiksel 2006; Williams and Vorley 2014; Dahles and Susilowati 2015; Saad et al. 2021). Business resilience is usually measured by the firm’s economic and financial performance, assessing its financial indicators and their stability—or improvement—during changing conditions (Tognazzo et al. 2016; Saad et al. 2021; Wolf and Karszes 2023). The resilience of agricultural enterprises is considered as their ability to cope with the various challenges of economic, social, environmental, and institutional origin (Meuwissen et al. 2019). It is important to note that environment-related institutional obligations or requirements have been part of the Common Agricultural Policy (CAP) of the European Union since 1992, and their importance is steadily growing. It should be also noted that social or environmental challenges (that can be obligations) influence the financial component of economic resilience (Tallaksen 2021).
Therefore, in this context, it is safe to assume that a resilient farm can maintain the necessary revenue and workforce. Our study analyzes farm resilience with this approach. While various challenges such as price volatility, climate change, etc., are large-scale phenomena, actual resilience is influenced by the local, regional aptitudes.
As the Common Agricultural Policy still operates, as it has in the past, along objectives covering economic, ecological, and social aspects of the farming system, it is essential to pay attention to whether the agricultural support system contributes to “ensuring a fair income for farmers, increasing competitiveness, and improving the position of farmers in the food chain”, while producing safe and healthy food and protecting the environment (European Commission 2023). In this context, the objective of the present paper is to see whether Common Agricultural Policy subsidies can increase the financial stability of farms and increase their resilience in the face of risk and challenges. For this purpose, the financial indicators of subsidized farms are compared to those of non-subsidized farms, and their differences are statistically analyzed.
The agricultural subsidy policy of the European Union has been the target of several debates, and not only has its rationale, fairness and justification been questioned, but also its mechanism to allocate funding, as well as its efficiency. A core factor in justifying the need for subsidies is to demonstrate that these funds can really contribute to the welfare and prosperity of the targeted groups. Therefore, it is of crucial importance to measure the impacts of these subsidies, and an unbiased evaluation requires impact assessments not only on larger territorial levels using average improvement values, but also at the individual farm level. The research objectives outlined in the present study aim to carry out such analysis for a less-developed agricultural region in Hungary.
The area of the research (Figure 1) was the Southern Great Plain region of Hungary. The Southern Great Plain is a NUTS2 level statistical region of Hungary, which includes three counties, Bács-Kiskun, Békés and Csongrád-Csanád, with a total area of 18,339 km2 (19.7% of Hungary) and 1.3 million inhabitants (13.2% of Hungary). The area was chosen for our research for two reasons: It is one of the most important agricultural regions of Hungary and frequently experiences the risk posed by extreme weather conditions.
It is one of the major agricultural areas of the country, with 23% of the total arable land and 33% of the vineyard area of Hungary (as of 2020).
Agriculture is a major sector of the region; 72% of the enterprises are engaged in agricultural activities, and agriculture generates 10% of the regional gross value added (ITM 2020), while on the national level, that percentage is 4.1%, showing the relative importance of agriculture in the region. At the same time, the region’s ecological and climatic conditions are not the most favorable: The climate is continental, with the hottest summers in the country. In crop production, the weather during the growing season is characterized by various extremes, such as the risk of frost, drought (in 2022, the region suffered huge crop losses due to extreme heat and drought). Certainly, the most uncertain climatic factor is precipitation. Its annual volume is the lowest in the country (500–600 mm), and its temporal and territorial distribution is uneven, making farming risky. The alternation of dry and wet periods leads to the gradual depletion of water resources or their excessive accumulation, leading to extreme conditions. Drought and flood and inland water hazards can be expected in the same year. There are significant daily and yearly temperature fluctuations, few clouds and persistent solar radiation. The number of sunny hours in the Southern Great Plain reaches 2200 per year. Due to global climate change, the northward shift of Mediterranean influence is also felt more and more strongly in the Great Plain year by year (HCSO 2016).
The region represents 23.7% of the harvested area under cereals (553.5 thousand hectares) in 2020 and 22.4% of the total harvested amount of cereals (3503.6 thousand tons) in Hungary. The region is the most important producer of vegetables: more than 65% of Hungary’s total onion, 83% of carrot, 74% of tomato, and 73% of paprika production takes place in the region. As for the livestock sector, the region possesses 19% of the country’s cattle, 22% of the pigs, 26% of the sheep and 19% of the poultry. The total value of agricultural products (gross output) was HUF 660,862 million in the region, which represents 24.1% of total agricultural production in Hungary (HCSO 2021). The vast majority of this value (62%) is generated by crop production and horticulture, while livestock farming accounts for 31% of it.
The novelty of the present research is that it is a full-scale analysis of the impact of subsidies in a less-developed region of the EU, containing all farming companies, and all agricultural subsidies they received. This is a large set of 1378 farms, not a sample; the data are true values, not sample averages, allowing for the generalization of the results to national or even supranational levels in East-Central Europe. This type of a dataset is not readily available, as the farm accounts and the subsidy reports are usually not paired in databases. The analysis involves altogether 17 performance indicators derived from the balance sheets and profit-and-loss accounts of individual farms, and their temporal evolution is analyzed comparing farms having received subsidies to non-subsidized ones. In contrast to former, similar analyses that relied on only one or two aspects of farm performance, the present study uses several indicators of liquidity, profitability, solvency, economic efficiency, and labor productivity, together with employment impacts. The large number of farms in the analysis allows for a reliable comparison of subsidy impacts by size categories—not only by category averages, but by empirical data of individual farms. The 7-year-long period of 2014–2021 contains the newest data available, covering the years of the COVID pandemic, too.
The structure of the paper is as follows: Section 2 explores the main findings of the related literature concerning the background and goals of the Common Agricultural Policy’s (CAP) support system and the results of various undertakings in EU-support effectiveness research that serve as a point of reference for comparison. The Methodology section describes the analyzed enterprises (the agricultural companies of the Southern Great Plain Region) and the method of data collection and handling and introduces the chosen performance indicators and the compatible analysis tools to answer the research questions. In Results, we share the main findings concerning the differences in subsidy amounts by business size, the impacts of subsidies on employment, and the impact of subsidies on financial resilience and stability. The Discussion section answers the research questions and compares our results to the findings of the cited research. Finally, in the Conclusion section, the main results are summarized, the implications concerning the agricultural policy objectives and tools are highlighted, and possible future research activities are determined.
2. Literature Review
2.1. Short Historical Background and the Goals of the CAP Support System
The purpose of the EU farm subsidies is to help farmers increase profitability, and by this, increase job opportunities (to prevent the depopulation of rural areas) and improve income levels. At the beginning the objectives of the common agricultural policy (CAP) of the European Economic Community focused on fair income (fair standard of living) for farmers, the importance of productivity improvement of farms, the stabilization of the agricultural markets for the most significant commodities, and achieving self-sufficiency (food security) in those commodities, while securing reasonable food prices for consumers (International Monetary Fund 1988). The initial price support (market or indirect support) system, although it contributed to the growth of the agricultural sector and did increase productivity, also led to surpluses, huge budget pressure, environmental problems, and international trade disputes and proved to be far less favorable for small farms than for the larger or more efficient ones. Since 1992, as a fundamental reform of the Common Agricultural Policy (Cunha and Swinbank 2011), the CAP applies direct payments to farmers that were calculated at the time on the basis of the income loss suffered because of the reduction in institutional (target and intervention) prices, and through the time support policy evolved into producer payments not only to secure producer income, but also to provide for environmental, employment, animal welfare and food safety goals. Thus, agricultural policy goals and measures simultaneously target social, economic, and increasingly, environmental objectives (Ciliberti et al. 2023). The agricultural support system includes subsidies related to the continuous operation of the farms (operating subsidies, or annual or regular direct payments, such as area payments from the first pillar) and targeted development aids in various forms form the second pillar of the CAP.
The reform of the CAP after 2020 primarily aims to support sustainability and an agricultural sector capable of contributing to the mitigation of climate change, which, however, requires significant changes to the current support system. Since 2006, EUR 54 billion in public funding has been spent on the CAP every year in the EU. Of the direct payments in 2015, for example, more than EUR 24 billion was disbursed to support regions whose average agricultural enterprise income was above the EU median income level, and an additional EUR 2.5 billion of rural development support was given to primarily urban areas. The member states must apply more thorough monitoring than at present, which is essential for the evaluation of the expected results and the development of appropriate monitoring indicators (Scown et al. 2020).
The support of agricultural production from public funds is already the subject of frequent debates. Economic and social goals are both used to justify the support of the sector, which is particularly exposed to changes in the economic environment as well as changes in the natural environment. One of the main reasons for subsidies may be that they can contribute to increasing productivity, making production more profitable, enhancing technological developments, improving economies of scale, and initiating more efficient use of inputs. As a study by Kumbhakar et al. (2023) shows on a representative sample of Norwegian farms, in the period 2001–2018, an improvement in profitability of about 2.3% per year was experienced, in which agricultural subsidies also played a positive role—the principles of which in Norway are similar to the EU practice. While before 2008, subsidies primarily linked to the volume of production had a negative impact on output, after 2008, subsidies paid regardless of the volume of production (decoupling) already had a positive impact on productivity and profitability, not only in Norway, but also in the EU member states.
It is especially the smaller businesses that do not have their own investment resources for technological development, and their access to market-based credit is also often limited (Garrone et al. 2019; Dupraz and Latruffe 2015; Colombo et al. 2020; Baráth et al. 2020). The small and medium-sized business sector plays a key role in national economies. Economic growth is decisively influenced by the performance and opportunities of these businesses (Humphrey 2003; OECD 2016; WTO 2016; Khanna et al. 2021). The development policy of the EU also treats this sector as a priority, especially regarding the catching-up of businesses working in the less-developed member states (Dallago 2003; McIntyre and Dallago 2003; Dallago and Guglielmetti 2010; Potter et al. 2010).
Many empirical analyses deal with the outcome of the subsidies in general and by subsidy type, especially in the SME sector (Potori et al. 2013; Dániel 2016; Notte et al. 2015; Garrone et al. 2019; Dupraz and Latruffe 2015). The studies conducted on the sector pay great attention to the efficient use of EU funds, which is of crucial importance, both for the more-developed member states and for the less-developed ones (Oprescu et al. 2005; Lopriore 2009; Fröhlich and Dokic 2012; Szczepański 2017). A significant part of the empirical analyses focuses on the ability of individual regions to attract funds, examining the extent to which the application procedure makes it difficult to access and use funds effectively (Zaman and Cristea 2011). Others examine the direct effects of subsidies, but mostly on a macro level, while rather few results are known about the effects appearing at the level of farms and businesses. Regarding the use of subsidies in the 2014–2020 programming period, the member states often tried to increase the rate of utilization with administrative measures, but this approach did not really stimulate regional growth. This is why political transparency and the monitoring of the distribution of funds are of great importance. The use of resources in accordance with the original goals was made more difficult by the COVID pandemic that occurred in 2020–2022, preventing the implementation of previously planned developments in many countries (Aivazidou et al. 2020; Țigănașu et al. 2018; Lutringer 2022).
2.2. Measuring Support Effectiveness
To assess the contribution of EU subsidies to the development of the agricultural sector, the productivity of such businesses must be measured, and the comparison between pre- and post-subsidy situations should be evaluated, usually focusing on employment, profitability, and efficiency. The measurement and analysis of the profitability of farms and its methodology have abundant background literature (Coppola et al. 2013; Popa 2013; Potter et al. 2010).
According to an assumption of economic growth theory, productivity growth in the agricultural sector is significantly lower than in the manufacturing industry or in the service sector; Martin and Mitra (1999) cites several relevant sources from Adam Smith, David Ricardo, Karl Marx, William A. Lewis, Raul Prebisch.
Agricultural policy also relies on sectoral productivity growth and faster total factor productivity (TFP) growth in manufacturing when it discriminates against farms and agribusinesses (Krueger et al. 1991). This is also a reason why examining the productivity of agricultural enterprises is of utmost importance. Bacsi et al. (2022) found that agricultural enterprises in Hungary are ahead of tourism companies in terms of labor productivity, and they are not significantly behind in terms of TFP. Similar results are presented by Martin and Mitra (1999), OECD (1995) and Hollas et al. (2021). As Martin and Mitra (1999) and several other authors (Chenery et al. 1986; Jorgenson et al. 1987; OECD 1995; Bernard and Jones 1996) have found for the USA and many other countries, labor productivity and TFP in the 1970s, 1980s and at the beginning of the 1990s grew faster in the agricultural sector than in other economic sectors.
The profitability of farms is greatly influenced by the size of the enterprise and the specific activity (Bacsi and Szálteleki 2022a, 2022b). Schultz (1964) found that small farms, like small enterprises in other sectors, are generally very efficient in the utilization of the technology available to them.
Nguyen and Nguyen (2020), in their analysis of 1343 businesses and six sectors (retail and wholesale, services, agriculture, manufacturing, mining, transport) for the period 2014–2017, state that the profitability of businesses—measured by the return on assets (ROA) and return on sales (ROS) indicators—is influenced by many factors, including firm size and capital structure. Similar results are reported by Nanda and Panda (2018), Babaloa (2013), Dogan (2013), Blundell et al. (1999) and Baumol (1986) for many countries and periods, although most of the results refer to the USA, as firm-level data are often lacking for other countries (Bartelsman et al. 2003; Bartelsman et al. 2013). However, the profitability, productivity, and efficiency of small and medium-sized enterprises, which represent the highest proportion of all enterprises, generally lag behind those of larger enterprises (Leung et al. 2008; OECD 2013; Sheng and Chancellor 2019; Garicano et al. 2016)—although Berlingieri et al. (2018), covering the period 1994–2012 and 17 countries, declare that micro and small enterprises are generally more productive than medium-sized enterprises.
Financial analysis is usually based on the balance sheet and the profit-and-loss account (income statement) of the business. The financial health is evaluated according to financial indicators of liquidity, solvency, profitability, and efficiency, each of which has several widely used indicators, as listed below (Vavrek et al. 2021; Myšková and Hájek 2017; Jedik and Stalgienė 2018; Wolf and Karszes 2023; Boda and Úradníček 2019; Brand et al. 2022):
- Liquidity measures the ability of the business to meet financial obligations on time without disrupting the normal operations of the business, and the ability to generate cash needed at the time needed. Its typical indicators include working capital/total assets, current ratio=short-term assets/short-term liabilities.
- Profitability assesses the size of the profit relative to the size of the business, measured by the value of the resources used. Typical measures of profitability include net farm income/total assets, return on assets (ROA), and return on equity (ROE).
- Solvency measures the liabilities of the business relative to owner equity and provides an indication of the ability to pay off all financial obligations if all assets were sold. Typical measures include total equity/total liabilities, equity-to-assets ratio, debt-to-equity ratio, and debt-to assets ratio.
- Economic efficiency measures the value of output compared to the value of resources used. Typical measures are the net farm income ratio = net farm income/gross income, and asset turnover ratio = gross revenue/total assets.
Financial resilience is the ability of a business to avoid financial distress in case of revenue or cost volatility and/or its ability to recover from such a distress. The business is said to be resilient if this capacity is high, i.e., the business is capable of withstanding and recovering from adverse financial shocks (Fiksel 2006; Williams and Vorley 2014; Dahles and Susilowati 2015; Saad et al. 2021). Resilience can be assessed by examining the financial indicators year by year, identifying the periods of decline or recovery (Tognazzo et al. 2016; Saad et al. 2021; Wolf and Karszes 2023). According to Scott and Laws (2006), businesses can show resilience in three different ways: First, by survival, i.e., returning quickly to their previous normal state after a shock; second, by adaptation to the changed environment; and third, by innovation, seizing the opportunities that may emerge in the new business environment. Resilient businesses, therefore, will continue to perform well soon after a shock, which will be reflected in their performance indicators. In any case, resilience is considered as an outcome variable that can be described by the firm’s positive financial performance (Tognazzo et al. 2016; Pal et al. 2014), or as a capability that can lead to the firm’s positive financial performance (Akgün and Keskin 2014; Lengnick-Hall et al. 2011). Either way, analyzing the temporal evolution of financial performance indicators is a useful way of assessing resilience (Tognazzo et al. 2016; Saad et al. 2021; Wolf and Karszes 2023).
The financial health of businesses can be categorized according to the values of the financial indicators, as good, fair, vulnerable, or distressed, and these categories are defined by relying on benchmark values of the chosen indicators (Stulpinienė and Aleknevičienė 2012; Vavrek et al. 2021; Myšková and Hájek 2017; Wolf and Karszes 2023; Brand et al. 2022).
One key purpose of the EU subsidies is to prevent the depopulation of rural areas, for which it is necessary to provide decent income and sufficient jobs for the rural population, mainly in agriculture and related areas. Therefore, one focus area of the impact analysis of CAP subsidies is the job creation and farm employment situation and labor productivity in various EU member states, e.g., in Slovenia (Bojnec and Fertő 2022; Baráth et al. 2020), Sweden (Blomquist and Nordin 2017), Spain (Colombo et al. 2020), France (Dupraz and Latruffe 2015), or the EU as a whole (Dries et al. 2012; Garrone et al. 2019). As agricultural employment is a key factor in agricultural GDP growth (Abdelgawwad and Kamal 2023), subsidies promoting employment together with labor productivity may be crucial for enhancing the income-generating capacity of less-developed rural regions.
Recently, many empirical analyses have been carried out regarding the efficiency and profitability of farms in the EU. Some of them deal with one country at a time, while others compare several countries (Bašek and Kraus 2011; Novotná and Volek 2018; Augère-Granier and McEldowney 2021; Bacsi and Szálteleki 2022a, 2022b; Bacsi et al. 2022). Such empirical analyses are often based on the Farm Accountancy Data Network of the EU (FADN) (Keszthelyi and Pesti 2012; Potori et al. 2013; Bacsi and Szálteleki 2022a, 2022b). Examining the role of EU subsidies received by agricultural enterprises, Bacsi and Szálteleki (2022a) state that in the period 2004–2020, the magnitude both of all operating subsidies and subsidies specific for rural development differed significantly according to the size category of the enterprises. Enterprises in the highest SO category (annual standard output > EUR 500,000) received subsidies more than three times the average subsidy value, while subsidies to farms smaller than this remained below the average level.
Grzelak (2022)—analyzing FADN data for EU farms between 2004–2018—found that the assets of farms increased over time, but their sales revenue did not, because an increasing proportion of their income was made up of support for environmental protection and social support from the EU.
Ciliberti and Frascarelli (2019) examined the effects of the CAP on the profitability of farms in Italy between 2008–2014, relying also on FADN data. As their findings show, Italian economies generally experienced positive effects, but these largely depended on the types of subsidies (decoupled, coupled, direct payments).
Based on FADN data, Dabkienė (2021) analyzed the performance of Lithuanian farms between 2015 and 2018, in comparison with some Baltic and Central European countries, as well as with Germany and France, in terms of farm profitability, productivity, and level of subsidies, focusing primarily on grain-growing enterprises and dairy farms.
Kryszak et al. (2021) analyzed the profitability of agricultural enterprises in the EU between 2007 and 2018, relying on FADN data, and concluded that the increase in the ratio of production value to equity capital plays a decisive role in increasing profitability—especially in the case of smaller farms. The other fundamental factor is the debt-to-asset ratio, which has a significant negative influence on profitability, regardless of size. Increasing the level of subsidies usually leads to a higher ROA indicator for smaller farms, but for farms belonging to the largest size category, the effect is negative.
Alexandri et al. (2020) carried out a similar analysis for the Romanian farms in the FADN database, examining the years 2007, 2012 and 2017 for milk producers, arable crop growers, grazing livestock farmers, and mixed farms. According to their analysis, using the ratio of subsidies to output to measure the effect of subsidies on productivity and profitability, these effects were typically negative on both productivity and profitability.
Svobodová et al. (2022), relying on the FADN data of Czech agriculture, also examined arable, dairy, grazing livestock, and mixed farms in the period 2015–2020 in different size categories, analyzing differences in productivity and profitability according to size categories and activities, as well as according to the level of subsidies received. They found that TFP increases with the size of the farm, and farms in the largest size category are exceptionally productive, both in terms of TFP and labor productivity. The productivity of arable crop farms exceeds that of other activities, and this is also reflected in profitability. At the same time, small farms received, on average, about 2.3 times more support (in terms of the proportion of support compared to output) than farms in the largest size category.
According to Staniszewski and Borychowski (2020)—again using data on the EU member states from the FADN database—the effect of the subsidies largely depends on the size of the farms and leads to an increase in efficiency and productivity, especially in the case of the largest farms. As a result, CAP subsidies have a significant market-distorting effect and promote the survival of non-viable economies.
Biagini et al. (2022) examined the impact of CAP subsidies on the development of TFP based on FADN data for six European countries between 2008 and 2018. The authors found that the larger farm size was associated with higher TFP, primarily in the smaller size category farms, but not necessarily in the largest size categories, and compared the role of different support types. They found virtually no demonstrable effect of Pillar I subsidies, or, if so, a minimal one. Interestingly, the Pillar II subsidies have a rather negative effect on productivity, while Less Favored Area (LFA) subsidies, which go to farms with unfavorable environmental circumstances, also have a negative effect on the productivity of these farms, because the subsidies also enable the survival of otherwise economically unviable farms.
The main contribution of the present paper to the existing literature is that it analyzes all of the agricultural companies in a region, during an 8-year time period, pairing the farm accountancy data with the full record of CAP subsidies received by these farms. This involves a much larger number of farms (1378) and uses a larger set (17) of performance indicators than is usual in similar studies, thus facilitating a finer assessment of subsidy impacts, distinguishing these by farm size categories, too. This allows for generalizations outside the selected region and points to the need to contrast conclusions derived from different indicators of farm performance.
3. Methodology
3.1. Data
The analysis of the Southern Great Plain region was carried out relying on two databases. The first one was the database of the full business accounts of the agricultural companies (individual farms—sole traders, natural persons—were excluded from the analysis, as in their case, data availability was very limited) for the years 2014–2021, provided by OPTEN Informatikai Kft (Opten 2022). The second one was the database published by the Hungarian State Treasury (Magyar Államkincstár 2022), containing detailed data on subsidies granted by time and subsidy type. Relying on these databases, a single database was compiled for the purposes of our analysis, including business account data, computed indicators of liquidity, profitability, solvency, financial efficiency and labor productivity (see Table 1), and subsidies received, for each year and each farm. To make the database operational, some company-level data reduction was performed: Only the companies that operated and regularly provided data throughout 2014–2021 were included and used for the statistical analysis. The original data file of the OPTEN database contained a total of 27,176 rows (companies and years) and 161 columns (business account indicators), while the data file of the subsidies contained 5,441,882 rows (companies, years) and eight columns (subsidy categories). This data reduction procedure ended with altogether 1378 companies and 9 years of data per company.
The data cleaning and preparation process started with analyzing the OPTEN database. It contained the balance sheet and profit-and-loss account data for all of the agricultural companies operating in the South Great Plain region between 2014 and 2021. This meant altogether 2235 companies were included. However, 710 of them operated only in part of the 2014–2021 period; therefore, we omitted them from the further analysis, intending to analyze changes during the mentioned 8-year period. This left 1525 companies—i.e., the full population of agricultural companies that operated in every year in the region. Then, this population was checked for missing data, or outliers. Altogether, 97 companies applied a simplified profit-and-loss account, with less data content, and 53 companies had negative owner’s equity in one or several years. These companies (i.e., 150 firms) were omitted from the further analysis, leaving 1378 companies (90.3% of the full population of firms operating throughout the whole time period). The firms with negative owner’s equity were omitted, because these firms obviously had more liabilities than assets; therefore, they faced financial distress in some of their operations. As the data were taken from the OPTEN database, and this database derives its data from the former tax returns of companies approved by the taxation authorities, we used these data as facts without further data transformation, keeping in mind that when applying for subsidies or reporting how they used subsidies, the firms have to present these data to the authorities.
After creating the database of the 1378 companies with their employment, balance sheet and profit-and-loss data, the names and headquarters of these companies were used to look for matches in the subsidy database of the Hungarian State Treasury. This database was only accessible for the years 2014 to 2021, and that was the main reason for using this time period. The subsidy database contained the names, headquarters, subsidy types and subsidy amounts received by any subsidized unit per year. We looked up each of the 1378 agricultural companies by their names and headquarters and added their CAP subsidy amounts year by year to our database. The matching occasionally required minor corrections of the company names, but luckily no other discrepancies were encountered.
As the 1378 companies represented 90.3% of the agricultural firms operating throughout the 8-year period of analysis, this was a good representation of the agricultural sector of the region. In 2020, the share of the agricultural businesses in the South Great Plain region was 19.8% of the national value, the region’s share of national agricultural output was 24%, while its share of arable land was 23%; therefore, it is a significant agricultural region of the country, and its tendencies well reflect the national trends.
Size categories were formed following the legislative definition of Hungary (Act XXXIV of 2004 on Small and Medium-Sized Enterprises and the Support of Their Development):
Micro enterprises are those with less than 10 employees and annual turnover or an annual balance sheet not exceeding EUR 2 million. Small enterprises are bigger than the micro size category but have less than 50 employees and annual turnover or an annual balance sheet not exceeding EUR 10 million. Medium-sized enterprises are bigger than the small enterprise category but have less than 250 employees and annual turnover not exceeding EUR 50 million or an annual balance sheet total not exceeding EUR 43 million. Large enterprises have 250 or more employees or more than EUR 50 million in annual turnover (or a total asset value in the balance sheet of more than EUR 43 million).
The distribution of the 1378 agricultural companies in our analysis was as follows in the base year (2014):
- Micro enterprises: 1053 (76.4%)
- Small enterprises: 264 (19.1%)
- Medium-sized enterprises: 57 (4.1%)
- Large enterprises: 4 (0.4%)
Thus, the database constructed for the present analysis had 12,402 rows and 67 columns, i.e., 67 values per company, which were then supplemented with computed performance indicators (see Table 1). The financial data were used as real values adjusted with the Consumer Price Index to the 2014 price level. Although our focus was the financial resilience of farms, the stability of businesses could also be characterized by their capability to retain or increase their labor force, i.e., to expand the volume of their activities. Therefore, we examined the effect of subsidies on the number of employees, too.
3.2. Statistical Analysis
The variables were tested with Kolmogorov–Smirnov and Shapiro–Wilk normality tests and were found to be of non-normal distribution. Therefore, only non-parametric statistical tests were used throughout the analysis.
The data were analyzed by separating farms into two groups: those that received EU subsidies and those that did not. Subsidies were either current subsidies, given for financing the operational activities of the current year; or capital subsidies, given for financing long-term investments. The farms receiving either current subsidies or capital subsidies, or both, were called the subsidized group; those receiving none of these were called the non-subsidized group. The two groups were compared to see if they differed in the evolution of their financial indicators during the 2014–2021 period, to reflect the impacts of subsidies. The Kruskal–Wallis and Dunnett’s T3 tests were applied to determine the existence of significant differences between the two groups.
Analyses were performed using the SPSS 22.0 software, while MS-Excel was applied for visualizing the results.
3.3. Research Questions
Q1: Did the EU subsidies improve the financial situation of the subsidized farms, improving their liquidity, profitability, solvency, financial efficiency, and labor productivity, making them more resilient against risk?
Q2: Did the EU subsidies have a positive effect on the employment situation in the analyzed region, thus stabilizing the living conditions of the rural population in the Southern Great Plain region?
4. Results
To facilitate reasonable temporal comparisons, the annual financial values in the database were adjusted by the Consumer Price Index, so that each value represented real value measured at the 2014 price level, as mentioned in Section 3.1. Besides financial values, the employment figures were used in the study, and these were used as annual work units, aligning full-time and part-time labor to full-time equivalents. Luckily, both the accounting data and subsidy data refer to calendar years from 1 January to 31 December; therefore, we did not have problems arising from different reporting periods. The findings of the analysis, therefore, refer to real values in money terms and labor force as full-time equivalents.
4.1. Differences in Subsidy Amounts by Business Size
The proportion of subsidized farms differed by size category. According to the size categories in 2021, 690 (micro enterprises (65.5% of the 1053) received subsidies, and 246 small enterprises (93.2% of the 264) and 49 medium-sized ones (86.0% of the 57) were also subsidized. The number of large enterprises varied between four (in 2014) and two (in 2021) during the analyzed period, but they all received subsidies during the 2014–2021 period.
Focusing only on subsidized farms, the total subsidy received considerably differed by business size category (Figure 2). The average subsidy received by large businesses was 22 times the average received by micro enterprises, 5 times the average of the small enterprises and 1.7 times the average of the medium-sized enterprises. Comparing the average subsidy to the average employee number per farm, the picture is just the opposite: the largest subsidy per worker was granted to micro-enterprises, and this value was approximately 23 times that received by large enterprises, while small and medium-sized enterprises received about half of the subsidy per worker received by micro-enterprises.
The received subsidy levels significantly differed by enterprise size category, as the Kruskal–Wallis test showed (Table 2), and the Dunnett T3 test proved that each category significantly differed from all of the other ones, except the large businesses, whose results were not statistically significant due to their low number (only 2–4 large farms operated in the region during the given period, of which all received subsidies).
4.2. Impacts of Subsidies on Employment
Using employment data from 2014 to 2021, the evolution of the average number of employees is presented in Table 3.
Change in the number of employees (AWC) from 2014 to 2021 was computed, separately by business size, and for subsidized farms and non-subsidized ones.
As Table 3 shows, the number of employees decreased during the examined period, but the decrease was moderate, only 0.73 persons per farm, i.e., 6.5% of the initial 2014 value. However, the decrease affected primarily the medium-sized (−7.29%) and large (−46.41%) enterprises, while a very small (0.15%) increase could be observed in small enterprises, and a 7.1% increase in micro-enterprises. Surprisingly, the reduction in employees was greater in businesses that received support than in those that did not receive support. The Kruskal–Wallis test showed that the figures on change in employment significantly differed between subsidized and non-subsidized enterprises, and the values of the subsidized ones were significantly worse, i.e., subsidies worsened the employment situation in subsidized farms. The results might mean that subsidies were given to farms with worse employment figures for the purpose of improving their situation, but the results contradicted this, as the decrease in AW per farm in subsidized farms was 7.5% of the 2014 value, while the non-subsidized farms actually lost much less (4.7%) of their per farm labor force. Therefore, we can state that subsidies did have a negative impact on the employment situation in the region between 2014 and 2021.
4.3. The Impact of Subsidies on Financial Resilience and Stability
Table 4 presents the basic descriptive statistics of the analyzed companies, by size category, for 2014 and 2021. The total assets of the farms increased, varying according to farm size, by 30.6 to 174.3%, but the owner’s equity increased even more, by 40.8% to 279.1%. A similar increase was seen in profit after tax (16.3% to 150.7%). These indicators suggest a positive change in the positions of the companies. However, liabilities also increased considerably, suggesting the increasing need for external financial resources.
Table 4 shows the initial values for 2014, and the end values in 2021. The Kruskal–Wallis test was applied in both years to test the differences in means between subsidized and non-subsidized farms, by size category, except for large enterprises (as these were all subsidized). Total assets and owner’s equity were significantly lower in subsidized farms than in non-subsidized ones for micro and small enterprises, both in 2014 and in 2021, while the difference was not significant in medium-sized farms.
The same was true of micro enterprises for the other indicators, i.e., profit after tax and liabilities; the mean values for subsidized micro farms were significantly lower than those for the non-subsidized ones.
For small and medium enterprises, the profit after tax and the total liabilities did not differ between subsidized and non-subsidized farms significantly, either in 2014 or 2021.
Thus, although their asset and equity levels may have differed, these did not generate significant differences in their operational performance.
Figure 3 shows the change in these financial indicators, from 2014 to 2021, as a percentage of the 2014 value. Most of the changes were positive, except profit after tax in medium-sized enterprises.
As Figure 3 shows, non-subsidized micro farms could improve their already higher assets, equity, and profitability more than the subsidized ones, which suggests that the subsidies enhanced the difference between the two groups, actually making the subsidized farms less successful.
For small farms, total assets and owner’s equity showed faster growth in subsidized farms than in non-subsidized farms, indicating tendencies of catching up by subsidized enterprises, but profitability increased faster in non-subsidized farms, and the liability indicators showed faster indebtedness growth in subsidized farms, which indicates a negative tendency. In medium-sized enterprises, the non-subsidized farms grew faster regarding total assets and owner’s equity and showed growth in profits, while subsidized farms decreased their profits. This size category also showed a slower increase in total liabilities for non-subsidized farms.
It is also worth noting that the highest growth rates were produced by large farms (all subsidized) in total assets and owner’s equity, but the highest growth rate in profitability was in the non-subsidized micro category.
To obtain a clearer picture of the changes in financial resilience and stability caused by subsidies, the financial indicators of liquidity, profitability, solvency, and economic and production efficiency are analyzed in the following section, comparing the positions of farms during the 2014–2021 period. The following performance indicators were assessed:
- Liquidity measures
- ◦
- Net working capital ratio (WCA)
- ◦
- Liquidity ratio 1, Current ratio (LIR1)
- ◦
- Liquidity ratio 2, Quick ratio (LIR2)
- ◦
- Liquidity ratio 3, Cash ratio (LIR3)
- Profitability measures
- ◦
- Operating profit margin ratio (OPM)
- ◦
- Rate of return on assets (ROA)
- ◦
- Rate of return on equity (ROE)
- Solvency indicators
- ◦
- Equity to liabilities ratio (ETL)
- ◦
- Equity to assets ratio (ETA)
- ◦
- Debt to equity ratio (DTE)
- ◦
- Debt to assets ratio (DTA)
- Economic efficiency indicators
- ◦
- Efficiency of tangible assets ratio (EFTA)
- ◦
- Asset turnover ratio (ATR)
- Labor efficiency measures, HUF/person
- ◦
- Labor productivity 1 (HUF/person, LAP1r)
- ◦
- Labor productivity 2 (HUF/person, LAP2r)
Figure 4, Figure 5, Figure 6, Figure 7 and Figure 8 present the mean values of the above variables for the years 2014, 2019 and 2021 by size categories, separately for subsidized and non-subsidized farms. The year 2019 was included as the last pre-COVID year, to see if COVID-19 generated a break in the evolution of the indicator values, although without implying that any such break may have been the consequence of the pandemic only. In line with our research objectives, the improvement in indicators was evaluated, comparing the performance of subsidized and non-subsidized farms, to see if subsidies initiated a positive change in farm performance, or not. The actual indicator data are presented in Appendix A, Table A1 and Table A2 together with statistical test results.
Table 5 presents the changes in the indicator values from 2014 to 2021, and the significance of the difference between the subsidized and non-subsidized groups, which was tested by the Kruskal–Wallis test for all farm size categories.
As Table 5 shows, the improvement in the liquidity indicators did not significantly differ between the subsidized and non-subsidized groups, i.e., subsidies did not influence the liquidity position of farms. The profitability change significantly differed for micro farms, and subsidized farms improved more than non-subsidized ones; thus, subsidies improved profitability in this size category, but not for the other sizes. Regarding solvency, only the micro category showed a significant difference between the subsidized and non-subsidized farms, and only in the DTE indicator, with the value showing an increase in debt for the non-subsidized group and a decrease for the subsidized group, i.e., subsidies improved the solvency of micro farms. Regarding economic efficiency, only the ATR indicator differed significantly for micro and small farms; the change was negative for the micro enterprises, but smaller for the subsidized group, while in the small size category, the change was positive, but higher for the non-subsidized group. Therefore, the subsidies generated a positive impact for micro farms, but a negative one for small farms. Finally, labor productivity showed a negative change for non-subsidized farms, and a positive one for subsidized ones, and the difference was significant—the subsidies generated a positive impact. In other size categories, no significant differences were detected. From these results, it is obvious that the impact of subsidies was the strongest for the micro and small farm categories, and they had hardly any effect on medium-sized enterprises.
5. Discussion
Summing up briefly, our findings show that employment decreased from 2014 to 2021, but the subsidized farms decreased their employment level significantly more than non-subsidized farms, so subsidies could not contribute to job creation or retention. Subsidies did not have any significant impact on the liquidity position of the enterprises; the change from 2014 to 2021 was not significantly different between the two groups in any of the indicators (LIR1, LIR2, WCA) and any of the farm size categories. The same was true for the solvency position, with only the exception of micro enterprises and the DTE indicator. DTE increased in the non-subsidized micro enterprises, while it decreased in the subsidized group, which means that subsidized micro-enterprises could improve their indebtedness situation, while non-subsidized ones did the opposite. Labor productivity (LAP1 and LAP2) and profitability (OPM, ROA, ROE) also improved significantly in subsidized micro-enterprises, but deteriorated for non-subsidized ones, while subsidies did not have any impact on other size groups. Subsidies positively influenced the economic efficiency of micro and small enterprises when measured by ATR, leading to a smaller decrease in the indicator value in micro-enterprises and to a larger increase in small enterprises, while again, no impact was detected for medium-size enterprises. The EFTA indicator did not reveal any impact of the subsidies in any size category. We can state that the major influence was thus experienced by micro enterprises, and financial indicators were not uniformly capable of detecting these impacts regarding solvency and efficiency. The following paragraphs discuss these findings in more detail.
Our results show that the labor force decreased during the 2014–2021 period, and the decrease was considerably greater in subsidized farms than in non-subsidized ones. This suggests that subsidies could not stabilize the employment situation in the analyzed period and region, but were counter-productive, in all size categories.
The assessment of the overall financial position of the farms and their vulnerability to risk can be made by comparing the financial indicator values to the threshold values given by agricultural averages such as those published by Brand et al. (2022) or reported by Wolf and Karszes (2023). The comparison to these threshold values revealed that the most frequently used liquidity measure, the current ratio (LIR1), was very high for micro enterprises throughout the whole period, well before the value of 2.0 suggested as the lower threshold of strong position against risk by Brand et al. (2022), or the 2.5 threshold suggested by Wolf and Karszes (2023), and the same was true for small farms. This ratio was still above 1.3 (Brand et al. 2022), the upper threshold of vulnerability for medium-sized non-subsidized enterprises and for large farms in 2014, but in the weak range (1.0–1.5) defined by Wolf and Karszes (2023); however, by 2021, the values improved to the range of strong position even for these enterprises. This means that the liquidity position of analyzed farms was about the same as those found by Wolf et al. in the USA for 2010–2019, ranging from 2.05 to 3.26. The net working capital ratio (WCA) ranged from negative values (non-subsidized micro and medium-sized farms) to 0.26, which was similar to the findings of Jedik and Stalgienė (2018) for Lithuanian farms.
The solvency position of the analyzed farms is considered strong if the debt-to-asset ratio (DTA) is smaller than 0.3 (or 30%, Brand et al. 2022), but considered vulnerable if this ratio is above 0.6. In 2014, all of our farm groups had this value between 0.3 and 0.6, and by 2021, the positions generally improved to the range of strong solvency, except that for subsidized micro farms, which trended close to the vulnerability range. The equity-to-asset ratio should be above 0.4 (40%) according to Brand et al. (2022) and 0.5 according to Wolf and Karszes (2023) to be in the safe region, and except for non-subsidized micro farms, all of the farm groups fell within the safe range. By 2021, the small farms had achieved a value of 0.7 in this ratio, which was already at the lower threshold for a strong position according to Wolf and Karszes (2023), who found that US farms had values of this indicator between 0.6 and 0.72 between 2010 and 2014. However, Stulpinienė and Aleknevičienė (2012) suggest that a DTA value above 0.4, or even 0.1, can mean vulnerability if ROA and/or ROE values are low (below 0.05, or even negative). In their analysis, DTA increased with farm size, from 0.014 to 0.157 for Lithuanian farms in 2012. The debt-to-equity ratio in our analysis was always between 1.5 and 0.45, which was in a safe range according to Brand et al. (2022), though it did not reach a strong position.
Looking at the profitability position of the analyzed farms, the safe range for ROA should be between 0.04 and 0.08 (4% and 8%), with values higher than 0.8 indicating a strong position. Our results were mostly within this range in 2014, but by 2021, the medium-sized and large farms fell below the 0.04 limit into the vulnerable range, which was due to the impact of the COVID pandemic. In comparison, Wolf and Karszes (2023) reported values between 0.13 and 0.001 (13% and 0.1%) for US farms between 2010 and 2014. For ROE, the recommended safe range is between 0.03 and 0.1 (3% and 10%) according to Brand et al. (2022), and this indicator showed the same range as ROA in our case, with medium-sized and large farms falling into the vulnerability range by 2021. The asset-turnover ratio (ATR) is considered to be vulnerable below 0.3 (30%) and strong above 0.45 (45%), while the operating profit margin ratio (OPM) is vulnerable below 0.15 (15%) and strong above 0.25 (45%) according to Brand et al. (2022). Our results showed that all of our farms were vulnerable throughout the 2014–2021 period in terms of OPM (in the range of 0.01–0.11), but quite strong according to ATR (0.77–1.66). Wolf reported somewhat better performance of US dairy farms for OPM (0.03 to 0.20), but Jedik and Stalgienė (2018) reported weaker ATR values for Lithuanian farms (0.13–0.35 between 2014 and 2016). Stulpinienė and Aleknevičienė (2012) reported that for Lithuanian farms in 2010, ROA and ROE values were negative (−0.065 to −0.004), except that farm with more than 150 ha of land had 0.022 and 0.028 for ROA and ROE, respectively.
Comparing farms according to their subsidy status, for micro enterprises, the total assets, equity and profitability position were initially better in 2014 for non-subsidized farms than for subsidized ones, and the non-subsidized farms could increase their advantage over the subsidized ones by 2021. This suggests that subsidies did not improve the position of micro enterprises. On the other hand, in the small farm category, subsidies contributed to an improvement in total assets and equity, but regarding profitability and indebtedness, the non-subsidized farms performed better. In the medium-sized group, the non-subsidized companies started from a better position in 2014, and they could increase their advantage over the subsidized farms, showing a negative impact of subsidies.
The analysis of the financial ratios of liquidity, profitability, solvency, economic efficiency, and labor productivity measures also showed a contradictory picture. As the overall results show, the change in liquidity indicators did not significantly differ in any size category between subsidized and non-subsidized farms. The growth in profitability indicators significantly differed for the micro farms, with subsidized farms performing better. The change in solvency indicators did not significantly differ, except for DTE, where the micro size category showed a decrease for subsidized farms and an increase for non-subsidized ones, which represented an improvement for subsidized farms. The economic efficiency indicators were significantly better for the ATR ratio in the micro category, but significantly worse in the small category. Labor productivity was significantly better for the micro enterprises, but there was no significant difference in the other size categories.
In response to our first research question, there was no proof that subsidies could improve liquidity, and their impact on profitability was measurable only in micro enterprises. The same was true for solvency and economic efficiency, while economic efficiency actually deteriorated for small subsidized farms, and labor productivity was positively influenced by subsidies only in the micro farm category. Therefore, we can state that the EU subsidies could improve the resilience of micro farms, but no such positive impact could be detected in the other size categories.
Our second research question was answered in the negative. Instead of improving the employment situation and increasing, or at least maintaining, the jobs in the region, subsidized farms dismissed more workers than non-subsidized ones. This could be explained by a tendency to invest in technology improvement, but then, this should be detectable in improved labor productivity, which was measurable only in micro farms, and in a change in total assets, but only the small size category showed higher increase in subsidized farms than in non-subsidized ones. Therefore, the job loss in subsidized farms was not generally compensated by better technology and higher labor productivity, nor by increased profitability, except for the micro enterprises, which are not large employers in any sense. Another explanation could be that the fall in employment was not deliberate, and companies losing work force (either through retirement or in other ways) could not recruit new employees and thus operated with a relative labor shortage. The latter explanation, on the other hand, would mean that these agricultural companies not only lacked the necessary labor, but were often unable to compensate through technology development and innovation, which could raise serious concerns about their resilience.
Comparing our results for employment, the former empirical results were also contradictory. As Dries et al. (2012) established, employment patterns widely differ by country due to structural differences. Therefore, subsidies affect them in different ways. Bojnec and Fertő (2022) established that subsidies have positive impacts on Hungarian paid jobs and Slovenian family labor in agriculture. Similarly positive impacts were found on French farms between 1990 and 2007, arising from agri-environmental subsidies, least favored area payments, and investment subsidies, while area payments resulted in less jobs than before (Dupraz and Latruffe 2015). As Garrone et al. (2019) state, between 2004 and 2014, subsidies contributed to reducing job losses in agriculture. Colombo et al. (2020) state that due to subsidies to agriculture, agricultural efficiency increased, which led to a loss of jobs, although Baráth et al. (2020) established, for the period 2006 to 2013 in Slovenia, that investment-related subsidies had no impact on total factor productivity or on its components. Durham and Mizik (2021) state that subsidies paid to support organic farming may lead to more employment because organic farming is labor-intensive, although lower yields and less profit are also typical. Blomquist and Nordin (2017), on the other hand, found that CAP subsidies also increased employment in non-agricultural sectors in rural Sweden. Our results add further details to this diversity of examples. As empirical studies show, subsidy effects on employment largely vary between countries, and by sectors and subsidy types, but generally, subsidized agricultural investments lead to increasing agricultural GDP, which improves rural incomes, and this can contribute to better jobs, thus retaining rural population (Abdelgawwad and Kamal 2023).
Regarding the impact of subsidies on the financial efficiency and resilience of farms, former empirical studies show varied results. Grzelak (2022) found that subsidies contribute to increases in farm assets but have no impact on sales revenues. Ciliberti and Frascarelli (2019) found positive effects of agricultural subsidies on the net farm income of Italian farms between 2008 and 2014. Kryszak et al. (2021) found for 2007–2018 that the EU subsidies had a positive impact on the ROA indicator for small farms but negative for large ones. Alexandri et al. (2020) found the opposite for Romania, i.e., that subsidies negatively influenced productivity measured by the value either of output or input.
Kumbhakar et al. (2023) also found positive impacts of agricultural support on productivity and profitability in the EU and in Norway between 2001 and 2018. However, Svobodová et al. (2022) established, for Czech farms between 2015 and 2020, that higher subsidies for small farms resulted in smaller total factor productivity for them. On the contrary, Staniszewski and Borychowski (2020) found that CAP subsidies resulted in higher productivity but lower efficiency, which contributed to the survival of non-viable farms. The same was established by Biagini et al. (2022) for Pillar II and LFA payments. Dabkienė (2021) showed that for the Baltic states, Poland, Hungary, and Slovakia between 2015 and 2018, small farms represented more than two-thirds of all farms. Although these countries received more subsidies than the EU average, their productivity and profitability measures were generally below the EU average. The impacts of grants and subsidies were found to be neutral by Kelle (2007) for farms in a county of Hungary, which was the same as our results but based on data 10 years prior to our analysis. Other analyses in China and the USA, however, found that agricultural subsidies can improve farmers’ liquidity situation (Li et al. 2022; Goodwin and Mishra 2006).
In summary, the EU subsidies seem to have a somewhat contradictory impact on company performance. The companies receiving support seem to be less alert to achieving and improving their market presence and market performance, relying to a considerable extent on the subsidies instead of struggling to raise their sales revenues. As Figure 3 previously demonstrated, the growth in profit after tax from 2014 to 2021, expressed as a % of the 2014 value, was more than twice as high for non-subsidized than for subsidized companies.
The most striking finding of the present research is that the positive impacts of subsidies could be seen only in the micro-enterprise category. Micro farms represented 70% of all subsidized farms, and the subsidy amount they received relative to their labor force (AW) was almost twice as high as that of small and medium-sized enterprises, and 23 times the value received by large enterprises. This may be one of the reasons why micro farms can benefit more than other size categories. Micro enterprises are the only size category that increased its employment level. The profitability of subsidized micro farms improved, while that of non-subsidized ones decreased. Their debt-to-equity ratio decreased, while non-subsidized micro farms faced an increase in their level of indebtedness. The labor productivity of subsidized micro farms increased more than that of non-subsidized ones, while the asset-to-turnover ratio decreased less in the subsidized farms than in non-subsidized ones The only area where subsidies were ineffectual was the liquidity situation. Regarding small and medium enterprises, subsidies did not lead to any significant differences in performance between the subsidized and non-subsidized farms.
6. Conclusions
The focus of this article was to assess whether the European Union subsidies can contribute to the financial resiliency and stability of farms. In this context, we investigated the role of these transfers in the financial situation and production performance of corporate farms operating in agriculture in a less-developed region (Southern Great Plain) of Hungary.
The strategic role of the agricultural sector within the national economy is indisputable. It would be a mistake to judge its importance solely based on statistical data, since one of its main goals is to supply the given country with food. In addition, we must not forget the specific relationship of agriculture to natural resources, its importance in rural environments to maintain the population, its role in preserving biodiversity, etc. Hungary’s accession to the European Union created the opportunity for its less-developed, mainly agricultural, regions to catch up with more developed regions in the EU, relying on the financial transfers made available from the EU CAP budget.
This paper examined the financial resilience of the actors in the agricultural sector by applying indicators that well characterize their liquidity, profitability, solvency, efficiency, and productivity. Theoretically, subsidies should contribute towards improving farm resilience and stability in the face of emerging risks. As the results show, the intended purpose of the subsidies was not entirely realized, and their positive impacts could be felt only in the micro enterprise group in the analyzed region. Instead of the expected increase in employment, some job losses were experienced, and subsidized farms dismissed more of their labor force than non-subsidized ones. Another disturbing feature is that only a few financial indicators improved more in subsidized than in non-subsidized farms, and only for the micro farm category. The total assets and owner’s equity improved more in non-subsidized farms than in subsidized ones, except for small farms where the opposite happened. The profit after tax increased more in non-subsidized farms than in subsidized ones in all farm size categories. Total liabilities, on the other hand, increased more in subsidized farms, except among micro enterprises, so once again, non-subsidized farms ended up in a better position. The liquidity position showed the same changes in subsidized and non-subsidized farms alike, while the trends in solvency, economic efficiency, profitability and labor productivity differed to the benefit of subsidized farms only in the micro farm category. The other farm size categories did not show any difference between subsidized and non-subsidized farms. This raises the suspicion that subsidies contributed to the survival of non-viable enterprises instead of enhancing their competitiveness. However, this latter statement cannot be interpreted only as a negative feature: in rural regions, where no other income-generating employment is possible, it may still be better to support non-viable businesses offering the rural population some opportunity to earn a living rather than letting these farms go bankrupt, leading to rising unemployment levels without any alternative opportunities. It is also worth keeping in mind that the analyzed period included the years of the COVID pandemic, which generally created an extremely hard and risky situation in every economic sector, including agriculture. The results indicate that subsidies were unable to contribute considerably to the resilience and stability of farms in such circumstances, as business-as-usual was disrupted, leading to unusual decisions for the sake of survival, and subsidies might have been used as emergency resources instead of development tools as originally intended.
In the Introduction and Literature section, the goals and support tools of the CAP were briefly introduced. The long-running debates about the necessity and allocation of agricultural subsidies probably will not be settled by purely scientific results, as the support system is so deeply embedded in the agricultural policy that any fundamental transformation in the near future is most unlikely. The CAP aims to foster advances in all segments of sustainability, but the responsibility of meeting ecological, food safety, employment, and competition goals—just to name a few—burdens the farmers. Although they can receive financial support, in our research, this support, with the few above-mentioned exceptions, did not translate into enhanced resilience. This suggests that the support and regulatory system did not really contribute to the financial resilience or employment status of farms. Member states do have a significant role in determining their CAP budget utilization, but their commitment to turn it into a sustainable farming system is not evident. Sustainability goals (whether included in the previous cross-compliance or new conditionality rules, eco-schemes, or related to climate and biodiversity commitments, etc.) raise the question of how the expected achievements can be sufficiently measured. Area payments do not seem to have a positive impact, though farms can greatly depend on receiving them. If anything, the introduction of the new, complementary redistributive income support for sustainability (CRISS) can be justified by the results of this research, to help the smallest farms in their development, though in Hungary, all farms not possessing more than 1200 hectares of eligible area can apply for this subsidy (for the first 150 hectares), which suggests that favoring small farms is not exactly a priority. Based on our findings, the support policy’s efficiency and sustainability are questionable.
The limitations of the present study are the area of the study—one NUTS2 region of Hungary—and the time scale of 2014–2021, which was related to the availability of farm-level subsidy information. This could be extended if subsidy data from earlier time periods become accessible at the company level.
Another limitation is that the research dealt only with agricultural companies and did not include sole traders, but considering the value added in agriculture, this limitation does not make the validity of our results less reliable. A methodological limitation is that the influence of subsidies was measured by a comparison of the first and last years of the analysis. A finer evaluation can be achieved comparing year-by-year changes, which could reveal the dynamics of the subsidy effects, possibly adding other influencing factors, e.g., characteristics of the general economic environment, as control variables to the impact analysis.
The future continuation of the research may be directed to firms that operated for shorter periods, or those with negative owner’s equity in some years, to see how subsidies (if any) influenced their operation. A similar analysis for sole traders is another prospective research direction, as these entities, despite their smaller contribution to total agricultural output, provide an important segment of the job market, in the form of self-employment. Another possible research direction is to extend the analysis to other regions and to longer time periods, to assess the long-term effects of subsidies and determine if subsidies received in an earlier time could have positive effects in later years of firm operation. Another research direction is to distinguish between different types of subsidies—e.g., investment-oriented grants, or subsidies provided for current operations. Eventually, such long-run, multi-region analyses could reveal the true benefits of subsidies and help identify which subsidy types are most useful or contribute to survival and improved competitiveness.
Author Contributions
Conceptualization, P.S., G.B. and Z.B.; methodology, Z.B., P.S. and G.B.; software, Z.B.; validation, P.S. and Z.B.; formal analysis, Z.B.; investigation, P.S., G.B. and Z.B.; resources Z.B., P.S. and G.B.; data curation, P.S. and Z.B.; writing—original draft preparation, P.S., G.B. and Z.B.; writing—review and editing, P.S. and G.B.; visualization, Z.B.; supervision, P.S. and G.B.; project administration, Z.B. and G.B. All authors have read and agreed to the published version of the manuscript.
Funding
This research received no external funding.
Data Availability Statement
Data were taken from publicly accessible secondary databases, as referred to in the text.
Acknowledgments
The authors thank the Hungarian University of Agriculture and Life Sciences, Gödöllő, Hungary for providing the scientific environment to carry out the present research.
Conflicts of Interest
The authors declare no conflicts of interest.
Appendix A

Table A1.
Mean values of liquidity, solvency, profitability, economic efficiency and labor productivity for the years 2014, 2019 and 2021 (Source: Authors’ own computation).
Table A1.
Mean values of liquidity, solvency, profitability, economic efficiency and labor productivity for the years 2014, 2019 and 2021 (Source: Authors’ own computation).
| Liquidity | LIR1_14 | LIR1_19 | LIR1_21 | LIR2_14 | LIR2_19 | LIR2_21 | LIR3_14 | LIR3_19 | LIR3_21 | WCA_14 | WCA_19 | WCA_21 |
| Micro-NS | 70.36 | 99.69 | 172.41 | 51.1 | 90.29 | 167.7 | 18.1 | 50.36 | 49.05 | −1.02 | −0.2 | −0.19 |
| Micro-S | 19.09 | 57.07 | 49.76 | 16.21 | 46.13 | 44.11 | 8.25 | 35.29 | 28.93 | 0.23 | 0.2 | 0.12 |
| Small-NS | 7.32 | 5.25 | 6.18 | 6.55 | 3.56 | 4.16 | 1.79 | 2.13 | 2.40 | 0.3 | 0.25 | 0.3 |
| Small-S | 7.85 | 7.52 | 9.56 | 5.83 | 4.96 | 6.75 | 3.44 | 3.01 | 4.41 | 0.23 | 0.24 | 0.28 |
| Medium-NS | 1.35 | 5.88 | 6.15 | 0.94 | 4.66 | 4.55 | 0.38 | 3.24 | 3.44 | −0.02 | 0.35 | 0.2 |
| Medium-S | 3.36 | 3.83 | 3.74 | 1.63 | 1.98 | 2.02 | 0.69 | 0.97 | 1.13 | 0.26 | 0.21 | 0.22 |
| Large-S | 1.38 | 1.9 | 3.99 | 0.55 | 1.37 | 3.17 | 0.08 | 0.96 | 2.52 | 0.1 | 0.1 | 0.14 |
| Total-NS | 65.55 | 91.89 | 157.38 | 47.69 | 83.13 | 152.92 | 16.86 | 46.38 | 44.84 | −0.93 | −0.17 | −0.15 |
| Total-S | 15.38 | 41.19 | 37.25 | 12.78 | 32.95 | 32.52 | 6.61 | 24.97 | 21.31 | 0.23 | 0.21 | 0.16 |
| Solvency | ETL_14 | ETL_19 | ETL_21 | ETA_14 | ETA_19 | ETA_21 | DTA_14 | DTA_19 | DTA_21 | DTE_14 | DTE_19 | DTE_21 |
| Micro-NS | −1.56 | −0.64 | −0.64 | −1.56 | −0.63 | −0.64 | 2.55 | 1.63 | 1.64 | 5.61 | 1.37 | 2.4 |
| Micro-S | 0.53 | 0.53 | 0.42 | 0.54 | 0.53 | 0.42 | 0.44 | 0.45 | 0.56 | 1.27 | −1.11 | 0.39 |
| Small-NS | 0.68 | 0.66 | 0.7 | 0.68 | 0.66 | 0.7 | 0.3 | 0.33 | 0.29 | 0.65 | 2.2 | 0.68 |
| Small-S | 0.62 | 0.67 | 0.69 | 0.64 | 0.68 | 0.7 | 0.35 | 0.30 | 0.28 | 1.13 | 0.95 | 2.2 |
| Medium-NS | 0.53 | 0.8 | 0.6 | 0.61 | 0.8 | 0.68 | 0.37 | 0.18 | 0.31 | 0.68 | 0.25 | 0.69 |
| Medium-S | 0.67 | 0.69 | 0.67 | 0.68 | 0.7 | 0.68 | 0.3 | 0.28 | 0.30 | 1.32 | 0.64 | 0.78 |
| Large-S | 0.59 | 0.72 | 0.78 | 0.64 | 0.72 | 0.78 | 0.34 | 0.21 | 0.14 | 0.59 | 0.31 | 0.21 |
| Total-NS | −1.41 | −0.54 | −0.53 | −1.41 | −0.54 | −0.53 | 2.4 | 1.53 | 1.53 | 5.27 | 1.42 | 2.26 |
| Total-S | 0.56 | 0.57 | 0.5 | 0.57 | 0.58 | 0.5 | 0.41 | 0.41 | 0.48 | 1.24 | −0.48 | 0.86 |
| Profitability | OPM_14 | OPM_19 | OPM_21 | ROA_14 | ROA_19 | ROA_21 | ROE_14 | ROE_19 | ROE_21 | |||
| Micro-NS | 125.82 | −14.29 | −45.76 | −2.13 | −0.16 | −0.14 | 0.18 | 0.09 | −0.13 | |||
| Micro-S | −0.37 | −0.33 | −1.01 | 0.09 | 0.04 | −0.01 | 0.19 | 0.13 | 0.05 | |||
| Small-NS | 0.06 | 0.08 | 0.09 | 0.08 | 0.09 | 0.11 | 0.14 | 0.08 | 0.16 | |||
| Small-S | 0.05 | 0.04 | 0.08 | 0.07 | 0.03 | 0.08 | 0.17 | 0.06 | −0.32 | |||
| Medium-NS | −0.06 | 0.11 | 0.07 | −0.03 | 0.12 | 0.02 | −0.32 | 0.13 | −0.14 | |||
| Medium-S | 0.06 | 0.05 | 0.02 | 0.05 | 0.04 | 0.03 | 0.08 | 0.07 | 0.03 | |||
| Large-S | 0.04 | 0.01 | 0.05 | 0.08 | 0 | 0.02 | 0.17 | 0.01 | 0.02 | |||
| Total-NS | 115.68 | −12.97 | −41.13 | −1.98 | −0.14 | −0.12 | 0.18 | 0.09 | −0.10 | |||
| Total-S | −0.24 | −0.21 | −0.68 | 0.08 | 0.04 | 0.01 | 0.18 | 0.11 | −0.04 | |||
| Economic Efficiency | EFTA_14 | EFTA_19 | EFTA_21 | ATR_14 | ATR_19 | ATR_21 | ||||||
| Micro-NS | 16.91 | 12.13 | 24.46 | 1.66 | 1 | 0.91 | ||||||
| Micro-S | 36.05 | 7.19 | 5.83 | 1.16 | 0.91 | 0.91 | ||||||
| Small-NS | 4.04 | 2.62 | 47.61 | 1.13 | 1.14 | 1.1 | ||||||
| Small-S | 6.28 | 2.66 | 2.61 | 0.95 | 0.94 | 0.97 | ||||||
| Medium-NS | 1.52 | 1.94 | 4.53 | 0.85 | 0.81 | 1.78 | ||||||
| Medium-S | 1.99 | 1.8 | 1.76 | 0.85 | 0.83 | 0.75 | ||||||
| Large-S | 1.32 | 1.27 | 1.21 | 0.84 | 0.82 | 0.77 | ||||||
| Total-NS | 15.75 | 11.22 | 26.64 | 1.62 | 1.01 | 0.93 | ||||||
| Total-S | 26.15 | 5.65 | 4.76 | 1.09 | 0.91 | 0.92 | ||||||
| Labor Productivity | LAP1r_14 | LAP1r_19 | LAP1r_21 | LAP2r_14 | LAP2r_19 | LAP2r_21 | ||||||
| Micro-NS | 20,442.7 | 21,504.9 | 22,175.9 | 6791.0 | 7418.1 | 8150.1 | ||||||
| Micro-S | 36,263.5 | 41,997.6 | 47,880.0 | 14,798.4 | 17,318.9 | 19,616.2 | ||||||
| Small-NS | 32,651.6 | 31,919.0 | 73,312.3 | 11,977.9 | 11,230.7 | 24,626.0 | ||||||
| Small-S | 32,403.3 | 39,322.3 | 46,082.4 | 14,210.5 | 16,071.1 | 20,879.2 | ||||||
| Medium-NS | 22,469.0 | 20,866.3 | 72,035.7 | 10,636.1 | 13,938.9 | 19,761.5 | ||||||
| Medium-S | 24,969.7 | 32,690.5 | 36,798.0 | 14,742.1 | 19,129.5 | 22,332.2 | ||||||
| Large-S | 19,555.2 | 16,293.6 | 20,897.9 | 12,740.8 | 6930.6 | 13,471.9 | ||||||
| Total-NS | 21,554.6 | 22,557.2 | 28,364.6 | 7296.6 | 7854.2 | 10,110.3 | ||||||
| Total-S | 34,476.0 | 40,606.0 | 46,707.17 | 14,623.4 | 17,043.9 | 20,103.2 |
Note: NS refers to non-subsidized farms, S refers to subsidized farms.
Table A2.
Change from 2014 to 2019 and to 2021, and from 2019 to 2021, by farm size and subsidy status (Source: Authors’ own computation).
Table A2.
Change from 2014 to 2019 and to 2021, and from 2019 to 2021, by farm size and subsidy status (Source: Authors’ own computation).
| Diff 2021–2014 | Diff 2019–2014 | Diff 2021–2019 | ||||||||||
|---|---|---|---|---|---|---|---|---|---|---|---|---|
| Liquidity | LIR1 | LIR2 | LIR3 | WCA | LIR1 | LIR2 | LIR3 | WCA | LIR1 | LIR2 | LIR3 | WCA |
| Micro-NS | 102.05 | −4.71 | 30.95 | 0.83 | 29.33 | 39.19 | 32.26 | 0.82 | 72.72 | 77.41 | −1.31 | 0.01 |
| Micro-S | 30.67 | −5.65 | 20.68 | −0.11 | 37.98 | 29.92 | 27.04 | −0.03 | −7.31 | −2.02 | −6.36 | −0.08 |
| Small-NS | −1.14 | −2.02 | 0.61 | 0 | −2.07 | −2.99 | 0.34 | −0.05 | 0.93 | 0.6 | 0.27 | 0.05 |
| Small-S | 1.71 | −2.81 | 0.97 | 0.05 | −0.33 | −0.87 | −0.43 | 0.01 | 2.04 | 1.79 | 1.4 | 0.04 |
| Med-NS | 4.8 | −1.6 | 3.06 | 0.22 | 4.53 | 3.72 | 2.86 | 0.37 | 0.27 | −0.11 | 0.2 | −0.15 |
| Medium-S | 0.38 | −1.72 | 0.44 | −0.04 | 0.47 | 0.35 | 0.28 | −0.05 | −0.09 | 0.04 | 0.16 | 0.01 |
| Large-S | 2.61 | −0.82 | 2.44 | 0.04 | 0.52 | 0.82 | 0.88 | 0 | 2.09 | 1.8 | 1.56 | 0.04 |
| Total-NS | 91.83 | −4.46 | 27.98 | 0.78 | 26.34 | 35.44 | 29.52 | 0.76 | 65.49 | 69.79 | −1.54 | 0.02 |
| Total-S | 21.87 | −4.73 | 14.7 | −0.07 | 25.81 | 20.17 | 18.36 | −0.02 | −3.94 | −0.43 | −3.66 | −0.05 |
| Solvency | ETL | ETA | DTA | DTE | ETL | ETA | DTA | DTE | ETL | ETA | DTA | DTE |
| Micro-NS | 0.92 | 0 | −0.91 | −3.21 | 0.92 | 0.93 | −0.92 | −4.24 | 0 | −0.01 | 0.01 | 1.03 |
| Micro-S | −0.11 | 0 | 0.12 | −0.88 | 0 | −0.01 | 0.01 | −2.38 | −0.11 | −0.11 | 0.11 | 1.5 |
| Small-NS | 0.02 | 0 | −0.01 | 0.03 | −0.02 | −0.02 | 0.03 | 1.55 | 0.04 | 0.04 | −0.04 | −1.52 |
| Small-S | 0.07 | 0.01 | −0.07 | 1.07 | 0.05 | 0.04 | −0.05 | −0.18 | 0.02 | 0.02 | −0.02 | 1.25 |
| Med-NS | 0.07 | 0.08 | −0.06 | 0.01 | 0.27 | 0.19 | −0.19 | −0.43 | −0.2 | −0.12 | 0.13 | 0.44 |
| Medium-S | 0 | 0.01 | 0 | −0.54 | 0.02 | 0.02 | −0.02 | −0.68 | −0.02 | −0.02 | 0.02 | 0.14 |
| Large-S | 0.19 | 0 | −0.2 | −0.38 | 0.13 | 0.08 | −0.13 | −0.28 | 0.06 | 0.06 | −0.07 | −0.1 |
| Total-NS | 0.88 | 0 | −0.87 | −3.01 | 0.87 | 0.87 | −0.87 | −3.85 | 0.01 | 0.01 | 0 | 0.84 |
| Total-S | −0.06 | 0 | 0.07 | −0.38 | 0.01 | 0.01 | 0 | −1.72 | −0.07 | −0.08 | 0.07 | 1.34 |
| Profitability | OPM | ROA | ROE | OPM | ROA | ROE | OPM | ROA | ROE | |||
| Micro-NS | −171.58 | 45.62 | −0.31 | −140.11 | 1.97 | −0.09 | −31.47 | 0.02 | −0.22 | |||
| Micro-S | −0.64 | 1 | −0.14 | 0.04 | −0.05 | −0.06 | −0.68 | −0.05 | −0.08 | |||
| Small-NS | 0.03 | 0.02 | 0.02 | 0.02 | 0.01 | −0.06 | 0.01 | 0.02 | 0.08 | |||
| Small-S | 0.03 | 0 | −0.49 | −0.01 | −0.04 | −0.11 | 0.04 | 0.05 | −0.38 | |||
| Med-NS | 0.13 | −0.05 | 0.18 | 0.17 | 0.15 | 0.45 | −0.04 | −0.1 | −0.27 | |||
| Medium-S | −0.04 | 0.01 | −0.05 | −0.01 | −0.01 | −0.01 | −0.03 | −0.01 | −0.04 | |||
| Large-S | 0.01 | −0.03 | −0.15 | −0.03 | −0.08 | −0.16 | 0.04 | 0.02 | 0.01 | |||
| Total-NS | −156.81 | 41.01 | −0.28 | −128.65 | 1.84 | −0.09 | −28.16 | 0.02 | −0.19 | |||
| Total-S | −0.44 | 0.69 | −0.22 | 0.03 | −0.04 | −0.07 | −0.47 | −0.03 | −0.15 | |||
| Economic Efficiency | EFTA | ATR | EFTA | ATR | EFTA | ATR | ||||||
| Micro-NS | 7.55 | −23.55 | −4.78 | −0.66 | 12.33 | −0.09 | ||||||
| Micro-S | −30.22 | −4.92 | −28.86 | −0.25 | −1.36 | 0 | ||||||
| Small-NS | 43.57 | −46.51 | −1.42 | 0.01 | 44.99 | −0.04 | ||||||
| Small-S | −3.67 | −1.64 | −3.62 | −0.01 | −0.05 | 0.03 | ||||||
| Med--NS | 3.01 | −2.75 | 0.42 | −0.04 | 2.59 | 0.97 | ||||||
| Medium-S | −0.23 | −1.01 | −0.19 | −0.02 | −0.04 | −0.08 | ||||||
| Large-S | −0.11 | −0.44 | −0.05 | −0.02 | −0.06 | −0.05 | ||||||
| Total-NS | 10.89 | −25.71 | −4.53 | −0.61 | 15.42 | −0.08 | ||||||
| Total-S | −21.39 | −3.84 | −20.5 | −0.18 | −0.89 | 0.01 | ||||||
| Labor Productivity | LAP1r | LAP2r | LAP1r | LAP2r | LAP1r | LAP2r | ||||||
| Micro-NS | 1733.2 | −14,025.8 | 1062.2 | 627.2 | 671.1 | 731.9 | ||||||
| Micro-S | 11,616.4 | −28,263.8 | 5734.1 | 2520.5 | 5882.4 | 2297.3 | ||||||
| Small-NS | 40,660.7 | −48,686.3 | −732.6 | −747.3 | 41,393.3 | 13,395.3 | ||||||
| Small-S | 13,679.1 | −25,203.1 | 69,190.0 | 1860.7 | 6760.1 | 4808.1 | ||||||
| Med-NS | 49,566.8 | −52,274.3 | −1602.7 | 3302.8 | 51,169.5 | 5822.6 | ||||||
| Medium-S | 11,828.3 | −14,465.7 | 7720.8 | 4387.5 | 4107.5 | 3202.7 | ||||||
| Large-S | 1342.7 | −7425.93 | −3261.6 | −5810.2 | 4604.3 | 6541.3 | ||||||
| Total-NS | 6810.0 | −18,254.3 | 1002.6 | 557.5 | 5807.4 | 2256.1 | ||||||
| Total-S | 12,290.1 | −26,603.8 | 6189.0 | 2420.5 | 6101.1 | 3059.4 | ||||||
References
- Abdelgawwad, Nouran Abdelhamid, and Abdelmonem Lotfy Mohamed Kamal. 2023. Contributions of Investment and Employment to the Agricultural GDP Growth in Egypt: An ARDL Approach. Economies 11: 215. Available online: https://www.mdpi.com/2227-7099/11/8/215 (accessed on 11 November 2023). [CrossRef]
- Aivazidou, Eirini, Giovanni Cunico, and Edoardo Mollona. 2020. Beyond the EU Structural Funds’ Absorption Rate: How Do Regions Really Perform? Economies 8: 55. Available online: https://www.mdpi.com/2227-7099/8/3/55 (accessed on 3 December 2023). [CrossRef]
- Akgün, Ali E., and Halit Keskin. 2014. Organisational Resilience Capacity and Firm Product Innovativeness and Performance. International Journal of Production Research 52: 6918–37. [Google Scholar] [CrossRef]
- Alexandri, Cecilia, Bianca Pauna, and Corina Saman. 2020. The Relationship between Total Factor Productivity and Subsidies in the Case of Romanian Farms. Romanian Journal of Economic Forecasting XXIII: 85–98. Available online: https://ipe.ro/rjef/rjef4_20/rjef4_2020p85-98.pdf (accessed on 3 August 2022).
- Annarelli, Alessandro, and Fabio Nonino. 2016. Strategic and Operational Management of Organizational Resilience: Current State of Research and Future Directions. Omega 62: 1–18. [Google Scholar] [CrossRef]
- Augère-Granier, Marie-Laure, and James McEldowney. 2021. EU Rural Development Policy: Impact, Challenges and Outlook. Available online: https://www.europarl.europa.eu/RegData/etudes/BRIE/2021/690711/EPRS_BRI(2021)690711_EN.pdf (accessed on 10 July 2022).
- Babaloa, Yisau Abiodun. 2013. The Effect of Firm Size on Firms Profitability in Nigeria. Journal of Economics and Sustainable Development 4: 90–94. Available online: https://core.ac.uk/download/pdf/234645888.pdf (accessed on 3 August 2022).
- Bacsi, Zsuzsanna, and Péter Szálteleki. 2022a. Farm Profitability and Agritourism in the EU—Does Size Matter? Deturope 14: 153–72. Available online: https://www.deturope.eu/pdfs/det/2022/02/08.pdf (accessed on 11 December 2023). [CrossRef]
- Bacsi, Zsuzsanna, and Péter Szálteleki. 2022b. Impacts of Agritourism Revenues on Farm Incomes in 2004–2020—The V4 Experience. Visegrad Journal on Bioeconomy and Sustainable Development 11: 67–78. Available online: https://www.sciendo.com/article/10.2478/vjbsd-2022-0010 (accessed on 11 December 2023). [CrossRef]
- Bacsi, Zsuzsanna, Lóránt Dénes Dávid, and Zsolt Hollósy. 2022. Industry Differences in Productivity—In Agriculture and Tourism by Lake Balaton, Hungary. Sustainability 14: 11809. Available online: https://www.mdpi.com/2071-1050/14/19/11809 (accessed on 11 December 2023). [CrossRef]
- Baráth, Lajos, Imre Fertő, and Štefan Bojnec. 2020. The Effect of Investment, LFA and Agri-environmental Subsidies on the Components of Total Factor Productivity: The Case of Slovenian Farms. Journal of Agricultural Economics 71: 853–76. Available online: https://onlinelibrary.wiley.com/doi/10.1111/1477-9552.12374 (accessed on 3 December 2023). [CrossRef]
- Bartelsman, Eric, John Haltiwanger, and Stefano Scarpetta. 2013. Cross-Country Differences in Productivity: The Role of Allocation and Selection. American Economic Review 103: 305–34. Available online: https://pubs.aeaweb.org/doi/10.1257/aer.103.1.305 (accessed on 3 December 2023). [CrossRef]
- Bartelsman, Eric, Stefano Scarpetta, and Fabiano Schivardi. 2003. Comparative Analysis of Firm Demographics and Survival: Micro-Level Evidence for the OECD Countries. OECD Economics Department Working Papers. Available online: https://www.oecd-ilibrary.org/economics/comparative-analysis-of-firm-demographics-and-survival_010021066480 (accessed on 3 December 2023).
- Bašek, Váslav, and Josef Kraus. 2011. Comparison of Selected Indicators of Farms in the EU Member States. Agricultural Economics 52: 71–84. [Google Scholar] [CrossRef]
- Baumol, William. 1986. Productivity Growth, Convergence, and Welfare: What the Long-Run Data Show. American Economic Review 76: 1072–85. Available online: http://piketty.pse.ens.fr/files/Baumol1986.pdf (accessed on 12 October 2023).
- Berlingieri, Giuseppe Calligaris, Sara Calligaris, and Chiara Criscuolo. 2018. The Productivity-Wage Premium: Does Size Still Matter in a Service Economy? Available online: https://cep.lse.ac.uk/pubs/download/dp1557.pdf (accessed on 10 March 2022).
- Bernard, Andrew B., and Charles I. Jones. 1996. Productivity Across Industries and Countries: Time Series Theory and Evidence. The Review of Economics and Statistics 78: 135. Available online: https://www.jstor.org/stable/2109853?origin=crossref (accessed on 11 December 2023). [CrossRef]
- Biagini, Luigi, Federico Antonioli, and Simone Severini. 2022. The Impact of CAP Subsidies on the Productivity of Cereal Farms in Six European Countries. Available online: https://arxiv.org/abs/2212.03503 (accessed on 3 December 2023).
- Blomquist, Johan, and Martin Nordin. 2017. Do the CAP Subsidies Increase Employment in Sweden? Estimating the Effects of Government Transfers Using an Exogenous Change in the CAP. Regional Science and Urban Economics 63: 13–24. Available online: https://linkinghub.elsevier.com/retrieve/pii/S0166046216303489 (accessed on 3 December 2023).
- Blundell, Richard, Rachel Griffith, and John VanReenen. 1999. Market Share, Market Value and Innovation in a Panel of British Manufacturing Firms. Review of Economic Studies 66: 529–54. Available online: https://www.ucl.ac.uk/~uctp39a/Blundell-Griffith-VanReenen-1999.pdf (accessed on 12 October 2023). [CrossRef]
- Boda, Martin, and Vladimir Úradníček. 2019. Predicting Financial Distress of Slovak Agricultural Enterprises. Ekonomický časopis 67: 426–52. Available online: https://www.zbw.eu/econis-archiv/bitstream/11159/4218/1/1689260041.pdf (accessed on 4 November 2023).
- Bojnec, Štefan, and Imre Fertő. 2022. Do Different Types of Common Agricultural Policy Subsidies Promote Farm Employment? Land Use Policy 112: 105823. Available online: https://linkinghub.elsevier.com/retrieve/pii/S0264837721005469 (accessed on 3 December 2023). [CrossRef]
- Brand, Devin, Pauline Van Nurden, Dale Nordquist, Mark Canella, Katherine Wilts Johnson, and Robert Craven. 2022. Farm Financial Scorecard. Available online: https://www.cffm.umn.edu/wp-content/uploads/2019/02/FarmFinanceScorecard.pdf (accessed on 4 November 2023).
- Chenery, Hollis Burnley, Sherman Robinson, and Moshe Syrquin. 1986. Industrialization and Growth: A Comparative Study. New York, Oxford and London: Oxford University Press, pp. 361–77. [Google Scholar]
- Ciliberti, Stefano, and Angelo Frascarelli. 2019. The Income Effect of CAP Subsidies: Implications of Distributional Leakages for Transfer Efficiency in Italy. Bio-Based and Applied Economics 7: 161–78. Available online: https://oaj.fupress.net/index.php/bae/article/view/7673 (accessed on 3 December 2023).
- Ciliberti, Stefano, Luca Palazzoni, Sofia Maria Lilli, and Angelo Frascarelli. 2023. Direct Payments to Provide Environmental Public Goods and Enhance Farm Incomes: Do Allocation Criteria Matter? Available online: https://zenodo.org/record/7604045 (accessed on 11 December 2023).
- Colombo, Sergio, José Domingo Sánchez-Martínez, and Manuel Perujo-Villanueva. 2020. The Trade-Offs between Economic Efficiency and Job Creation in Olive Grove Smallholdings. Land Use Policy 96: 104696. Available online: https://linkinghub.elsevier.com/retrieve/pii/S0264837719312785 (accessed on 3 December 2023). [CrossRef]
- Coppola, Adele, Skalera Domenico, and Tosco Domenico. 2013. Economic Profitability and Long-Term Viability in Italian Agriculture. Available online: https://ageconsearch.umn.edu/record/166007 (accessed on 3 December 2023).
- Cunha, CUn, and Alan Swinbank. 2011. An Inside View of the CAP Reform Process. Oxford: Oxford University Press. Available online: http://www.oxfordscholarship.com/view/10.1093/acprof:oso/9780199591572.001.0001/acprof-9780199591572 (accessed on 11 December 2023).
- Dabkienė, Vida. 2021. The Comparative Analysis of Lithuanian Farms Economic Performance in the Context of Selected EU Countries. Bulgarian Journal of Agricultural Science 27: 1074–83. Available online: https://www.agrojournal.org/27/06-05.pdf (accessed on 26 August 2023).
- Dahles, Heidi, and Titi Prabawa Susilowati. 2015. Business Resilience in Times of Growth and Crisis. Annals of Tourism Research 51: 34–50. [Google Scholar] [CrossRef]
- Dallago, Bruno. 2003. Small and Medium Enterprises in Central and Eastern Europe. Available online: https://src-h.slav.hokudai.ac.jp/pdf_seminar/031210smes_3.pdf (accessed on 23 August 2023).
- Dallago, Bruno, and Chiara Guglielmetti, eds. 2010. Local Economies and Global Competitiveness. London: Palgrave Macmillan UK. Available online: http://link.springer.com/10.1057/9780230294967 (accessed on 3 December 2023).
- Dániel, Zoltán András. 2016. Az Uniós Vissza Nem Térítendő Források Hatása a Gazdaságilag Hátrányos Régiók Vállalkozásainak Konvergenciájára. COMIATUS Önkormányzati Szemle 26: 21–32. Available online: https://www.mrtt.hu/files/comitatus/comitatus_2016_osz.pdf (accessed on 12 July 2023).
- Dogan, Mesut. 2013. Does Firm Size Affect The Firm Profitability? Evidence from Turkey. Research Journal of Finance and Accounting 4: 53–59. Available online: https://core.ac.uk/download/pdf/234629457.pdf (accessed on 5 August 2022).
- Dries, Liesbeth, Pavel Ciaian, and d’Artis Kancs. 2012. Job Creation and Job Destruction in EU Agriculture. Food Policy 37: 600–8. Available online: https://linkinghub.elsevier.com/retrieve/pii/S0306919212000814 (accessed on 11 December 2023). [CrossRef]
- Dupraz, Pierre, and Laure Latruffe. 2015. Trends in Family Labour, Hired Labour and Contract Work on French Field Crop Farms: The Role of the Common Agricultural Policy. Food Policy 51: 104–18. Available online: https://linkinghub.elsevier.com/retrieve/pii/S0306919215000044 (accessed on 3 December 2023). [CrossRef]
- Durham, Timothy C., and Tamás Mizik. 2021. Comparative Economics of Conventional, Organic, and Alternative Agricultural Production Systems. Economies 9: 64. Available online: https://www.mdpi.com/2227-7099/9/2/64 (accessed on 3 December 2023). [CrossRef]
- European Commission. 2023. Key Policy Objectives of the CAP 2023-27. Official website of the European Union. Agriculture and Rural Development. Available online: https://agriculture.ec.europa.eu/common-agricultural-policy/cap-overview/cap-2023-27/key-policy-objectives-cap-2023-27_en (accessed on 11 January 2024).
- Fiksel, Joseph. 2006. Sustainability and Resilience: Toward a Systems Approach. Sustainability: Science, Practice and Policy 2: 14–21. [Google Scholar] [CrossRef]
- Fröhlich, Zlatan, and Irena Dokic. 2012. Challenges in Implementing Croatian Regional Policy within Semi-European Context. In Regions in Motion—Breaking the Path. Bratislava: ERSA. Available online: https://www.academia.edu/95168103/Challenges_in_Implementing_Croatian_Regional_Policy_within_semi_European_context (accessed on 18 November 2023).
- Garicano, Luis, Claire Lelarge, and John Van Reenen. 2016. Firm Size Distortions and the Productivity Distribution: Evidence from France. American Economic Review 106: 3139–79. Available online: https://pubs.aeaweb.org/doi/10.1257/aer.20130232 (accessed on 12 December 2023). [CrossRef]
- Garrone, Maria, Dorien Emmers, Alessandro Olper, and Johan Swinnen. 2019. Jobs and Agricultural Policy: Impact of the Common Agricultural Policy on EU Agricultural Employment. Food Policy 87: 101744. Available online: https://linkinghub.elsevier.com/retrieve/pii/S0306919219305615 (accessed on 3 December 2023). [CrossRef]
- Goodwin, Barry K., and Ashok K. Mishra. 2006. Are ‘Decoupled’ Farm Program Payments Really Decoupled? An Empirical Evaluation. American Journal of Agricultural Economics 88: 73–89. Available online: https://onlinelibrary.wiley.com/doi/10.1111/j.1467-8276.2006.00839.x (accessed on 3 December 2023). [CrossRef]
- Grzelak, Aleksander. 2022. The Relationship between Income and Assets in Farms and Context of Sustainable Development. PLoS ONE 17: e0265128. [Google Scholar] [CrossRef] [PubMed]
- HCSO (Hungarian Central Statistical Office). 2016. Az Alföld Élelmiszergazdasága (The Agriculture of the Great Plain). HSCO. Available online: https://www.ksh.hu/docs/hun/xftp/idoszaki/pdf/alfold_elelmgazd.pdf (accessed on 12 January 2024).
- HCSO (Hungarian Central Statistical Office). 2021. Területi Statisztikai Évkönyv, 2020 -Regional Statistical Yearbook of Hungary, 2020. Available online: https://www.ksh.hu/docs/hun/xftp/idoszaki/evkonyv/teruleti_evkonyv_2020.pdf (accessed on 25 October 2023).
- HCSO (Hungarian Central Statistical Office). n.d. Regional Atlas—The NUTS2 Regions of Hungary. Available online: https://www.ksh.hu/teruletiatlasz_regiok (accessed on 12 January 2024).
- Hollas, Chadley R., Lisa Chase, David Conner, Lori Dickes, R. David Lamie, Claudia Schmidt, Doolarie Singh-Knights, and Lindsay Quella. 2021. Factors Related to Profitability of Agritourism in the United States: Results from a National Survey of Operators. Sustainability 13: 13334. Available online: https://www.mdpi.com/2071-1050/13/23/13334 (accessed on 3 December 2023). [CrossRef]
- Holling, Crawford S. 1973. Resilience and Stability of Ecological Systems. Annual Review of Ecology and Systematics 4: 1–23. [Google Scholar] [CrossRef]
- Humphrey, John. 2003. Opportunities for SMEs in Developing Countries to Upgrade in a Global Economy. Geneva: International Labour Office, Working Paper. Available online: https://www.ilo.org/wcmsp5/groups/public/---ed_emp/---emp_ent/---ifp_seed/documents/publication/wcms_117688.pdf (accessed on 10 July 2022).
- International Monetary Fund. 1988. The Common Agricultural Policy of the European Community: Principles and Consequences: Occa Paper No. 62; Washington, DC: International Monetary Fund. Available online: https://elibrary.imf.org/openurl?genre=book&isbn=9781557750365 (accessed on 3 December 2023).
- ITM (Innovációs és Technológiai Minisztérium—Ministry of Innovation and Technology). 2020. Dél-Alföldi Gazdaságfejlesztési Zóna 2030-ig Tartó Gazdaságfejlesztési Stratégiájának Megalapozása és Rövidtávú Gazdaságélénkítési Terve—Fejlesztéspolitika Új Megközelítésben. Presented at the General Assembly of the Chamber of Commerce and Industry of Csongrád-Csanád County, Szeged, Hungary, August. [Google Scholar]
- Jedik, Andrej, and Aldona Stalgienė. 2018. The Likelihood of Farms Bankruptcy: The case of Lithuanian Family Farms. Management Theory and Studies for Rural Business and Infrastructure Development 40: 198–205. Available online: http://mts.asu.lt/mtsrbid/article/view/1118 (accessed on 3 December 2023). [CrossRef]
- Jorgenson, Dale Weldeau, Frank M. Gollop, and Barbara M. Fraumeni. 1987. Productivity and U.S. Economic Growth. Cambridge: Harvard University Press. [Google Scholar]
- Kahan, David. 2008. Managing Risk in Farming. Rome: FAO. [Google Scholar]
- Kay, Ronald D., William M. Edwards, and Patricia Anna Duffy. 2008. Farm Management. New York: McGraw-Hill. Available online: https://books.google.hu/books?id=hpkHIQAACAAJ (accessed on 3 December 2023).
- Kelle, Veronika. 2007. Effects of Subsidies on Liquidity and Profitability of Plant Grower Farms in Békés County. Cereal Research Communications 35: 589–92. Available online: http://www.akademiai.com/doi/abs/10.1556/CRC.35.2007.2.106 (accessed on 12 December 2023). [CrossRef]
- Keszthelyi, Szilárd, and Csaba Pesti. 2012. A Tesztüzemi Információs Rendszer eredményei 2011 -Results of Hungarian FADN Farms 2011; Budapest: Agrárgazdasági Kutató Intézet. Available online: http://repo.aki.gov.hu/2864/1/Tesztuzem_2011_web.pdf (accessed on 18 July 2023).
- Khanna, Mahima, Sebastian Sarmiento-Saher, Adrian Scutaru, and Sandeep Singh. 2021. Small Business, Big Growth: How Investing in SMEs Creates Jobs (English). Washington, DC: International Finance Corpotation World Bank Group. Available online: https://www.ifc.org/content/dam/ifc/doc/mgrt/ifc-sme-report-2021-fa-digital.pdf (accessed on 10 November 2023).
- Krueger, Anne O., Maurice Schiff, Alberto Valdés, and IBRD. 1991. The Political Economy of Agricultural Pricing Policy—A Synthesis of the Economics of Developing Countries. Baltimore: Johns Hopkins University Press. Available online: https://documents1.worldbank.org/curated/pt/691821468740190921/pdf/The-political-economy-of-agricultural-pricing-policy-volume-5-a-synthesis-of-the-political-economy-in-developing-countries.pdf (accessed on 21 August 2023).
- Kryszak, Łukasz, Marta Guth, and Bazyli Czyżewski. 2021. Determinants of Farm Profitability in the EU Regions. Does Farm Size Matter? Agricultural Economics (Zemědělská ekonomika) 67: 90–100. Available online: http://agricecon.agriculturejournals.cz/doi/10.17221/415/2020-AGRICECON.html (accessed on 3 December 2023). [CrossRef]
- Kumbhakar, Subal C., Mingyang Li, and Gudbrand Lien. 2023. Do Subsidies Matter in Productivity and Profitability Changes? Economic Modelling 123: 106264. Available online: https://linkinghub.elsevier.com/retrieve/pii/S0264999323000767 (accessed on 12 December 2023). [CrossRef]
- Lengnick-Hall, Cynthia A., Tammy E. Beck, and Mark L. Lengnick-Hall. 2011. Developing a Capacity for Organizational Resilience through Strategic Human Resource Management. Human Resource Management Review 21: 243–55. [Google Scholar] [CrossRef]
- Leung, Danny, Césaire Meh, and Yaz Terajima. 2008. Firm Size and Productivity. Bank of Canada Working Paper. Available online: https://www.bankofcanada.ca/2008/11/working-paper-2008-45/ (accessed on 12 December 2023).
- Li, Chengyou, Zhouhao Sha, Xiaoqin Sun, and Yong Jiao. 2022. The Effectiveness Assessment of Agricultural Subsidy Policies on Food Security: Evidence from China’s Poverty-Stricken Villages. International Journal of Environmental Research and Public Health 19: 13797. Available online: https://www.mdpi.com/1660-4601/19/21/13797 (accessed on 12 December 2023). [CrossRef]
- Lopriore, Marco. 2009. Supporting Enterprise Development and SME in Europe. EPIASCOPE 2: 31–36. [Google Scholar]
- Lutringer, Christine. 2022. The Puzzle of ‘Unspent’ Funds in Italy’s European Social Fund. Revue Internationale de Politique de Développement. Available online: http://journals.openedition.org/poldev/5192 (accessed on 3 December 2023).
- Magyar Államkincstár. 2022. Website of the Hungarian State Treasury, Data on EAGF and EAFRD Payments. Available online: https://www.mvh.allamkincstar.gov.hu/tamogatasok (accessed on 1 October 2022).
- Martin, William J., and Devashish Mitra. 1999. Productivity Growth and Convergence in Agriculture and Manufacturing (August 1999). Available online: https://ssrn.com/abstract=620646 (accessed on 12 December 2023).
- McIntyre, Robert J., and Bruno Dallago, eds. 2003. Small and Medium Enterprises in Transitional Economies. Basingstoke: Palgrave Macmillan UK. [Google Scholar]
- Meuwissen, Miranda P. M., Peter H. Feindt, Alisa Spiegel, Catrien J. A. M. Termeer, Erik Mathijs, Yann De Mey, Robert Finger, Alfons Balmann, Erwin Wauters, Julie Urquhart, and et al. 2019. A Framework to Assess the Resilience of Farming Systems. Agricultural Systems 176: 102656. [Google Scholar] [CrossRef]
- Myšková, Renáta, and Petr Hájek. 2017. Comprehensive Assessment of Firm Financial Performance Using Financial Ratios and Linguistic Analysis of Annual Reports. Journal of International Studies 10: 96–108. [Google Scholar] [CrossRef]
- Nanda, Swagatika, and Ajaya Kumar Panda. 2018. The Determinants of Corporate Profitability: An Investigation of Indian Manufacturing Firms. International Journal of Emerging Markets 13: 66–86. Available online: https://www.emerald.com/insight/content/doi/10.1108/IJoEM-01-2017-0013/full/html (accessed on 12 December 2023). [CrossRef]
- Nguyen, Thi Ngoc Lan, and Van Cong Nguyen. 2020. The Determinants of Profitability in Listed Enterprises: A Study from Vietnamese Stock Exchange. The Journal of Asian Finance, Economics and Business 7: 47–58. [Google Scholar] [CrossRef]
- Notte, Alessandra, Sonia Marongiu, Mauro Masiero, Pietro Molfetta, Riccardo Molignoni, and Luca Cesaro. 2015. Livestock and Ecosystem Services: An Exploratory Approach to Assess Agri-Environment-Climate Payments of RDP in Trentino. Land 4: 688–710. Available online: https://www.mdpi.com/2073-445X/4/3/688 (accessed on 12 December 2023). [CrossRef]
- Novotná, Martina, and Tomáš Volek. 2018. Efficiency of Production Factors in the EU. DETUROPE—The Central European Journal of Tourism and Regional Development 10: 147–68. Available online: http://deturope.eu/doi/10.32725/det.2018.018.html (accessed on 12 December 2023). [CrossRef]
- OECD. 2013. Productivity by Enterprise Size Class. In Entrepreneurship at a Glance 2013. Paris: OECD, pp. 34–35. Available online: https://www.oecd-ilibrary.org/industry-and-services/entrepreneurship-at-a-glance-2013/productivity-by-enterprise-size-class_entrepreneur_aag-2013-10-en (accessed on 3 December 2023).
- OECD. 2016. Financing SMEs and Entrepreneurs 2016: An OECD Scoreboard. OECD. Available online: https://www.oecd-ilibrary.org/industry-and-services/financing-smes-and-entrepreneurs-2016_fin_sme_ent-2016-en (accessed on 12 December 2023).
- Oprescu, Gheorghe, Daniela Luminita Constantin, Florinel Ilie, and Dragos Pîslaru. 2005. Analysis of Absorption Capacity of the EU Funds in Romania. Pre-Accession Impact Studies, European Institute of Romania, Bucharest III: 69. Available online: https://www.econstor.eu/bitstream/10419/74625/1/578403722.pdf (accessed on 3 December 2023).
- Opten. 2022. Website of the Opten Informatikai Kft. Available online: https://www.opten.hu/ (accessed on 10 October 2022).
- Organisation for Economic Co-Operation and Development. 1995. Technological Change and Structural Adjustment in OECD Agriculture. Paris: OECD. [Google Scholar]
- Pal, Rudrajeet, Håkan Torstensson, and Heikki Mattila. 2014. Antecedents of Organizational Resilience in Economic Crises—An Empirical Study of Swedish Textile and Clothing SMEs. International Journal of Production Economics 147: 410–28. [Google Scholar] [CrossRef]
- Polukhin, Andrey A., and Veronika I. Panarina. 2022. Financial Risk Management for Sustainable Agricultural Development Based on Corporate Social Responsibility in the Interests of Food Security. Risks 10: 17. Available online: https://www.mdpi.com/2227-9091/10/1/17 (accessed on 2 December 2023). [CrossRef]
- Popa, Adina-Simona. 2013. Performance Indicators for SMEs Accessing EU Funds. Constanta Maritime University Annals 19: 319–22. Available online: http://cmu-edu.eu/RePEc/cmc/annals/319-v19.pdf (accessed on 14 October 2023).
- Potori, Norbert, Máté Kovács, and Vásáry Viktoria. 2013. The Common Agricultural Policy 2014–2020: An Impact Assessment of the New System of Direct Payments in Hungary. Studies in Agricultural Economics 115: 118–23. Available online: https://ageconsearch.tind.io/record/161079/files/1318-potori_v3.pdf (accessed on 21 November 2023). [CrossRef]
- Potter, Jonathan, Alessandra Proto, and Marco Marchese. 2010. 2010/12 Entrepreneurship, SMEs and Local Development in the Marche Region, Italy. OECD Local Economic and Employment Development (LEED) Working Papers. Available online: https://www.oecd-ilibrary.org/industry-and-services/smes-entrepreneurship-and-local-development-in-the-marche-region-italy_5km7jf7tj6mt-en (accessed on 3 December 2023).
- Saad, Muhammedamin Hussen, Geoffrey Hagelaar, Gerben Van Der Velde, and S. W. F. Omta. 2021. Conceptualization of SMEs’ Business Resilience: A Systematic Literature Review. Edited by Pantea Foroudi. Cogent Business & Management 8: 1938347. [Google Scholar] [CrossRef]
- Schultz, Theodore William. 1964. Transforming Traditional Agriculture. New Haven: Yale University Press. [Google Scholar]
- Scott, Noel, and Eric Laws. 2006. Tourism Crises and Disasters: Enhancing Understanding of System Effects. Journal of Travel & Tourism Marketing 19: 149–58. [Google Scholar] [CrossRef]
- Scown, Murray W., Mark V. Brady, and Kimberly A. Nicholas. 2020. Billions in Misspent EU Agricultural Subsidies Could Support the Sustainable Development Goals. One Earth 3: 237–50. Available online: https://linkinghub.elsevier.com/retrieve/pii/S2590332220303559 (accessed on 12 December 2023). [CrossRef] [PubMed]
- Sheng, Yu, and Will Chancellor. 2019. Exploring the Relationship between Farm Size and Productivity: Evidence from the Australian Grains Industry. Food Policy 84: 196–204. Available online: https://linkinghub.elsevier.com/retrieve/pii/S0306919218302422 (accessed on 12 December 2023). [CrossRef]
- Staniszewski, Jakub, and Michał Borychowski. 2020. The Impact of the Subsidies on Efficiency of Different Sized Farms. Case Study of the Common Agricultural Policy of the European Union. Agricultural Economics (Zemědělská ekonomika) 66: 373–80. Available online: http://agricecon.agriculturejournals.cz/doi/10.17221/151/2020-AGRICECON.html (accessed on 12 December 2023). [CrossRef]
- Stulpinienė, Vaida, and Vilija Aleknevičienė. 2012. Financial Distress Determinants: The Survey of Lithuanian Farms. In Research for Rural Development. Jelgava: Latvia University of Agriculture, pp. 203–9. [Google Scholar]
- Svobodová, Eliška, Radka Redlichová, Gabriela Chmelíková, and Ivana Blažková. 2022. Are the Agricultural Subsidies Based on the Farm Size Justified? Empirical Evidence from the Czech Republic. Agriculture 12: 1574. Available online: https://www.mdpi.com/2077-0472/12/10/1574 (accessed on 12 December 2023). [CrossRef]
- Szczepański, Marcin. 2017. Helping European SMEs to Grow: Start up and Scale up Initiatives for Business Ventures in the EU. In Depth Analysis. Luxembourg: European Parliamen, Directorate General for Parliamentary Research Services. Publications Office. Available online: https://data.europa.eu/doi/10.2861/433038 (accessed on 3 December 2023)Directorate General for Parliamentary Research Services. Publications Office.
- Tallaksen, Joel. 2021. What Is Agricultural Resilience? West Central Research and Outreach Center, University of Minnesota, College of Food, Agricultural and Natural Resources, Morris, Minnesota. Available online: https://wcroc.cfans.umn.edu/about-us/wcroc-news/ag-resilience (accessed on 12 January 2024).
- Țigănașu, Ramona, Cristian Incaltarau, and Gabriela Pascariu Carmen. 2018. Administrative Capacity, Structural Funds Absorption and Development. Evidence from Central and Eastern European Countries. Romanian Journal of European Affairs 18: 39–59. Available online: https://ssrn.com/abstract=3296925 (accessed on 3 August 2023).
- Tognazzo, Alessandra, Paolo Gubitta, and Saverio Dave Favaron. 2016. Does Slack Always Affect Resilience? A Study of Quasi-Medium-Sized Italian Firms. Entrepreneurship & Regional Development 28: 768–90. [Google Scholar] [CrossRef]
- Vavrek, Roman, Ivana Kravčáková Vozárová, and Rastislav Kotulič. 2021. Evaluating the Financial Health of Agricultural Enterprises in the Conditions of the Slovak Republic Using Bankruptcy Models. Agriculture 11: 242. Available online: https://www.mdpi.com/2077-0472/11/3/242 (accessed on 12 December 2023). [CrossRef]
- Williams, Nick, and Tim Vorley. 2014. Economic Resilience and Entrepreneurship: Lessons from the Sheffield City Region. Entrepreneurship & Regional Development 26: 257–81. [Google Scholar] [CrossRef]
- Wolf, Christopher A., and Jason Karszes. 2023. Financial Risk and Resiliency on US Dairy Farms: Measures, Thresholds, and Management Implications. Journal of Dairy Science 106: 3301–11. Available online: https://linkinghub.elsevier.com/retrieve/pii/S002203022300098X (accessed on 3 December 2023). [CrossRef] [PubMed]
- WTO. 2016. Levelling the Trading Field for SMEs. Geneva: World Trade Organization. Available online: https://www.wto.org/english/res_e/booksp_e/world_trade_report16_e.pdf (accessed on 22 November 2023).
- Zaman, Gheorghe, and Anca Cristea. 2011. EU Structural Funds Absorption in Romania: Obstacles and Issues. Romanian Journal of Economics 32: 60–77. Available online: http://www.revecon.ro/articles/2011-1/2011-1-4.pdf (accessed on 9 December 2023).

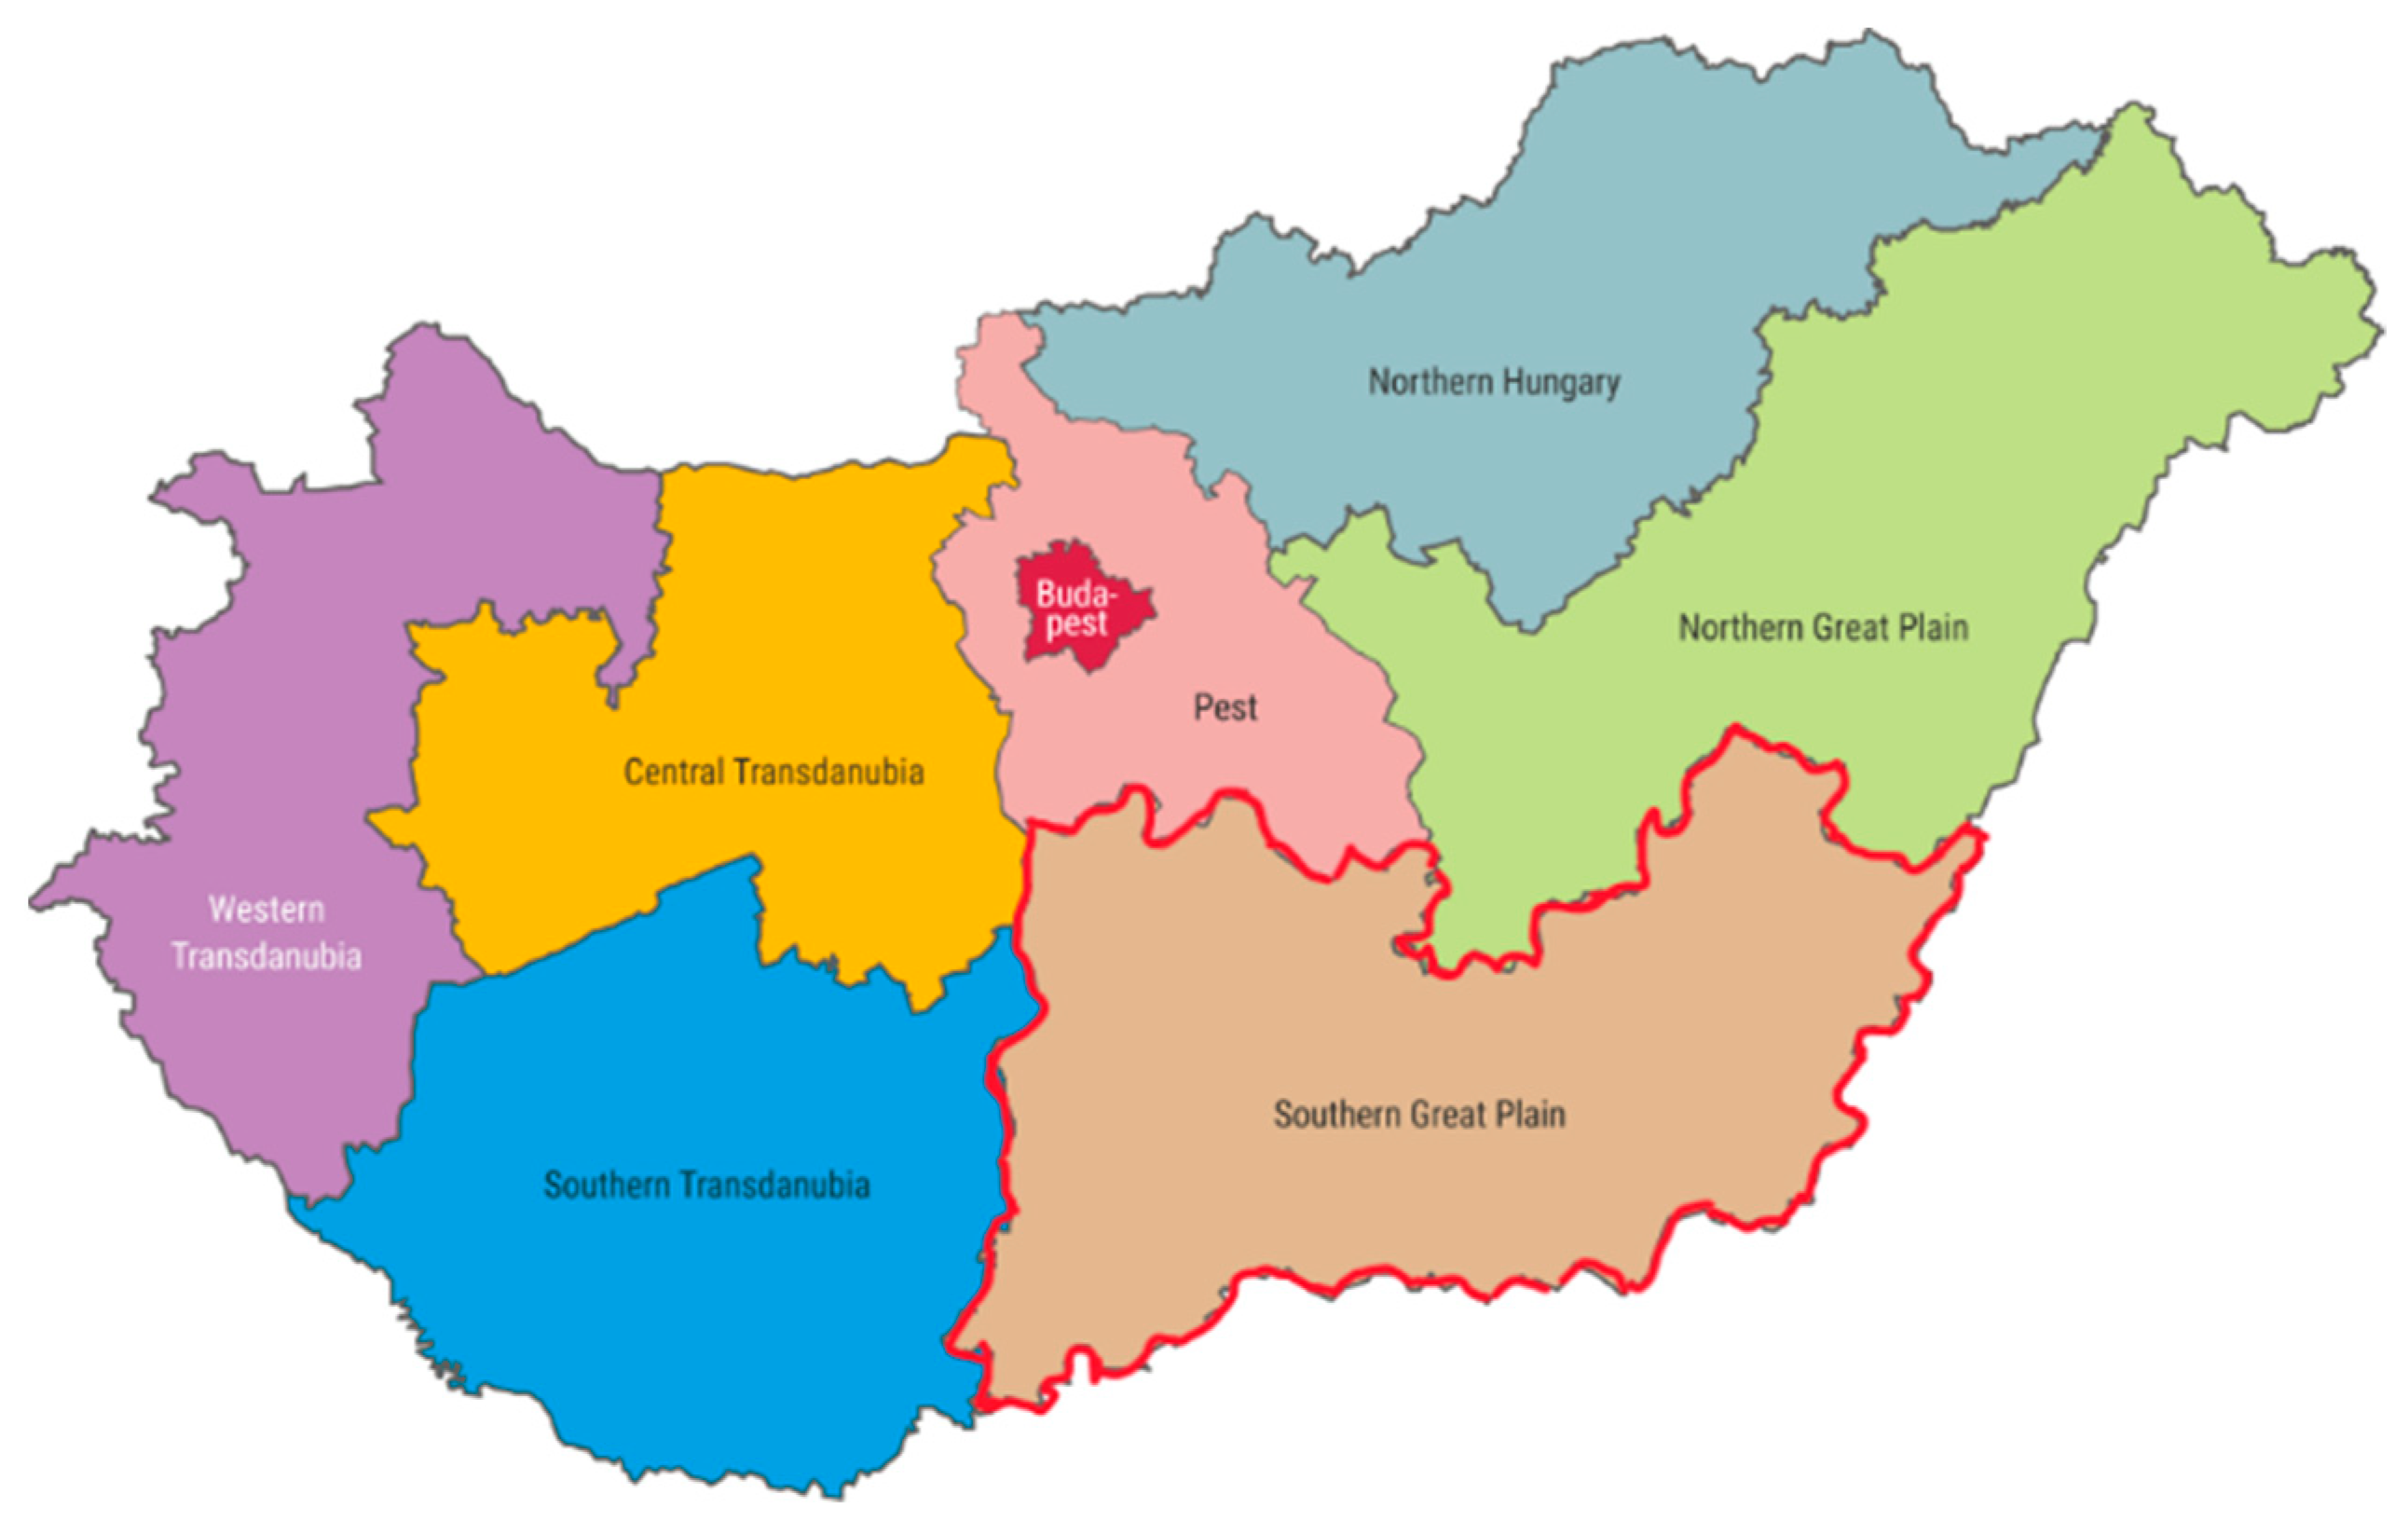
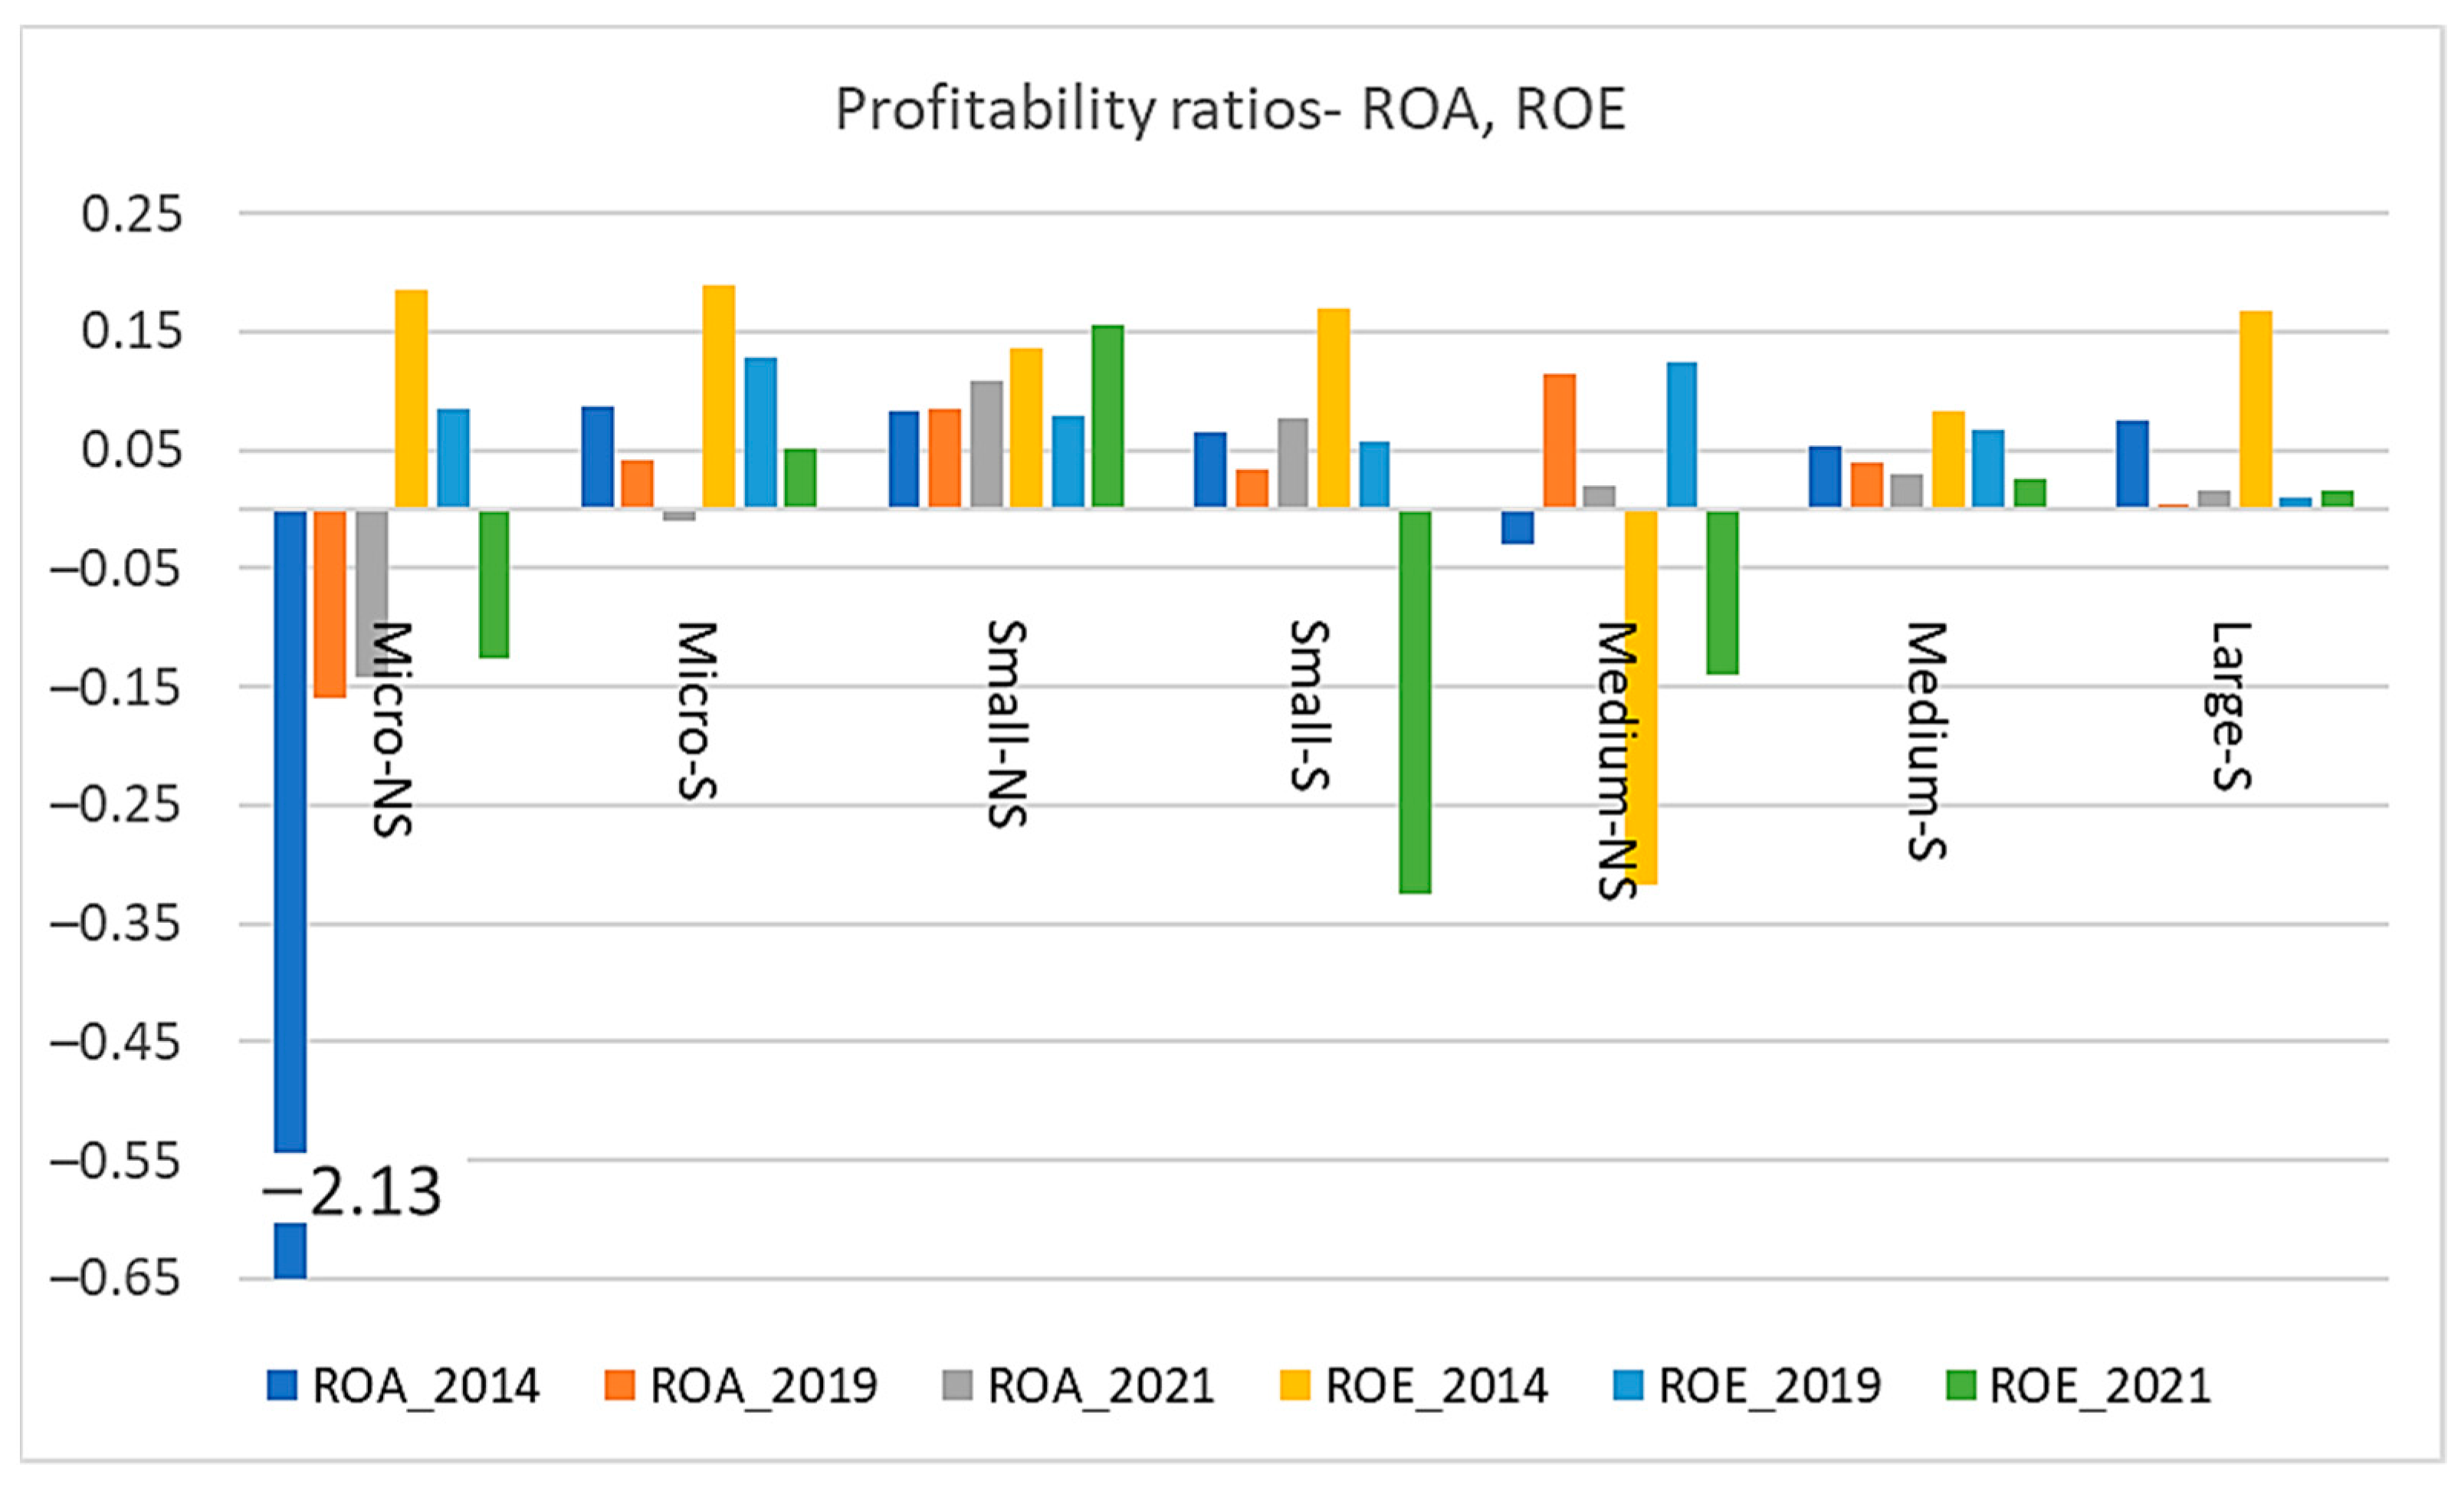
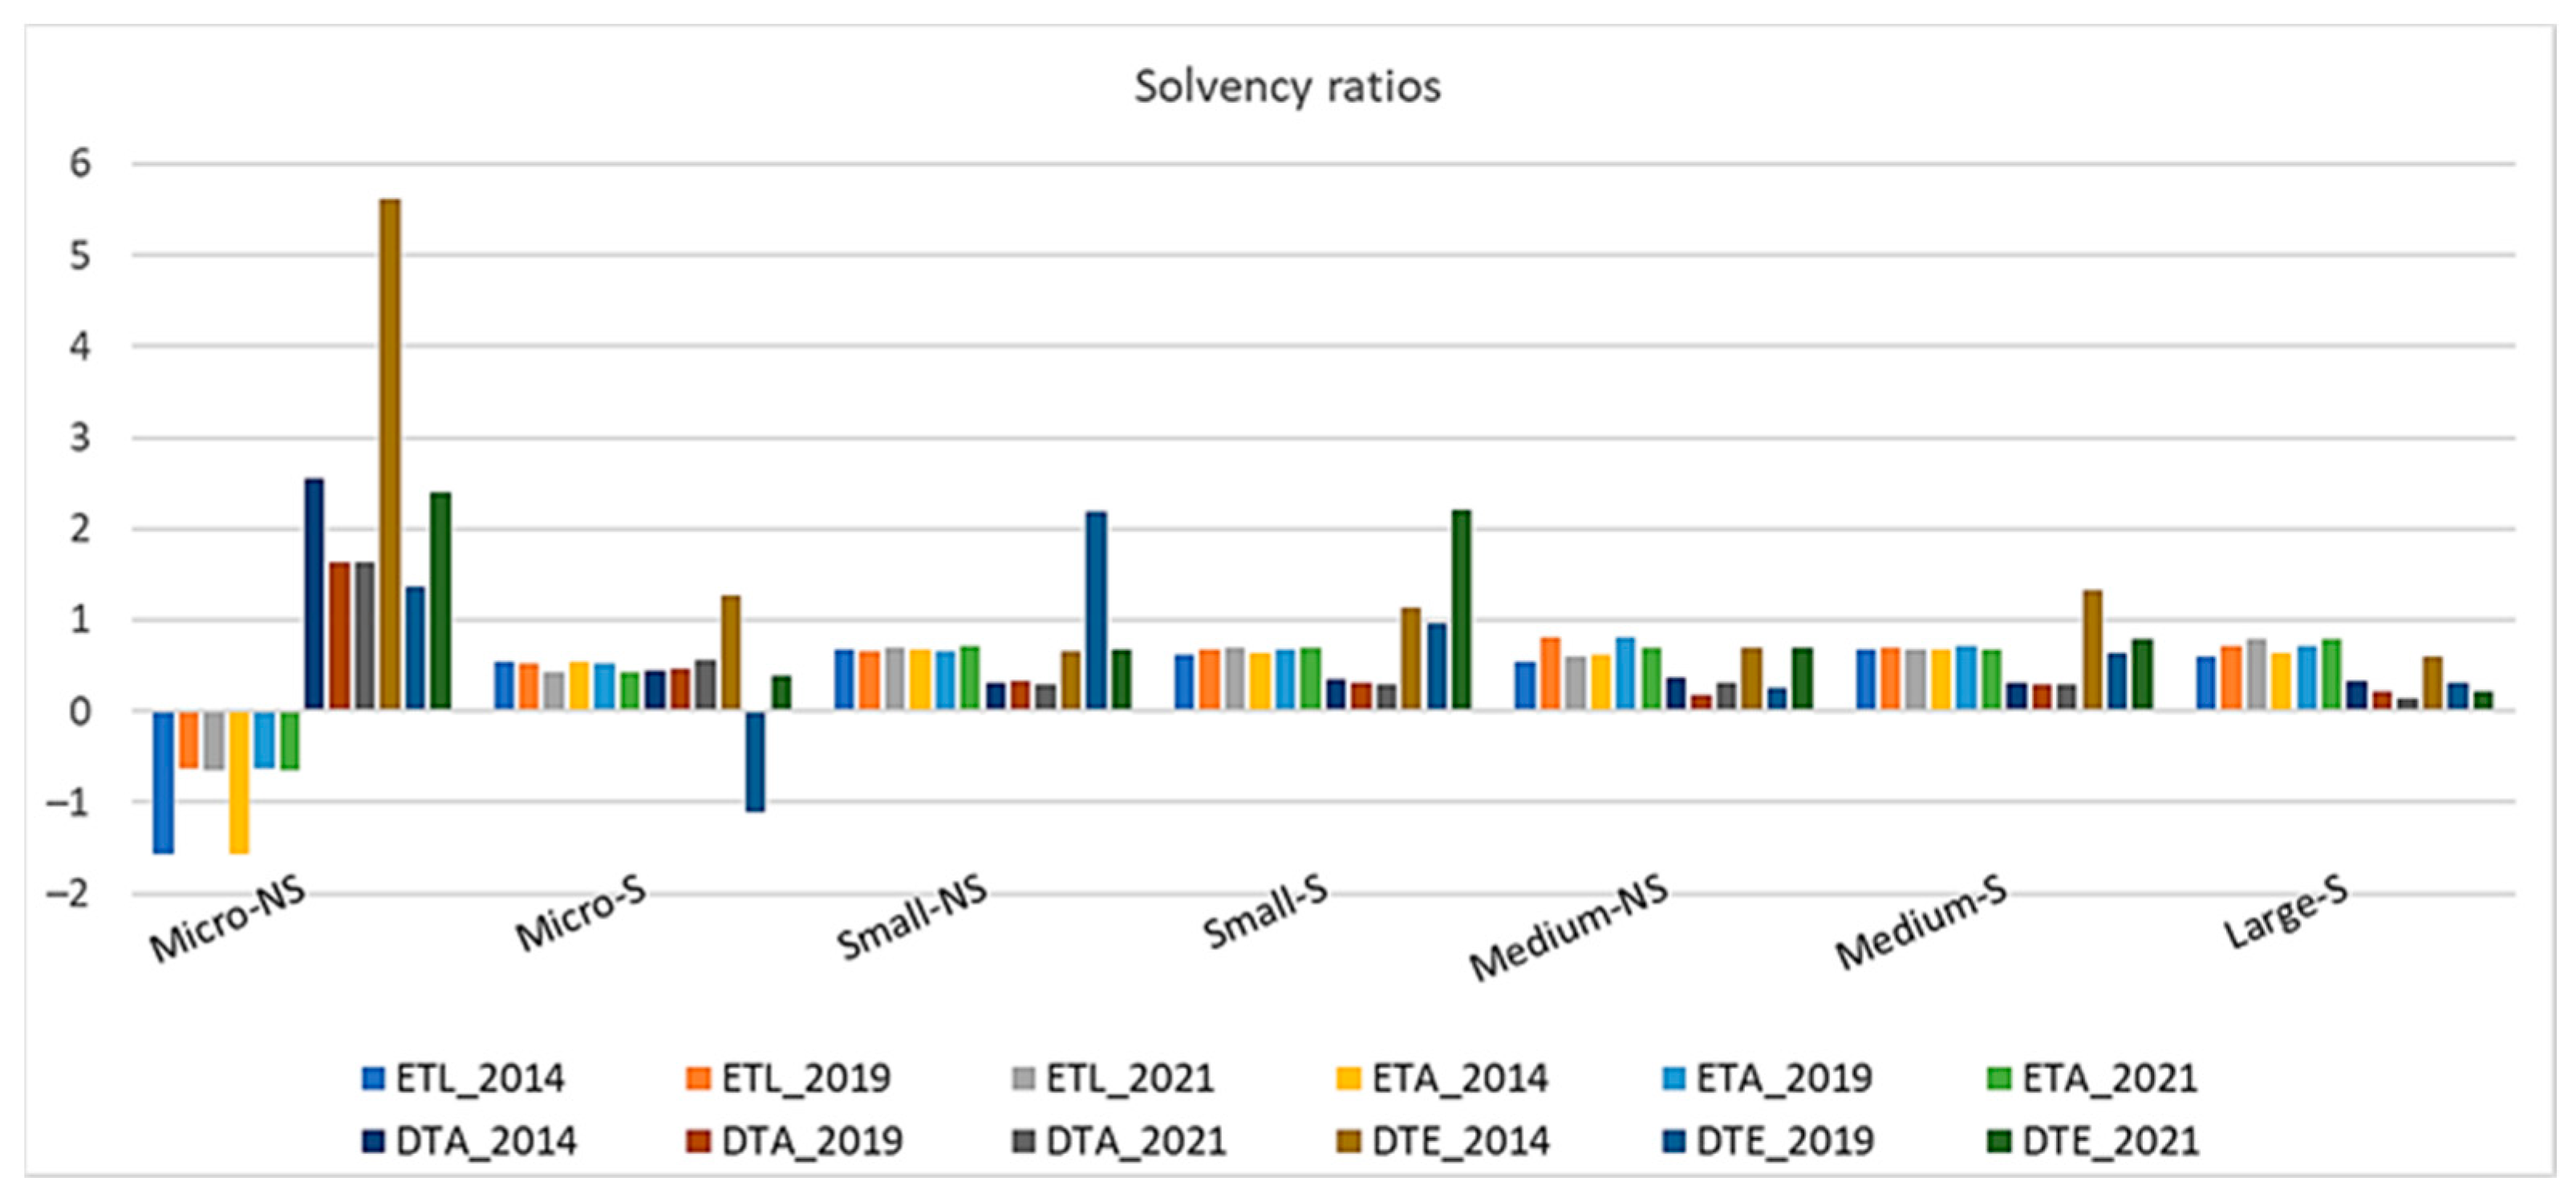
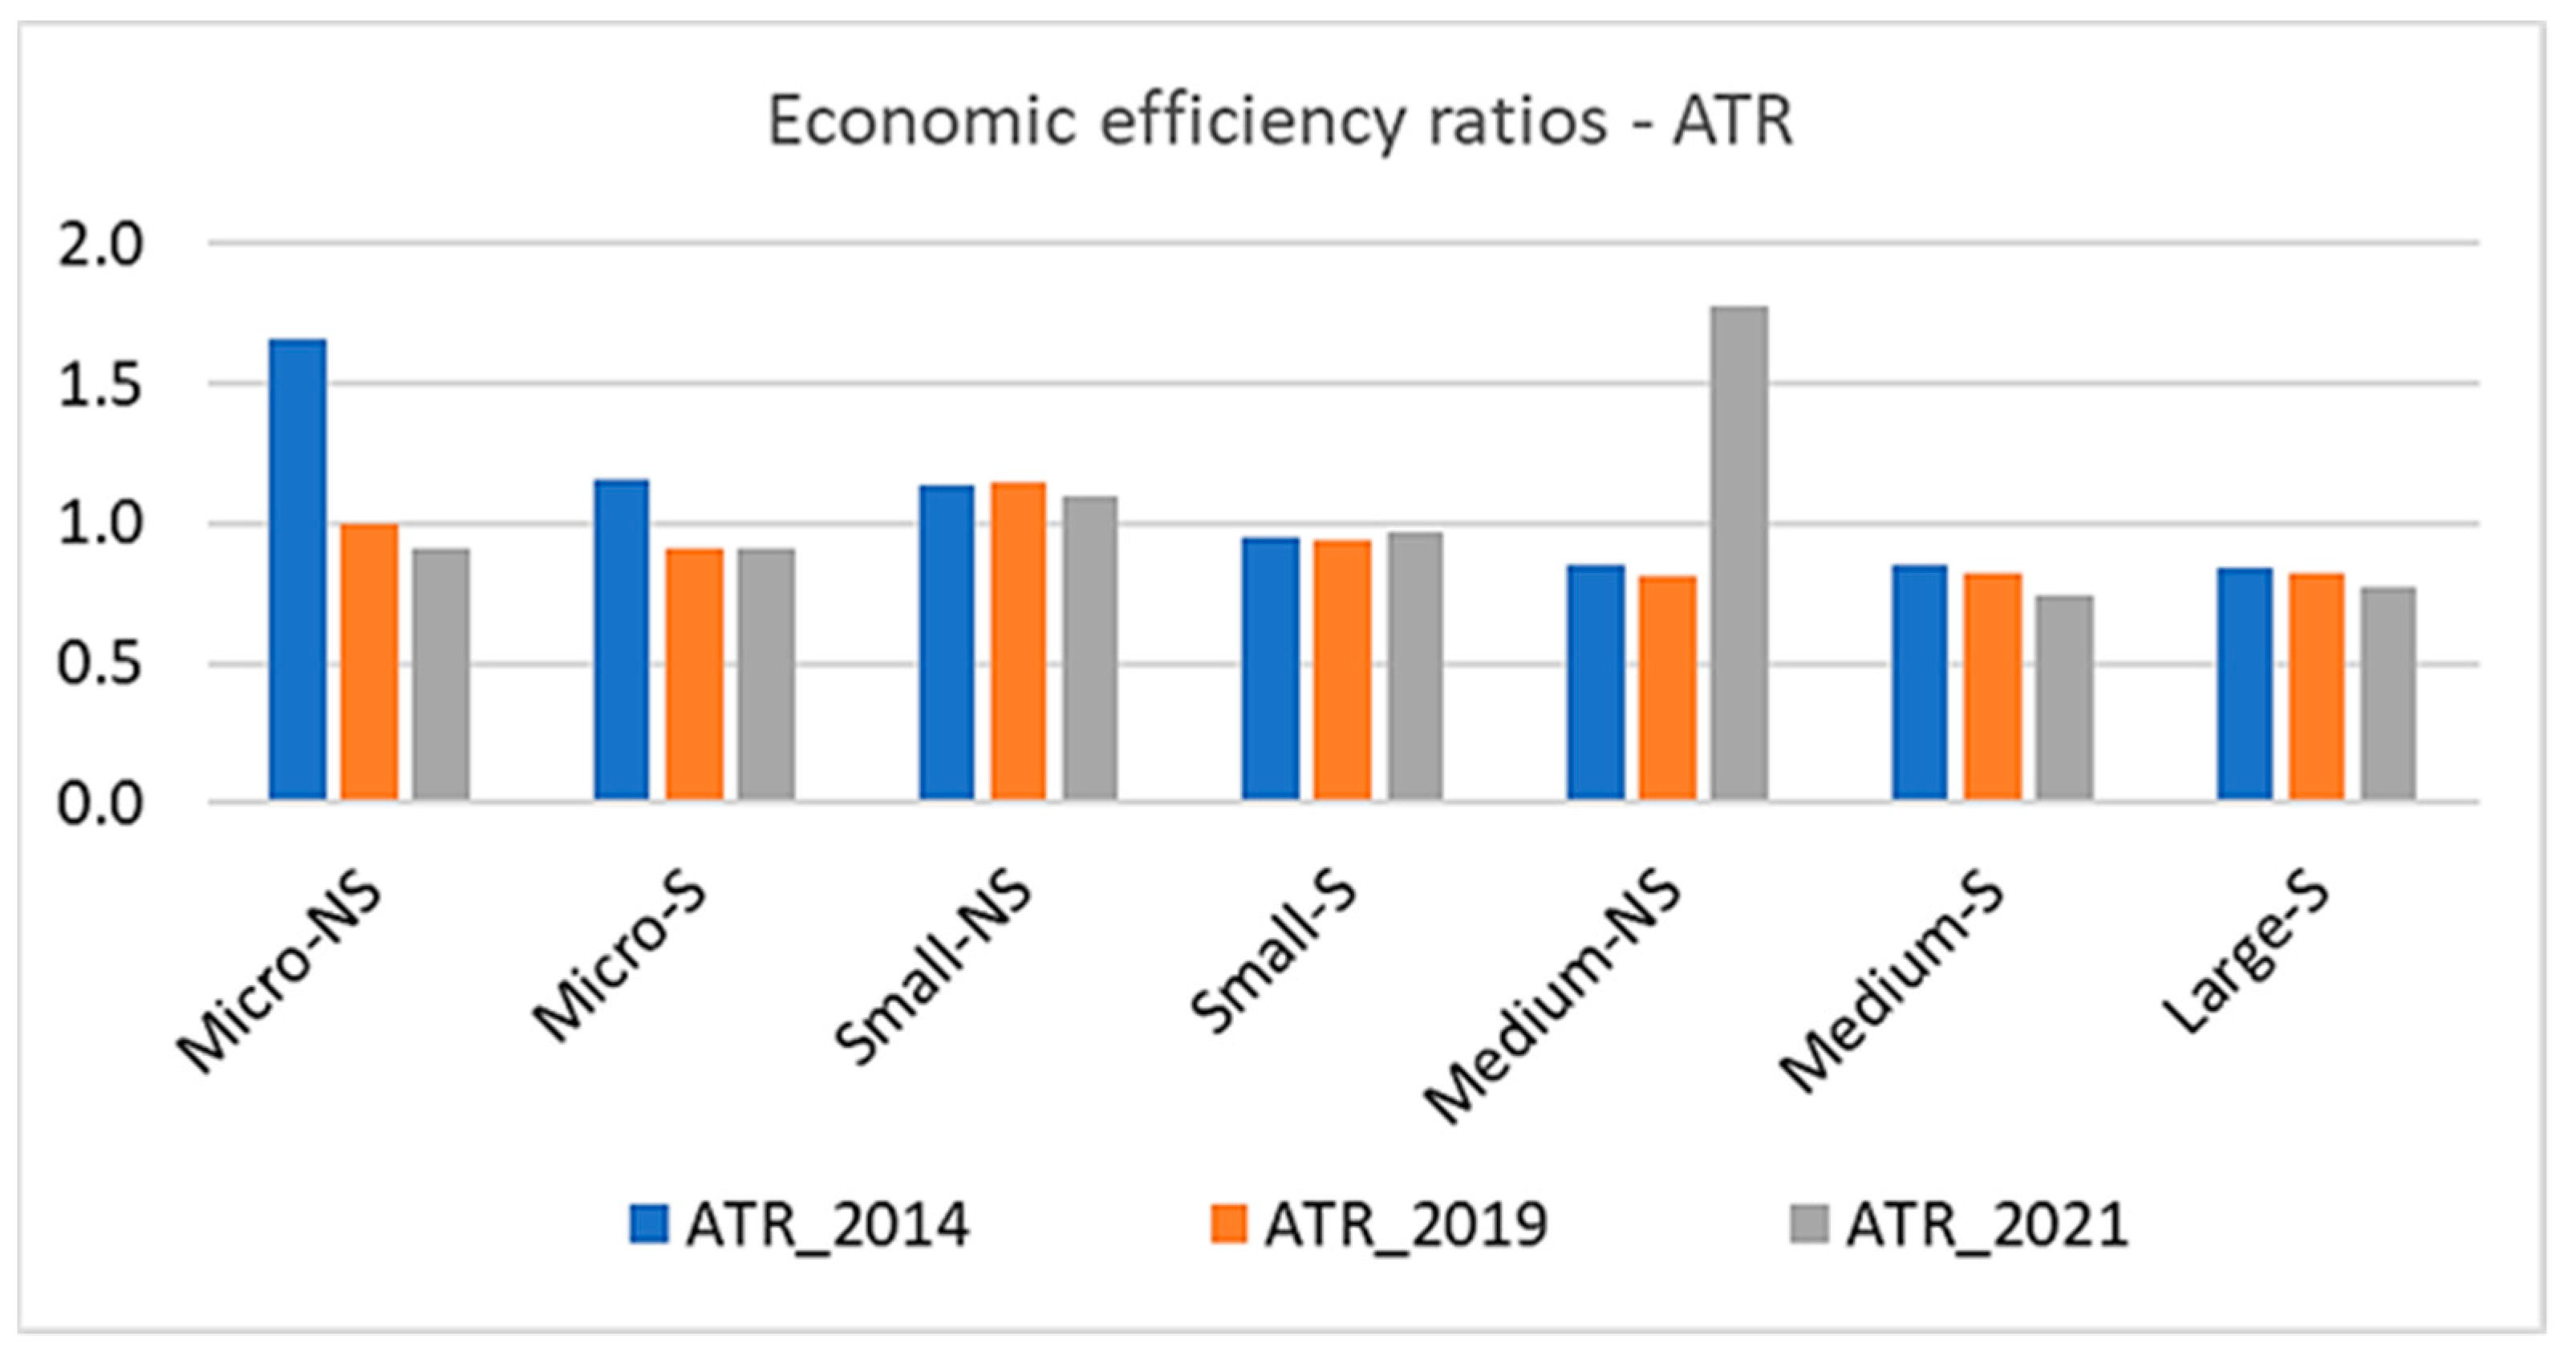
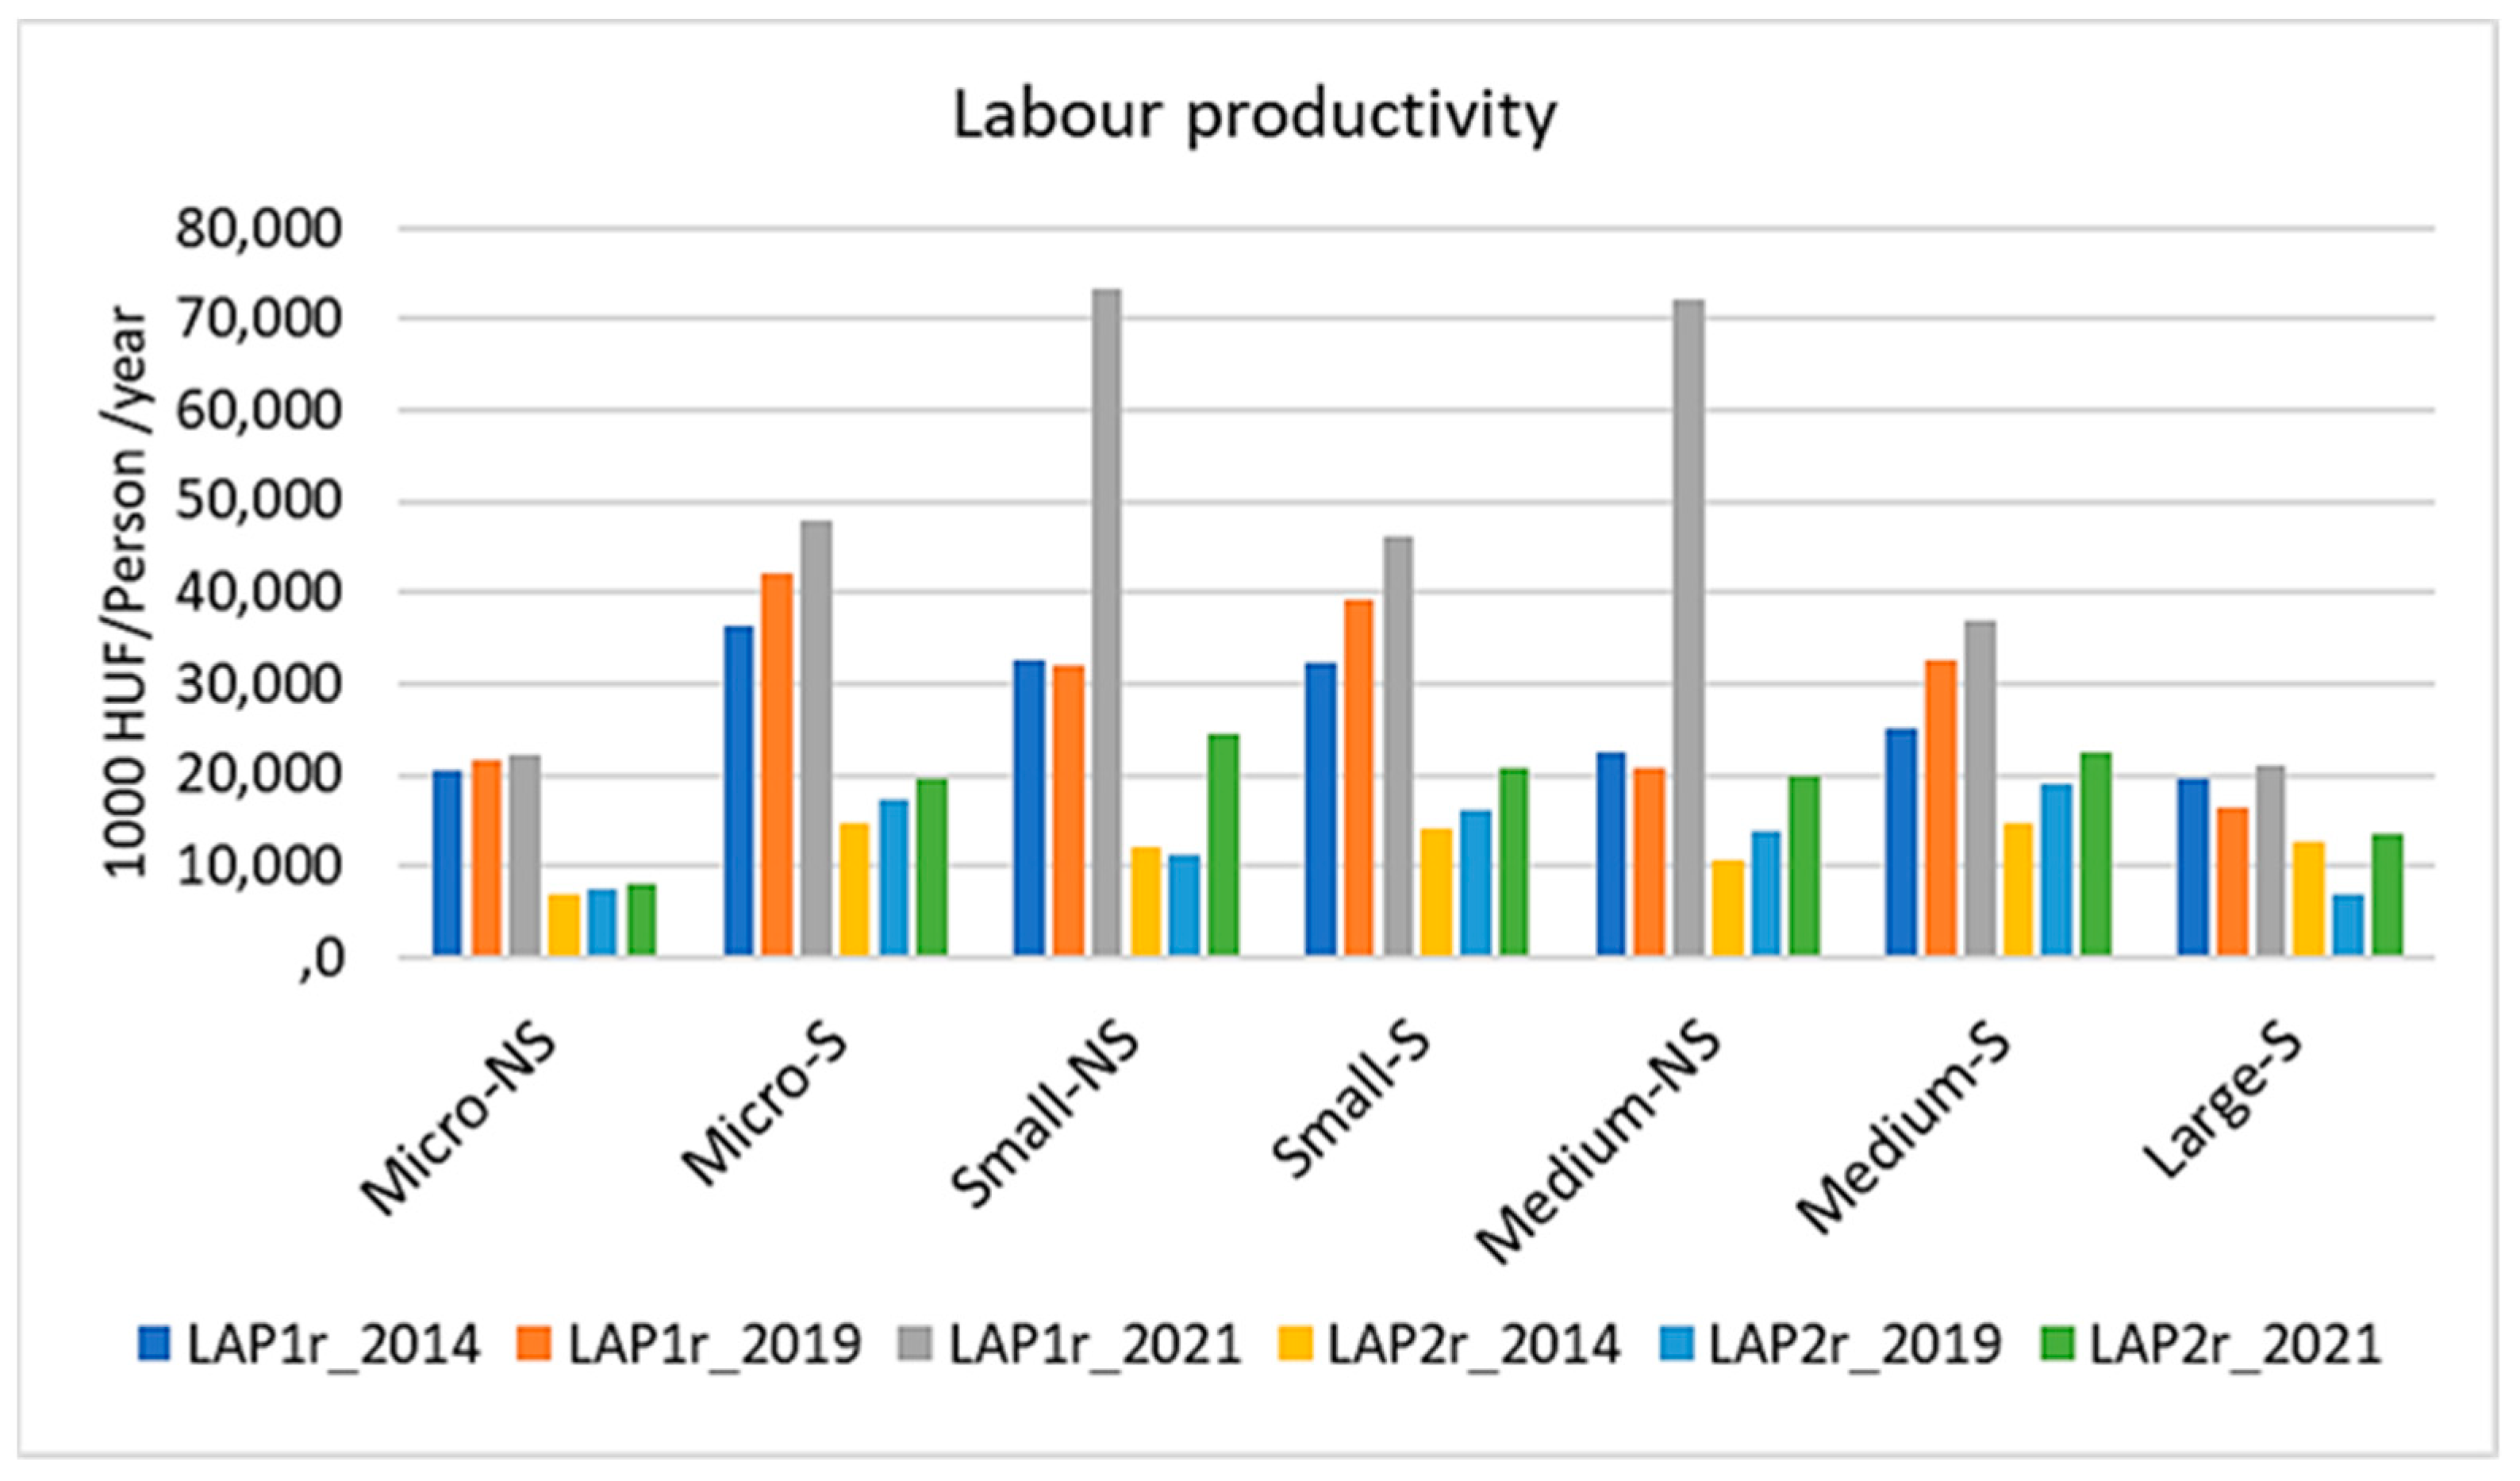
Figure 2.
Mean subsidies per farm, by business size and category. Source: Authors’ own computation.

Figure 3.
Changes in mean values of farm financial data by farm size and by subsidy status, as % of the 2014 value (all data at 2014 price levels). S: subsidized farms; NS: non-subsidized farms (Source: Authors’ own computation).
Figure 3.
Changes in mean values of farm financial data by farm size and by subsidy status, as % of the 2014 value (all data at 2014 price levels). S: subsidized farms; NS: non-subsidized farms (Source: Authors’ own computation).

Figure 4.
Liquidity ratios—mean values by farm size and subsidy status, 2014, 2019 and 2021 (Source: Authors’ own computation).
Figure 4.
Liquidity ratios—mean values by farm size and subsidy status, 2014, 2019 and 2021 (Source: Authors’ own computation).

Figure 5.
Profitability ratios—mean values by farm size and subsidy status, 2014, 2019 and 2021 (Source: Authors’ own computation).
Figure 5.
Profitability ratios—mean values by farm size and subsidy status, 2014, 2019 and 2021 (Source: Authors’ own computation).


Figure 6.
Solvency ratios—mean values by farm size and subsidy status, 2014, 2019 and 2021 (Source: Authors’ own computation).
Figure 6.
Solvency ratios—mean values by farm size and subsidy status, 2014, 2019 and 2021 (Source: Authors’ own computation).

Figure 7.
Economic efficiency ratios—mean values by farm size and subsidy status, 2014, 2019 and 2021 (Source: Authors’ own computation).
Figure 7.
Economic efficiency ratios—mean values by farm size and subsidy status, 2014, 2019 and 2021 (Source: Authors’ own computation).


Figure 8.
Labor productivity—mean values by farm size and subsidy status, 2014, 2019 and 2021 (Source: Authors’ own computation).
Figure 8.
Labor productivity—mean values by farm size and subsidy status, 2014, 2019 and 2021 (Source: Authors’ own computation).

Table 1.
Computed performance indicators (variables) used for the analysis (Source: Authors’ own computation).
Table 1.
Computed performance indicators (variables) used for the analysis (Source: Authors’ own computation).
| Indicator | How to Compute | Variable |
|---|---|---|
| Liquidity measures | ||
| Net working capital ratio | (current assets − current liabilities)/total assets | WCA |
| Liquidity ratio 1, Current ratio | current assets/current liabilities | LIR1 |
| Liquidity ratio 2, Quick ratio | (current assets − inventories)/current liabilities | LIR2 |
| Liquidity ratio 3, Cash ratio | cash and cash equivalents/current liabilities | LIR3 |
| Profitability measures | ||
| Operating profit margin ratio | (net farm income from operations + interest − cost of unpaid labor and management)/total output | OPM |
| Rate of return on assets | (net farm income from operations + interest − cost of unpaid labor and management)/total assets | ROA |
| Rate of return on equity | (net farm income from operations + interest − cost of unpaid labor and management)/owner’s equity | ROE |
| Solvency indicators | ||
| Equity to liabilities ratio | owner’s equity/total liabilities | ETL |
| Equity to assets ratio | owner’s equity/total assets | ETA |
| Debt to equity ratio | total liabilities/owner’s equity | DTE |
| Debt to assets ratio | total liabilities/total assets | DTA |
| Economic efficiency indicators | ||
| Efficiency of tangible assets ratio | net sales revenue/tangible assets | EFTA |
| Asset turnover ratio | total revenue/total assets | ATR |
| Labor efficiency measures, HUF/person | ||
| Labor productivity 1 | CPI-adjusted gross output/average workforce | LAP1r |
| Labor productivity 2 | CPI-adjusted gross value added/average workforce | LAP2r |
| Employment indicators | ||
| Number of employees (persons) | Annual working units, average workforce | AW |
| Employment change, 2014 to 2021 | AW of 2021 − AW of 2014 | AWC |
| Subsidy measures | ||
| Total subsidy (current + capital) | annual subsidy value at 2014 price level | ToSr |
| Current subsidy | annual subsidy value at 2014 price level | CuSr |
| Capital subsidy | annual subsidy value at 2014 price level | CaSr |
Table 2.
Average subsidy per farm, by size category, for subsidized farms, with Kruskal–Wallis and Dunnett T3 test statistics for differences between size categories (Source: Authors’ own computation).
Table 2.
Average subsidy per farm, by size category, for subsidized farms, with Kruskal–Wallis and Dunnett T3 test statistics for differences between size categories (Source: Authors’ own computation).
| Indicator | Size | N | Mean | Std. Dev. | Kruskal–Wallis Chi2 | Dunnett T3 to Micro | Dunnett T3 to Small | Dunnett T3 to Medium | Dunnett T3 to Large |
|---|---|---|---|---|---|---|---|---|---|
| Sum of total subsidies (2014–2021) | Micro | 690 | 137,770.30 | 263,623.33 | −461,033.8 *** | −1,685,615.2 *** | −2,903,158.8 | ||
| Small | 246 | 598,804.12 | 572,654.02 | 461,033.8 *** | −1,224,581.4 *** | −2,442,125.0 | |||
| Medium | 49 | 1,823,385.51 | 1,352,540.31 | 1,685,615.2 *** | 1,224,581.4 *** | −1,217,543.6 | |||
| Large | 2 | 3,040,929.09 | 1,471,547.47 | 2,903,158.8 | 2,442,125.0 | 1,217,543.6 | |||
| Total | 987 | 342,244.24 | 625,119.99 | 321.171 *** | |||||
| Sum of current subsidies (2014–2021) | Micro | 690 | 110,928.83 | 247,433.14 | −391,267.6 *** | −1,287,412.3 *** | −2,757,227.5 | ||
| Small | 246 | 502,196.43 | 522,534.75 | 391,267.6 *** | −896,144.7 *** | −2,365,959.9 | |||
| Medium | 49 | 1,398,341.15 | 1,092,119.45 | 1,287,412.3 *** | 896,144.7 *** | −1,469,815.2 | |||
| Large | 2 | 2,868,156.36 | 1,648,666.74 | 2,757,227.5 | 2,365,959.9 | 1,469,815.2 | |||
| Total | 987 | 277,949.59 | 528,683.08 | 247.668 *** | |||||
| Sum of capital subsidies (2014–2021) | Micro | 690 | 26,841.47 | 68,822.98 | −69,766.2 *** | −398,202.9 *** | −145,931.3 | ||
| Small | 246 | 96,607.69 | 137,843.83 | 69,766.2 *** | −328,436.7 *** | −76,165.1 | |||
| Medium | 49 | 425,044.36 | 406,611.00 | 398,202.9 *** | 328,436.7 *** | 252,271.6 | |||
| Large | 2 | 172,772.74 | 177,119.30 | 145,931.3 | 76,165.1 | −252,271.6 | |||
| Total | 987 | 64,294.66 | 154,418.48 | 153.212 *** | |||||
| Mean AW per farm (2014–2021) | Micro | 690 | 3.24 | 3.07 | −19.90 *** | −96.40 *** | −483.76 * | ||
| Small | 246 | 23.14 | 13.05 | 19.90 *** | −76.50 *** | −463.86 * | |||
| Medium | 49 | 99.64 | 53.58 | 96.40 *** | 76.50 *** | −387.36 * | |||
| Large | 2 | 487.00 | 47.91 | 483.76 * | 463.86 * | 387.36 * | |||
| Total | 987 | 13.97 | 33.33 | 591.889 *** |
***: significant at 1%; **: at 5%; *: at 10% level, N: number of subsidized farms as of 2021.
Table 3.
Employment statistics for agricultural enterprises in the Southern Great Plain region, 2014–2021 (Source: Authors’ own computation).
Table 3.
Employment statistics for agricultural enterprises in the Southern Great Plain region, 2014–2021 (Source: Authors’ own computation).
| Year | All | Micro | Small | Medium | Large | Subsidized | Not Subsidized | K–W Chi2 |
|---|---|---|---|---|---|---|---|---|
| 2014 | 15,438 | 2462 | 5978 | 5311 | 1687 | 10,050 | 5388 | 167.90 *** |
| 2015 | 15,458 | 2530 | 6009 | 5586 | 1333 | 10,106 | 5352 | 173.65 *** |
| 2016 | 15,383 | 2590 | 6075 | 5216 | 1502 | 9910 | 5473 | 170.53 *** |
| 2017 | 15,403 | 2544 | 6190 | 5454 | 1215 | 9846 | 5557 | 183.72 *** |
| 2018 | 15,159 | 2514 | 6134 | 5260 | 1251 | 9708 | 5451 | 175.43 *** |
| 2019 | 14,978 | 2526 | 6107 | 5136 | 1209 | 9702 | 5276 | 190.21 *** |
| 2020 | 14,693 | 2507 | 6029 | 5158 | 999 | 9610 | 5083 | 184.59 *** |
| 2021 | 14,435 | 2638 | 5969 | 4924 | 904 | 9301 | 5134 | 180.63 *** |
| Average annual AW | 15,118 | 2539 | 6 061 | 5256 | 1263 | 9779 | 5339 | |
| AWC (2021–2014) | −1003 | 176 | −9 | −387 | −783 | −749 | −254 | 21.438 *** |
| No. of farms | 1378 | 1053 | 264 | 57 | 4 | 987 | 391 | |
| AW/farm in 2014 | 11.20 | 2.34 | 22.64 | 93.18 | 421.75 | 10.18 | 13.78 | 167.901 *** |
| Average annual AW/farm | 10.97 | 2.41 | 22.96 | 92.20 | 315.63 | 9.91 | 13.66 | 191.938 *** |
| AWC/farm | −0.73 | 0.17 | −0.03 | −6.79 | −195.75 | −0.76 | −0.65 | 21.440 *** |
K–W: Kruskal–Wallis test for subsidized vs. non-subsidized farms, ***: significant at 1%.
Table 4.
Basic descriptive statistics of balance sheet information by enterprise size category, 2014, 2021, values in 1000 HUF at 2014 price levels (Source: Authors’ own computation).
Table 4.
Basic descriptive statistics of balance sheet information by enterprise size category, 2014, 2021, values in 1000 HUF at 2014 price levels (Source: Authors’ own computation).
| Total Assets | Owner’s Equity | Profit after Tax | Total Liabilities | |||
|---|---|---|---|---|---|---|
| 2014 | ||||||
| Micro | Subsidized | Mean | 35,158.9 | 21,351.6 | 2692.1 | 7190.0 |
| Std. Dev | 99,333.8 | 85,343.3 | 19,906.7 | 27,294.9 | ||
| Non-subsidized | Mean | 117,070.6 | 69,420.5 | 7186.2 | 21,889.5 | |
| Std. Dev | 160,285.5 | 113,378.4 | 19,007.1 | 42,419.6 | ||
| All | Mean | 88,755.4 | 52,804.1 | 5632.7 | 16,808.2 | |
| Std. Dev | 147,396.7 | 106,972.9 | 19,431.4 | 38,507.2 | ||
| Kruskal–Wallis | Chi2 | 218.323 ** | 163.704 *** | 93.425 *** | 158.413 *** | |
| Small | Subsidized | Mean | 506,697.5 | 357,552.1 | 31,159.4 | 92,163.3 |
| Std. Dev | 437,237.7 | 344,439.9 | 39,409.7 | 95,087.4 | ||
| Non-subsidized | Mean | 911,197.0 | 600,945.1 | 44,391.0 | 126,680.6 | |
| Std. Dev | 827,570.1 | 647,092.0 | 81,371.2 | 189,346.4 | ||
| All | Mean | 874,424.3 | 578,818.5 | 43,188.2 | 123,542.7 | |
| Std. Dev | 807,878.1 | 629,131.9 | 78,532.8 | 182,947.9 | ||
| Kruskal–Wallis | Chi2 | 8.552 *** | 4.352 ** | 0.241 | 1.880 | |
| Medium | Subsidized | Mean | 2,134,979.0 | 1,230,286.7 | −124,739.3 | 243,602.3 |
| Std. Dev | 799,663.1 | 241,070.4 | 294,118.5 | 173,837.1 | ||
| Non-subsidized | Mean | 2,783,316.5 | 1,870,449.9 | 110,651.1 | 396,230.1 | |
| Std. Dev | 2,076,444.7 | 1,356,479.1 | 118,307.9 | 524,482.3 | ||
| All | Mean | 2,749,193.5 | 1,836,757.1 | 98,262.2 | 388,197.1 | |
| Std. Dev | 2,030,963.7 | 1,328,283.3 | 138,378.2 | 512,451.6 | ||
| Kruskal–Wallis | Chi2 | 0.155 | 0.414 | 2.147 | 0.155 | |
| Large | Subsidized = All | Mean | 11,291,612.5 | 7,317,162.8 | 396,231.3 | 1,039,733.3 |
| Std. Dev | 5,283,336.6 | 4,092,687.8 | 427,701.0 | 549,168.3 | ||
| 2021 | ||||||
| Micro | Subsidized | Mean | 57,527.34 | 36,043.89 | 5386.28 | 9930.26 |
| Std. Dev | 171,094.36 | 143,837.68 | 33,316.86 | 27,122.71 | ||
| Non-subsidized | Mean | 207,999.92 | 136,729.90 | 17,586.22 | 31,241.26 | |
| Std. Dev | 279,135.33 | 213,967.13 | 43,294.70 | 68,382.69 | ||
| All | Mean | 156,503.58 | 102,272.06 | 13,411.03 | 23,947.98 | |
| Std. Dev | 257,540.83 | 198,622.20 | 40,559.24 | 58,548.77 | ||
| Kruskal–Wallis | Chi2 | 238.974 *** | 217.679 *** | 88.454 *** | 161.091 *** | |
| Small | Subsidized | Mean | 773,472.17 | 521,324.72 | 56,445.81 | 114,585.00 |
| Std. Dev | 611,372.38 | 459,316.91 | 61,732.23 | 150,289.93 | ||
| Non-subsidized | Mean | 1,122,360.93 | 805,016.76 | 83,666.68 | 151,642.51 | |
| Std. Dev | 958,467.20 | 811,193.09 | 182,466.63 | 212,253.74 | ||
| All | Mean | 1,084,438.24 | 774,180.67 | 80,707.89 | 147,614.52 | |
| Std. Dev | 932,573.83 | 785,061.83 | 173,596.98 | 206,524.48 | ||
| Kruskal–Wallis | Chi2 | 4.181 ** | 3.918 ** | 0.112 | 2.480 | |
| Medium | Subsidized | Mean | 2,913,389.84 | 1,837,547.96 | 4779.20 | 496,839.03 |
| Std. Dev | 874,860.31 | 443,054.44 | 446,154.83 | 371,349.25 | ||
| Non-subsidized | Mean | 4,656,137.00 | 3,174,912.81 | 130,621.97 | 511,240.42 | |
| Std. Dev | 3,846,696.27 | 2,848,230.72 | 206,642.31 | 631,117.46 | ||
| All | Mean | 4,587,793.98 | 3,122,467.12 | 125,686.96 | 510,675.66 | |
| Std. Dev | 3,786,452.10 | 2,803,673.25 | 213,501.05 | 620,598.79 | ||
| Kruskal–Wallis | Chi2 | 0.285 | 0.530 | 0.115 | 0.398 | |
| Large | Subsidized = All | Mean | 29,415,503.32 | 26,341,125.83 | 437,592.12 | 1,172,400.76 |
| Std. Dev | 32,540,651.16 | 31,436,737.95 | 542,062.15 | 83,696.46 |
***: significant at 1%; **: at 5%; *: at 10% level, Kruskal–Wallis test for subsidized vs. non-subsidized farms.
Table 5.
Mean values of changes in different financial indicators, from 2014 to 2021, by subsidy status and size (Source: Authors’ own computation).
Table 5.
Mean values of changes in different financial indicators, from 2014 to 2021, by subsidy status and size (Source: Authors’ own computation).
| Micro | Small | |||||||
| Non-Subsidized | Subsidized | All | Chi2 | Non-Subsidized | Subsidized | All | Chi2 | |
| Liquidity | ||||||||
| LIR1 | 86.095 | 7.977 | 33.260 | 0.389 | −692.134 | −33.252 | −101.580 | 1.268 |
| LIR2 | 85.409 | 5.594 | 31.426 | 1.611 | −691.953 | −25.938 | −95.006 | 2.038 |
| LIR3 | 25.165 | 3.403 | 10.446 | 2.605 | −15.165 | −21.847 | −21.154 | 0.269 |
| WCA | −0.319 | 0.073 | −0.061 | 1.482 | −0.076 | 0.277 | 0.239 | 0.119 |
| Profitability | ||||||||
| OPM | −35.554 | 13.787 | −0.843 | 5.926 * | 0.215 | 3.344 | 3.041 | 0.270 |
| ROA | −0.088 | 0.004 | −0.027 | 6.519 * | 0.057 | 0.123 | 0.116 | 0.324 |
| ROE | −0.252 | 0.065 | −0.043 | 3.790 # | −0.038 | 0.234 | 0.204 | 0.008 |
| Solvency | ||||||||
| ETL | −1.046 | 0.432 | −0.071 | 0.192 | −0.081 | 0.322 | 0.278 | 2.165 |
| ETA | −1.048 | 0.433 | −0.072 | 0.146 | −0.074 | 0.322 | 0.279 | 2.461 |
| DTA | 1.057 | −0.438 | 0.072 | 0.015 | 0.066 | −0.318 | −0.276 | 2.461 |
| DTE | 1.578 | −0.627 | 0.125 | 4.222 * | 0.506 | −0.720 | −0.587 | 2.706 |
| Economic efficiency | ||||||||
| EFTA | 5.745 | −6.755 | −3.168 | 1.373 | 51.379 | −0.931 | 4.381 | 3.218 # |
| ATR | −0.063 | −0.025 | −0.038 | 6.956 ** | 0.464 | 0.114 | 0.152 | 4.760 * |
| Labor productivity | ||||||||
| LAP1r | −27,097.4 | 6966.2 | −2593.7 | 40.701 *** | 6327.9 | −1739.5 | −975.9 | 0.145 |
| LAP2r | −11,085.6 | 3384.9 | −676.2 | 35.322 *** | −12,398.1 | −1488.5 | −2521.1 | 0.088 |
| Medium | Total | |||||||
| Non-Subsidized | Subsidized | All | Chi2 | Non-Subsidized | Subsidized | All | Chi2 | |
| Liquidity | ||||||||
| LIR1 | 2.985 | −2.478 | −2.260 | 0.414 | 21.89 | −3.17 | 3.499 | 0.534 |
| LIR2 | 2.745 | −2.280 | −2.079 | 0.708 | 21.28 | −2.91 | 3.520 | 1.873 |
| LIR3 | 2.805 | −1.423 | −1.254 | 0.708 | 21.73 | −3.33 | 3.333 | 3.706 # |
| WCA | −0.013 | −0.043 | −0.042 | 0.009 | −0.30 | 0.12 | 0.000 | 1.733 |
| Profitability | ||||||||
| OPM | 0.161 | −0.031 | −0.023 | 3.309 # | −32.11 | 10.28 | 0.055 | 5.800 ** |
| ROA | 0.040 | −0.078 | −0.073 | 0.897 | −0.08 | 0.03 | 0.000 | 5.762 ** |
| ROE | −0.140 | −0.237 | −0.234 | 0.643 | −0.23 | 0.09 | −0.001 | 4.159 * |
| Solvency | ||||||||
| ETL | −0.197 | −0.006 | −0.014 | 0.038 | −0.97 | 0.38 | 0.001 | 0.006 |
| ETA | −0.112 | −0.001 | −0.005 | 0.021 | −0.97 | 0.38 | 0.001 | 0.000 |
| DTA | 0.115 | 0.000 | 0.004 | 0.002 | 0.98 | −0.39 | −0.001 | 0.069 |
| DTE | 0.402 | 0.234 | 0.240 | 0.038 | 1.49 | −0.61 | −0.014 | 3.176 # |
| Economic efficiency | ||||||||
| EFTA | 3.025 | −0.021 | 0.098 | 0.896 | 10.27 | −4.80 | −1.289 | 3.119 # |
| ATR | 0.752 | −0.108 | −0.074 | 0.059 | −0.018 | 0.01 | −0.001 | 5.827 ** |
| Labor productivity | ||||||||
| LAP1r | 42,968.1 | 1422.1 | 3117.9 | 0.207 | −22,869.9 | 4062.3 | −1901.1 | 33.973 *** |
| LAP2r | 12,593.3 | 3505.4 | 3876.4 | 0.163 | −11,005.7 | 1978.3 | −896.6 | 30.604 *** |
Chi2 values are results of the Kruskal–Wallis test, with significance as ***: p < 0.001; **: p < 0.01; *: p < 0.05; #: p < 0.1.
Disclaimer/Publisher’s Note: The statements, opinions and data contained in all publications are solely those of the individual author(s) and contributor(s) and not of MDPI and/or the editor(s). MDPI and/or the editor(s) disclaim responsibility for any injury to people or property resulting from any ideas, methods, instructions or products referred to in the content. |
© 2024 by the authors. Licensee MDPI, Basel, Switzerland. This article is an open access article distributed under the terms and conditions of the Creative Commons Attribution (CC BY) license (https://creativecommons.org/licenses/by/4.0/).
Share and Cite
MDPI and ACS Style
Szálteleki, P.; Bánhegyi, G.; Bacsi, Z. The Impacts of CAP Subsidies on the Financial Risk and Resilience of Hungarian Farms, 2014–2021. Risks 2024, 12, 30. https://doi.org/10.3390/risks12020030
AMA Style
Szálteleki P, Bánhegyi G, Bacsi Z. The Impacts of CAP Subsidies on the Financial Risk and Resilience of Hungarian Farms, 2014–2021. Risks. 2024; 12(2):30. https://doi.org/10.3390/risks12020030
Chicago/Turabian StyleSzálteleki, Péter, Gabriella Bánhegyi, and Zsuzsanna Bacsi. 2024. "The Impacts of CAP Subsidies on the Financial Risk and Resilience of Hungarian Farms, 2014–2021" Risks 12, no. 2: 30. https://doi.org/10.3390/risks12020030
Note that from the first issue of 2016, this journal uses article numbers instead of page numbers. See further details here.