
Abstract
Evaluation of seismic attributes and seismic reflection characteristics analysis of Razzak Field was undertaken by subdividing the study area rock units. There are four seismo-facies units of varying parameters from top to bottom. These units are comparable to the Apollonia and Khoman Formations; the Abu-Roash Formation; Baharyia Formation and Alamein Formation. The seismo-facies unit 1 of the Apollonia and Khoman Formations reveal parallel to sub-parallel layering, with thickness increases northwards. The lithological distribution consists of limestone with minor clay intercalations with facies varying from middle neritic graded to outer neritic. Unit 2 of the Abu-Roash Formation shows divergent layering, with a thickness increasing gradually northwards and eastwards. The lithological distribution shows predominance of carbonate, sandstone occurring in minor portions and laterally graded into shale with littoral facies ranging to inner and middle neritic facies. Unit 3 of the Baharyia Formation reveals chaotic and oblique layering with a time thickness increases towards northeast and southwest parts, the lithological distribution exhibited sand and shale with minor limestone streaks, with facies varied changed from continental to inner-middle neritic, unit 4 of the Alamein Formation shows variation from parallel-subparallel orientation to oblique and chaotic with thickness increasing towards northwards and eastwards, the lithological distribution exhibited dolomitic limestone with minor streaks of limestone with facies varied from middle neritic facies to outer neritic and bathyal. Finally, the results are integrated to build up a seismo-stratigraphic model of the evaluated area of the northwestern Desert of Egypt. Seismic interpretation involves the construction of structure contour maps, in terms of time and depth, on the tops of the Apollonia, Abu-Roash, Baharyia and Alamein Formations. These maps show three structural closures, due to folding, that are dissected by NW–SE faults, analysis of relevant structural and stratigraphic seismic attributes such as root-mean-square amplitude, local structural dip, variance, ISO frequency component, sweetness and acoustic impedance average energy applied on reservoir tops, to enhance the visibility of faults, geological interpretation and the physical parameters of the subsurface related to lithology and stratigraphy for reservoir characterization. Finally, the results obtained are used to construct a seismic structural model. Integration of seismic and stratigraphic data is used to build a geological model of the northwestern Desert of Egypt.
Article Highlights
-
1.
The seismic reflection characteristics shows a graded depositional environments from continental to neritic facies.
-
2.
Local Structural DipSeismic attributes show the linear structural elements as faults, oriented NW-SW across the study area.
-
3.
The seismic maps demonstrate two structural trends: first trend related to Jurassic rifting (NNE-SSW) is of Late Paleozoic rifting and the second trend (NW-SE) is of Tertiary tectonics, while the Jurassic and Cretaceous faults are of (NE-SW) trend.
1 Introduction
The seismic reflection characteristics allow to predict the geologic information of the study area, where the primary seismic reflections are generated by the physical surfaces of the rocks. The result is a sequence of mutual alterations of zones of varying acoustic impedances and seismic reflectivities, where the seismic attributes are extracted from the seismic reflections and they are sensitive to lateral changes in geology these can be used in conjunction also, to collect information about the geologic outputs and causatives of the area (Mitchum 1977).
1.1 Location and geologic setting
The study area is located to the north of the Western Desert of Egypt, about 150 km southwest of Alexandria (Fig. 1). It is lied between latitudes 30° 24′ and 30° 36′ N and longitudes of 28° 24′ and 28°36′ E. The Razzak field is a part of the Alamein basin, which is an ENE-oriented basin in the form of NNW-tilted fault blocks. There are two main fault trends: the first one was NE-SW matching the Jurassic rift, characterized by normal faults, which formed in conjunction with the opening of the Neo-Tethys, and the other fault trend is NW–SE related to Early Cretaceous rifting. (Moustafa 2002).

Location map of the study area
Stratigraphically, (Fig. 2) shows the main stratigraphic units of the northern Western Desert of Egypt. Thicknesses of the encountered rocks in the north Western Desert increase towards the northeast, where four major sedimentary cycles occurred, with maximum and southward transgressions in Carboniferous, late Jurassic, Middle and Late Cretaceous, Middle Miocene and Pliocene times. Maximum and northward regressive phases occurred during the Permo-Triassic and Early Jurassic and continued till the Early Cretaceous, and again during the Late Eocene to Oligocene, with a final phase in late Miocene times. Source rocks of the north Western Desert are typically composed of shales accompanied with the transgression of the Upper Jurassic and Upper Cretaceous carbonates (Mekky et al. 2014). The Mesozoic source rocks include oil and gas-bearing formations, from the Jurassic (Khatatba Formation). Reservoir rocks are composed of sand and limestone belongs to Lower Cretaceous (Alam El Buieb Formation) and the Upper Cretaceous (Baharyia and Abu Roash formations) (Khaled 1999). Seal rocks are composed of shales, compact limestone of Jurassic, Cretaceous, Eocene, and Oligocene age The Khatatba and Alam El Bueib formations have their own internal seals. The shales of the Abu Roash “G” member represent the top seal above the Baharyia sandstone reservoir. Traps are mainly of the combined stratigraphic-structural traps (Abdel-Fattah et al. 2017). Early stage of hydrocarbon generation during Late Cretaceous for the AEB and Khatatba formations while hydrocarbons migrated Cretaceous source rocks after the Alpine tectonics (Waples 1997).

Generalized Lithostratigraphic column of Western Desert
1.2 Seismic data
The available geological and geophysical data for the present study consist of thirty 2D seismic sections, acquired by Khalda Company (KPC), from a 3D seismic cube covering Razzak field, and one check-shot survey, were used for seismic and well tie. In addition, the geologic data from five wells (ERZK-77X, ERZK-110, ERZK-15X, ERZK-100X and ERZK-98X) to establish the relationship between seismic reflections and stratigraphy (Bacon et al. 2007).
1.3 Seismic stratigraphic analysis
The seismic stratigraphic analysis technique allows to the recognition of lithofacies models from seismic sections, by studying the seismic reflection characteristics (Todd and Mitchum 1977). To approach great results from seismic stratigraphic analysis, first studying the seismic sequence regime, to identify the depositional cycles either regressive (shallowing and low stand deposits, as sandstone) or transgressive (deepening and high stand deposits, as limestone), in order to subdivide the studied section into stratigraphic sequences (Brown and Fisher 1977). Secondly, seismic facies comprises the identification of low reflection units within a sequence, which may be the seismic response to lithofacies of these units. However, the analysis of the stratigraphic sequences, using the seismic responses, to divide the studied sequence into major stratigraphic units, as coastal plain seismofacies, shelf seismofacies and slope seismofaices. Thirdly, the seismic reflection characteristics are used for differentiating the studied units into minor stratigraphic units, to define the depositional environments of the studied sections. Fourthly, geologic interpretation involves the integration of seismic sequence, faceis and reflection characteristics analysis in relation to geologic manifestations of mapple lateral and vertical intervals. Finally, prospect evaluation includes the application of acquired seismic stratigraphic deductions in the outlining and evaluation of source rocks, potential reservoirs, seal rocks and stratigraphic traps (Vail et.al. 1977).
1.4 Seismic refelction characteristics
The available seismic sections of the study area were analyzed, according to their seismic reflection characteristics, as well as the descriptive interpretation of the selected stratigraphic units, based on the seismic reflection characteristics, to demonstrate the internal configuration of individual seismic reflections and the external forms of the seismic facies units, to know the lithologic distributions and depositional environments of these stratigraphic units. To illustrate how the terminations and refection patterns on seismic sections might be used for stratigraphic evaluation,two seismic section were selected form the interpreted seismic lines to display the seismic reflection patterns characterizing the seismo-facies units,as well as, the vertical variations of these patterns from a unit to the other. These examples show the parallel-to sub-parallel layering characterizing unit 2 of the Abu-Roash Formation (Fig. 3), divergent and mounded features of unit 3 (Fig. 4).

Parallel and mounded features of seismic line 4800

Divergent features of seismic line 11000
The next step, after studying the terminations and different patterns of seismic reflection characteristics along the seismic sections, the seismic patterns of Baharyia Formation were posted into their seismic reflection characteristics map, to outline the lateral and aerial variations of these facies units, to predict afterward the time thickness maps of these stratigraphic units the lithological and environment of deposition. The seismic reflection map of unit of the Apollonia and Khoman Formations reveals parallel to sub-parallel reflections and divergent towards the northwest direction, the seismic reflection map of unit 2 of the Abu-Roash Formation show parallel to sub-parallel in the northeast, reflectors diverge towards south-southwest, the seismic refection map of Baharyia Formation exhibits the prevalence of parallel to sub-parallel reflections at the northeastern and Southeastern parts direction of the section. The seismic reflectors are nearly uniform with the upper and lower boundaries of AbuRoash and Alamein Formations, then the reflectors tend to diverge at the Southwest and Southeast (in the North and Northwestern parts) and South and Southwest (in the Southern Parts) Oblique in the North east, chaotic and sigmoidal in the east and Southeast parts, may be due to the irregular relief of the basin of deposition of the Baharyia Formation (Fig. 5).

Seismic reflection characteristics map of Bah. Fm
1.5 Time thickness maps
In order to enhance the stratigraphic analysis of the seismofaices units, we have to construct a time thickness map for the Baharyia Formation. This type of map is constructed by contouring the two-way time interval between each two successive boundaries. This will help in identification of the lithologic distrubtion and environmental conditions of the rock unit, as a function of variation of the time intervals and their influence on the prevailing seismic facies signatures. The time thickness map of Baharyia Formation manifest a time thickness variations from about 1–1.2 s, where the maximum isotime thickness is located at the northwestern and southwestern, that manifest with divergent, sigmoid and oblique reflection patterns. At the southeastern and northwestern parts, thicknesses are nearly uniform, coinciding with the parallel to sub-parallel reflection characteristics. The trend of thickening towards the northern direction, the time contours at the middle part of the map tend to be closer to each other, due to the presence of a geological structure as a fold or a fault Fig. 6

Time thickness map of Bah. Fm
1.6 Lithofacies distrubtion
In order to defining the lithological distribution and depositional environment of stratigraphic units, The seismic refection characteristics and stratigraphic geological information are combined together to define the lithological distribution and afterward exploration the conditions of depositional environment of such units this is acquired by matching between seismic reflection parameters of seismic facies units with the Lithostratigraphic column of the drilled wells and their locations within seismic lines then interpolation the obtained lithological information laterally along the seismic section in map view within each unit to outline the lithological distribution and depositional environment of seismic facies units of the study area The lithological distribution map of unit 3 shows the predominance of sandstone, siltstone, clay, and a limestone the depositional environment indicates shallow marine conditions (Fig. 7).

Lithological distrubtion map of Bah. Fm
1.7 Depostional environments
The incorporated study of the previous interpreted seismic reflection characteristics, thickness variations and lithofacies distrubtion leads to the deduction of the depositional environmental conditions that prevailed during the deposition of the seismofacies units. The depositional environments distribution map of the Baharyia Formation displays a wide variation form continental to littoral facies at the middle and northwestern and northeastern parts, littoral to outer neritic facies at the south, while outer facies lies towards the southwestern section (Fig. 8).

Seismofaices map of Bah. Fm

Seismic stratigraphic model of the study area
1.8 Seismic stratigraphic model
The final integrated evaluation of the lithofacies distrubtion, depositional environments and seismic reflection patterns produces a seismic stratigraphic model of the north western desert Fig. 9. This stratigraphic model starts southwardly by the gravels and sands of the delta plain, followed northwardly by the medium fine sands of the shelf margin and delta front, then the clays of the prodelta and the shale of the seaslope, finally the limestone of the open sea basin.
1.9 Seismic structural interpretation
The available seismic sections are used for evaluating the structural setting of the Razzak field. The present study is mainly based on thirty seismic lines selected to delineate the subsurface structure, as aided by five wells (ERZK-110, ERZK-15, ERZK-18, ERZK-100 and ERZK-77) (Fig. 1).
1.10 Structural cross sections
The interpreted seismic sections of the studied area are of six main horizons (Apollonia, AR–C, AR-G, Baharyia, Alamein and Masajid Formations) and the fault framework shows two main trends. The first trend related to Jurassic rifting (NNE-SSW) is of Late Paleozoic rifting and the second trend (NW–SE) is of Tertiary tectonics, while the Jurassic and Cretaceous faults are of (NE-SW) trend (Abu El-Ata 1988) (Figs. 10 and 11).

E–W seismic line direction

N–S seismic line direction
1.11 Structure contour maps
Several two-way time (TWT) seismic contour maps have been constructed on the tops of Apollonia Formation, Abu-Roash Formation Baharyia Formation, and Alamein Dolomite Formation, these maps are clarified in Figs. 12, 13, 14, 15, to illustrate the structural elements affected the Razzak field. The TWT maps illustrate NNE-SSW faults related to Late Paleozoic rifting and the NW–SE faults trend related to Early Cretaceous -Late Tertiary. Structural inversion related folding is clear in the Cretaceous rocks of the Baharyia and Abu-Roash Formation and Eocene rocks of Apollonia and Khoman and the Jurassic rocks are generally unfolded. This indicated that basin inversion happened by the compressional forces, leading to the presence of reverse faults in the Late Cretaceous-Early Tertiary time, these reverse faults may reflect apparent reversing, due to sharing of strike-slip faults (Abu El-Ata 1989).

Apollonia time contour map

AR/G time contour map

Baharyia time contour map

Alamein time contour map

Average velocity map of Apollonia. Fm

Average velocity map of AR/G. Fm

Average velocity map of Bah. Fm

Average velocity map of Alamien. Fm
The time maps and faults polygons must be converted into depth domain using the average velocity maps of Apollonia, Abu-Roash Baharyia and Alamein. Each depth map of a specific formation is conducted, using its own velocity maps, this is to determine the velocity conversion that calculated and represented formerly in Figs. 16, 17, 18 and 19.
The depth structure contour map of the Alamien, Baharyia and Abu-Roash Formations shows WNW-ESE trending normal faults Figs. 21, 22 and 23. The structure type is a three-way dip closure, also termed faulted anticline dissected by normal faults of NW–SE trend, that are downthrown to southeast direction, NE–SW trend is most probably synchronous with the lower part of the Alpine orogeny, that produced the Syrian arc system folding and dip-slip faulting during the Middle Mesozoic to the Late Mesozoic (Abu-El Ata 1988), depth contour map of Apollonia Formation reveals only the NW–SE trend (Fig. 20).

Depth contour map of Apollonia Fm

Depth contour map of AR/G. Fm

Depth contour map of Bah. Fm

Depth contour map of Alamein Fm
1.12 Structural modeling
The method used for structural modeling in the Petrel software 2015 is the corner point gridding. The inputs for this technique are the data provided from the seismic interpretation (horizon maps and fault sticks in the depth domain) and well tops. The faults form the basis for the models, where layers are truncated along these faults. A set of pillars is created along faults and across wells, these pillars form the corner of each grid cell. Horizons are the depth maps interpreted from seismic lines and are inserted into the model. Apollonia, Abu-Roash, Baharyia and Alamein were inserted as horizons. Zones were created from well tops and inserted conformably with the previously generated horizons. These zones were further subdivided into layers with equal thicknesses. The final structural model includes faults, horizons, and zones generated from well tops (Fig. 24).

3D Depth structural model showing surfaces, faults, zones, and layers
1.13 Seismic attributes
Seismic attribute is a quantity extracted or derived from the seismic data that can be analyzed, in order to enhance information that might be more subtle in seismic image, leading to a better geological or geophysical interpretation. Examples of the seismic attributes can include measured time, amplitude, frequency and attenuation. Most of the seismic attributes are post-stack, and can be classified into structural and stratigraphic attributes.
1.14 Structural attributes
-
1.
Root Mean Square:
The root-mean-square amplitude attribute can be used for the identification of prospective zones. Detecting amplitude variations for channels with density changes to the surround. Classical attribute for bright spot detection. Fig. 25 shows the structural elements (fold and faults) characterizing the study area and their trends
Fig. 25 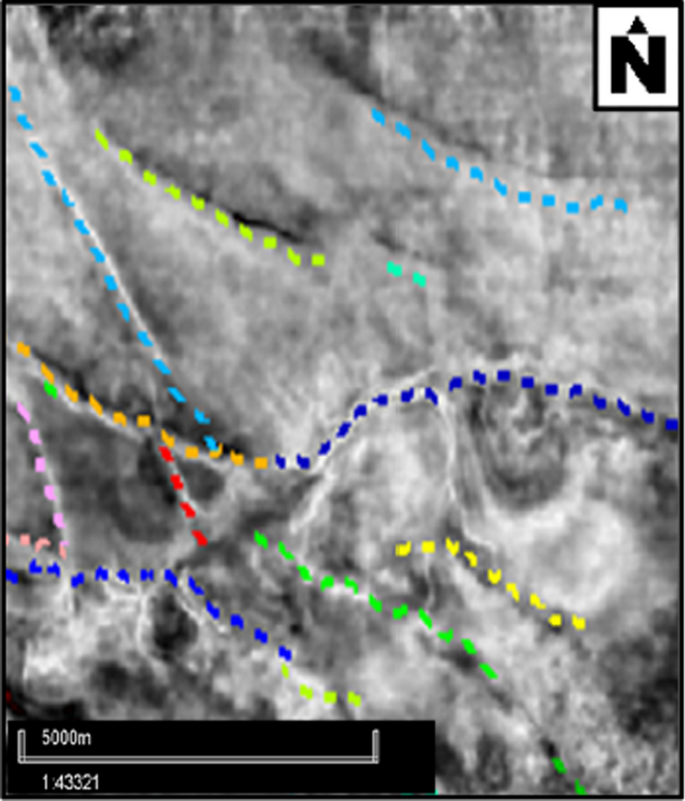
RMS amplitude attribute map
-
2.
Local Structural Dip:
Changes in dip are used to interpret faults. The difference between Dip and RMS dip are also utilized to detect faults. Combination of the amplitude, dip and azimuth is used to identify the stratigraphic features, and quantitatively estimate onlap, offlap, conformity, angular unconformities and the other components of seismic stratigraphy (Chopra and Marfurt 2007). Vertical changes in dip may highlight stratigraphic terminations. Fig. 26 exhibits the linear structural elements as faults, that oriented NW-SW across the study area.
Fig. 26 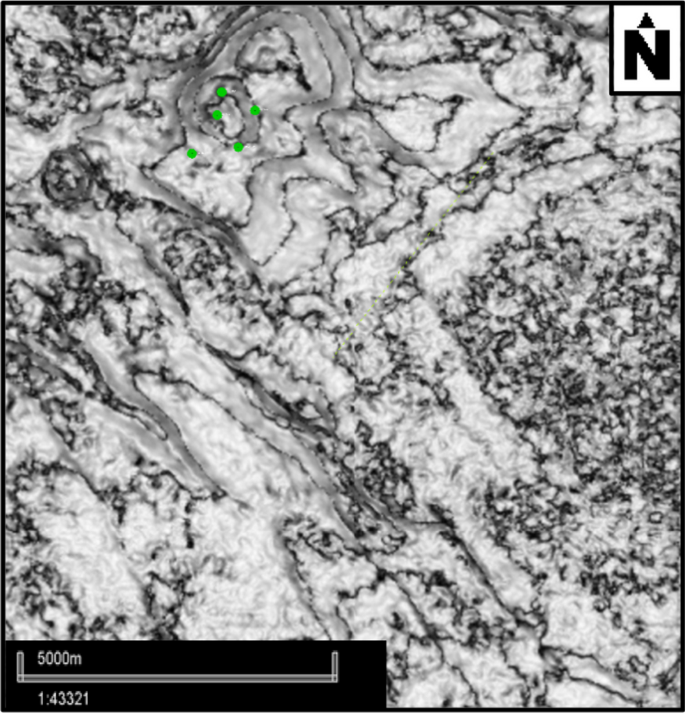
Local structural dip attribute map
-
3.
Ant-Tracking:
It reveals discontinuities in the seismic data useful for structural and stratigraphic terminations. Fault detection, from continuous variance response, can discriminate between the low and high continuity of seismic reflections, delineate laterally continuous discontinuities as fault attribute enhancement and fault extraction. Fig. 27 reveals the faults clustering especially at the central, northern, eastern and southern parts of the considered area.
Fig. 27 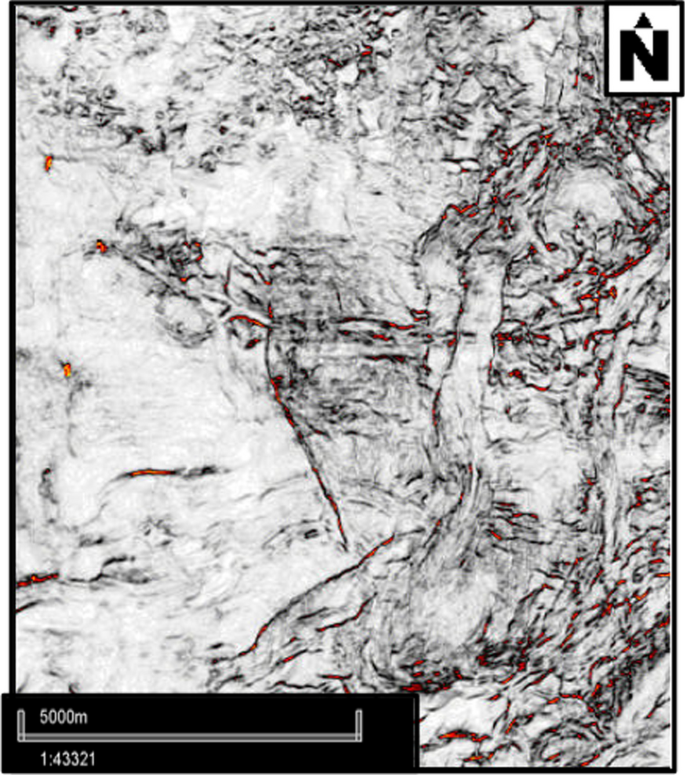
Variance attribute map


1.15 Stratigraphic attributes
-
1.
IsoFrequency component:
It is the time derivative of the phase bed thickness indicator and can detect lateral changes in lithology. Laterally increasing instantaneous frequency can indicate bed thinning or pinch outs, also can be a rock property indicator and hydrocarbon indicator by low frequency anomaly. Fig. 28 reflects the syn-depositional alignments associated with the syn-tectonic orientation of the linear structural elements toward NW–SE.

Iso frequency component attribute map
-
2.
Sweetness
It is a classical attribute for hydrocarbon sand detection can be used for channel development, especially when channels appear as sand bodies in shale. Fig. 29 illustrates the NW-SE preferred channel elements across the concerned area, with their terminal sand lobes through the turbiditie zone.

Sweetness attribute map
-
3.
Relative Acoustic Impedance
It is a physical attribute that reflects geometrical property contrast of the stratigraphic layering. High contrast indicates possible sequence boundaries and reveals the unconformity surfaces. Also it provides better tie to lithology and can be related to porosity, as differentiating between the tight shaly rocks and good porosity limestone. Figure 30 represents the lithologic boundaries of the rock types constituting the boundaries, as clays imprinted by the wedging sand canyons operated in the NE–SW and bifurcated by the NW–SE features.

Acoustic impedance attribute map
1.16 Geologic causatives
The previous mentioned dispersive interpretation, as deduced from seismic refection characteristics, can be used to describe the geological causatives of the area, these patterns are formed due to geological events happened to form these reflection characteristics. The lithological distrubtion of the lower Cenomanian Baharyia Formation consists of wide fluvial channel sandstones and shallow marine to neritic shales with minor limestone streaks (Ezzat et al. 1998). Facies varies from continental to fluviomarine conditions. The seismic refection characteristics of Baharyia Formation reveals parallel to subparallel layering reflecting the continental facies, the divergent patterns related to the presence of shales with littoral facies, during the late Cenomanian, the Baharyia Formation, deposited in a transgressive coastal setting. The Baharyia depocentre trends WNW-ESE, probably related to Early Cretaceous-Late Tertiary During the Late Cretaceous, and especially during the Late Senonian, the tectonic regime changed to one of NW–SE compression forming reverse faults in the Late Cretaceous-Early Tertiary time, these reverse faults may reflect apparent reversing, due to sharing of strike-slip faults (Abu El-Ata 1989), related to the transcurrent movements between Africa and Eurasia during the opening of the North Atlantic (Bayoumi et al. 1987). This caused the WNW–ESE normal faults to be reactivated by dextral strike-slip and also led to the formation of three NE–SW anticlines related to Syrian arc system (Moustafa 1988). Finally, after integration of the lithofacies distrubtion, depositional environments and structural elements produces a geologic model of the study area in the north Western Desert, this geologic model manifest structural elements affecting the study area and it starts southwardly with gravel and coarse sands of the delta plain represented by Baharyia Formation, followed northwardly with fine sands of the shelf margin and delta front, then the clays of the prodelta and the shales of the sea slope elucidated by Abu-Roash Formation, finally the limestone of the open sea demonstrated by Apollonia and Alamien Formation (Fig. 31).

Geological model of the study area
2 Summary and conclusions
The stratigraphic section of the study area is subdivided into four seismo-facies from top to bottom units of varying parameters. These units are comparable to Apollonia and Khoman Formations; Abu-Roash Formation; Baharyia Formation; Alamein Formation. The seismo-facies unit 1 reveals parallel to sub-parallel layering, unit 2 shows divergent layering, unit 3 reveals chaotic and oblique layering, unit 4 shows variation from parallel-subparallel orientation to oblique and chaotic. Moreover, the time thickness of these seismo-facies units 1, 2 and 4 increased gradually northwards; increases northeast and southwest parts in unit 3. The lithofacies distribution includes limestone with minor clay intercalations in unit 1; carbonate, sandstone occurs with minor portion and laterally graded into shale in unit 2; sand and shale with minor limestone streaks in unit 3; dolomitic limestone with minor streaks of limestone in unit 4.The depositional environments of these seismo-facies units are middle neritic graded to outer neritic in unit 1; littoral facies graded to inner and middle neritic facies in unit 2; continental to inner-middle neritic in unit 3; middle neritic facies to outer neritic and bathyal in unit 4. Then, a seismic stratigraphic model is constructed of the study area of the north Western Desert. The structural analysis of the study area was done through interpreted seismic sections of six main horizons (Apollonia, AR-C, AR-G, Baharyia, Alamein and Masajid Formations), seismic contour maps have been constructed on the tops of Apollonia Formation, Abu-Roash Formation Baharyia Formation, and Alamein Dolomite Formation in terms of two way time and depth obtained from velocity conversion, the contour maps illustrate NNE-SSW faults related to Late Paleozoic rifting and the NW–SE faults trend related to Early Cretaceous -Late Tertiary, contour map of the Alamien, Baharyia and Abu-Roash Formations shows WNW-ESE trending normal faults, the structure type is a three-way dip closure, also termed faulted anticline dissected by normal faults of NW–SE trend, that are downthrown to southeast direction, NE-SW trend is most probably synchronous with the lower part of the Alpine orogeny, that produced the Syrian arc system folding and dip-slip faulting during the Middle Mesozoic to the Late Mesozoic, contour map of the Apollonia Formation reveals only the NW–SE trend. Then, a structural model is performed of the study area to show the distribution of structural elements all over the study area. Also, seismic attributes technique was applied to enhance information that might be subtle in seismic imaging leading to better geological and geophysical interpretation, several types of seismic attributes were performed both structural and stratigraphic as: Root mean square detecting amplitude variations for channels with density changes to the surround, local structural dip utilized to detect faults and stratigraphic terminations, Ant-tracking reveals discontinuities in the seismic data useful for structural and stratigraphic terminations, Sweetness for hydrocarbon sand detection can be used for channel development and Relative acoustic impedance reflects geometrical property contrast of the stratigraphic layering. Finally after integration stratigraphic and structural analysis with seismic attribute, a geologic model established for the study area of the north Western Desert.
References
Abdelaal A, Moustafa AR (1988) Structural framework of the Abu El Gharadig basin, Western Desert, Egypt. In: Proc. 911' E.G.P.C. Petrol. Explor. & Prod. Conf, 2, 23–50
Abu El Naga M (1984) Paleozoic and Mesozoic depocenters and hydrocarbon generating areas, northern Western Desert 8. Paper presented at the 7th Petroleum and Exploration Seminar, EGPC, Cairo
Abu El-Ata (1988) The relation between the local tectonics of Egypt and plate tectonics of the surrounding regions, Using Geophysical and Geological Data. EGS Proceedings of the 6th Annual Meeting, Cairo, pp 92–112
Bayoumi AI, Darwish YA, Lotfy HL (1987) Acoustic characteristics of Abu Gharadig Basin sediments, Western Desert. Egypt J Afr Earth Sci 4:399–405
Bosworth W (1994) A model for the three-dimensional evolution of continental rift basins, north–east Africa. Geol Rundsch 83:671–688
Brown LF Jr, Fisher WL (1977) Seismic stratigraphic interpretation of depositional systems, examples of Brazilian relief and pull-apart basins. AAPG Mem 26:213–248
Brown AR (2004) Interpretation of three- dimensional seismic data, AAPG Memoir 42, SEG Investigation in Geophysics, No. 9
El-Ata A (1989) The potential of seismio facies and seismic stratigraphy in define lithofacies and depositional styles of the west of Cairo area, western desert Egypt, Middle East Res. Center, v 3:1–19
El Shaarawy OA, Abdel Aal A, Papazis P (1992) Tectonic setting of the Razzak oil field, north Western Desert of Egypt. In: Proc. 11"' E. G.P. C. Petrol. Explon: & Prod Conf., 2, pp 310–323
Moustafa AR (1988) Wrench tectonics in the north Western Desert of Egypt (Abu Roash area, southwest of Cairo). Middle East Res. Cent., Ain Shams Univ. Earth Sci Ser 2:1–16
Mitchum V (1977) Seismic signatures of sedimentation models. Geophysics 37:45–58
Salem R (1976) Evolution of eocene-miocene sedimentation patterns in parts of Northern Egypt. Bull Am Assoc Petrol Geol 60:34–64
Sangree JB, Widmier JM (1975) Interpretation of depositional facies from seismic data (abs.). Geophysics 40:142
Vail PR, Thompson S (1977) Relative change of sea level overview. AAPG Mem 26:63–82
Funding
Open access funding provided by The Science, Technology & Innovation Funding Authority (STDF) in cooperation with The Egyptian Knowledge Bank (EKB).
Author information
Authors and Affiliations
Corresponding author
Ethics declarations
Competing interests
The authors declare that they have no known competing financial interests or personal relationships that could have appeared to influence the work reported in this paper.
Additional information
Publisher's Note
Springer Nature remains neutral with regard to jurisdictional claims in published maps and institutional affiliations.
Rights and permissions
Open Access This article is licensed under a Creative Commons Attribution 4.0 International License, which permits use, sharing, adaptation, distribution and reproduction in any medium or format, as long as you give appropriate credit to the original author(s) and the source, provide a link to the Creative Commons licence, and indicate if changes were made. The images or other third party material in this article are included in the article's Creative Commons licence, unless indicated otherwise in a credit line to the material. If material is not included in the article's Creative Commons licence and your intended use is not permitted by statutory regulation or exceeds the permitted use, you will need to obtain permission directly from the copyright holder. To view a copy of this licence, visit http://creativecommons.org/licenses/by/4.0/.
About this article

Cite this article
Metwally, M.M., El-Ata, A.S.A.A. Geologic causatives of the stratigraphic and structural heterogeneties of Baharyia formation, based on their seismic interpretation, Razzak field, Western Desert, Egypt. Geomech. Geophys. Geo-energ. Geo-resour. 10, 40 (2024). https://doi.org/10.1007/s40948-023-00695-0
Received:
Accepted:
Published:
DOI: https://doi.org/10.1007/s40948-023-00695-0