


Abstract
We analyze the polarization observations of the Didymos–Dimorphos system before and after the impact by the NASA Double Asteroid Redirection Test spacecraft on Dimorphos. We fit empirical polarization phase curve models and statistically confirm the discovery by Gray et al. about the degree of linear polarization of the system decreasing on the impact and remaining altered for at least 30 days post-impact. With numerical simulations of particles in the geometric optics domain, we estimate the dominant size of the particles either in the regolith of Didymos and Dimorphos or in the impact-driven ejecta cloud to be several hundred micrometers. The observed change between the pre-impact and post-impact systems indicates either a decrease in average particle size of some tens of micrometers or a decreased level of space weathering.
Export citation and abstract BibTeX RIS

Original content from this work may be used under the terms of the Creative Commons Attribution 4.0 licence. Any further distribution of this work must maintain attribution to the author(s) and the title of the work, journal citation and DOI.
1. Introduction
The NASA Double Asteroid Redirection Test (DART) impacted the smaller component, Dimorphos, of the Didymos binary system on 2022 September 26 (Daly et al. 2023). The planetary defense test successfully and clearly changed the orbit of Dimorphos around Didymos with a kinetic impact (Thomas et al. 2023). The impact caused dust and boulders to be ejected from the target, forming an ejecta cloud and tail for the system (Li et al. 2023). The system was extensively observed pre-impact and post-impact by both ground- and space-based observatories and the LICIACube spacecraft (see, e.g., de León et al. 2010; Opitom et al. 2023; Moskovitz et al. 2023; Dotto et al. 2023).
The polarimetric behavior and the degree of linear polarization (DoLP) of the system was observed with one of the units of ESO's Very Large Telescope (VLT) in Chile (Bagnulo et al. 2023; Gray et al. 2024) and the Nordic Optical Telescope (NOT) in the Canary Islands, Spain (Gray et al. 2024). Polarimetry is independent of the absolute flux levels since it is a ratio of differences and sums of fluxes, making it a very efficient method to probe the properties of the surface regolith on the bodies and the dust in the ejecta tail.
In this article, we summarize the polarimetric data and present the statistical assessment of the polarimetric phase curve and the modeling methods that combine geometric optics and radiative transfer in Section 2. We present our results in Section 3, where we demonstrate how the statistical polarization phase curve modeling can find different properties for the pre-impact and post-impact DoLP and how linking this to light-scattering simulations can be used to derive information on the particle sizes in the system. We also show how the post-impact results indicate either smaller or brighter particles being exposed. Finally, in Section 4, we discuss the implications, especially the possibility that the polarization data show less space-weathered particles in the system post-impact.
2. Observations and Methods
2.1. Observational Data
The polarization observations of the Didymos system were done using both VLT and NOT. With VLT, the Focal reducer/low dispersion spectrograph 2 (FORS2) instrument was used in both imaging polarimetric (IPOL) and spectropolarimetric (PMOS) modes, and the Alhambra Faint Object Spectrograph and Camera (ALFOSC) instrument was used in imaging polarimetric mode with the NOT. Observations were done over a time span of 153 days, starting from 2022 August 19 and ending on 2023 January 19. The DART spacecraft impacted Dimorphos on 2022 September 26, so our observations span from 39 days pre-impact to 114 days post-impact.
The observations are published in depth in Bagnulo et al. (2023) and Gray et al. (2024); please consult those for details. All the observational data used in this article are available in Gray et al. (2024). Four filters were used (B, V, R, I) with the VLT observations, and two (B, R) were used with the NOT. The numbers of observations per filter are 40 (B), 14 (V), 43 (R), and 15 (I). Since the B and R filters have the majority of the observations, we decided to use only these in our analysis. Please see a graphical presentation of the observations with different filters on the timeline in Figure 1.
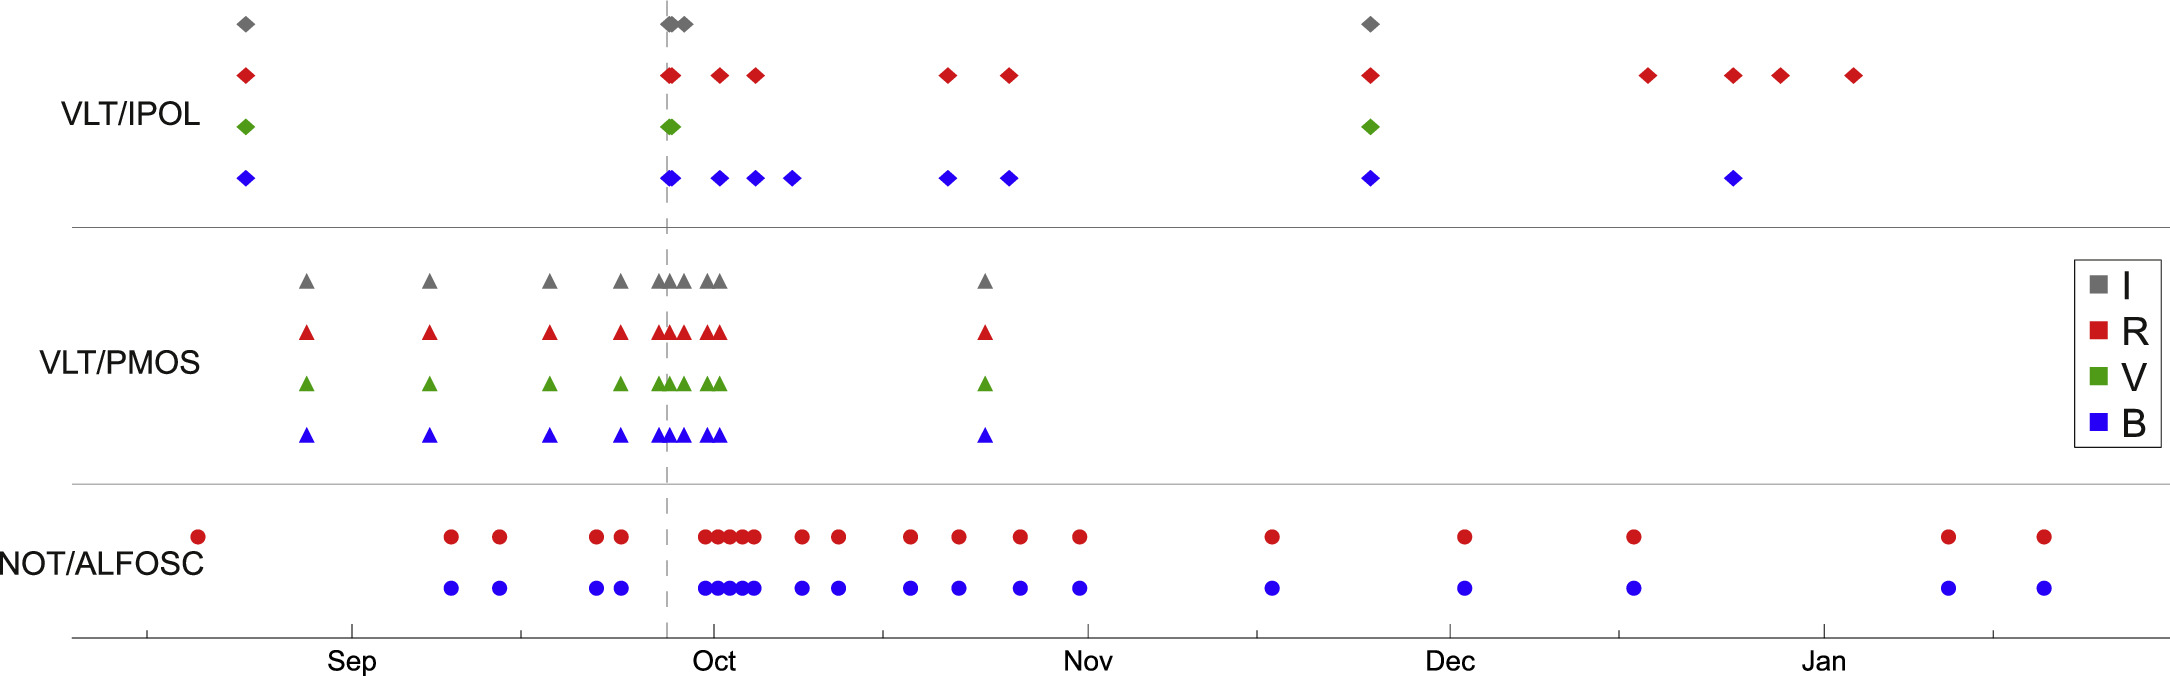
Figure 1. Timeline of the VLT and NOT polarimetric observations of the Didymos system starting on 2022 August 19 and ending on 2023 January 19.
Download figure:
Standard image High-resolution imageRegarding phase angle, the angle between the Sun and the telescope as seen from the target, the observations span between 6 55 and 7634. This means that the observations cover the so-called negative polarization branch, the inversion angle where the phase curve turns from negative to positive, and the start of the positive polarization branch for typical asteroid polarization phase curves.
2.2. Polarization Phase Curve Model
We use the so-called trigonometric function to model the continuous polarization phase curve, i.e., the DoLP (P) as a function of the phase angle (Lumme & Muinonen 1993; Penttilä et al. 2005). The model is of the form

where b, c1, c2, and α0 are parameters to be fitted. The parameter α0 is the inversion angle, b controls the amplitude of the curve, and c1 and c2 control the shape. One benefit of this model over other empirical polarization phase curve models is that the trigonometric function is designed to meet the physical constraints of zero DoLP at both α = 0° and 180°. Therefore, it is a more reliable model when extrapolating values outside the observed phase angles.
For statistical analysis between polarization phase curve models with different numbers of free parameters, we use the Bayesian information criterion (BIC). BIC can be defined with

where n is the number of observations, p the number of fitted parameters, and SSE the sum of squared errors of the model. Smaller values of BIC indicate better models. Small SSE will result in small BIC, but large values of p, i.e., many free parameters in the model, penalize by increasing the BIC value. The trigonometric model itself is fitted to data using nonlinear least-squares minimization.
2.3. Particle Shape Model
We will derive physical properties of the regolith and the ejecta particles in the Didymos system using geometric optics and radiative transfer light-scattering simulations (see the next section). These simulations need a shape model for the particles in the regolith and the ejecta, while the other parameters (size and the complex refractive index of the material) are varied and then inferred by comparing the simulation results and the observations. We choose to model the particles with so-called random Voronoi polyhedra. The modeled particles are formed through an algorithmic procedure. First, a spherical volume is filled with a number of seed points, which are randomly distributed into the volume. Second, a Voronoi division is computed around the seed points. A Voronoi cell or particle for a specific seed point is defined by the volume where any point is closer to that specific seed point than any other seed point. The definition leads to polyhedral particles. The particles close to the surface of the original spherical volume might have no closing faces, so only particles from the middle parts of the spherical volume are included in the final sample.
All the sampled particles are normalized to have a volume of  so that their volume-equivalent sphere radius is 1 and can later be scaled to any value. An example of Voronoi particle shapes is shown in Figure 2.
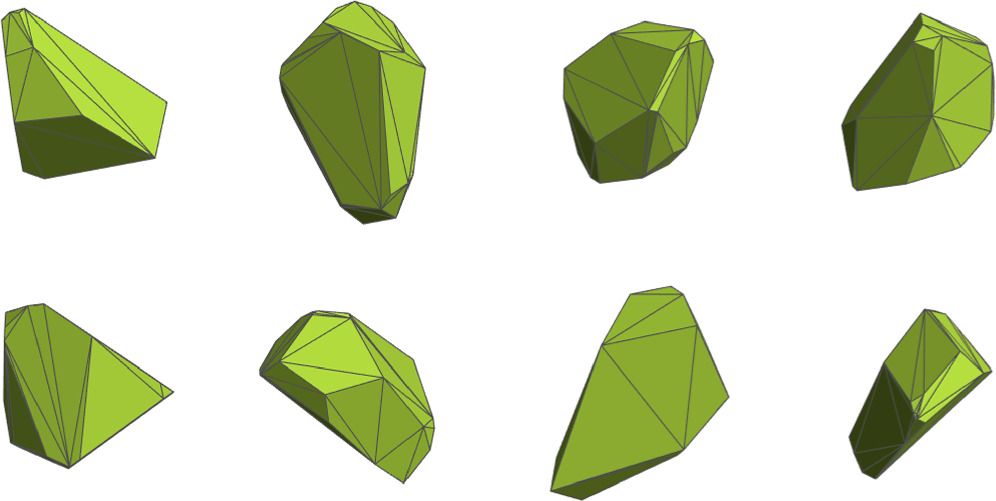
Figure 2. Eight example particle shapes from a random Voronoi polyhedral model.
Download figure:
Standard image High-resolution image2.4. Light-scattering Simulations
We use light-scattering simulations to derive the DoLP of the modeled Didymos system to be compared to observations. Reflected light in visual wavelengths for Didymos comes either from the particles in the very surface of the Didymos and Dimorphos (pre-impact) or partly also from the particles in the ejecta cloud around the system (post-impact). Therefore, we model the system as an optically thick cloud of particles. In this work, the geometric shape of the ejecta cloud and the binary geometry of the bodies are not taken into account, but a spherical and optically thick cloud of particles is used. Further, the particles are assumed to be optically large, that is, have sizes much larger than the wavelength of light. In practice, this means particles with a diameter of tens of micrometers and above. The reason for using large particles is given in Section 3.2.1.
The simulations are done using two codes, SIRIS4 (Muinonen et al. 2009; Lindqvist et al. 2018) and radiative transfer and coherent backscattering (RT-CB; Muinonen 2004) codes; see, e.g., Penttilä et al. (2020) for previous work with a similar work flow. The single-scattering properties, i.e., the single-scattering albedo and the scattering matrix, of an individual grain are simulated using SIRIS4. The input parameters are the shape of the particle, where a collection of 30 random Voronoi shapes are used; size in terms of size parameter x; and complex refractive index m. The size parameter is defined as  , where r is the particle radius (volume-equivalent sphere radius) and λ is the wavelength. Complex m is m = n + ik, where n is the real refractive index and k is the imaginary part.
The output of the single-scattering simulations is averaged over the 30 shape samples and fed to RT-CB simulation of a practically infinitely large and optically thick spherical volume of particles. Since the input scattering matrices come from a geometric optics simulation, they do not include phase information of the wave, so the CB part of the code is not used. The output of the RT simulation is the scattering matrix
M
of the system as a function of phase angle α. From the scattering matrix, the DoLP can be computed as ![$P(\alpha )=-\tfrac{{\left[{\boldsymbol{M}}\right]}_{21}}{{\left[{\boldsymbol{M}}\right]}_{11}}$](https://content.cld.iop.org/journals/2632-3338/5/1/27/revision1/psjad1757ieqn3.gif) .
.
We run the simulations in a regular grid with input parameters x, n, and k. The real part n has values 1.25, 1.5, 1.75, and 2, but k and x have values equally spaced in log10-space:  , and
, and  . For B and R filters, the size parameters map to particle diameters from about 1.4 to 700 μm. The simulation results include the whole scattering matrix of the system as a function of phase angle, but we only need certain elements to compare to our polarization observations. As a diagnostic feature in polarization, we select the maximum value
  of the polarization phase curve P(α). We can extract the maximum value from both the simulations and the observations fitted with the trigonometric polarization phase curve model.
The simulations show interesting trends that allow us to simplify many result features. Within this RT framework, features such as the integrated scattered intensity and the polarization maximum depend on x and k together as  , that is, the size and the imaginary part of the refractive index have similar effects, especially when combined in log-scale (Muinonen et al. 1996). The real part n, however, has only a minor effect. We fixed n = 1.6, a typical value for olivine and asteroid material having abundant olivine, and were able to successfully fit a smooth regression spline to
  data.
data.
3. Results
3.1. Didymos System Polarization before and after the DART Impact
The polarization observations of the Didymos system in the B and R filters are shown in Figure 3, together with the best-fitted models. With the continuous phase curve model, we can inspect the observations both as a function of phase angle and as a function of time and compare between different subsets, such as pre- and post-impact observations. As noted already in Bagnulo et al. (2023) and Gray et al. (2024), there is a drop in DoLP at the time of the DART impact, and the effect lasts at least some tens of days after the impact. In what follows, we verify this statistically and model the  data for pre- and post-impact cases and for B and R filters.

Figure 3. The DoLP observations of the Didymos system in B and R filters, and the fitted trigonometric DoLP phase curve model. The dependence is plotted as a function of phase angle (top row) and time (bottom row), expressed in days after the DART impact. The pre- and post-impact data have been fitted with separate models.
Download figure:
Standard image High-resolution imageThe differences in the DoLP phase curves are verified by comparing BIC values for different models. By fitting one model Pm
(α) to all data, we can first conclude that parameter c2 in the model can be almost 0, meaning that the part  can be approximately 1. This is typical for the trigonometric model we have used, since this part describes behavior close to maximum, and often there is a lack of data supporting a confident estimation of c2. The fitted parameter values and the BIC value for this model and all the other models mentioned in this section are listed in Appendix A.1. This model is referred as "m0."
Second, we compare models where the filters B and R are fitted either separately (m1) or jointly having shared c1 and α0 parameters (m2). The BIC analysis shows that the best model is the one where both filters have different amplitudes (parameter b) but shared shape of the curve (c1 and α0 parameters).
Third, we check that the three different observing instruments (NOT/ALFOSC and VLT in IPOL and PMOS modes) are not producing statistically different data. We compare BIC values between one model (m0), three models with different amplitudes but shared shape parameters (m3), and three completely different models (m4). The results indicate that the one joint model between all the instruments performs best, so there is no difference between the instruments.
Lastly, we get to the interesting part when comparing models that separate pre- and post-impact data (m5–m8). Here the result is that the model where pre- and post-impact data have fitted b and α0 parameters separately (m7) outperforms all the other combinations, including the one where they are fitted with a single model. Therefore, we can conclude that the pre- and post-impact polarization is (statistically) different, and that difference shows in the Pm model in different magnitude (b) and inversion angle (α0) parameters for pre- and post-impact models, but the shape parameter c1 is better shared.
In Figure 3 we show the best models, i.e., model m7 with separate and joined parameters resulting in four different models for (i) filter B and pre-impact, (ii) filter R and pre-impact, (iii) filter B and post-impact, and (iv) filter R and post-impact; see Appendix
The polarization properties of the final fitted models, that is, the angles of minimum and maximum polarization  and
and  , the inversion angle α0, the values of minimum and maximum polarization
  and
and  , and the slope of polarization at inversion h, are shown in Tables 1 and 2. These values compress our observational data. We find especially the
  values interesting; large phase angles are present in both pre- and post-impact observations, the model selection suggests differences between both colors (
 ) and times (
 ), the differences are the largest in large phase angles, and the RT simulation without the CB component is accurate with large phase angles, but not so much with small phase angles, where CB would have a significant effect. For all these reasons, we will base our analysis on the Didymos system particles on these four differences shown in Table 2.
Table 1. Properties of the Final Phase Curve Models for the DoLP Observations, Apart from Maximum Polarization, Which Is Shown in Table 2
| α0 (deg) |
 (deg) (deg) |
 (deg) (deg) |
 (%) (%) | Slope (%/deg) | |||
|---|---|---|---|---|---|---|---|
| B | R | B | R | ||||
| Pre | 19.68 | 8.37 | 101.31 | −0.55 | −0.44 | 0.090 | 0.073 |
| Post | 22.56 | 9.60 | 102.96 | −0.65 | −0.55 | 0.094 | 0.078 |
Download table as: ASCIITypeset image
Table 2. The Maximum DoLP Values in the Models Fitted to Observations, and Their Differences between Colors (Filters B and R; Δc ) and Time (Pre-impact and Post-impact; Δt )
 (%) (%) | |||
|---|---|---|---|
| B | R | Δc | |
| Pre | 11.21 | 9.03 | −2.18 |
| Post | 10.50 | 8.77 | −1.73 |
| Δt | −0.71 | −0.26 | |
Download table as: ASCIITypeset image
3.2. Particle Properties Derived from Polarization Observations
3.2.1. Polarization Mechanism with Optically Large Particles
The polarization properties of the Didymos system show signs of optically large particles dominating the polarization behavior. There are two indications of this. First, the angle of polarization maximum is shifted from the 90° value, typical for Rayleigh scattering from optically small particles, toward larger values above 100° (Muñoz et al. 2021; Escobar-Cerezo et al. 2018; Frattin et al. 2022). Second, the observed behavior of the DoLP maximum value decreasing with increasing wavelength (filters B and R) supports large particles (Dabrowska et al. 2015). In the geometric optics domain, the DoLP is decreased when there are more reflections from the vacuum−particle boundaries, since this is where the polarization state is changed and therefore randomized toward zero DoLP. The absorption of the light happens in the volume of the particles. When the same enclosing space is hosting a material volume that is divided into larger or smaller particles, the one with smaller particles will have more boundaries between material and vacuum, therefore introducing more randomized DoLP (Sorensen 2001).
The mechanism of decreasing DoLP can be resulting from either decreasing size parameter of particles or decreasing imaginary part k of the material refractive index, since the latter also increases the boundary reflections by decreasing absorption in the material. The size parameter can decrease if either the particle size is decreased or the wavelength is increased. The same mechanism that decreases polarization will simultaneously increase brightness for the same reason, increased surface reflections versus volume absorption. In our simulations (Section 2.4) we can verify this in all cases. Other verification comes from, e.g., the Amsterdam-Granada Light Scattering Database 7 measurements of olivine (Muñoz et al. 2000) and the Catalogue of Asteroid Polarization Curves; 8 see Figure 4. In Granada measurements, the "L" and "XL" size fractions of olivine are sieved to contain only large particles, 20–65 μm for "L" and 65–125 μm for "XL" in diameter, and maximum polarization is decreased from 7.6% to 7.5% (at 442 nm) and from 9.1% to 8.8% (at 633 nm) when moving from "XL" to smaller "L." In the asteroid polarization catalog it is clearly seen how brighter objects such as S-type asteroids, with material absorption k being smaller than with C-type asteroids, have much more neutral polarization. From Figure 4, one can further observer how polarization observations confirm the Didymos system being an S-type object, as concluded also by de León et al. (2010), Bagnulo et al. (2023), Gray et al. (2024), and Lin et al. (2023).
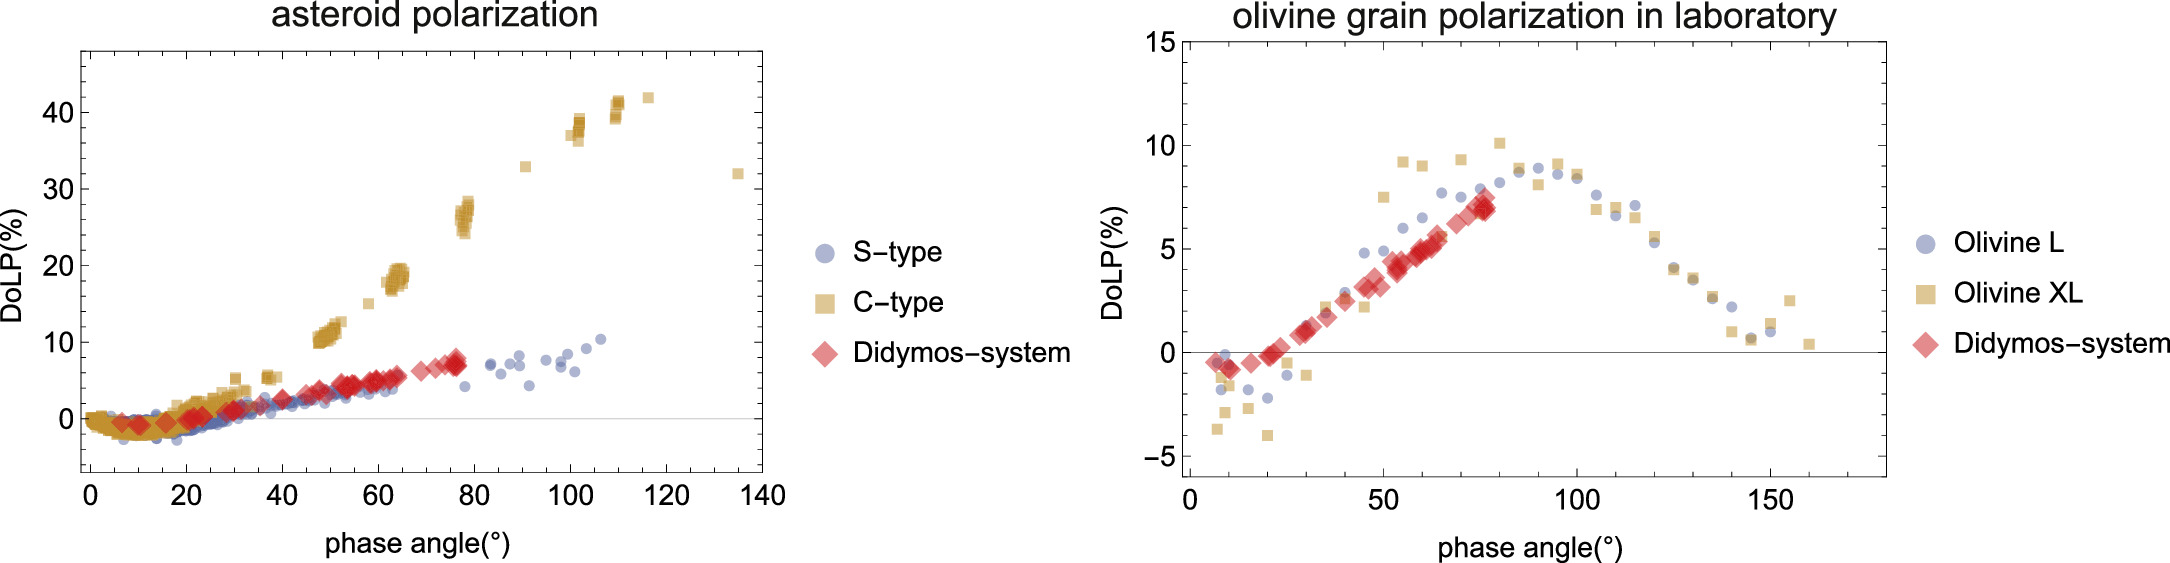
Figure 4. Examples of observed DoLP for the Didymos system with S- and C-type asteroids from the Catalogue of Asteroid Polarization Curves (left) and with two size fractions of olivine particles from the Amsterdam-Granada Light Scattering Database (right).
Download figure:
Standard image High-resolution image3.2.2. Derived Properties of Particles in the Didymos System
We will derive the properties of the particles dominating the polarization signal of the Didymos system by looking at the  values (8.77%–11.21%) and their differences between the colors (−1.73 and −2.18 percentage points (p.p.)). We can inspect these values with respect to our simulation results. In Figure 5, the simulated
  and Δc
values are visualized with density plots having x and k as the axis, in log-scale. If we take the observed
and Δc
values are visualized with density plots having x and k as the axis, in log-scale. If we take the observed  values roughly between 8% and 12%, we can find an area of suitable (x,k) value pairs. As seen in Figure 6, the area is a wide line from the upper left, that is,
  around −2 and
  at 1, to lower right,
  around −4.4 and
  at 3.5.
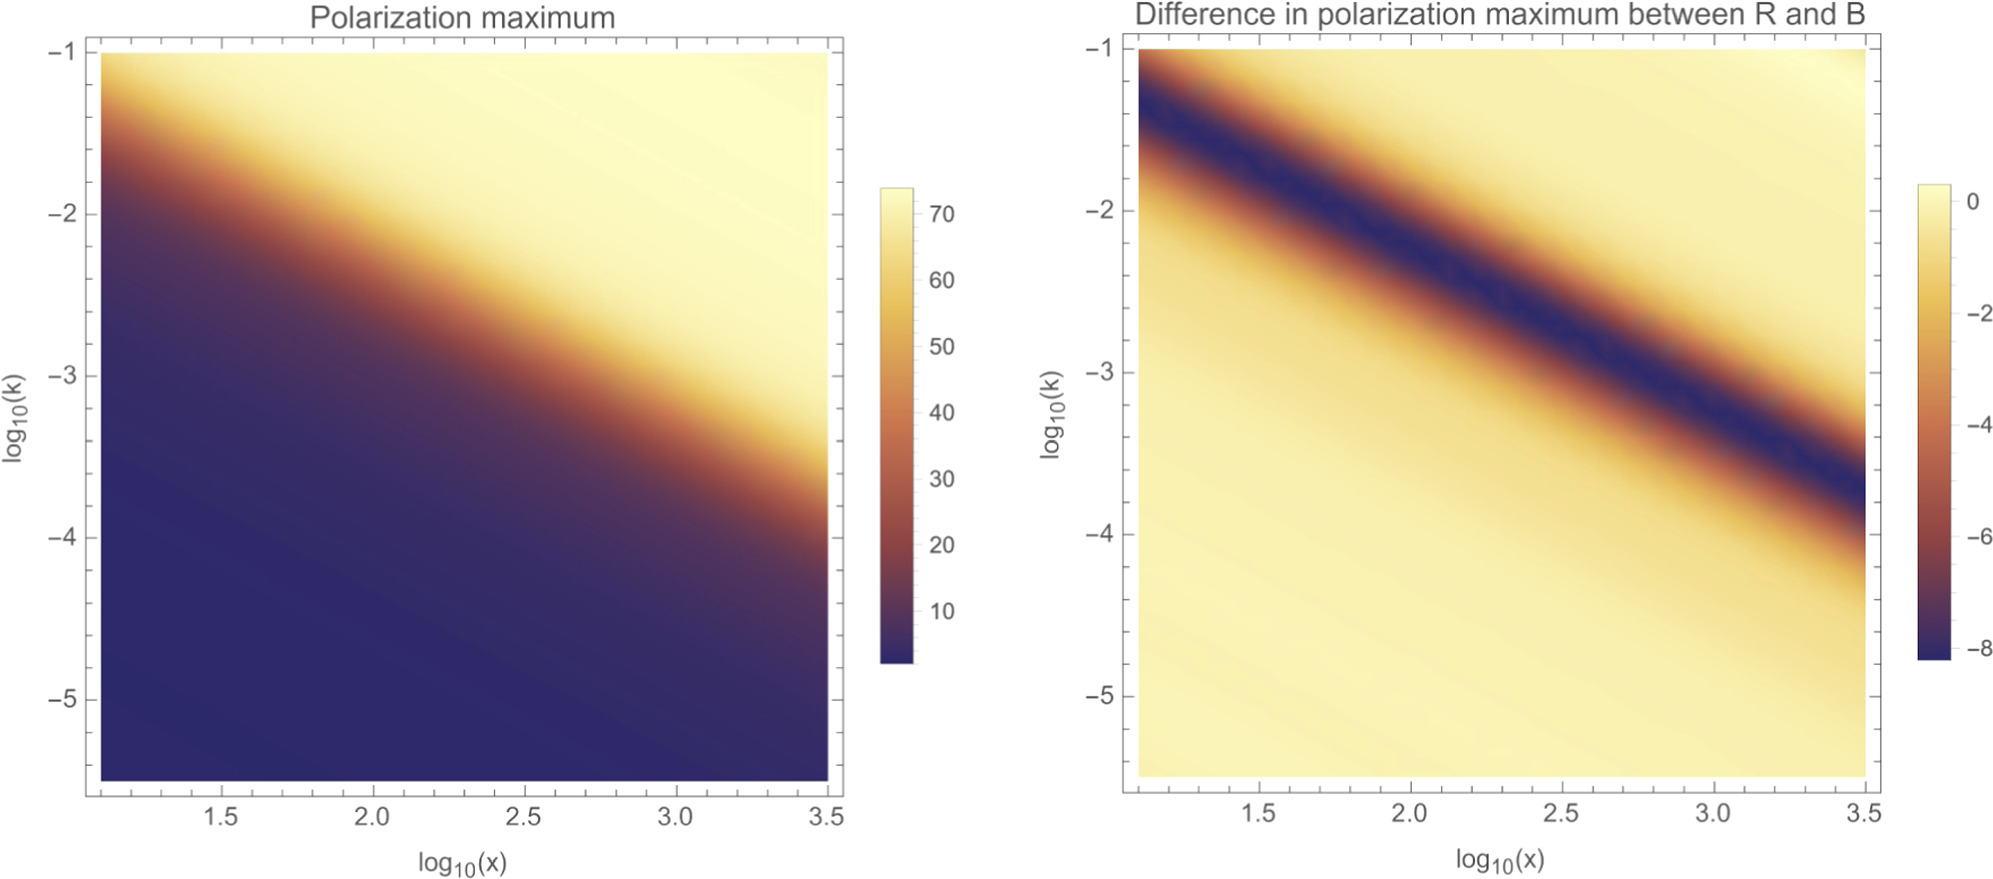
Figure 5. Density plots of simulated values of  (left) and
  (right). The horizontal axis is the particle size parameter x, and the vertical axis is the imaginary part of the refractive index k, both in 10-based logarithmic scale.
Download figure:
Standard image High-resolution image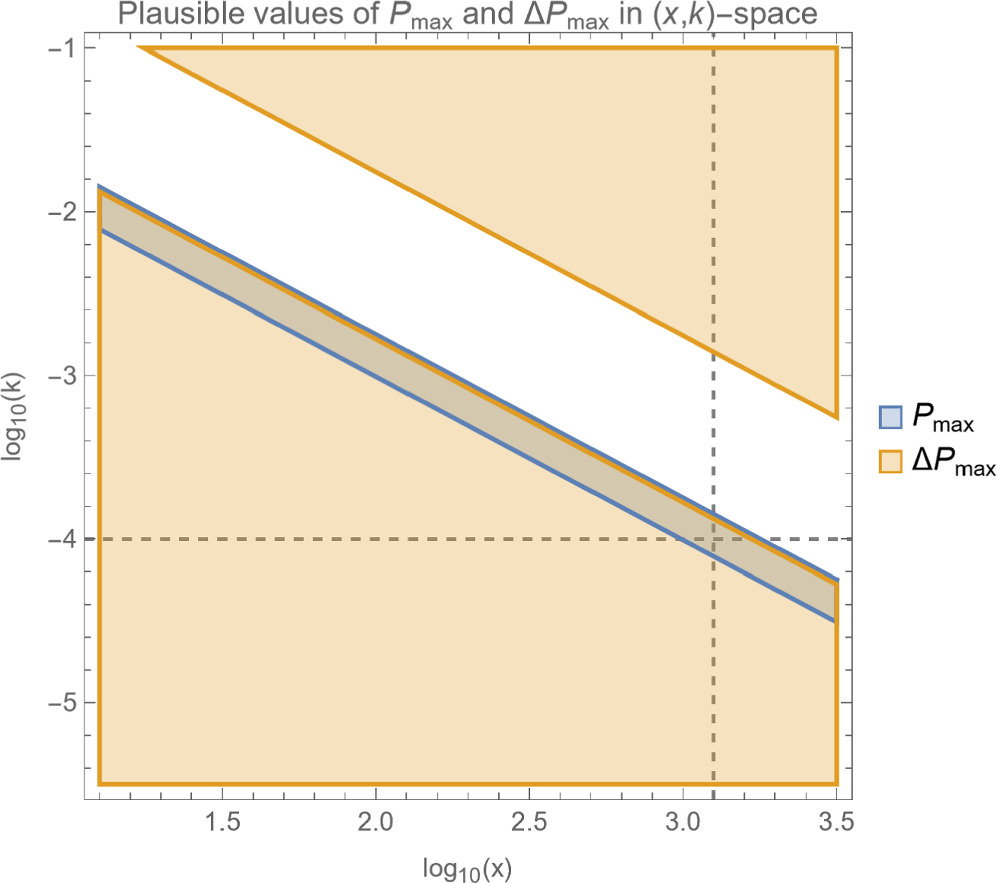
Figure 6. Combination of regions in the (x,k)-space that produce either  (blue) or
  (orange) values in our simulations that match the observed values in Didymos system observations. The dashed vertical and horizontal lines indicate how the assumption of k = 0.0001 leads to a particle size parameter of
  and a particle size of about 200 μm.
Download figure:
Standard image High-resolution imageWe can add a constraint from the observed difference Δc
in DoLP, although it is more complex to interpret than  . The simulated Δc
values are computed from simulated
. The simulated Δc
values are computed from simulated  values between different size parameters owing to different wavelengths but assuming constant k. This assumption is not completely valid—the imaginary part of the refractive index for olivine or ordinary chondrite meteor material linked with S-type asteroids is typically lower on R-filter than on B-filter wavelengths (see, e.g., Lucey 1998; Muñoz et al. 2000; Database of Optical Constants for Cosmic Dust
9
). This means that the material is brighter with the R filter and the DoLP is lower. For this reason, our observed Δc
of −1.73 and −2.18 is at least partly due to different k values between the filters and can offer only a lower negative limit to the change owing to the size parameter changing with wavelength. This will exclude the area of fast
values between different size parameters owing to different wavelengths but assuming constant k. This assumption is not completely valid—the imaginary part of the refractive index for olivine or ordinary chondrite meteor material linked with S-type asteroids is typically lower on R-filter than on B-filter wavelengths (see, e.g., Lucey 1998; Muñoz et al. 2000; Database of Optical Constants for Cosmic Dust
9
). This means that the material is brighter with the R filter and the DoLP is lower. For this reason, our observed Δc
of −1.73 and −2.18 is at least partly due to different k values between the filters and can offer only a lower negative limit to the change owing to the size parameter changing with wavelength. This will exclude the area of fast  change above the stripe proposed by
  values in Figure 6. In conclusion, based on our simulations, we believe that the Didymos system particle size and absorption properties should reside in the area constrained by suitable
  values.
The multiple scattering mechanism in optically large particles and the interplay between surface reflections and refractions (neutralizing polarization, not dependent on k) and volume absorption (decreasing surface interactions, dependent on k) lead to the relation where there is no single (x,k) pair that can produce the observations, but a collection of (x,k) value pairs. Larger values of k will counteract the smaller sizes; smaller k, the larger sizes.
Olivine is a very abundant mineral in asteroids and also the major component affecting the scattering properties of S-type asteroids. This is seen in observed S-type spectra that closely follow laboratory-measured spectra of pure olivine. It is therefore natural to assume that Didymos particles mainly consist of olivine and that the optical constant of the particles should match that seen in olivine and in ordinary chondrite meteorites. This would indicate values of  around −4, typically between −6 and −3 (see, e.g., Muñoz et al. 2000; Database of Optical Constants for Cosmic Dust; see footnote 9). Turning this into particle size according to constraints from our simulations, the dominating particle size would be around
  , ranging from 2.1 up to about 3.5. In visual wavelengths at the middle of B and R filters,
  corresponds to particle diameters of ∼200 μm.
3.2.3. Particles before and after DART Impact in the Didymos System
After finding a plausible particle size (about 200 μm) and imaginary part of refractive index (about 0.0001), we can turn to the observed change in DoLP of the Didymos system with the DART impact. We fitted the pre- and post-impact DoLP observations in B and R filters and observed a change of −0.71 p.p. (B filter) and −0.26 p.p. (R filter) (Table 2). With a fixed wavelength at the given filter, a decrease in  can be due to either the size of particles decreasing or the imaginary part of the material k decreasing. We can fix the initial particle properties to our plausible pair of particle diameter d = 200 μm and k = 0.0001 and see what kind of change in either d or k at the DART impact would explain the observed Δt
.
can be due to either the size of particles decreasing or the imaginary part of the material k decreasing. We can fix the initial particle properties to our plausible pair of particle diameter d = 200 μm and k = 0.0001 and see what kind of change in either d or k at the DART impact would explain the observed Δt
.
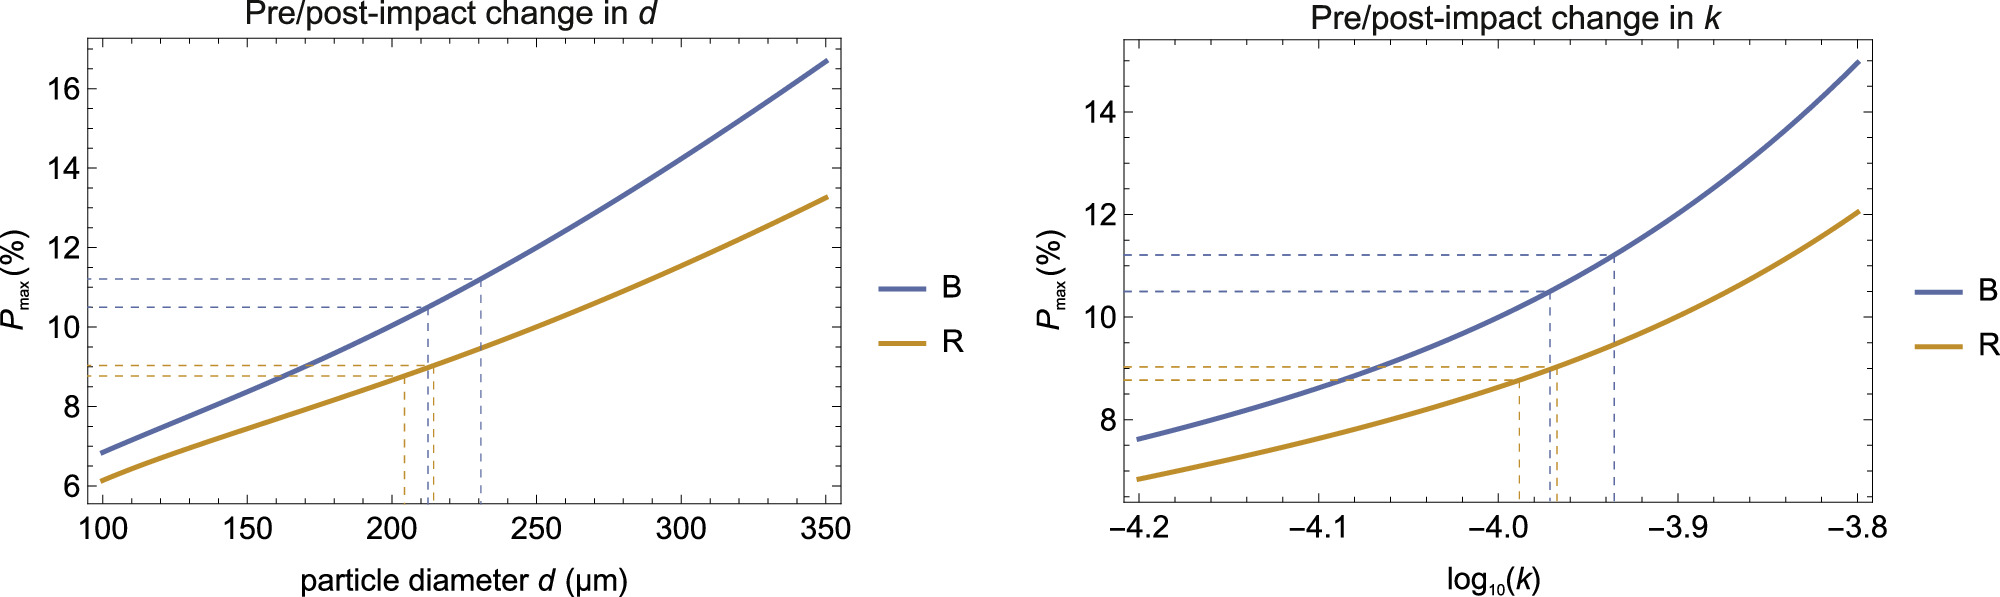
Since both x and k have an effect, it is best to fix one and see how the other one influences  . Let us first fix k = 0.0001 and study what kind of change in d would cause the observed Δt. This can be seen in Figure 7; Δt
= −0.71 in the B filter can be explained by particle diameter decreasing from about 230 to 210 μm, and the same change of about 215 to 205 μm in the R filter. Hence, a 10–20 μm decrease in the dominant particle size between pre- and post-impact observations can explain the observed DoPL.
. Let us first fix k = 0.0001 and study what kind of change in d would cause the observed Δt. This can be seen in Figure 7; Δt
= −0.71 in the B filter can be explained by particle diameter decreasing from about 230 to 210 μm, and the same change of about 215 to 205 μm in the R filter. Hence, a 10–20 μm decrease in the dominant particle size between pre- and post-impact observations can explain the observed DoPL.
Figure 7. Plots showing how the observed Δt on the vertical axis are inverted back to change in particle diameter (left) or k (right) using simulated data with the B filter and R filter.
Download figure:
Standard image High-resolution image
On the other hand, we can fix d and see what kind of change in k is needed. Now d is fixed to 200 μm. From the right panel of Figure 7 we see that a decrease between 0.02 and 0.04 in  can explain the observed Δt
with both the B filter (
can explain the observed Δt
with both the B filter ( ) and the R filter (
 ). In k this change is about −0.00001.
4. Discussion
It is evident that the DART impact on 2022 September 26 changed the system. The orbit of Dimorphos about Didymos changed, and the orbital period shortened (Thomas et al. 2023). There are indications that the rotation state and the orbit of Dimorphos have not stabilized even after 350 days (Richardson et al. 2023; Li et al. 2023; Gudebski et al. 2023). The impact released a massive amount of dust that was seen as a large ejecta cloud and tail (Dotto et al. 2023). In addition to photometric studies of the system, this change is also seen in polarization and in the DoLP (Bagnulo et al. 2023; Gray et al. 2024).
Polarization observations offer additional means, alongside photometry and spectroscopy, to study the temporal effects of the impact. The statistical modeling of the DoLP phase curve suggests different polarization behavior for pre- and post-impact, implying that the observations come from different kinds of particles. From Figure 3 we can see that the pre/post-impact difference is observed very reliably up to 30–34 days post-impact. There is a 15-day gap, and the next three observations are from days 50–66. The difference between the fitted pre- and post-impact models is smaller, but still there could be an indication of a small difference even at this time. In the final set of observations from 80 up to 114 days, the expected difference between the fitted model is very small, and the observations could support either model, so the polarimetric evidence of an altered system is not present anymore.
Other studies suggest an altered system still at about 30 days. The ejecta cloud is still easily visible, the photometric brightness of the system is increased at least some weeks after the impact, and the photometric depths of occultations and eclipses of the binary system are altered even after about 50 days (Lin et al. 2023; Moskovitz et al. 2023; Rożek et al. 2023). The polarimetric signal can be affected both by the particles in the ejecta cloud (at the time of impact and some weeks afterward) and by the ejected particles returned to coat the surface of Dimorphos or even Didymos (weeks and months from impact).
Polarimetry is used here to estimate the dominant particle size in the Didymos system. The absorption properties and the particle size are tied together, but by assuming a realistic value for the imaginary part of the material refractive index k, we can find a diameter of 200 μm supported by the observations. With somewhat larger k the particles can be smaller, and with smaller k they can be larger, but they should anyway be tens to hundreds of μm. This result of large particles is also supported by the modeling result showing how small (micrometer scale or smaller) particles, if present, should have been removed quite fast from the ejecta cloud by the solar radiation pressure (Li et al. 2023; Lin et al. 2023; Moreno et al. 2023; Murphy et al. 2023).
Finally, we can use the pre/post-impact difference in polarization to derive estimates of the physical change in the particles dominating the reflected signal. Since size and k are entangled, we can estimate the required change in both of them separately. If material optical properties are unaltered, a change of 20 μm in particle size, so that the post-impact particles are smaller, is enough to cause the polarization to decrease. The smaller particle size emerges as a reasonable result from the high-speed impact of the DART spacecraft on Dimorphos. Post-impact, the ejecta cloud is optically thick, so that the particles in the cloud are the ones dominating the polarization signal and are easily smaller than the particles in the original surfaces of Didymos and Dimorphos.
On the other hand, if particle size does not change, a decrease in the imaginary part of the refractive index of the material can explain the observed change. While we do not expect the material of the pre- and post-impact particles to be different, it is safe to assume that they have experienced different levels of space weathering. The space weathering process (see, e.g., Pieters & Noble 2016; Penttilä et al. 2020) can alter the very surface material, and the impact will definitely eject material deeper from the Dimorphos surface. If the material is less space weathered, i.e., fresher, it will have less nanophase and microphase iron on its surface and therefore be brighter. Brighter material will show decreased polarization. With precise spectroscopy, this could be seen with the system moving slightly from the S-type toward Q-type spectra, and some results from color photometry are suggesting that interpretation (Opitom et al. 2023; Dotto et al. 2023; Lin et al. 2023), although it was not supported by near-infrared spectra (Ieva et al. 2023). From the computational light-scattering model for space-weathered olivine by Penttilä et al. (2020), we can estimate that the observed decrease of k of about 10−5 can be explained with a change in the volume fraction of nanophase iron (npFe0) of about 0.001 p.p, from 0.0095 vol-% to 0.0085 vol-%.
To summarize, we observe a change in the DoLP in the Didymos system taking place at the time of the DART impact and lasting at least 30 days, perhaps even about 50 days after the impact. We estimate the dominant size of the particles either in the regolith of Didymos and Dimorphos or in the impact-driven ejecta cloud to be around 200 μm. We can also conclude that the impact introduced smaller and/or fresher particles into the system.
We plan to continue the polarimetric observing campaign of Didymos again in 2024 June, when the observed phase angle is smaller, reaching down to about 21. These observations will give us additional information about the Didymos system particle properties, since CB effects are important at small phase angles, giving rise to negative DoLP surge, and therefore small particles will have increased importance in these observations. When the ESA Hera mission reaches Didymos and begins observations in 2027 (Michel et al. 2022), instruments such as the hyperspectral cameras Hyperscout and ASPECT will help constrain the spatial distribution of fresh and space-weathered material in the regolith layer of the system.
Acknowledgments
A.P. and K.M. acknowledge the financial support from the Academy of Finland grant No. 1345115. L.K. acknowledges NASA DART PSP grant 80NSSC21K1131. Computational resources were provided by CSC—IT Center for Science Ltd., Finland.
Facilities: NOT(ALFOSC) - Nordic Optical Telescope, VLT:Antu(FORS2). -
Software: SIRIS (Muinonen et al. 2009; Lindqvist et al. 2018), RT-CB (Muinonen 2004).
Appendix
A.1. Polarimetric Phase Function Models Fitted to Didymos System Observations
Table A1 summarizes the different phase function models fitted to the DoLP observations.
Table A1. Different Phase Curve Models Fitted in Section 2.2
| Model | Filter/Time/ | b | α0 (deg) | c1 | c2 | BIC |
|---|---|---|---|---|---|---|
| Instrument | ||||||
| m0 | All together | 9.53 | 20.95 | 0.666 | 0.000 | −80.48 |
| m1 | B | 10.36 | 18.75 | 0.900 | 0 | −198.80 |
| R | 8.65 | 21.40 | 0.502 | 0 | ||
| m2 | B | 10.42 | 20.89 | 0.627 | 0 | −206.69 |
| R | 8.68 | |||||
| m3 | ALFOSC | 8.90 | 20.89 | 0.718 | 0 | −55.02 |
| PMOS | 9.94 | |||||
| IPOL | 9.73 | |||||
| m4 | ALFOSC | 8.73 | 21.09 | 0.527 | 0 | -21.55 |
| PMOS | 9.60 | 18.53 | 0.823 | 0 | ||
| IPOL | 10.09 | 22.14 | 0.791 | 0 | ||
| m5 | B, pre | 12.35 | 21.16 | 0.801 | 0 | −224.50 |
| R, pre | 9.96 | |||||
| B, post | 10.64 | |||||
| R, post | 8.88 | |||||
| m6 | B, pre | 10.83 | 21.65 | 0.305 | 0 | −228.92 |
| R, pre | 8.71 | |||||
| B, post | 10.76 | 0.814 | ||||
| R, post | 8.98 | |||||
| m7 | B, pre | 11.49 | 19.68 | 0.735 | 0 | −229.02 |
| R, pre | 9.26 | |||||
| B, post | 10.86 | 22.56 | ||||
| R, post | 9.07 | |||||
| m8 | B, pre | 10.95 | 20.87 | 0.436 | 0 | −226.88 |
| R, pre | 8.81 | |||||
| B, post | 10.85 | 22.40 | 0.759 | |||
| R, post | 9.06 | |||||
Note. Fitted parameter values b, α0, c1, and c2 are listed, together with the BIC value of the model.
Download table as: ASCIITypeset image
Footnotes
- 7
Available at https://scattering.iaa.csic.es/.
- 8
Available at http://gcpsj.sdf-eu.org/catalogo.html.
- 9
Database of Optical Constants for Cosmic Dust, Laboratory Astrophysics Group of the AIU Jena, https://www.astro.uni-jena.de/Laboratory/OCDB/crsilicates.html#F, Non-oriented Stubachtal data.