


Abstract
Asteroid (16) Psyche is theorized to be an exposed iron core of a primordial asteroid and is the target of the upcoming NASA Psyche mission. Recent observations of Psyche identified the presence of rotational heterogeneity, a fine-grained regolith, pyroxene, and hydrated minerals on its surface. We obtained rotationally resolved mid-infrared (MIR) spectroscopy of Psyche with the Stratospheric Observatory for Infrared Astronomy to explore its compositional heterogeneity and to assess its mineralogy. We used a thermophysical model of Psyche to estimate and remove its thermal flux at the time of observation to obtain emissivity spectra at 14 different epochs in its rotation. We find that the MIR emissivity does not vary significantly over the rotation of the asteroid, though this may be due to similar aspect angles. We find a lack of mineralogical features, which could suggest that materials on Psyche in the region we observed are not infrared active and consistent with a metal or oxide surface. Differences between the presented spectra and previous studies might indicate a hemispherical compositional dichotomy.
Export citation and abstract BibTeX RIS

Original content from this work may be used under the terms of the Creative Commons Attribution 4.0 licence. Any further distribution of this work must maintain attribution to the author(s) and the title of the work, journal citation and DOI.
1. Introduction
M-type asteroids are theorized to be the cores of differentiated protoplanets that lost the outer, silicate shells through impacts, leaving behind an iron-nickel core remnant (Bell et al. 1989; Burbine et al. 1996; Elkins-Tanton et al. 2022). While the remnant metal core hypothesis is favored, there are alternate hypotheses of the origin of M-type asteroids. For example, Johnson et al. (2020) posit that metal on M types could have been brought to the surface by ferrovolcanism, as the cooling core of a differentiated planetesimal can solidify from the outside in and create excess pressure on the inner liquid material. M types could also originate from undifferentiated parent bodies composed of highly reduced, low-FeO material. Several groups of carbonaceous chondrite meteorites (CR, CH, CB) have compositions such as this. Elkins-Tanton et al. (2022) discuss these formation theories for M-type asteroids and note that the expected scale of mixing between silicates and metals will vary based on assumed origin. Specifically, if the remnant core hypothesis is true, the scale for regions of metal versus nonmetal would be on the order of meters to kilometers. If, however, the accretion as-is hypothesis is true, the scale for regions of metal versus nonmetal would be on the order of millimeters to centimeters.
At visible to near-infrared wavelengths (VNIR; 0.4–4.0 μm), M types have flat- or red-sloped spectra with a lack of strong absorption features; however, signatures of hydrated silicates (Rivkin et al. 2000; Fornasier et al. 2010; Landsman et al. 2015; Takir et al. 2016) and mafic silicates (Hardersen et al. 2005, 2011; Fornasier et al. 2010; Ockert-Bell et al. 2010) have been found in some M-type spectra. These hydrated minerals are likely exogenic or implanted hydroxyl from the solar wind. Characterizing the presence and abundance of pyroxene and hydrated materials across M-type surfaces can be used to determine composition and may be used to help distinguish between two origin scenarios: as an exposed core of a differentiated asteroid or as an object that accreted as is, possibly in a different region of the solar system.
Asteroid (16) Psyche is an M type that represents approximately 1% of the mass of the main asteroid belt, and it is the largest member of the M-type population. Psyche was selected as the target of the NASA Discovery-class Psyche mission (Elkins-Tanton et al. 2016). Radar observations and light curves of Psyche show evidence for impact craters in the southern midlatitudes and a mass deficit region on the equator (Shepard et al. 2017), which support the theory of collisional stripping of outer materials. Sanchez et al. (2016) find NIR spectral heterogeneity on Psyche's surface, suggesting the presence of silicates and potential compositional changes across the surface.
Shepard et al. (2021) created a global map of Psyche using observations acquired in a wide range of wavelengths. Figure 1 shows a view of Psyche from its south pole with the three largest features marked. Alpha is a large depression located at 270° longitude, Bravo is a missing mass region located from 340° to 350° longitude, and Charlie is a missing mass region with low optical albedo located from 90° to 150° longitude. Nonequatorial features reported by Shepard et al. (2021) include the following:
- 1.Eros, a 50–75 km crater at located at −65°, 260°;
- 2.Panthia, a ∼90 km crater with high optical and radar albedo located at 40°, 300°;
- 3.Foxtrot, a 50 km crater located at the north pole; and
- 4.Delta, a dynamical depression located at −80°, 90°.
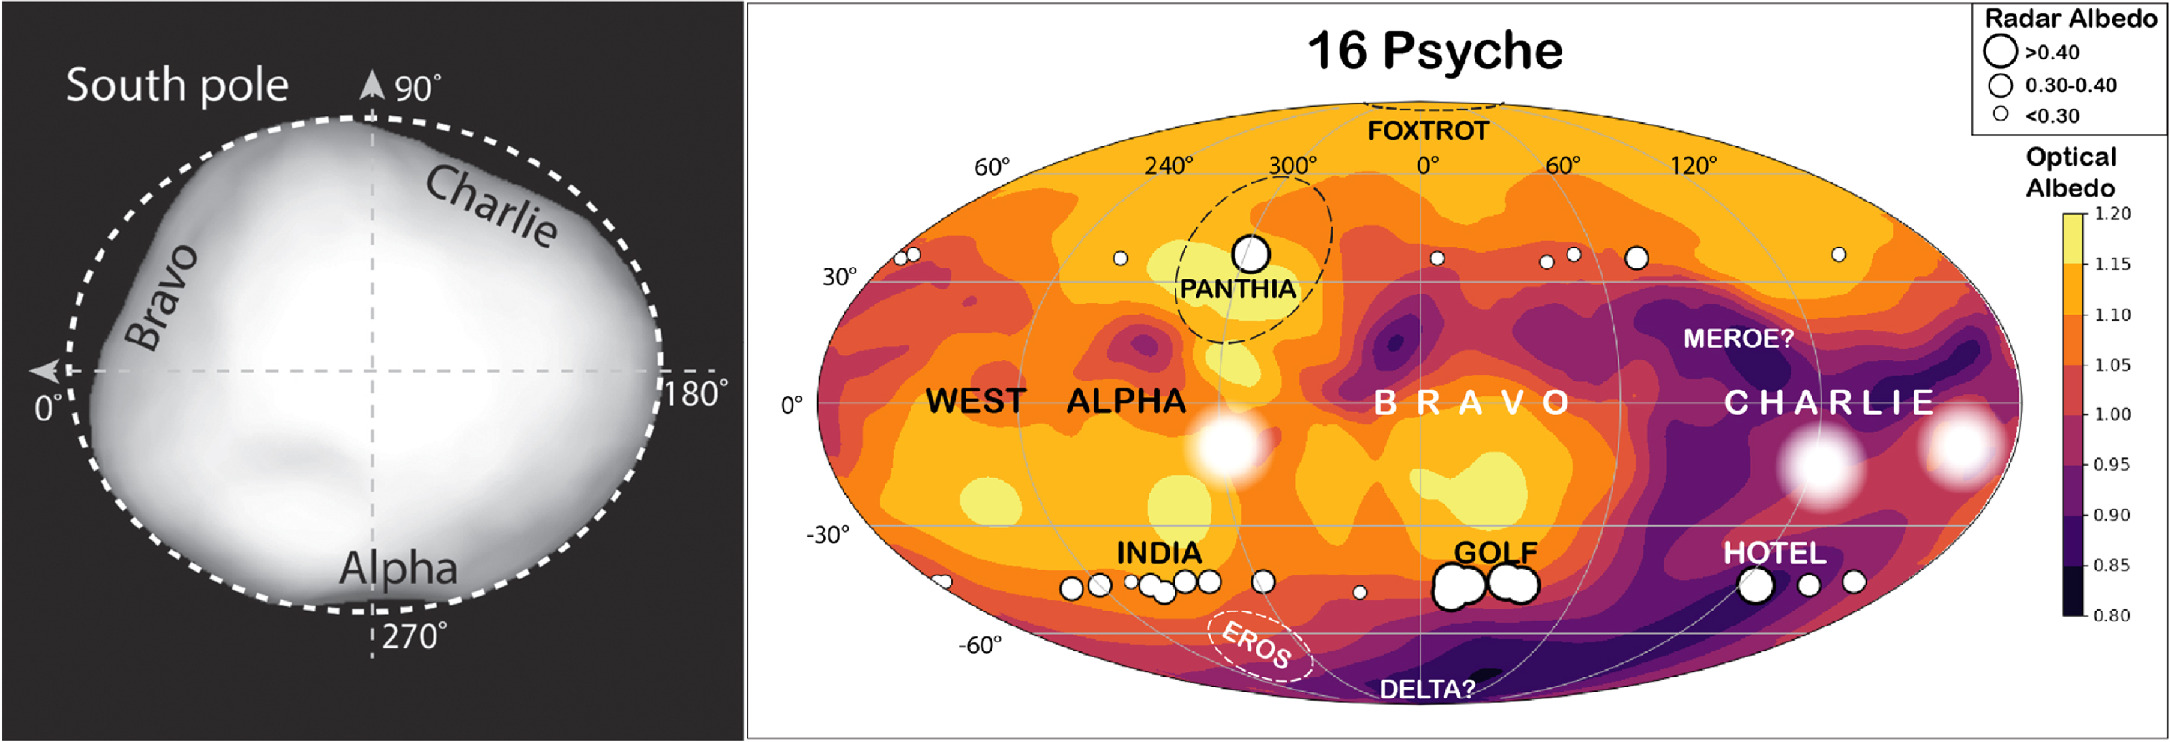
Figure 1. Left: shape model of Psyche viewed from the south pole. Major deviations from the ellipsoid shape are referred to as Alpha, Bravo, and Charlie. Right: global map of Psyche with features labeled. Colors correspond to optical albedo. Both plots are from Shepard et al. (2021).
Download figure:
Standard image High-resolution imageThere have been two published investigations on Psyche's spectrum at mid-infrared (MIR; 5–40 μm) wavelengths. Landsman et al. (2018) obtained 5–14 μm spectra of Psyche with Spitzer IRS and found that Psyche likely has a smooth surface, which is consistent with Psyche being a metal body, and a low thermal inertia (5–25 Jm−2 s−0.5 K−1). However, they also find excess emission between 10 and 14 μm, which is consistent with fine-grained (<75 μm) silicate regolith, indicating that Psyche is complex compositionally. Another MIR study using interferometry (Matter et al. 2013) finds that Psyche has a higher thermal inertia (125 Jm−2 s−0.5 K−1), indicating a metal-rich surface. These incongruent measurements (e.g., thermal inertias) and potentially contradictory results (e.g., evidence of both hydrated minerals and pyroxene) show that further investigations are necessary to understand this asteroid, especially in preparation for the upcoming Psyche mission.
In this work we obtained rotationally resolved MIR spectroscopy of Psyche to explore its compositional heterogeneity (e.g., Sanchez et al. 2016) and to assess its mineralogy (e.g., Matter et al. 2013; Takir et al. 2016; Landsman et al. 2018). We describe the observations from the Stratospheric Observatory for Infrared Astronomy (SOFIA) in Section 2. In Section 3.2 we describe the thermophysical model (TPM) used to model the flux of the asteroid at the time of observations. We present results of the study, including rotationally resolved emissivity spectra, in Section 4, followed by a discussion of the results in Section 5.
2. Observations and Data Reduction
We used the Faint Object infraRed CAmera for the SOFIA Telescope (FORCAST; Herter et al. 2018) to obtain spectra of Psyche on three different flights in 2022 February. The observations were part of program 09-0057 with PI Maggie McAdam for DAPR. We used two grisms (G111 and G227) to obtain spectra in the ranges 8.4–13.7 μm and 17.6–27.7 μm with a resolution λ/Δλ ∼ 200. We also acquired photometry at two wavelengths, 11.1 and 25.3 μm (F111 and F253), for absolute flux calibration.
Figure 2 shows the Psyche shape model oriented at the beginning of each flight, and Table 1 lists the observing conditions at the beginning of each flight. The shape model is from Viikinkoski et al. (2018) and was accessed using the Interactive Service for Asteroid Models. 6 All three nights viewed the north pole with parts of the equator rotating in and out of view. As seen in Figure 1, the orientation of Psyche during the SOFIA observations provides coverage of Foxtrot, Alpha, Bravo, Charlie, and Panthia. Flight 823 was 2 days after Flight 821, and Flight 825 was 6 days after Flight 823, so there is a slight change in aspect, but for the most part all three nights were looking at the same viewing geometry. We observed about 90% of the rotation on Flight 821; 50% on Flight 823, including the part that was not observed on Flight 821; and 40% on Flight 825. The observations covered 3.11, 1.07, and 0.85 hr of Psyche's 4.196 hr rotation period, providing coverage of the entire equator (Figure 2).
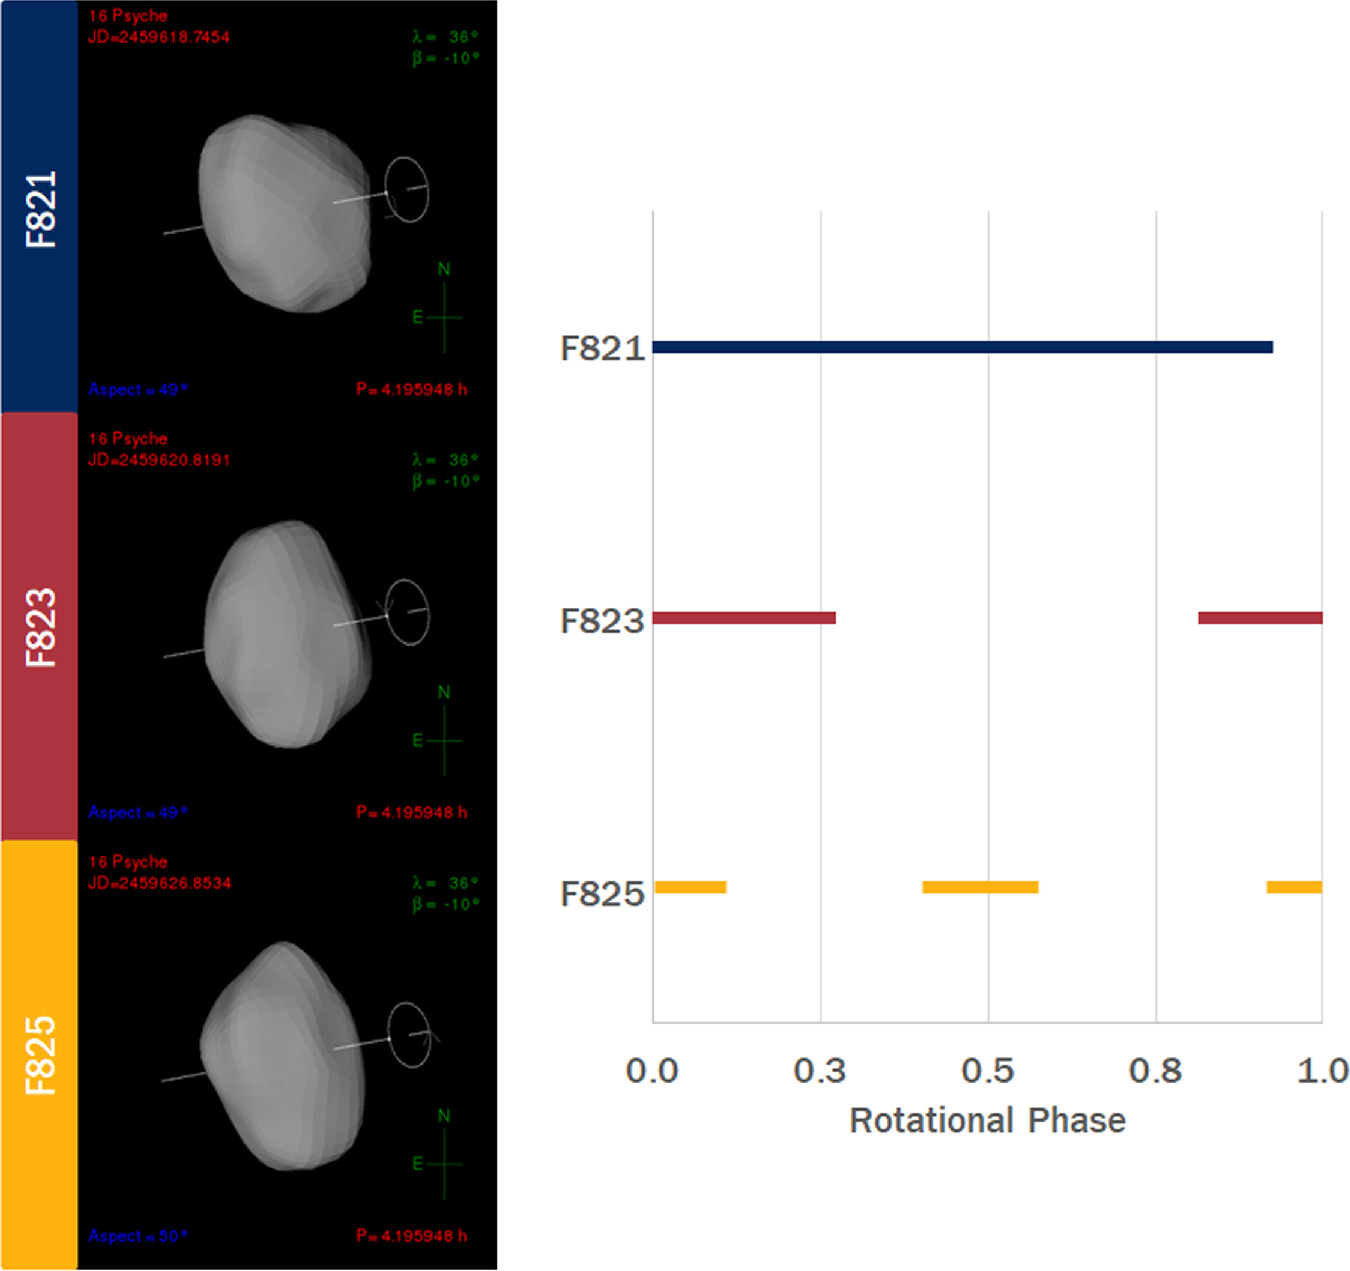
Figure 2. Left: orientation of the asteroid at the beginning of each night. The shape model is from Viikinkoski et al. (2018) and was accessed using the Interactive Service for Asteroid Models. Right: approximate phase coverage of the three nights of observations.
Download figure:
Standard image High-resolution imageTable 1. Observing Conditions at the Beginning of Each Night
| Flight Number | UT DATE | UT TIME | LATITUDE °N | LONGITUDE °E | ALTITUDE (feet) |
|---|---|---|---|---|---|
| F821 | 20220208 | 05:52:22 | 54.371 | −101.382 | 41015 |
| F823 | 20220210 | 07:39:31 | 45.099 | −118.224 | 40005 |
| F825 | 20220216 | 08:28:57 | 49.680 | −113.214 | 41021 |
Download table as: ASCIITypeset image
The SOFIA science center provides flux-calibrated data products for download from the Infrared Science Archive (IRSA) hosted by the Caltech Infrared Processing & Analysis Center (IPAC). 7 We downloaded the individual flux-calibrated spectra (CRM extension) and images (CAL extension). We combined individual spectra into sets every ∼10% of rotation. The frames used for each set are listed in Table 2, with the parts of the rotational phase covered listed in the last column. Hereafter we will refer to each set by the percentage of the rotation at the start of the set (e.g., 4.8% for set F821_01 that spans rotations of 0.048–0.154). The rotational phase of each spectrum was found by taking the starting time of the first frame of the set and subtracting the starting time of the first set (F821_01) and dividing by the period of the asteroid (4.196 hr). Each of these sets had roughly 11 G111 spectra, 4 G227 spectra, 4 F111 images, and 4 F253 images. In total there are 14 sets: 8 sets from Flight 821, 4 sets from Flight 825, and 2 sets from Flight 825.
Table 2. Frames Used in Each Set
| Set | G111 | G227 | F111 | F253 | UT Start | Rotational Phase |
|---|---|---|---|---|---|---|
| F821_01 | 0199–0210 | 0223–0226 | 0211–0215 | 0216–0220 | 5:53:23 | 0.048–0.154 |
| F821_02 | 0242–0252 | 0227–0230 | 0236–0240 | 0231–0235 | 6:21:16 | 0.159–0.258 |
| F821_03 | 0254–0265 | 0276–0279 | 0266–0270 | 0271–0275 | 6:47:25 | 0.263–0.363 |
| F821_04 | 0294–0305 | 0280–0283 | 0289–0293 | 0284–0288 | 7:13:48 | 0.367–0.472 |
| F821_05 | 0306–0317 | 0328–0331 | 0318–0322 | 0323–0327 | 7:41:15 | 0.477–0.579 |
| F821_06 | 0346–0357 | 0332–0335 | 0341–0345 | 0336–0340 | 8:08:10 | 0.583–0.686 |
| F821_07 | 0358–0369 | 0380–0383 | 0370–0374 | 0375–0379 | 8:35:02 | 0.690–0.790 |
| F821_08 | 0398–0405 | 0384–0387 | 0393–0397 | 0388–0392 | 9:01:20 | 0.795–0.883 |
| F823_01 | 0108–0119 | 0090–0093 | 0099–0107 | 0094–0098 | 7:39:33 | 0.915–0.023 |
| F823_02 | 0120–0131 | 0142–0145 | 0132–0136 | 0137–0141 | 8:07:46 | 0.027–0.128 |
| F823_03 | 0160–0169 | 0146–0149 | 0155–0159 | 0150–0154 | 8:34:16 | 0.132–0.223 |
| F823_04 | 0348–0359 | 0370–0373 | 0360–0364 | 0365–0369 | 11:40:30 | 0.872–0.979 |
| F825_01 | 0161–0171 | 0144–0148 | 0154–0160 | 0149–0153 | 8:28:58 | 0.425–0.523 |
| F825_02 | 0274–0287 | 0300–0307 | 0290–0294 | 0295–0299 | 10:48:15 | 0.978–0.111 |
Download table as: ASCIITypeset image
We used the procedures given in the FORCAST Basic Photometry cookbook 8 to perform aperture photometry on the F111 and F253 image files for each set. We used an aperture radius of 12 pixels with an annulus with inner and outer radii of 15–25 pixels. The extracted flux for each filter and set is given in Table 3. We scaled each spectrum to the relevant photometric point using the method in the FORCAST Grism Inspection cookbook, 9 with a slight modification. We predict the flux at 11.1 and 25.3 μm by convolving the object spectra and the transmission spectra of each filter as described in the cookbook; however, we use this as a multiplicative (rather than additive) factor to scale the spectra. We justify this change because an additive correction factor would distort the shape of the resulting emissivity spectrum, whereas a multiplicative correction factor would not. Furthermore, a multiplicative factor is more similar to the procedures used to scale asteroid spectra from other telescopes such as Spitzer (e.g., Licandro et al. 2012; Emery et al. 2014; Hargrove et al. 2015).
Table 3. Flux Extracted from Aperture Photometry
| Set | F111 | F253 |
|---|---|---|
| F821_01 | 11.813 ± 0.625 | 36.727 ± 1.920 |
| F821_02 | 9.650 ± 0.517 | 40.800 ± 2.129 |
| F821_03 | 14.351 ± 0.751 | 38.739 ± 2.022 |
| F821_04 | 13.270 ± 0.697 | 31.551 ± 1.654 |
| F821_05 | 10.336 ± 0.542 | 41.260 ± 2.152 |
| F821_06 | 11.435 ± 0.609 | 38.502 ± 2.009 |
| F821_07 | 9.964 ± 0.523 | 44.022 ± 2.300 |
| F821_08 | 14.337 ± 0.755 | 41.657 ± 2.172 |
| F823_01 | 11.855 ± 0.618 | 45.127 ± 2.353 |
| F823_02 | 13.330 ± 0.694 | 46.988 ± 2.456 |
| F823_03 | 12.537 ± 0.659 | 43.445 ± 2.266 |
| F823_04 | 13.286 ± 0.696 | 45.770 ± 2.387 |
| F825_01 | 15.206 ± 0.796 | 43.092 ± 2.251 |
| F825_02 | 15.606 ± 0.820 | 45.694 ± 2.387 |
Note. Frames used for each set are in Table 2.
Download table as: ASCIITypeset image
The original data downloaded from IRSA are shown in Figure 3 (light-gray line), along with the photometric points from the images (blue points) and the spectrum scaled to the photometry (black line). According to the cookbook, poor atmospheric conditions, bad seeing, or slit misalignment can cause the absolute flux calibration accuracy of the grism data to be uncertain by >10%. As shown in Figure 3, the difference between the photometric point and the TPM (discussed more in Section 3.2) at 25.3 μm is greater than 10%, while the photometry of the G111 filter matched the TPM very well. Inspection of the quality assessment notes in IRSA shows that there is a potential light leak in the F253 filter, causing fluxes to vary by ∼10%. To rectify this, we instead adjusted the G111 and G227 spectra to match the flux predicted by the TPM at 12 and 19 μm (dark gray line in Figure 3). We note that there has only been one other paper published on FORCAST observations of an asteroid (Vernazza et al. 2017), and that paper shows similar discrepancies between the data and the thermal model. These inconsistencies may indicate a wavelength-dependent flux loss or similar instrumental issue.
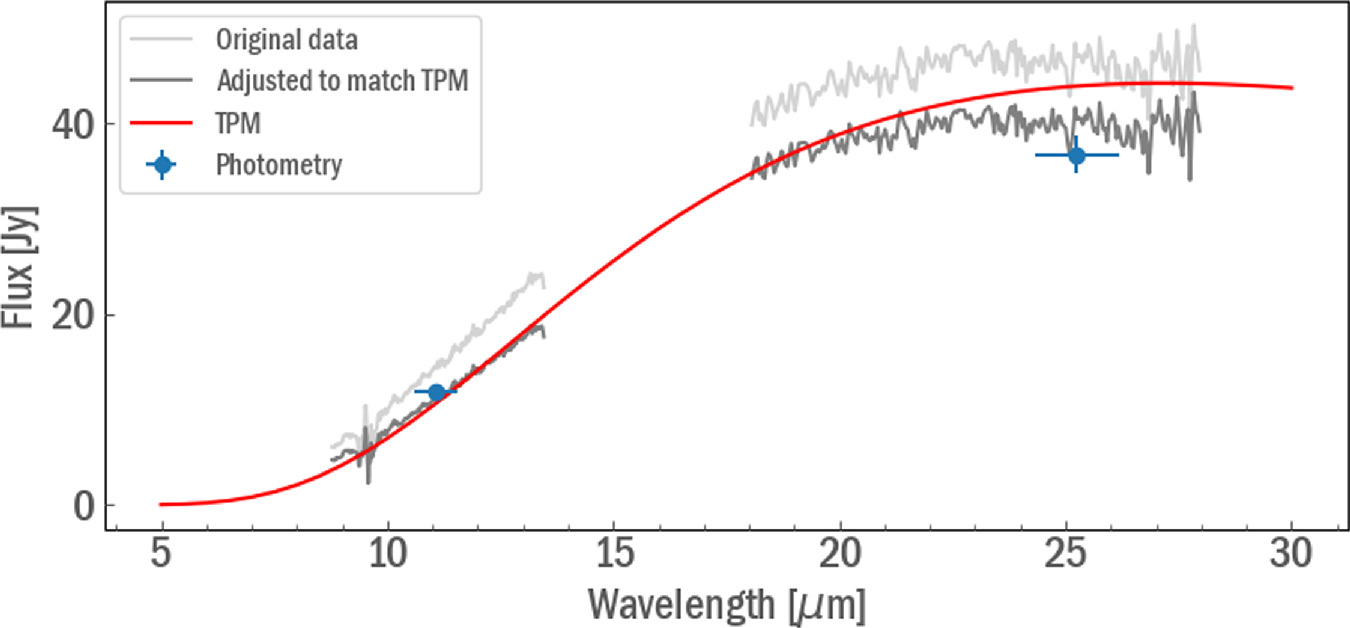
Figure 3. Spectra from IRSA (light gray) are normally adjusted to photometric points (blue) to scale the spectrum to absolute flux. The photometry for G227 was off owing to a light leak in the filter, so we scaled the G227 data to match the TPM (red) at a wavelength that is not expected to have significant MIR features (19 μm) (dark gray).
Download figure:
Standard image High-resolution image3. Thermal Models
3.1. Near-Earth Asteroid Thermal Model
We use the Near-Earth Asteroid Thermal Model (NEATM; Harris 1998) to solve the energy balance between incident solar radiation, reflected sunlight, and thermal emission on the asteroid. The NEATM is similar to the simple thermal model (STM) which assumes a spherical, smooth body that does not rotate. Unlike the STM, the NEATM takes phase angle, α, into account and allows for a normalization factor, η, that accounts for roughness, emission from the night side, and nonspherical shape, among other factors. We applied the NEATM to our scaled spectra using a code written by Migo Mueller, available on Github. 10 We create modeled spectral energy distributions (SEDs) using a range of albedo, pV , and η values and then use χ2 minimization to find the one that best matches the observed spectrum.
Because of the uncertainty in the photometric fluxes for the G227 filter (Section 2), we first fit the NEATM to each grism separately, to see whether they return similar values for pV
and η. We tested a range of pV
= 0.12–0.16 with  and η = 0.90–1.25 with Δη
= 0.05 based on the expected values derived from previous studies (Matter et al. 2013; Shepard et al. 2017; Landsman et al. 2018). We assume an emissivity,
and η = 0.90–1.25 with Δη
= 0.05 based on the expected values derived from previous studies (Matter et al. 2013; Shepard et al. 2017; Landsman et al. 2018). We assume an emissivity,  , of 0.9 based on the discussions in Landsman et al. (2018) and Matter et al. (2013). Figure 4 shows the scaled flux and best-fit NEATM for each set. The derived pV
and η for the G227 filter do not match those for the G111 filter, probably due to incorrect photometric scaling. Instead, we scale the G227 flux to the value that the G111 NEATM fit predicted at 25.3 μm. To obtain an emissivity spectrum, we divide the observed scaled spectra by the NEATM modeled SED, and the resulting spectra for F821 are shown in Figure 5.
, of 0.9 based on the discussions in Landsman et al. (2018) and Matter et al. (2013). Figure 4 shows the scaled flux and best-fit NEATM for each set. The derived pV
and η for the G227 filter do not match those for the G111 filter, probably due to incorrect photometric scaling. Instead, we scale the G227 flux to the value that the G111 NEATM fit predicted at 25.3 μm. To obtain an emissivity spectrum, we divide the observed scaled spectra by the NEATM modeled SED, and the resulting spectra for F821 are shown in Figure 5.
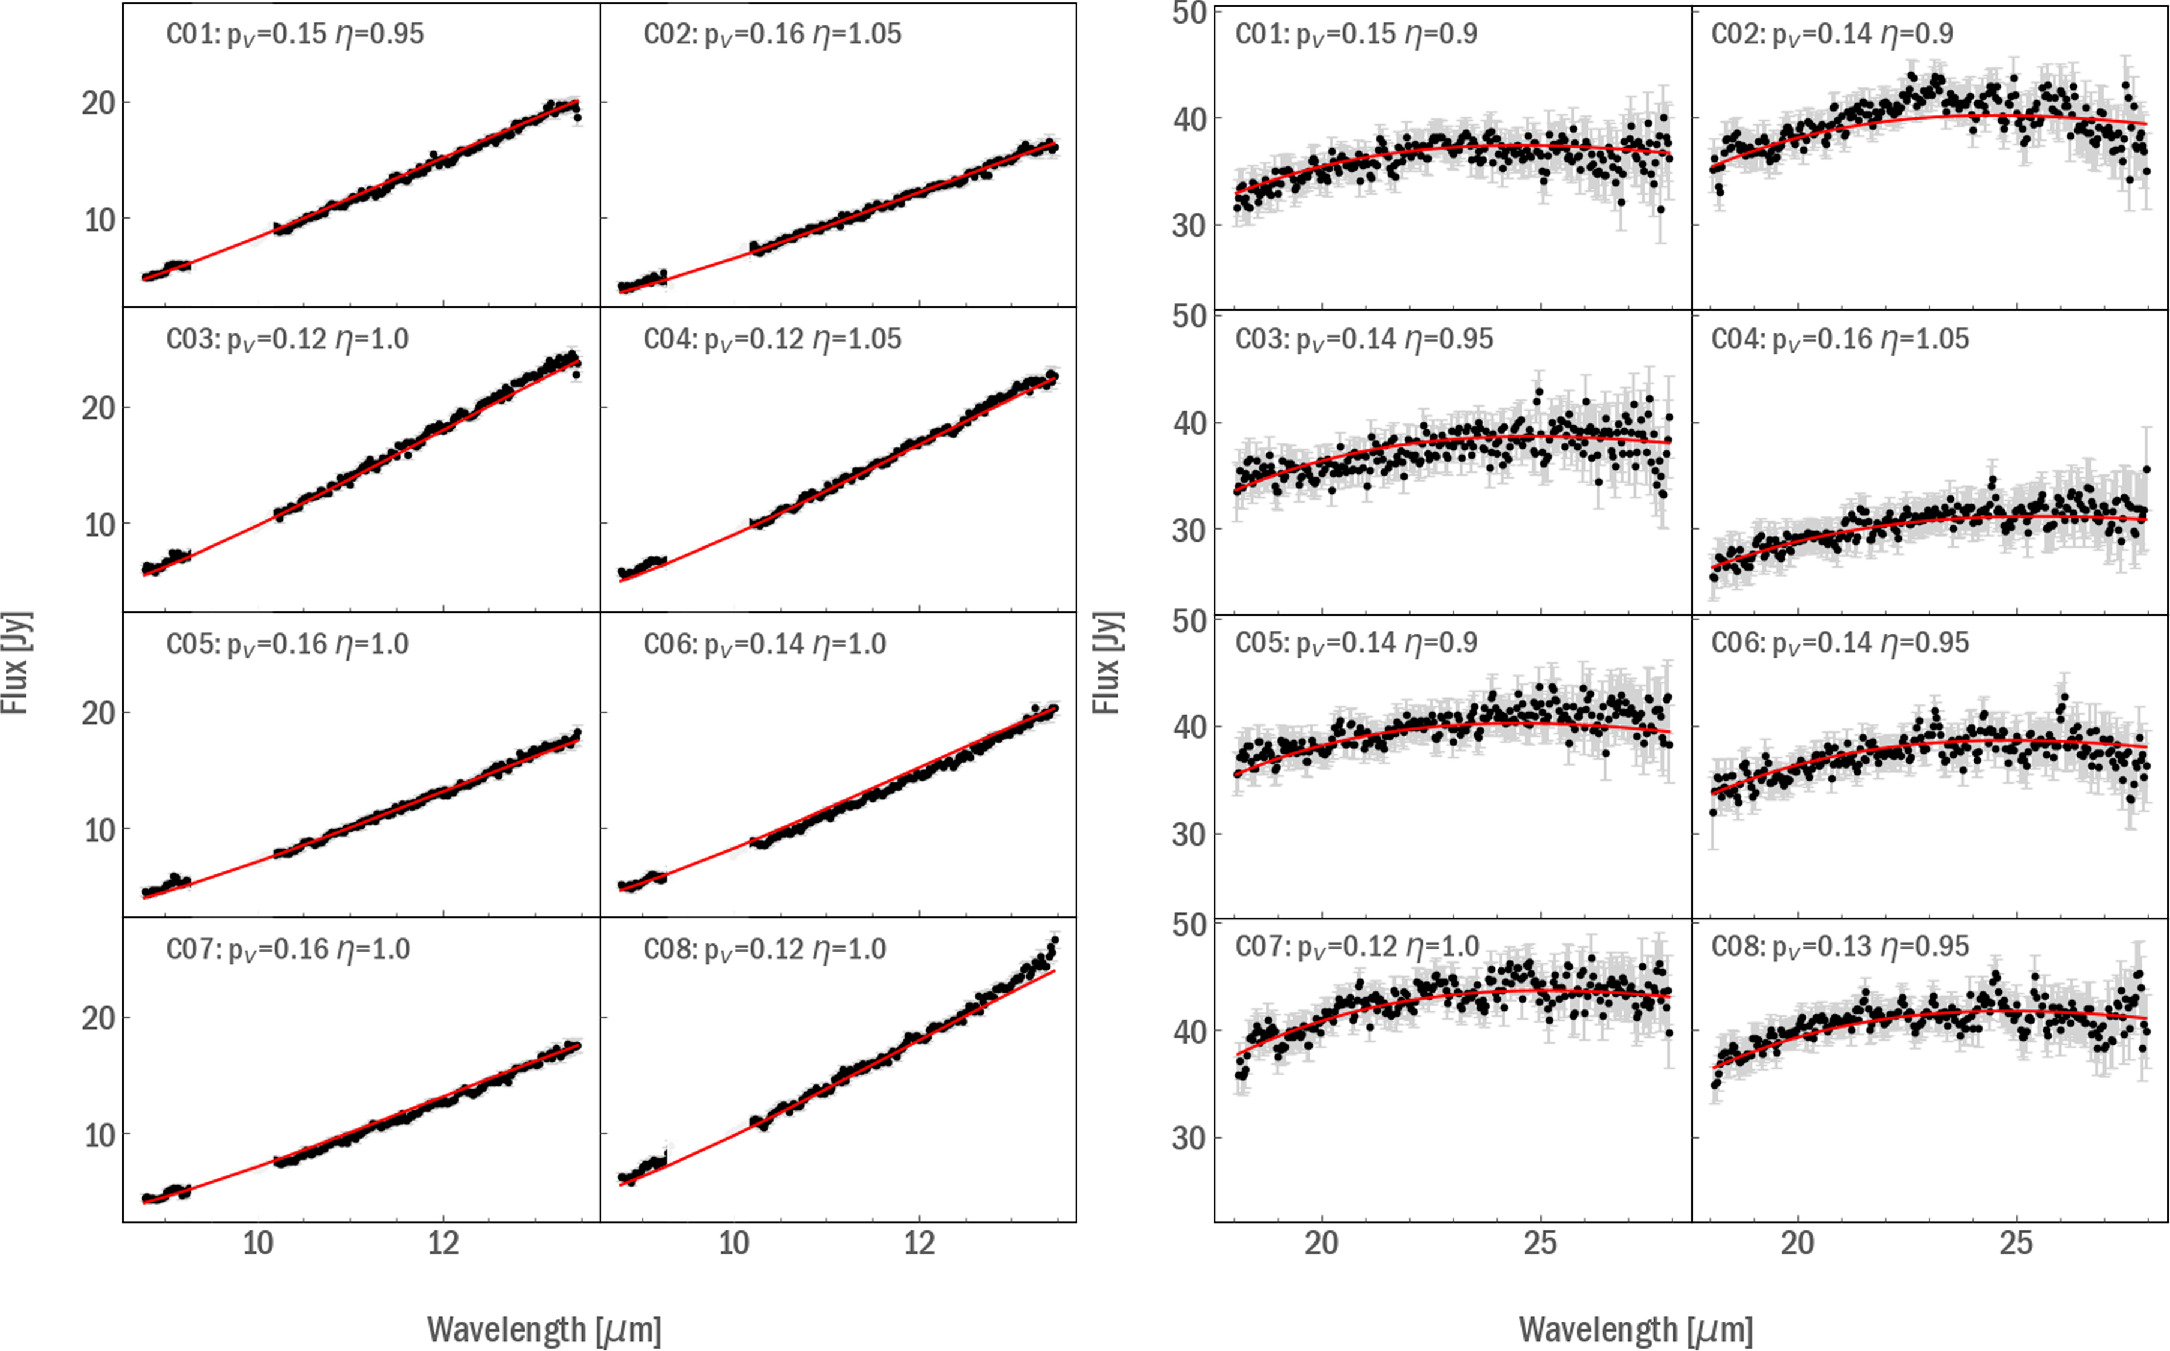
Figure 4. Best NEATM fit (red line) for scaled G111 (left) and G227 (right) F821 spectra. The derived values for pV and η do not match for each set.
Download figure:
Standard image High-resolution image
Figure 5. F821 Emissivity spectra resulting from fitting NEATM to G111 spectra and scaling G227 spectra to match.
Download figure:
Standard image High-resolution image3.2. Thermophysical Model
To better model the thermal flux of the asteroid, we use the TPM described in Lagerros (1996, 1997, 1998) and Müller & Lagerros (1998, 2002). The model included the spin-shape model from Viikinkoski et al. (2018) with a size of 224 ± 5 km. Values for absolute magnitude, H = 5.85, and slope parameter, G = 0.12, were taken from Oszkiewicz et al. (2011). We assumed a bolometric and spectroscopic hemispherical emissivity of 0.9, a thermal inertia of 50 Jm−2 s−0.5 K−1, and a low level of surface roughness following the discussion in Racero et al. (2022). TPM predictions were made for the UTC times listed in Table 2, from a geocentric reference frame, for a wavelength range from 5 to 30 μm and a step size 0.5 μm. An example of a TPM compared to observed spectra is shown in Figure 3. To obtain an emissivity spectrum, we divide the observed scaled spectra by the TPM modeled SED, and the resulting spectra for F821 are shown in Figure 6. The TPM model results in a more blue-sloped emissivity spectrum for Psyche than the NEATM models. However, neither thermal model removal results in notable spectral features, as discussed in Section 5.1. Because the TPM includes shape and surface roughness and is a more robust model than the NEATM, we use the TPM-derived emissivity spectra for further analysis.
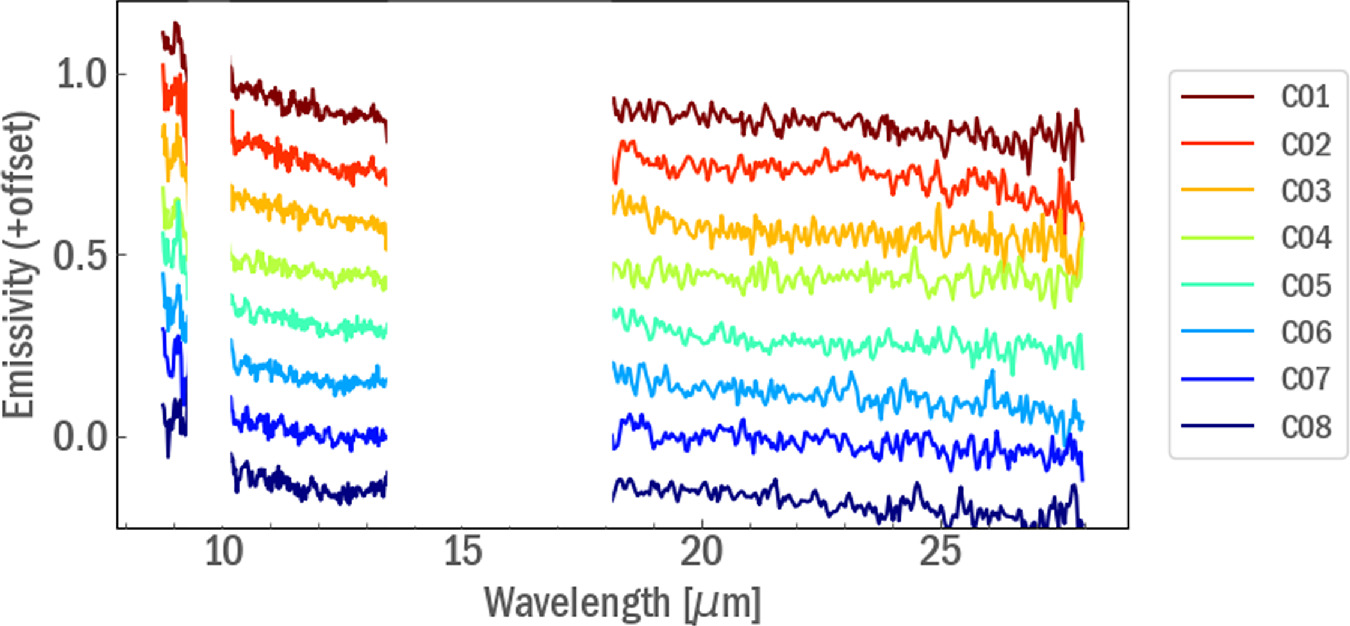
Figure 6. Emissivity spectra resulting from scaling G227 spectra to the flux of the TPM and dividing the TPM out.
Download figure:
Standard image High-resolution image4. Results
Figure 7 shows the average emissivity spectra for all three nights. The shaded box around 9.5 μm is where atmospheric absorption is >80% and the emissivity is unreliable. The gap between 14 and 18 μm is because the FORCAST instrument has no grism overlap between G111 and G227. We took an average of the three nights of emissivity (blue, red, and yellow) to make an average Psyche spectrum (black). The average spectrum shows a peak around 9.05 μm and a generally featureless blue-sloped spectrum. Figure 8 shows the emissivity spectrum of each set, which also have peaks around 9.05 μm and featureless, blue slopes.

Figure 7. Average emissivity for each night (blue, red, and yellow) compared with the average of all nights (black). The location of the potential CF is marked by a gray arrow.
Download figure:
Standard image High-resolution image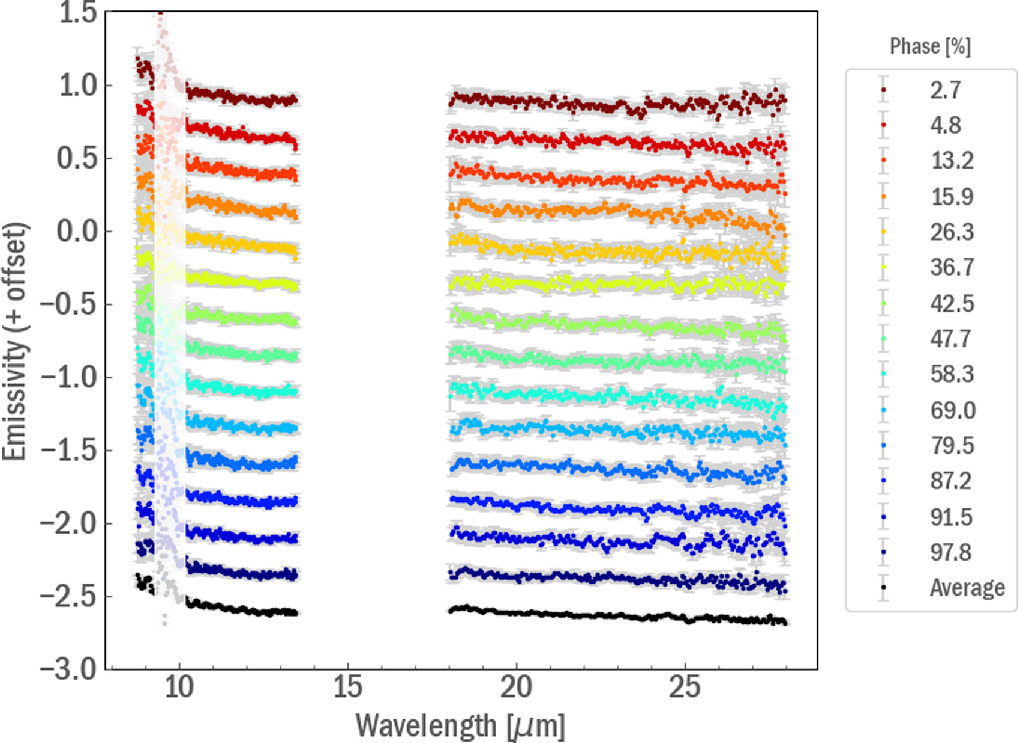
Figure 8. Emissivity of each set with an offset in descending order of rotational phase. The average of all sets is shown in black.
Download figure:
Standard image High-resolution image5. Discussion
5.1. Lack of Spectral Features
The MIR spectral features of silicates are categorized into three types: the Christiansen feature (CF), Reststrahlen bands (RBs), and transparency features (TFs). The CF is an emissivity maximum caused by the transition from surface scattering to volume scattering regimes and is usually found between 7.5 and 10.0 μm for silicates. RBs are troughs in transmittance that occur at frequencies of silicate stretching and bending fundamental vibrational nodes between 8.5 and 12.0 μm and again between 16.5 and 25.0 μm. TFs are emissivity minima that are caused by volume scattering dominating at wavelengths between RBs and only occur on bodies with small (<75 μm) particles (Reddy et al. 2015). In the MIR, FeNi minerals are not observable because metals do not absorb IR radiation (Skulteti et al. 2020).
There is only one feature in our average Psyche emissivity spectrum (Figure 7), which is located at 9.05 μm. This wavelength is consistent with the position of the CF for certain compositions of olivine (Mg# 91.02 ± 0.20; Martin et al. 2022) and pyroxene (Mg# 56.75 ± 1.68; Martin et al. 2023). The size of this feature is ∼10%. In the MIR wavelength range, a >5% spectral contrast for the CF has been noted for only ∼10 main-belt asteroids (Takahashi et al. 2011). Martin et al. (2022, 2023) find that laboratory investigations indicate a systematic change with increasing porosity, with the CF decreasing in spectral contrast until disappearing completely. A high-contrast CF would indicate low porosity, consistent with hypotheses that Psyche is a metal world. Martin et al. (2022, 2023) find that the 10 μm plateau increases in contrast with increasing regolith porosity. The lack of 10 μm plateau in our average spectrum (Figure 7) also indicates a low surface porosity. The lack of spectral features in our spectrum might suggest that this region of Psyche is not infrared active, consistent with the theory that Psyche has a metal or oxide surface. This is also consistent with previously published measurements of high density, smooth surface, and high radar albedo (Shepard et al. 2017). Marchis et al. (2012) present MIR spectra of 28 asteroids observed by Spitzer, including seven M types and X types. These objects appear to display different spectral slopes in the region between 9 and 20 μm, and different from the findings of Psyche in this work. More studies of this class of asteroids at MIR wavelengths would help us better understand the differences among objects in this class.
5.2. Comparison with Previous Observations
Figure 9 shows a comparison of the average Psyche spectrum from this work with the two previous MIR studies of Psyche from Landsman et al. (2018) and Matter et al. (2013) using the InfraRed Spectrograph (IRS) on Spitzer and the Mid-Infrared Interferometric Instrument (MIDI) on the Very Large Telescope Interferometer, respectively. Landsman et al. report a broad plateau centered on 10 μm that they attribute to fine-grained silicates. This 10 μm plateau is absent in the spectra of Matter et al. and our average spectrum from this work. Landsman et al. also report an absorption at 12 μm, but they did not have any hypotheses as to what it was. We do not see a similar absorption at 12 μm in our spectrum or that of Matter et al. The Matter et al. study reported that they did not confidently detect any mineralogical features.

Figure 9. Comparison of the average spectrum found in this work with previously published MIR spectra of Psyche. Gray dotted lines guide the eye to features of interest and are referenced in the text by the numbers 1–5. Shaded area represents error in the spectra. The error for our average spectrum is smaller than the line thickness. Spectra were digitized using WebPlotDigitizer (Marin et al. 2017).
Download figure:
Standard image High-resolution imageFigure 9 shows five vertical dashed lines meant to guide the reader's eye to other potential spectral features. The wiggles in the Landsman et al. spectrum with peaks at #1, #2, and #3 (8.6, 9.1, 9.6 μm) look similar to RBs. In our own spectrum, #1 and #3 have no data; however, #2 lines up perfectly with Landsman et al., suggesting that it could be the same feature. These three peaks and troughs are absent from the Matter et al. spectrum. Line #4 marks emissivity minima in all three spectra, located near 10.3 μm. If real, this could be a TF and could indicate that Psyche has a fine-grained regolith, which is consistent with the value of thermal inertia found by Landsman et al.; however, the relatively shallow depth of this feature means that it could be noise. Finally, line #5 indicates the potential absorption at 12.2 μm that Landsman et al. detected; however, it is missing from both our spectrum and the Matter et al. spectrum, suggesting that it is not a real feature and probably due to noise.
The largest difference between the spectra obtained from these three studies is the shape of the spectra. The Landsman et al. spectrum shows a clear emissivity plateau, the Matter et al. spectrum is generally flat and noisy, and our spectrum has a distinct blue slope. It is unclear why these spectra are so different. It could potentially be due to differences in instrument resolution (Spitzer λ/Δλ = 60, SOFIA λ/Δλ = 200, and MIDI λ/Δλ = 30), differences in thermal model (Landsman et al. used the NEATM, while Matter et al. and this work used a TPM that included shape), or physical changes on Psyche's surface between 2006, 2010, and 2022. More significantly, these differences could be due to the viewing geometry between the three studies (Figure 10). Both Landsman et al. and Matter et al. had viewing geometries dominated by the south pole, while this study observed the north pole. This could suggest a potential hemispherical dichotomy between the northern and southern hemispheres, with metal material dominating the northern hemisphere and a mix of metal and silicate material on the southern hemisphere. It is possible that the fine-grained regolith observed by Landsman et al. was in fact ejected material from a collision, potentially the one that formed Delta. Eros crater was not in view during Landsman et al. but was during Matter et al., which could potentially explain the differences between their spectra. Until more information about the composition of individual surface features is obtained by the Psyche mission, this discrepancy will likely remain an open question.
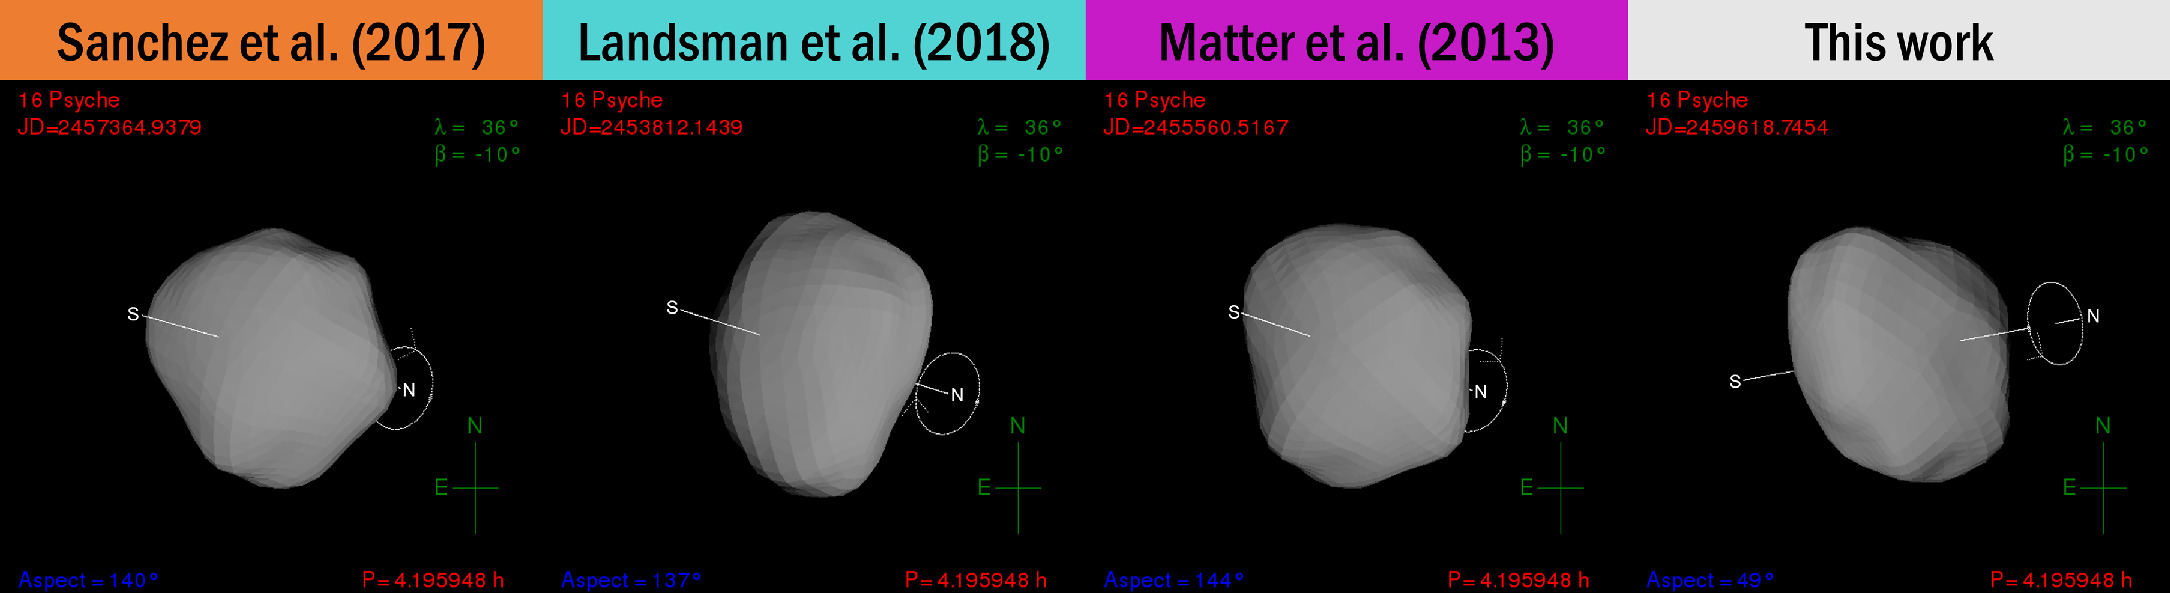
Figure 10. Viewing geometry of Psyche at the time of observation for Matter et al. (2013), Sanchez et al. (2016), Landsman et al. (2018), and Flight 821. The shape model is from Viikinkoski et al. (2018) and was accessed using the Interactive Service for Asteroid Models.
Download figure:
Standard image High-resolution image5.3. Rotational Variability
While parts of the equator rotate in and out of view, the majority of the light observed came from the pole. SOFIA cannot spatially resolve Psyche, so it is not possible to isolate the changes in flux caused by the equator alone. By dividing the average emissivity from the emissivity of each set, we can attempt to isolate the equator by removing what is common among all spectra (Figure 11). The result shows minor variability in the spectral slope of the G111 spectra, which may or may not correlate with features on the object. The general shape of the G227 spectra remains unchanged.
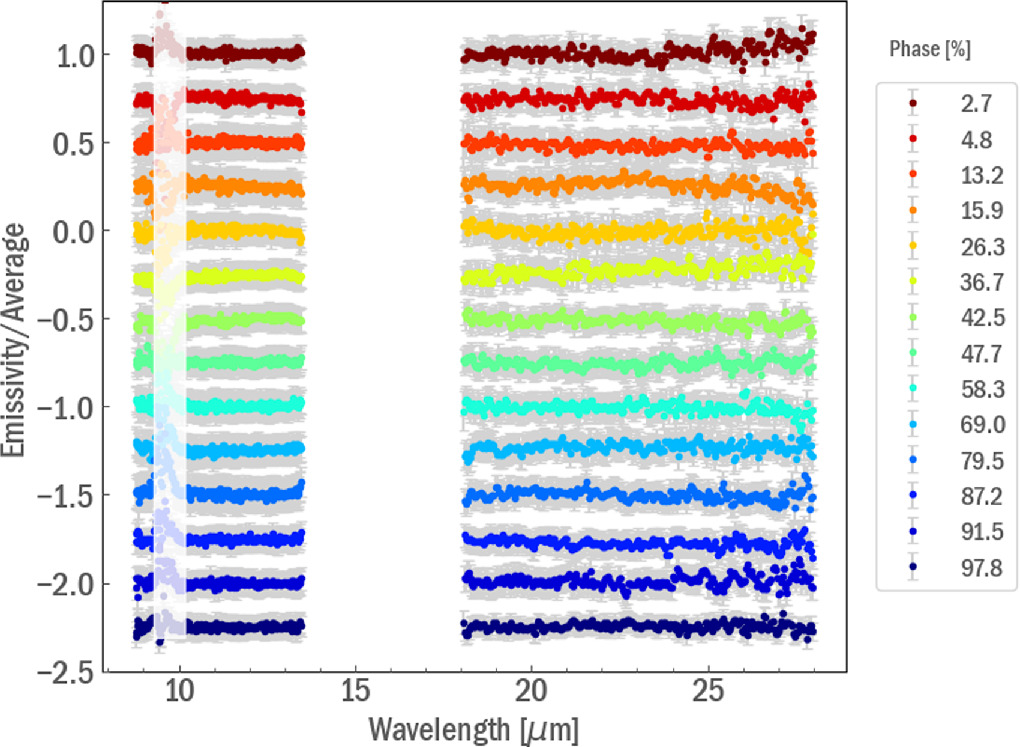
Figure 11. Same as Figure 8, but each emissivity spectrum has been divided by the average spectrum of all nights to isolate differences in rotation.
Download figure:
Standard image High-resolution imageWe compare the spectra of sets with the shape model of Psyche to see whether there are trends correlated with specific surface features (e.g., Figure 1). For each of these features, we compare sets with the feature and sets without the feature to see whether there are significant differences between them. Figure 12 shows that sets with and without these surface features show heterogeneity in their spectra, and the two groupings are indistinguishable from each other. Even within a set of data focused on one surface feature, we see variability; therefore, the variation is not directly tied to the feature itself. This suggests that the minor variability on Psyche's surface is not constrained to surface features but distributed among the entire surface. We note that we did not include Pantheia in Figure 12 because its proximity to Alpha makes the two regions indistinguishable from our vantage point.

Figure 12. Spectra from all sets with (left) and without (right) the equatorial surface features in Figure 1.
Download figure:
Standard image High-resolution image
6. Conclusion
We obtained MIR spectra of Psyche as it completed a full rotation on its axis. We combined the spectra to make an average emissivity spectrum, which had a lack of spectral features. The apparent lack of features in the MIR spectrum may suggest that the region of Psyche observed by SOFIA is not infrared active, which would support the hypothesis that it is a remnant metallic core of a primordial differentiated asteroid. We note, however, that a possible instrumental issue at wavelengths beyond 20 μm may affect the ability to detect such features. Differences between our observations and previous MIR observations may be evidence of a north/south compositional dichotomy, which would be consistent with a collisional history that would have stripped the mantle from an asteroid's core. The upcoming Psyche mission will test this hypothesis by orbiting Psyche with a multispectral imager that will be able to discriminate between Psyche's metallic and silicate constituents.
We combined individual spectra into sets that spanned about 10% of Psyche's rotation and compared them to the average spectrum. There is little heterogeneity in the emissivity spectra until we divide out the average spectrum to isolate differences caused by the equator rotating in and out of view. The minor heterogeneity seen in the spectra of the sets does not appear to correlate with specific surface features. Instead, the composition of Psyche is likely complex at small spatial scales.
Acknowledgments
This work was based on observations made with the NASA/DLR Stratospheric Observatory for Infrared Astronomy (SOFIA). SOFIA is jointly operated by the Universities Space Research Association (USRA), Inc., under NASA contract NNA17BF53C, and the Deutsches SOFIA Institut under DLR contract 50 OK 0901 to the University of Stuttgart. Financial support for A.A. and M.M.M. for this work was provided by NASA through award No. SOF 09-0057 issued by USRA. A.A. would also like to thank the FORCAST instrument team, especially N. Karnath, W. Lim, and J. Radomski, for their work on executing these observations and producing data products.
Footnotes
- 6
- 7
- 8
- 9
- 10