

Abstract
The molar mass and isotopic composition of a new silicon single crystal material (Si28-31Pr11) highly enriched in 28Si has been determined in the context of the x-ray crystal density method used for the realization and dissemination of the SI base units‒the mole and the kilogram. Isotope ratio measurements have been performed using a high-resolution multicollector-inductively coupled plasma mass spectrometer (MC-ICP-MS) with improved technical performance. By applying the Virtual-Element Isotope Dilution Mass Spectrometry method, different crystal areas enclosing the locations of two silicon spheres have been investigated with respect to the magnitude of tentative variations in the molar mass and isotopic composition of the respective samples as a function of their original location in the crystal ingot. In total, 18 subsamples from four different axial and several related radial positions have been characterized. An average molar mass M(Si28-31Pr11) = 27.976 941 464(41) g mol−1 corresponding to a relative combined uncertainty uc,rel(M(Si28-31Pr11)) = 1.4 × 10⁻⁹ was yielded. The average enrichment in 28Si of the crystal is expressed by the mean amount-of-substance fraction x(28Si) = 0.999 985 350(37). Two spheres were cut from the crystal ingot. The average molar masses of the spheres Si28kg_03_a and Si28kg_03_b are: M(Si28kg_03_a) = 27.976 941 467(43) g mol−1 and M(Si28kg_03_b) = 27.976 941 461(44) g mol−1, respectively. The results are discussed using uncertainty budgets according to the Guide to the expression of uncertainty in measurement. A homogeneous distribution of the molar mass throughout the crystal is suggested, qualifying it as a material for a primary standard–a silicon sphere–for the realization and dissemination of the mole and the kilogram. A comparison with enriched silicon crystals that are already available is given.
Export citation and abstract BibTeX RIS

Original content from this work may be used under the terms of the Creative Commons Attribution 4.0 license. Any further distribution of this work must maintain attribution to the author(s) and the title of the work, journal citation and DOI.
1. Introduction
Since the revision of the International System of Units (SI), which came into force on 20 May 2019, decided by the General Conference on Weights and Measures (CGPM) in 2018 at its 26th meeting, several efforts have been undertaken to maintain and further improve the realization and dissemination of the SI base units [1–6]. The SI base unit of the amount of substance‒the mole‒defined via the fixed numerical value of the Avogadro constant NA and the SI unit of the mass‒the kilogram‒defined via the fixed numerical value of the Planck constant h (NA and h each with an associated uncertainty of zero per definition), are currently realized and disseminated via two main complementary experiments, which have now after a period of validation and acceptance the status of primary methods [1, 3]. According to the International Vocabulary of Metrology–Basic and general concepts and associated terms (VIM), a primary reference measurement procedure–short primary method–is a "reference measurement procedure used to obtain a measurement result without relation to a measurement standard for a quantity of the same kind..."[7]. The numerical values of h and NA were released after a least squares adjustment by the CODATA (Committee on Data for Science and Technology) Task Group on Fundamental Constants in 2017 [8]. The data used for this release originated from two experimental approaches: One method for the realization of h and NA is provided by the Kibble balance experiment [9] and a special variant, the joule balance experiment [10], while the second experimental route is called the x-ray crystal density (XRCD) method (also known as the Avogadro-Project or the silicon route) [11, 12]. The realization and dissemination methods of the kilogram and the mole are specified in the respective mise en pratique [13, 14]. The experiments reported in this article refer to the XRCD method, characterizing the isotopic composition and thus the molar mass of the silicon crystal used to produce the respective silicon spheres. The procedure for the determination of the molar mass of silicon highly enriched in 28Si has been evolved over the past 15 years and has been described in several articles by different National Metrology Institutes (NMIs) [15–20]. At present, the traceability of the kilogram to the Planck constant h is deduced from a so-called 'consensus value' [21–23]. The reason for this intermediate use of a 'consensus value' is based on a discrepancy within the data set used for the CODATA adjustment at that time [22]. The 'consensus value' however is currently based in part on interlaboratory comparisons of mass standards, such as silicon spheres. This is one reason for the importance of and need for more, best characterized silicon spheres–each one of a kind–with the quality of a primary standard. The fundamental equation of the XRCD method shows the interrelations of the main quantities yielding NA using a sphere of enriched silicon with a mass of approximately one kg:
with the volume V of the sphere, the sphere mass m, the lattice parameter a, the molar mass M, and eight atoms in the unit cell [11].
For the realization and dissemination of the SI base units the kilogram and the mole it is important to maintain the XRCD primary method using as many spheres made of silicon which is as highly enriched in 28Si as possible thus creating an accessible ensemble of primary standards for the mass and amount-of-substance. From the new characterized crystal reported in this article, two spheres were produced. Therefore, also the molar mass M in equation (1) has to be determined with the lowest associated uncertainty. After the complete characterization of a new sphere according to equation (1), the base unit of the mass is disseminated via
Here, the silicon sphere serves as a primary standard for the mass. The meaning of the quantities in equation (2) are: The speed of light in vacuum c, the Rydberg constant R∞, the Planck constant h, the fine structure constant α, the relative atomic mass of the electron Ar(e), and the relative atomic masses Ar(i Si) of the respective silicon isotopes. Additionally, two important correction terms for the mass must be determined, too: The surface layer mass msur, and the crystal point defect mass mdef.
Analogously, the amount of substance n is disseminated using the relation
(Mu: molar mass constant).
To be able to realize and disseminate the mole and the kilogram by applying the XRCD method, M and x(i Si) of a new crystal (Si28-31Pr11, figure 1) were determined as reported in this article. The crystal was produced in a joint technical project of PTB, some Russian institutes and companies as well as with the Leibniz-Institut für Kristallzüchtung (IKZ) [24].

Figure 1. Photograph of the highly enriched silicon crystal ingot Si28-31Pr11 (length: 52.4 cm, mass: 5682.4 g) for the production of the spheres Si28kg_03_a and Si28kg_03_b.
Download figure:
Standard image High-resolution imageIn order to validate the quality and applicability of the crystal for the purpose of the use of two new silicon spheres, 18 silicon subsamples (msample ≈ 500 mg) were measured and evaluated according to the rules of the 'Guide to the Expression of Uncertainty in Measurement' (GUM) [25]. Four different axial locations of the original crystal ingot were chosen, bracketing the location of the origin of the two silicon spheres. Four to six neighbouring radially oriented samples were measured at each axial position. Thus, the magnitudes of tentative variations (homogeneity) in the molar mass and isotopic composition as a function of the origin in the crystal ingot could be monitored. In no previous study aiming at the determination of the molar mass in the context of the realization and dissemination of the mole and the kilogram that many single subsamples have been characterized. Therefore, this represents the most detailed analysis of the molar mass and isotopic composition in a single crystal ingot of highly enriched silicon which has been performed so far. Table 1 gives an overview of the status of characterization concerning the molar mass of the highly enriched silicon crystals as well as the derived spheres used for the realization and dissemination of the mole and the kilogram. In total, 12 enriched spheres will eventually be available for the XRCD method, ten of them are (as far as possible) characterized with respect to the molar mass.
Table 1. Silicon crystals highly enriched in 28Si and related spheres used for the realization and dissemination of the mole and the kilogram via the XRCD method.
| Crystal | Sphere name | References of M | Year of publication |
|---|---|---|---|
| Si28-10Pr11 | AVO28-S5 | [16] | 2015 |
| AVO28-S8 | |||
| Si28-23Pr11 | Si28kg_01_a | [26] | 2017 |
| Si28kg_01_b | |||
| Si28-24Pr11 | Si28kg_02_a | [27] | 2019 |
| Si28kg_02_b | |||
| Si28-31Pr11 | Si28kg_03_a | This work | 2023 |
| Si28kg_03_b | |||
| Si28-33Pr11 | Si28kg_04_a | [28], not complete | 2020 |
| Si28kg_04_b | |||
| Si28-34Pr11 | Si28kg_05_a | Pending | — |
| Si28kg_05_b |
The results of this work have been compared to the other already characterized crystals according to table 1.
In the context of the ability, maintenance, and improvement of the realization and dissemination of the mole and the kilogram, a central motivation of this work is summarized in the recommendation of the CCM '...encourages all National Metrology Institutes to continue research and further improve experiments in support of primary realizations of the SI unit of mass at appropriate levels of accuracy and at different mass values suitable for current and anticipated applications, ...' [29].
2. Molar mass determination and mass bias correction
The molar mass M of the silicon crystal material and as a side-product its isotopic composition expressed by the amount-of-substance fractions x(i Si) of the respective isotope are accessible via high-resolution isotope ratio mass spectrometry. This technically mature principle still yields the lowest uncertainties associated with M, necessary to realize and disseminate the mole and the kilogram via the XRCD method. Since 2008, the state-of-the-art method for the determination of M has been the Virtual-Element Isotope Dilution Mass Spectrometry (VE-IDMS) method, described in detail elsewhere [15, 16, 30]. Using VE-IDMS, the molar mass of enriched silicon usually yields routinely relative uncertainties urel(M) < 5 × 10⁻⁹. The basic principle of the VE-IDMS method as a primary method in metrology is briefly described: Due to the extreme enrichment in 28Si (x(28Si) > 0.999 9 mol mol−1) no certified reference material exists. Moreover, absolute values of M with urel(M) < 1 × 10⁻⁸ are necessary. The artificially enriched silicon material is treated as a 'virtual' element (VE), consisting of the isotopes 29Si and 30Si, only. The latter is abundant in traces (six up to seven orders of magnitude less abundant than 28Si) in the crystal in the matrix of the dominating 28Si. In this model, the isotopes 29Si and 30Si are also handled as 'impurities' of the enriched silicon crystal (theoretically created as a '100%' 28Si material). In the mass spectrometric experiments, mainly the intensity ratios 30Si/29Si are measured in the enriched sample material x, in the spike material y (Si highly enriched in 30Si), and in a blend bx made of x and y. The molar mass M of the enriched silicon material is obtained via the relation
Here, M(i Si) denote the molar masses of the respective isotopes, myx and mx are the masses of solid components of the sample and spike in the blend bx. Moreover, the mass bias corrected isotope ratios Rx,2 = xx(30Si)/ xx(29Si) (sample), Rbx,2 = xbx(30Si)/xbx(29Si) (blend), Ry,2 = xy(30Si)/xy(29Si) (spike), and Ry,3 = xy(28Si)/xy(29Si) (spike) have to be determined. Generally, measured intensity ratios of isotopes are influenced (disturbed) by several experimental factors like space charge effects in the skimmer region of the MS. This so-called mass bias (isotope fractionation) has to be corrected to obtain the isotope ratios which enter equation (4). The determination of the correction factor K is based on an analytical closed form approach, developed in parallel to the VE-IDMS method [31]. K factors are determined during the measurements to correct the intensity ratios. Gravimetric mixtures are used for the characterization of a material w (silicon with natural isotopic composition) used for the correction which is measured together with the samples and VE-IDMS blends. K is obtained by the ratio of the known isotope ratio of w and its individually measured intensity ratios.
3. Experimental
For the characterization of the molar mass and isotopic composition of the new crystal material ‒ manufactured during the so-called 'kg-3 project' ‒ used as the origin of the spheres Si28kg_03_a (part P) and Si28kg_03_b (part U), 18 samples (each with a mass of approximately 500 mg) were measured. The samples were taken from four main axial positions (parts N, Q, T, and W) bracketing the location of the origins of the spheres (parts P and U, figure 2). The origin of the samples in the crystal ingot (four axial positions and adjacent radial positions) were chosen to screen tentative variations in M and x(i Si). From parts N and Q four parts each were measured (Si28-31Pr11N.1.1- Si28-31Pr11N.1.4 and Si28-31Pr11Q.4.3- Si28-31Pr11Q.4.6); from part T, six samples (Si28-31Pr11T.2.1- Si28-31Pr11T.2.6) and from part W four samples (Si28-31Pr11W.2.1.1- Si28-31Pr11W.2.1.5; not Si28-31Pr11W.2.1.3) were measured. The positions of the samples in the crystal ingot are depicted in figure 2. The exact positions of each axial main location (N, Q, T, W) are shown in figures 3 and 4.

Figure 2. Schematic axial cross section of the silicon crystal ingot Si28-31Pr11 (compare figure 1). Molar mass samples were taken from parts N, Q, T, and W which bracketed the two respective spheres (locations P and U). The samples are indicated as red cubes (each with an approximate mass of 500 mg).
Download figure:
Standard image High-resolution image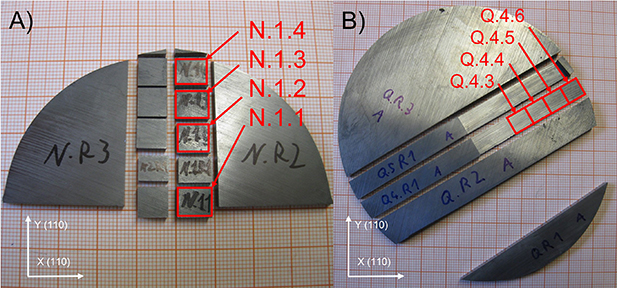
Figure 3. Photographs of parts of the two discs of the crystal parts N and Q of the crystal Si28-31Pr11 containing the respective samples used for the molar mass investigation. The samples are indicated by solid red squares: Si28-31Pr11N.1.1- Si28-31Pr11N.1.4 and Si28-31Pr11Q.4.3- Si28-31Pr11Q.4.6. Note that (A) and (B) have slightly different scales. The lower left insets indicate the orientation of the crystal lattice.
Download figure:
Standard image High-resolution image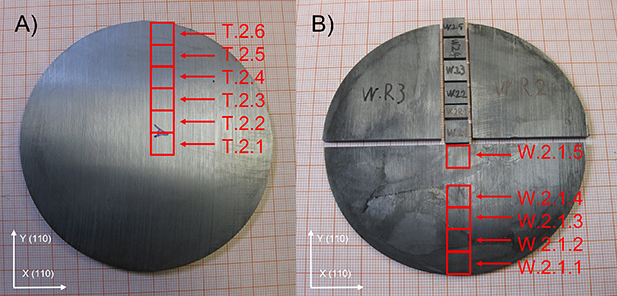
Figure 4. Photographs of the two discs of the crystal parts T and W of the crystal Si28-31Pr11 containing the respective samples used for the molar mass investigation. The samples are indicated by solid red squares: Si28-31Pr11T.2.1- Si28-31Pr11T.2.6 and Si28-31Pr11W.2.1.1- Si28-31Pr11W.2.1.5. The lower left insets indicate the orientation of the crystal lattice.
Download figure:
Standard image High-resolution imagePrior to digestion, the crystal samples were cleaned and etched according to an earlier protocol to remove contaminations (e.g. surface layers) [32]. The labware used for the sample preparation, solution storage, and ICP measurements ‒ completely made of PFA (perfluoroalkoxy alkane) ‒ was also thoroughly cleaned according to a routine given in [32]. The etched samples were weighed and immediately transferred into aqueous tetramethylammonium hydroxide (TMAH) for dissolution at 60 °C. TMAH (w = 0.25 g g−1, Alfa Aesar, Thermo Fisher GmbH, Kandel, Germany) with a purity of 99.999 9% (electronic grade) was used. After dilution with purified water (resistivity = 18 MΩ cm, using a commercial water purification system: Merck Millipore™), the final mass fraction in the sample and in the blank solutions was w(TMAH) = 0.000 6 g g−1. Due to the low abundance of 29Si and 30Si in the samples, a relatively large mass fraction has to be used for the sample: wx(Si) = 4000 μg g−1. For the blend bx and the natural material w used for the K factor determination, wbx(Si) = 3000 μg g−1 and ww(Si) = 4 μg g−1 were prepared.
Blank correction was done by subtracting the blank signals measured prior to the samples from the sample signals. The isotope ratio measurements were performed using an MC-ICP-MS. The detailed operation and machine parameters are listed in table 2.
Table 2. Machine parameters used for MC-ICP-MS measurements.
| Instrument | MC-ICP-MS Neptune XT, Thermo Fisher Scientific GmbH, Bremen, Germany |
| Sample introduction |
|
| Vacuum generation | Oil-free: scroll pump, turbo pumps, jet pump |
| Gas flow rates (Argon) | Cooling: 16 L min−1, auxiliary: 0.8 L min−1 Sample: 1.0 L min−1 |
| Machine settings |
|
| Autosampler | CETAC ASX 110 FR |
| Sequence settings |
|
| Blank measurement | Prior to each sample |
4. Results and discussion
All measurands were determined with the lowest possible associated uncertainty. The mass spectrometric measurements of the 18 samples (see figure 2) were performed under as similar conditions as possible. This was achievable due to the improved technology of the MC-ICP-MS used, equipped with a stabilized voltage source. During the measurement campaign, no other samples than the silicon aliquots and the respective solutions (based on TMAH and DI water) reported in this study were used in the MC-ICP-MS to improve and maintain a pre-conditioned 'passivated, natural-silicon-free' environment in the mass spectrometer and sample introduction area. Each sample was measured six times (six sequences) to guarantee a statistical coherent basis. For the total crystal ingot, an average molar mass M(Si28-31Pr11) = 27.976 941 464(41) g mol−1 was determined. This corresponds to a relative combined uncertainty uc,rel(M(Si28-31Pr11)) = 1.4 × 10⁻⁹. The respective average amount-of-substance fraction of the crystal was x(28Si) = 0.999 985 350(37) mol mol−1 (enrichment > 99. 998 5%). From this crystal two spheres were manufactured: Si28kg_03_a (part P in figure 2) with M(Si28kg_03_a) = 27.976 941 467(43) g mol−1 and Si28kg_03_b (part U in figure 2) with M(Si28kg_03_b) = 27.976 941 461(44) g mol−1. The course of the average molar masses of the samples in the original crystal ingot is shown in figure 5.
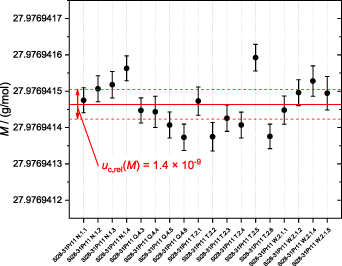
Figure 5. Plot of the average results of the 18 samples measured from the new silicon crystal Si28-31Pr11. An average molar mass M(Si28-31Pr11) = 27.976 941 464(41) g mol−1 was obtained (indicated by the bold red line). Each data point is an average of six independently measured sequences. The respective error bars denote the combined uncertainties (k = 1). The average combined uncertainty (k = 1)–including the contribution of scattering–associated with the mean molar mass is indicated by dashed red lines (upper and lower limits) yielding uc,rel(M(Si28-31Pr11)) = 1.4 × 10⁻⁹.
Download figure:
Standard image High-resolution imageThe individual values of the two spheres for M(Si28kg_03_a) and M(Si28kg_03_b) were determined by using the samples of parts N and Q (Si28kg_03_a) and parts T and W (Si28kg_03_b) bracketing the locations of the spheres.
The error bars of the molar masses of the individual samples in figure 5 are based on the associated combined uncertainties (k = 1) not including the statistical scattering of the 18 sample results. This scattering contribution is enclosed in the final combined uncertainty denoted by the red dashed lines (upper and lower limits) in figure 5. According to the experience with the manufacturing of previous crystal ingots, the course of the molar masses of the samples is suggested to be mainly influenced by sample preparation and measurement effects and not material properties (e.g. possible defects in the crystal structure). The underlying float-zone technique used to prepare the single crystalline ingot was improved in a way to produce almost perfect homogeneous crystals with respect to M [24]. The final combined uncertainty associated with M including the variations of the average sample values is calculated using
with the number of samples N and the experimental standard deviation s [25]. The second term of the square root of equation (5) simply denotes the experimental standard deviation of the mean (often described as the standard deviation of the mean). The influence of scattering results can be estimated when comparing the results of both main components of equation (5):
u(M) = 3.8 × 10⁻⁸ g mol−1 and s(M)/(N)1/2 = 1.5 × 10⁻⁸ g mol−1 which yields uc(M) = 4.1 × 10⁻⁸ g mol−1.
The variations of M of the individual samples are taken into account and compiled using the principle of the degree-of-equivalence di [27, 33]. For a metrological consistency check of the data set of the average molar masses of the 18 subsamples, the differences di between the individual averages of the subsamples Mi and the average molar mass M of the crystal were calculated via

with
The overall course of the di , and their associated expanded uncertainties U(di ) with k = 2, are displayed in figure 6. The consistency criterion requires the individual di to be smaller than its respective uncertainty: This holds for all results (the di of sample Si28-31Pr11T.2.5 is only slightly biased) encompassing the zero line, suggesting that each corresponding value i is consistent with the overall average. The molar mass of a subsample is consistent with the average molar mass of the crystal within the limits of uncertainty in case the error bar encloses the zero line. This concept has been successfully applied in [26, 27].
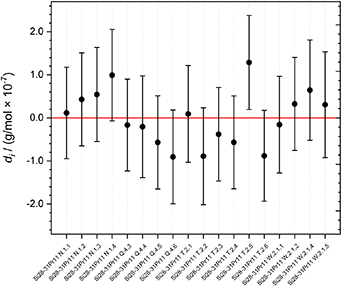
Figure 6. Plot of the degrees of equivalence di of the 18 individual results of the values of the molar masses of the samples of the new silicon crystal Si28-31Pr11. Respective expanded uncertainties (k = 2) associated with the di are shown as error bars. The data encompassing the zero line with their uncertainties are consistent with the average molar mass.
Download figure:
Standard image High-resolution imageBesides the statistical approval of the consistency (homogeneity) of the molar masses of the individual silicon samples, a closer look can be taken at the scattering of an individual sample ‒ e.g. sample Si28-31Pr11N.1.2. Figure 7 shows the distribution of the molar mass results of the six respective measurements (sequences) of sample Si28-31Pr11N.1.2. A clear scattering behaviour of the data can be observed. The error bars denote the uncertainties without scattering contributions associated with M (k = 1). Upper and lower averaged uncertainties without including data scattering are displayed by the red dashed lines. For k = 2, they would include the data points except data point 1. If data scattering is included in the uncertainty calculation using equation (5), the upper and lower uncertainties associated with M are given by the black dotted lines (k = 1). For k = 2, all data points will be included. Since these data are measured from the same physical sample and aliquot (respective solution), the sample material is completely homogeneous and data scattering can be exclusively attributed to experimental reasons (e.g. a decrease of sensitivity, plasma stability, low signal abundance etc.) during the mass spectrometric measurement. Moreover, there is no reason to treat the first data point as an outlier.

Figure 7. Molar mass results of sample Si28-31Pr11N.1.2 during six measurements (sequences). The respective error bars without scattering contribution denote the uncertainties associated with M (k = 1). The average combined uncertainty (k = 1)–without the contribution of scattering–associated with the mean molar mass is indicated by dashed red lines (upper and lower limits) whereas the uncertainty including scattering is displayed by the black dotted lines.
Download figure:
Standard image High-resolution imageThis example is representative of all samples measured in this study, suggesting that material properties do not significantly induce data scattering.
It is therefore most likely that the variations of Mi displayed in figure 5 are not caused by local inhomogeneities due to material properties. Instead, the values of Mi are affected by variations and influences during the different silicon measurements which are very similar but still individual and different (e.g. blank, memory, intensities...). This is also a consequence of the special role of natural silicon, which is abundant almost everywhere and has the ability to disturb the artificial isotopic composition of the enriched silicon material. The individual averaged molar masses of the respective samples together with the exact geometric coordinates of their origin in the crystal ingot are listed in table S1.1 of the supplementary material S1. The individual data and their evaluation are given in the supplementary material S2.
As a main result, it is concluded that the individual molar masses Mi of the crystal are consistent with the respective average molar mass within their limits of uncertainty. Thus, the crystal is capable of being included in the pool of primary standards for the realization and dissemination of the mole and the kilogram via the XRCD method.
Furthermore, the enrichment in 28Si of the crystal Si28-31Pr11 is x(28Si) = 0.999 985 350(37) mol mol−1. The individual results of x(28Si), x(29Si), and x(30Si) of the 18 samples are plotted in figures S1.2–S1.4 in the supplementary material S1.
Table 3 shows an uncertainty budget of a single representative measurement of the molar mass M of sample Si28-31Pr11W.2.1.1 according to the model equation (4). The calculation of the uncertainty budget has been performed using the GUM Workbench Pro™ software (version 2.4.1 392; Metrodata GmbH, Germany) within the guidelines of the GUM [25].
Table 3. Sample Si28-31Pr11W.2.1.1: Uncertainty budget associated with M (representative single measurement).
| Quantity | Unit | Best estimate (value) | Standard uncertainty | Sensitivity coefficient | Index |
|---|---|---|---|---|---|
| Xi | [Xi] | xi | u(xi ) | ci | |
| M(28Si) | g mol−1 | 27.976926534400 | 600 · 10−12 | 1.0 | 0.0% |
| myx | g | 4.920400 · 10−6 | 617 · 10−12 | 3.0 | 0.2% |
| mx | g | 0.062478305 | 569 · 10−9 | −240 · 10−6 | 0.0% |
| M(29Si) | g mol−1 | 28.976494664300 | 600 · 10−12 | 14 · 10−6 | 0.0% |
| M(30Si) | g mol−1 | 29.9737701370 | 23.0 · 10−9 | −170 · 10−9 | 0.0% |
| Ry,3 | mol mol−1 | 1.5855 | 0.0222 | −51 · 10−9 | 0.0% |
| Ry,2 | mol mol−1 | 269.04 | 5.65 | 1.6 · 10−9 | 4.0% |

| V/V | 0.02398 | 1.03 · 10−3 | 30 · 10−6 | 48.8% |

| V/V | 5.35085 | 2.68 · 10−3 | −2.6 · 10−6 | 3.0% |
| Rw,2 | mol mol−1 | 0.66230 | 1.32 · 10−3 | −22 · 10−6 | 43.8% |

| V/V | 0.7013500 | 98.2 · 10−6 | 21 · 10−6 | 0.2% |
| Y | [Y] | y | uc(y) | ||
| M | g mol−1 | 27.9769413801 | 43.8 · 10−9 |
The uncertainty almost completely originates from isotope ratios and/or measured signal intensity ratios. The uncertainties associated with the molar masses of the individual silicon isotopes M(28Si), M(29Si), and M(30Si) range between 10−10–10−11, relatively, and thus do not contribute any longer to u(M) [34]. The largest uncertainty contribution (48.8%) results from the measured intensity ratio  (29Si/30Si) in the sample x, followed by a contribution of 43.8% from Rw,2, the corrected isotope ratio 29Si/30Si in the natural silicon solution used for the in situ K factor measurement during a sequence.
The isotope ratio 29Si/30Si Ry,2 in the silicon material enriched in 30Si has an uncertainty contribution of 4.0% and from the measured signal intensity ratio 29Si/30Si in the blend bx  an uncertainty contribution of only 3.0% results. A relative combined uncertainty (k = 1) of the measurement of the sample Si28-31Pr11W.2.1.1 has been determined to urel(M) = 1.6 × 10⁻⁹.
The uncertainty budgets of x(28Si), x(29Si), and x(30Si) are given in the supplementary material S1. Table 4 summarizes the molar masses, amount-of-substance fractions and associated uncertainties of the five crystals highly enriched in 28Si.
Table 4. Molar masses M and amount-of-substance fractions x(28Si), x(29Si), and x(30Si) of the five silicon crystals highly enriched in 28Si (numbers in brackets denote uncertainties in the last digits (k = 1)); 1preliminary result.
| M | urel (M) | x(28Si) | x(29Si) | x(30Si) | |||
|---|---|---|---|---|---|---|---|
| crystal | g mol−1 | ×10−9 (k = 1) | mol mol−1 | ×10−5 mol mol−1 | ×10−7 mol mol−1 | Year | References |
| Si28-10Pr11 | 27.976 970 12(12) | 4.3 | 0.999 957 52(12) | 4.136(11) | 11.21(14) | 2015 | [16] |
| Si28-23Pr11 | 27.976 426 666(40) | 1.4 | 0.999 984 470(39) | 1.492 1(38) | 6.095(48) | 2017 | [26] |
| Si28-24Pr11 | 27.976 933 787(77) | 2.7 | 0.999 993 104(31) | 0.653 6(28) | 3.600(88) | 2019 | [27] |
| Si28-33Pr11 | 27.976 950 48(16) | 5.7 | 0.999 976 24(19) | 2.357(24) | 1.97(78) | 2020 | [28]1 |
| Si28-31Pr11 | 27.976 941 464(41) | 1.4 | 0.999 985 350(37) | 1.4364(36) | 2.861(88) | 2023 | This work |
The relative uncertainties associated with the molar masses of the silicon crystals highly enriched in 28Si are in the lower 10−9 range except urel(M(Si28-33Pr11)). The comparably higher uncertainty of Si28-33Pr11 of urel(M) = 5.7 × 10⁻⁹ is mainly based on the fact that this very crystal exhibits a much larger ratio 29Si/30Si (> 80)–almost two orders of magnitude and is caused by a depletion of the 30Si isotope in the original crystal.
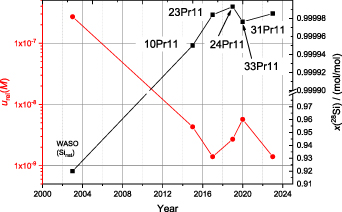
For this reason, some more measurements with technically improved mass spectrometric tools (e.g. 1013 Ω resistors for low abundant isotopes) are under way in the case of the crystal Si28-33Pr11. Figure 8 shows the respective relative uncertainties and the corresponding enrichment (x(28Si)) of each crystal. It suggests a correlation between the amount-of-substance fraction x(28Si) and urel(M) at least to some degree. However, it seems that a strong depletion of 30Si induces a slight increase in urel(M) due to a more difficult measurement.
Figure 8. Overview of the silicon crystals (Si28-xxPr11; xx denotes the respective crystal) highly enriched in 28Si compared to a silicon crystal material with natural isotopic composition (WASO). All five characterized enriched Si crystals exhibit an enrichment in 28Si > 99.99% with variations in the fifth digit. This corresponds to a relative uncertainty associated with the molar mass M in the range of 10−9–10−8. The uncertainty gap between the enriched and natural Si materials already covers two orders of magnitude.
Download figure:
Standard image High-resolution image
5. Conclusions
As a main result, it can be concluded that the new crystal Si28-31Pr11 indicates no significant local variations of the molar mass with respect to the origin of the measured samples within the limits of uncertainty. This can be deduced by a positive consistency check comparing the degrees of equivalence of the respective molar masses. Somewhat biased single results (e.g. sample Si28-31Pr11T.2.5) can be explained by experimentally induced variations. Thus, the two spheres based on this crystal can be used as primary reference standards to realize and disseminate the SI base units‒the mole and the kilogram‒via the XRCD method.
Due to the high enrichment in 28Si, the relative uncertainty associated with the molar mass can be determined in the 10−9 range, routinely. However, a further reduction of the uncertainty is extremely elaborate, complex, and costly. E.g. the complete experiment might be set up in a clean-room laboratory infrastructure. Another item is the expenditure of time when screening the homogeneity of a large crystal using the VE-IDMS principle. This may be shortened in the near future by applying state-of-the art laser ablation techniques which do not require that labour-intensive sample preparation. But it is not yet clear that a relative uncertainty urel(M) < 10−8 is possible when switching to LA-ICP-MS techniques which will initiate future studies on this very topic.
Acknowledgments
The authors would like to thank Daniela Eppers (PTB) for the provision of the crystal samples.
Supplementary data S1 (0.2 MB DOCX)
Supplementary data S2 (3.0 MB XLSX)